 Wanqin Yang1,2
 Runhang Li
 Ying Ying
 Hongxin Wu
- 1College of Grassland Science, Qingdao Agricultural University, Qingdao, China
- 2Quality and Safety Technology Center of Forage, Livesock and Agricultural Product, Institute of Grassland Research of Chinese Academy of Agricultural Sciences, Hohhot, China
Introduction: This study investigated the effects of varying doses of Callicarpa nudiflora water extract (CW) on in vitro rumen fermentation and sheep microbial activity.
Methods: Four rumen-cannulated hybrid sheep were selected to provide mixed rumen fluid, and the powder substrate remained consistent with the diet fed to the sheep. A total of 14 supplementation levels (0–25 g/kg fresh substrate) of CW were designed based on a completely randomized design, including 0, 0.5, 1, 2, 3, 4, 6, 8, 10, 12, 14, 16, 20 and 25 g/kg. Each treatment was replicated in duplicate across three independent batches, resulting in a total of six biological replicates per treatment. The flasks were incubated at 39°C for 24 hours in water with a rotation speed of 80 r/min.
Results: It showed that adding CW significantly affected in vitro rumen fermentation in sheep and displayed a biphasic action: The supplementation levels of 4 g/kg and 6 g/kg showed an improvement in the fermentation status and nitrogen utilization efficiency with the enhanced microbial protein concentration from 1.98 mg/mL (Con) to 2.84 mg/mL (P < 0.001) and the relative abundance of total bacteria from 4.05 (Con) to 5.27 (P < 0.001); When the dose surpassed 14g/kg, the decline in the hemicellulose degradation rate from 63.00% (Con) to 40.24% (P < 0.001), accompanied by an increase in ammonia-nitrogen (NH3−N) concentration from 173.37 mg/L (Con) to 177.46 mg/L (P = 0.020) and total gas production from 154.87 mL/g (Con) to 161.47 mL/g (P =0.007), signaled abnormal alterations in the fermentation process.
Conclusions: The optimal supplementation range in feed formulations was established as 4−6g/kg, showing that CW could serve as a natural rumen modulator for sheep.
1 Introduction
In recent decades, due to the irrational use of antibiotics, concerns about the increasing number of antibiotic-resistant bacteria have prompted efforts to develop antibiotic alternatives (Cheng et al., 2014). Plant secondary metabolites, previously considered antinutritional factors, have been found to have high potential in improving ruminant production performance and rumen fermentation (Greathead, 2003). Plant extracts refer to active ingredients or combinations of ingredients isolated from plants through physical or chemical methods, which can prevent oxidative stress (Mthiyane et al., 2023) and eliminate free radicals (Yagi et al., 2024). Research has shown that plant extracts and their derived secondary metabolites, such as flavonoids, polyphenols, polysaccharides, and alkaloids, exhibit strong antioxidant effects (Gill et al., 2020; Yeshi et al., 2022).
Plant extracts are widely used as green additives in medicine, agriculture, food, and cosmetics (Vijayaraghavan and Ashokkumar, 2017), especially in ruminant animal feed with good application effects. Adding specific plant extracts can regulate rumen microbial community structure and fermentation in sheep (Faniyi et al., 2016), but their effects vary depending on the type, concentration, and target of the extracts. For example, 3% extract of wolfberry branches and leaves (Duan et al., 2024) reduced the NH3–N concentration in the rumen of Hu sheep through bioactive ingredients; 4% Quebracho extract (Vera et al., 2022) significantly increased the ratio of propionic acid to acetic acid and inhibited butyric acid production. However, the dose of CW needs to be precisely controlled: Macleaya cordata extract had no significant effect on dry matter digestion rate of the rumen fermentation with a content of less than 0.21%, while it inhibited the digestion rate with a content of more than 0.31% (Zeng et al., 2021).
Callicarpa nudiflora (Verbenaceae) is a common medicinal plant in China, mainly distributed in Hainan Province, Guangdong Province, and Guangxi Province, as well as in countries such as Malaysia and Singapore (Ma et al., 2022). Callicarpa nudiflora contains various compounds, such as terpenes and flavonoids (Lin et al., 2024), and these active ingredients may be key to exerting medicinal values in anti-inflammatory, antibacterial, antioxidant, and hemostatic effects (Nong et al., 2024). Some studies have indicated that feeding rats with C. nudiflora water extract (CW) can inhibit inflammation and regulate gut microbiota (Nong et al., 2024). Adding CW (150 mg/kg) could improve oral glucose tolerance and lipid metabolism in diabetic rats and reverse the damage in the liver and pancreas caused by diabetes (Ma et al., 2019). By supplementing CW in broiler feed, it was found that 300–700 mg/kg of CW improved the growth performance, immune function, and intestinal health of broiler chickens (Liu et al., 2024a). Zhuang (2018) added different levels of CW to pig feed and found that it did not have adverse effects on animals at up to five times the dose (15.0 g/kg) and that the level of CW at 3.0 g/kg had a better growth-promoting effect on pigs. Although the application research of CW in ruminants is rare, it is speculated that the application of CW in ruminants is feasible due to its similar composition to other plant extracts mentioned above. Given CW’s bioactive compounds’ proven antioxidant and anti-inflammatory effects in monogastric animals, this study hypothesizes that CW could similarly modulate rumen fermentation and microbial health in sheep. According to Ma et al. (2019); Liu et al. (2024a), and Zhuang (2018), the appropriate dose of CW increased proportionally with body weight across species, ranging from 150 mg/kg in rats to 3 g/kg in pigs and chickens. Meanwhile, the microorganisms in the rumen may deplete some CW, suggesting that the dosage of CW in sheep should be higher than that in pig feed (3–15 g/kg).
This study investigated the effects of different CW levels on fermentation parameters through in-vitro rumen fermentation experiments for exploring the appropriate supplementation levels of CW for sheep application, thus offering a promising natural strategy to enhance feed efficiency and animal health in ruminant nutrition.
2 Materials and methods
2.1 Animals and diets
Four rumen-cannulated (cannulated at 6 months of age) hybrid sheep (small-tailed Han sheep × Dorper sheep) were selected to provide mixed rumen fluid for in-vitro rumen fermentation. The sheep were 8 months old, with an average weight of 35.27 ± 4.98 kg. During the experiment, feeding was conducted twice a day at 7:00 and 17:00, and water was withheld for 12 h before collecting rumen fluid.
The diet was fed to all four experimental sheep with no CW treatment through TMR pellets based on the NRC (Council, 2007). The composition and nutritional levels of the diet are presented in Table 1. The substrate for in-vitro fermentation was prepared by grinding the diet, previously fed to experimental sheep, through a 0.45-mm sieve. The freeze-dried powder of the CW, with the secondary metabolites shown in Table 1, was provided by the Fairy Lake Botanical Garden, Shenzhen and the Chinese Academy of Sciences. Dried leaves of C. nudiflora were collected and ground to a fine powder through an 80-mesh sieve, and 1 kg of the powder was boiled in 2 L of water for 1 h, followed by filtration. The residue was then boiled again in 1.5 L of water for 1 h and filtered. The combined filtrates were obtained as the total extract. After freeze-drying, 268 g of the dried extract powder was finally obtained (Li et al., 2022a). Based on previous studies as well as the NRC (Council, 2007) on the application of plant extracts in ruminants and the chemical composition of CW, the supplementation levels in the diet of sheep were inferred. A total of 14 supplementation levels of CW were arranged in a completely randomized design, i.e., 0, 0.5, 1, 2, 3, 4, 6, 8, 10, 12, 14, 16, 20, and 25 g/kg of fresh matter (FM), corresponding to the treatments Con, CW-0.5, CW-1, CW-2, CW-3, CW-4, CW-6, CW-8, CW-10, CW-12, CW-14, CW-16, CW-20, and CW-25, respectively.
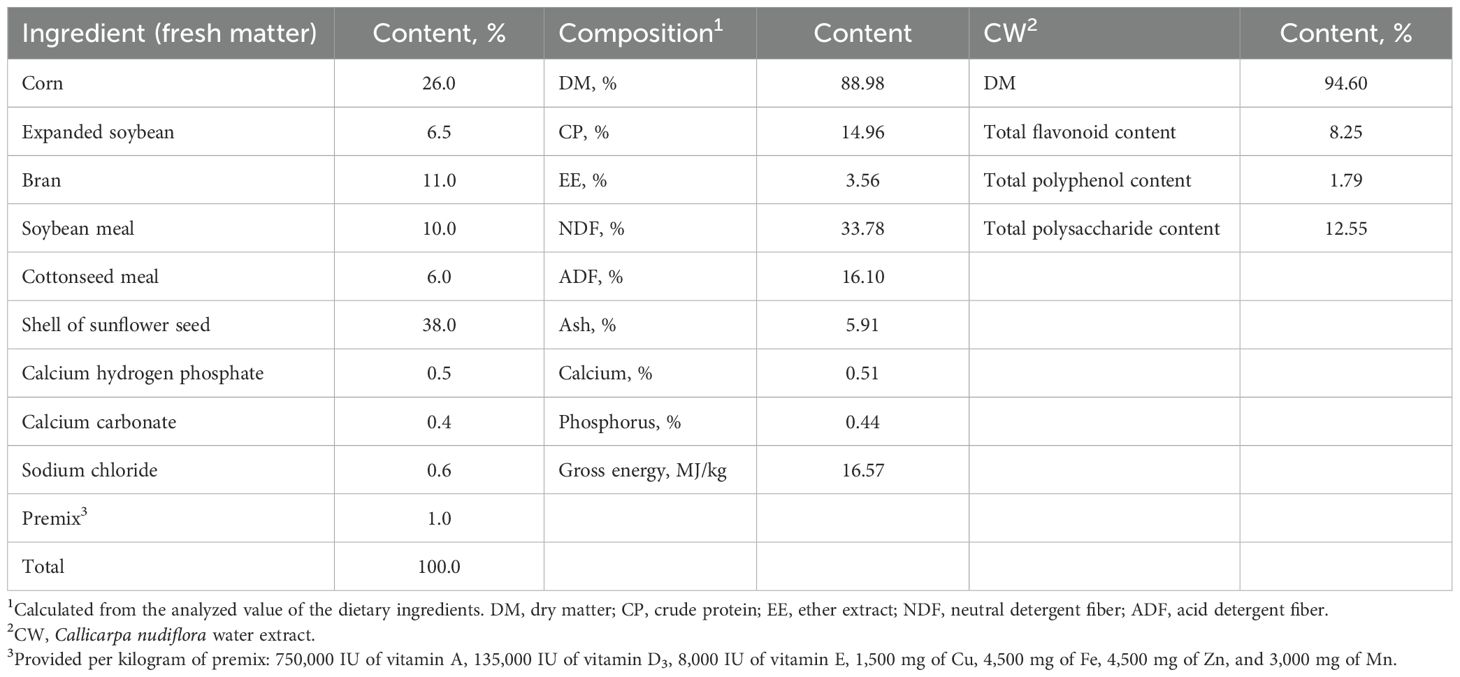
Table 1. Ingredients and nutrient compositions of the diet.
2.2 In-vitro rumen fermentation
The mixed ruminal fluid was collected from the four trial sheep, filtered through a four-layer cheesecloth, and mixed with preheated artificial saliva at a ratio of 2:1 (buffer:ruminal fluid, v:v; Menke et al., 1979). The buffered ruminal fluid (60 mL) was dispensed into prewarmed 100-mL incubation flasks. One gram of each substrate was blended with buffered ruminal fluid in each incubation flask. After introducing CO2, the incubation flasks were incubated at 39°C for 24 h in water with a rotation speed of 80 r/min. During the fermentation period, the pressure inside the incubation flask was measured by inserting a 0.6-mm needle attached to a pressure transducer (model 2000A4, Xian special instrument, China) as described by Nanon et al. (2014). The pressure was measured at 0.5, 1, 2, 4, 6, 12, and 24 h, and the gas was released after each measurement. After 24 h, the incubation flasks were placed on ice to stop the fermentation process. Each treatment was duplicated across three independent batches, yielding six biological replicates per treatment. In addition, two blank controls containing only buffered ruminal fluid were included in each batch. The incubation flask was opened when the fermentation process was stopped, and the pH was measured using a LAQUA twin pH meter (HORIBA, Ltd., Japan). The fermentation fluid was divided into different cryovials and stored at −80°C for chemical and microbiological analyses.
2.3 Microbiological analysis
Microbial genomic DNA was extracted from 220 mg of fermentation fluid using the methods described by Murray and Thompson (1980) and Zhou et al. (1996). The qualified DNA was tested for real-time qPCR using the Applied Biosystems StepOne Real-time PCR System (Thermo Fisher Scientific Inc., Massachusetts, USA) based on the methods of Denman and McSweeney (2006). The designed primers for total bacteria, archaea, and fungi are shown in Table 2. The reaction system (25 μL) consists of SYBR Premix Ex Taq [RR420A, Takara Bio (Dalian) Co., Ltd., Dalian, China] 12.5 μL, forward primer 0.5 μL, reverse primer 0.5 μL, DNA template 2.0 μL, and sterile distilled water 9.5 μL. The reaction conditions were as follows: 95°C for 2 min; 95°C for 5 s; 60°C for 30 s; 40 cycles; 95°C for 15 s; 60°C for 1 min; and 95°C for 15 s. The protozoa were measured under a ×10 magnification microscope (ZEISS Group, Germany) and calculated using an optical microscope according to the method of Antonius et al. (2024).
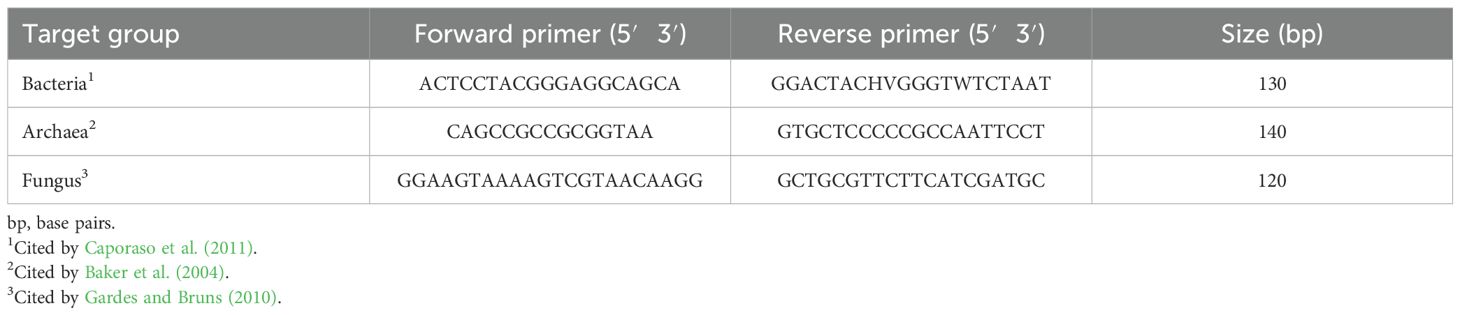
Table 2. The primers for real-time PCR assay.
2.4 Chemical analyses
The fermentation fluid was extracted (3 mL) for the determination of NH3–N (Preston, 1998) using an ultraviolet spectrophotometer [UV-2550, SHIMADZU (China) Co., Ltd.] and of microbial protein (MCP; Makkar et al., 1982) using a microplate reader [SpectraMax PLUS 384, Molecular Devices (Shanghai) Co., Ltd.]. Another 1 mL of fermentation fluid was analyzed for volatile fatty acids (VFAs), including acetic acid (AA), propionic acid (PA), and butyric acid (BA), using gas chromatography (Agilent Technologies 7890A GC System, USA) according to the method described by Castro-Montoya et al. (2012). The chromatographic column is a Nukol column (30 m × 0.25 mm × 0.25 μm, Supelco), and the detector is a flame ionization detector (FID). The left fluid and substrate were dried in a forced-air oven at 60°C for 72 h and placed in sealed containers to analyze the dry matter (DM; Horwitz, 2006). The filter bag technique of ANKOM A200 was adopted to analyze neutral detergent fiber (NDF), acid detergent lignin (ADL), and acid detergent fiber (ADF) according to the methods of van Soest et al. (1991).
2.5 Data analysis
The total gas production (TGP) was calculated based on Equations 1, 2 following the method described by Theodorou et al. (1994). The relative content of bacteria, archaea, and fungi was determined according to Livak and Schmittgen (2002). The content of cellulose and hemicellulose was calculated by the method of van Soest et al. (1991). The degradation rate of nutrients was calculated according to Equation 3. Data were evaluated for normality of residuals by the Shapiro–Wilk test (α = 0.05). Data conforming to normal distribution were subjected to a one-way analysis of variance (ANOVA) followed by Duncan’s multiple comparisons and an orthogonal polynomial using SPSS 25.0 (International Business Machines Corporation, New York, USA), with alphabetical superscripts indicating homogeneous subgroups. Differences were considered statistically significant at P ≤0.05. Principal component analysis (PCA) and correlation analysis (Ding et al., 2022) were conducted using the ggplot package and pheatmap package of R language (Version 4.0).
where GPt is the gas production volume of the sample at time t (mL/g substrate), Pt is the gas production pressure at time t (kPa), V1 is the volume of the incubation flask (mL), V2 is the volume of the buffered ruminal fluid (mL), and M is the weight of the sample (g).
where TGP is the total gas production (mL/g substrate), GPt is the gas production volume of the sample at time t (mL/g), and n is the total number of measurements taken.
where m1 is the weight of a certain nutrient in the substrate before fermentation (g), and m2 is the residual weight of that nutrient in the substrate after 24 h of fermentation (g).
3 Results
3.1 In-vitro rumen fermentation characteristics
The effects of CW on rumen fermentation parameters in vitro are presented in Table 3. Different supplementation levels of CW showed significant dose effects on most fermentation indicators but had no significant effect on pH (ANOVA P = 0.094), indicating that the extract did not significantly alter the rumen acid–base environment. NH3–N and MCP exhibited significant biphasic effects. The concentration of NH3–N showed a U-shaped trend (quadratic P = 0.043) with the increasing dose of CW, with the lowest concentration appearing at CW-6 (162.69 mg/L) and the highest appearing at CW-25 (177.46 mg/L). On the contrary, MCP showed an inverted U-shaped trend (quadratic P < 0.001), with the highest concentration observed in CW-6 (2.84 mg/mL) and the lowest observed in CW-25 (1.06 mg/mL). VFAs continued to decrease with the increasing dose of CW (P < 0.001), reaching the lowest concentration of 87.66 mmol/L in CW-6. There was no significant difference in PA among the groups (ANOVA P = 0.329). However, due to significant changes in AA (with the lowest concentration in CW-4, 49.02 mmol/L, ANOVA P < 0.001), there was a significant increase in A/P (linear P = 0.001), gradually rising from 1.97 (Con) to 2.49 (CW-25). The significant U-shaped trend in BA (quadratic P < 0.001) was similar to the VFAs (quadratic P < 0.001), reaching the lowest concentration (11.02 mmol/L) in CW-8.
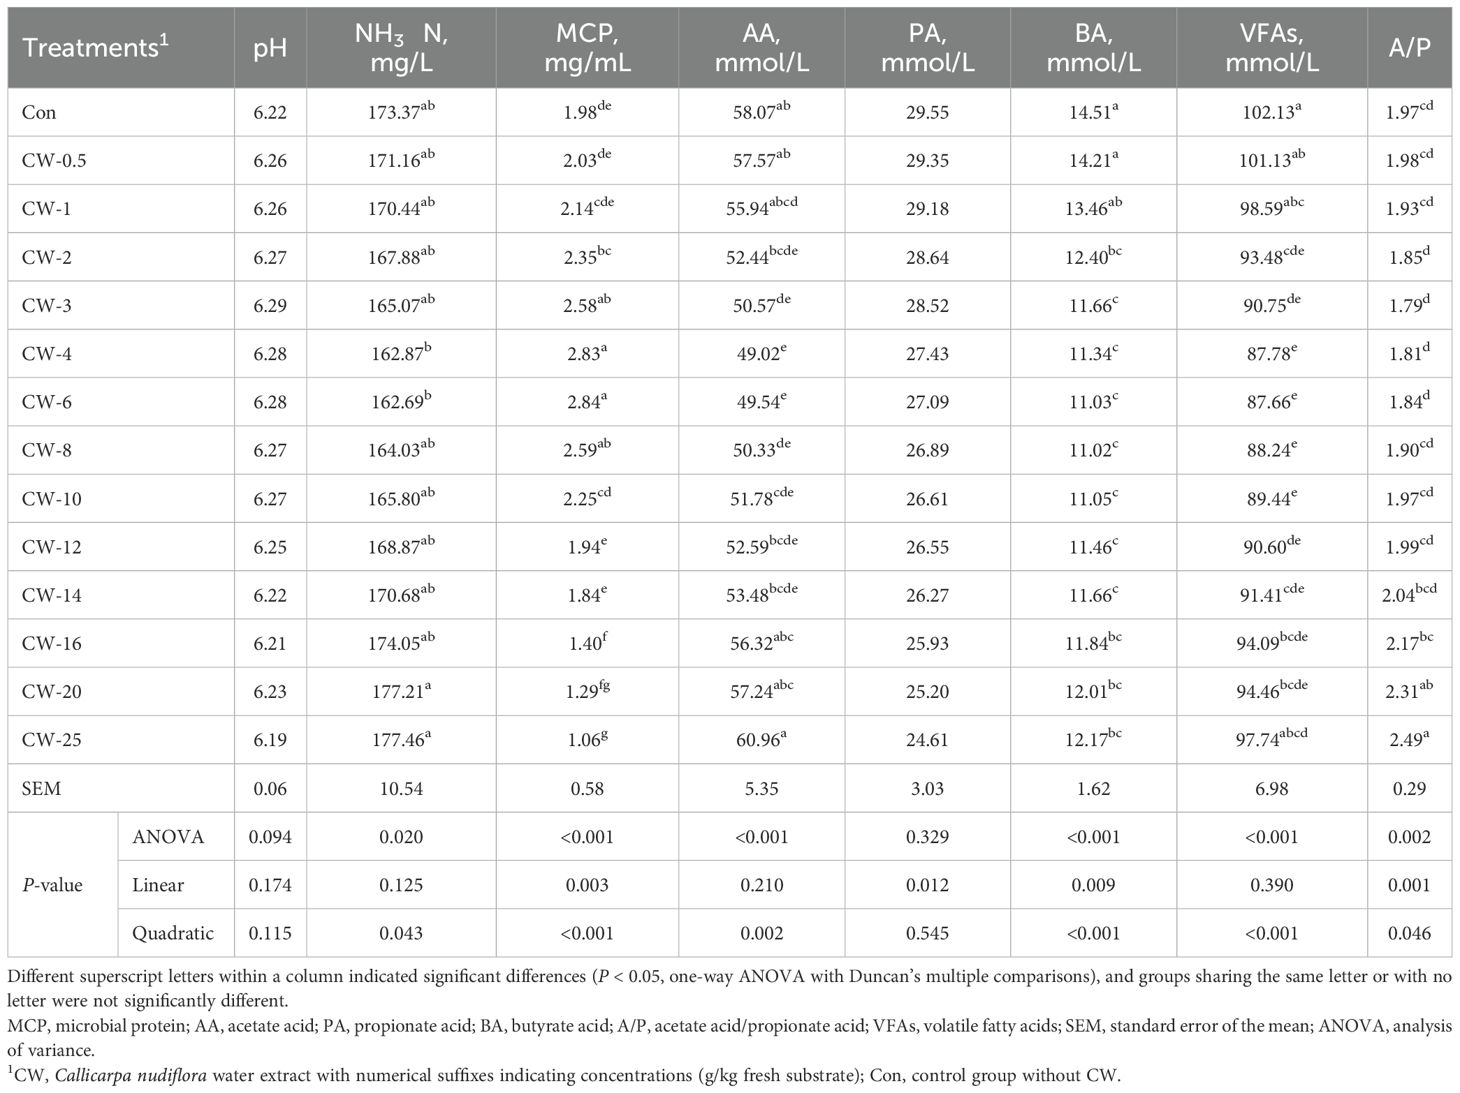
Table 3. Effects of Callicarpa nudiflora water extract on rumen fermentation parameters in vitro.
3.2 Gas production
Table 4 shows the effects of CW on TGP of in-vitro fermentation. At 24 h, TGP showed a U-shaped trend with the increasing dose of CW (quadratic P = 0.008), with the lowest rate appearing at CW-6 (141.68 mL/g) and the highest rate appearing at CW-25 (161.47 mL/g). Analysis of TGP across fermentation phases revealed that treatment groups exhibited significant divergence (ANOVA P < 0.001) during both the initial phase (0–1 h) and terminal phase (12–24 h), whereas no significant differences (ANOVA P > 0.05) were observed in the intermediate phases (1–12 h). In the initial phase (0–1 h), TGP was the lowest at CW-6 (0.5 h: 12.87 mL/g; 1 h: 31.91 mL/g) and the highest at CW-25 (0.5 h: 15.75 mL/g; 1 h: 38.00 mL/g).
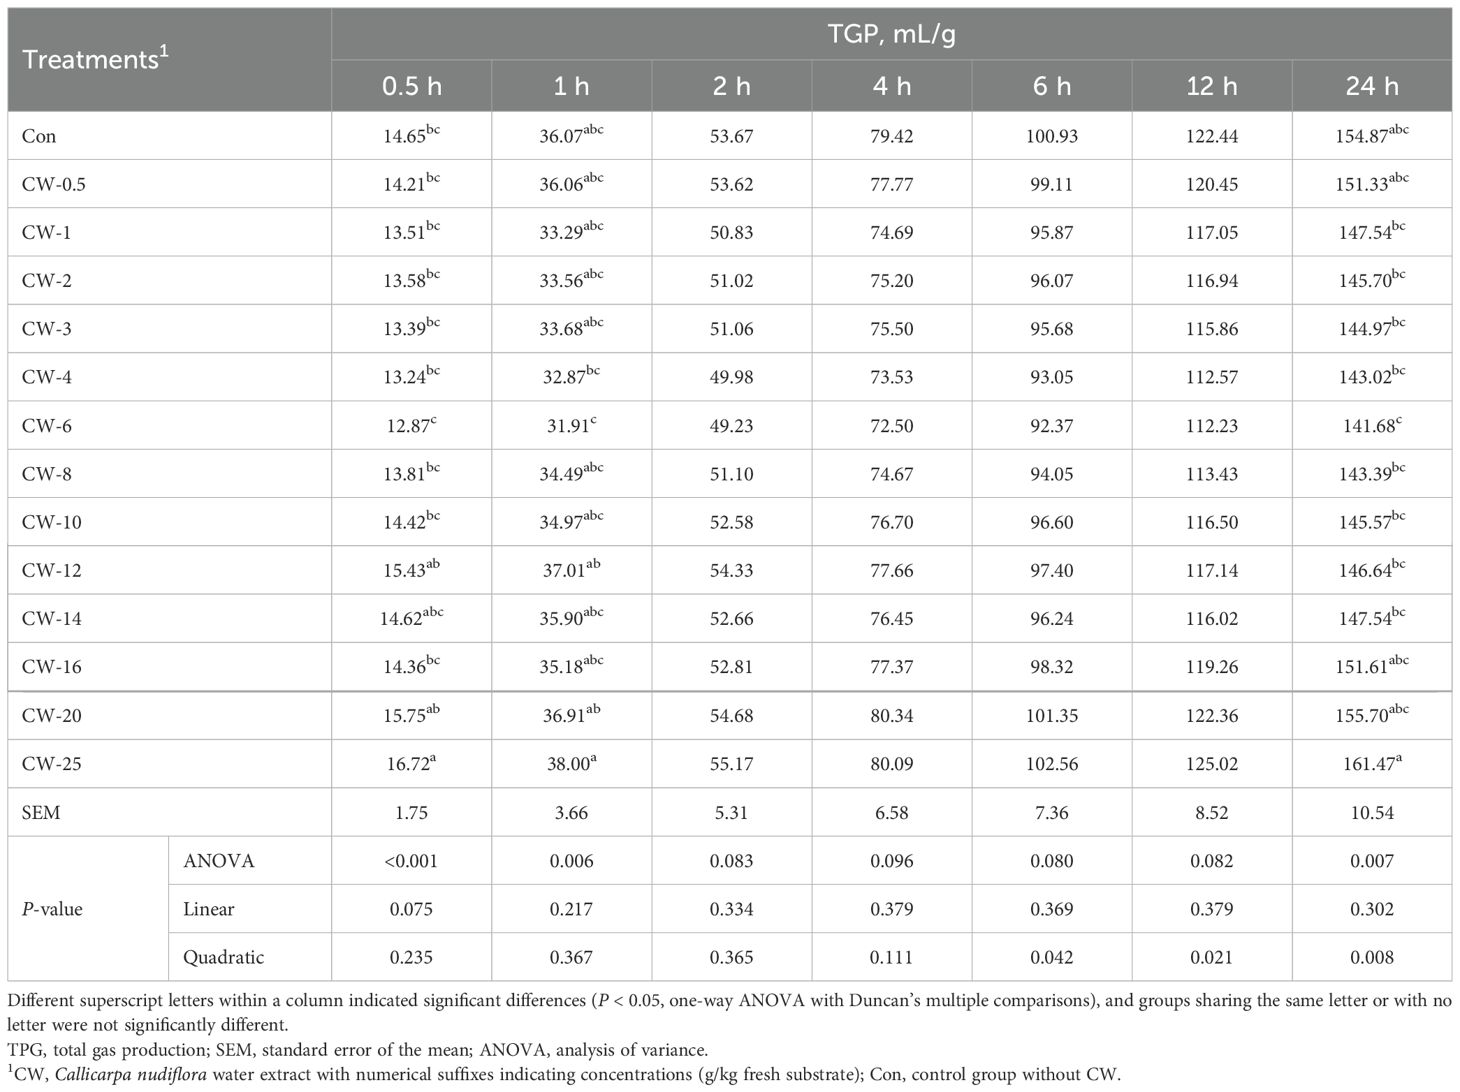
Table 4. Effects of Callicarpa nudiflora water extract on total gas production.
3.3 Nutrition composition degradability in vitro
As shown in Figure 1, supplementing CW showed a significant effect on the degradation rate of nutrients in vitro (ANOVA P < 0.001), which was observed as an inverted U-shaped trend (quadratic P < 0.05). When the dose of CW was less than 4 g/kg, the degradability of all indicators significantly increased with the increasing dose of CW. When the dose of CW was 4 g/kg (CW-4), the degradation rates of DM (71.04%), NDF (56.71%), ADF (39.36%), cellulose (48.38%), and hemicellulose (72.51%) all reached their peak rates. When the dose of CW exceeded 6 g/kg (CW-6), the degradability of all indicators significantly decreased with the increasing dose of CW. When the dose of CW was greater than 14 g/kg (CW-14), all indicators showed a significant decrease, indicating that rumen fermentation might be affected. When the dose of CW was 25 g/kg (CW-25), the degradation rates of DM, NDF, ADF, cellulose, and hemicellulose all reached their lowest rates, which were 49.47%, 36.69%, 30.59%, 35.6%, and 40.24%, respectively. It was worth mentioning that the degradation rate of hemicellulose fluctuated more than the other indicators (from 72.51% to 40.24%).
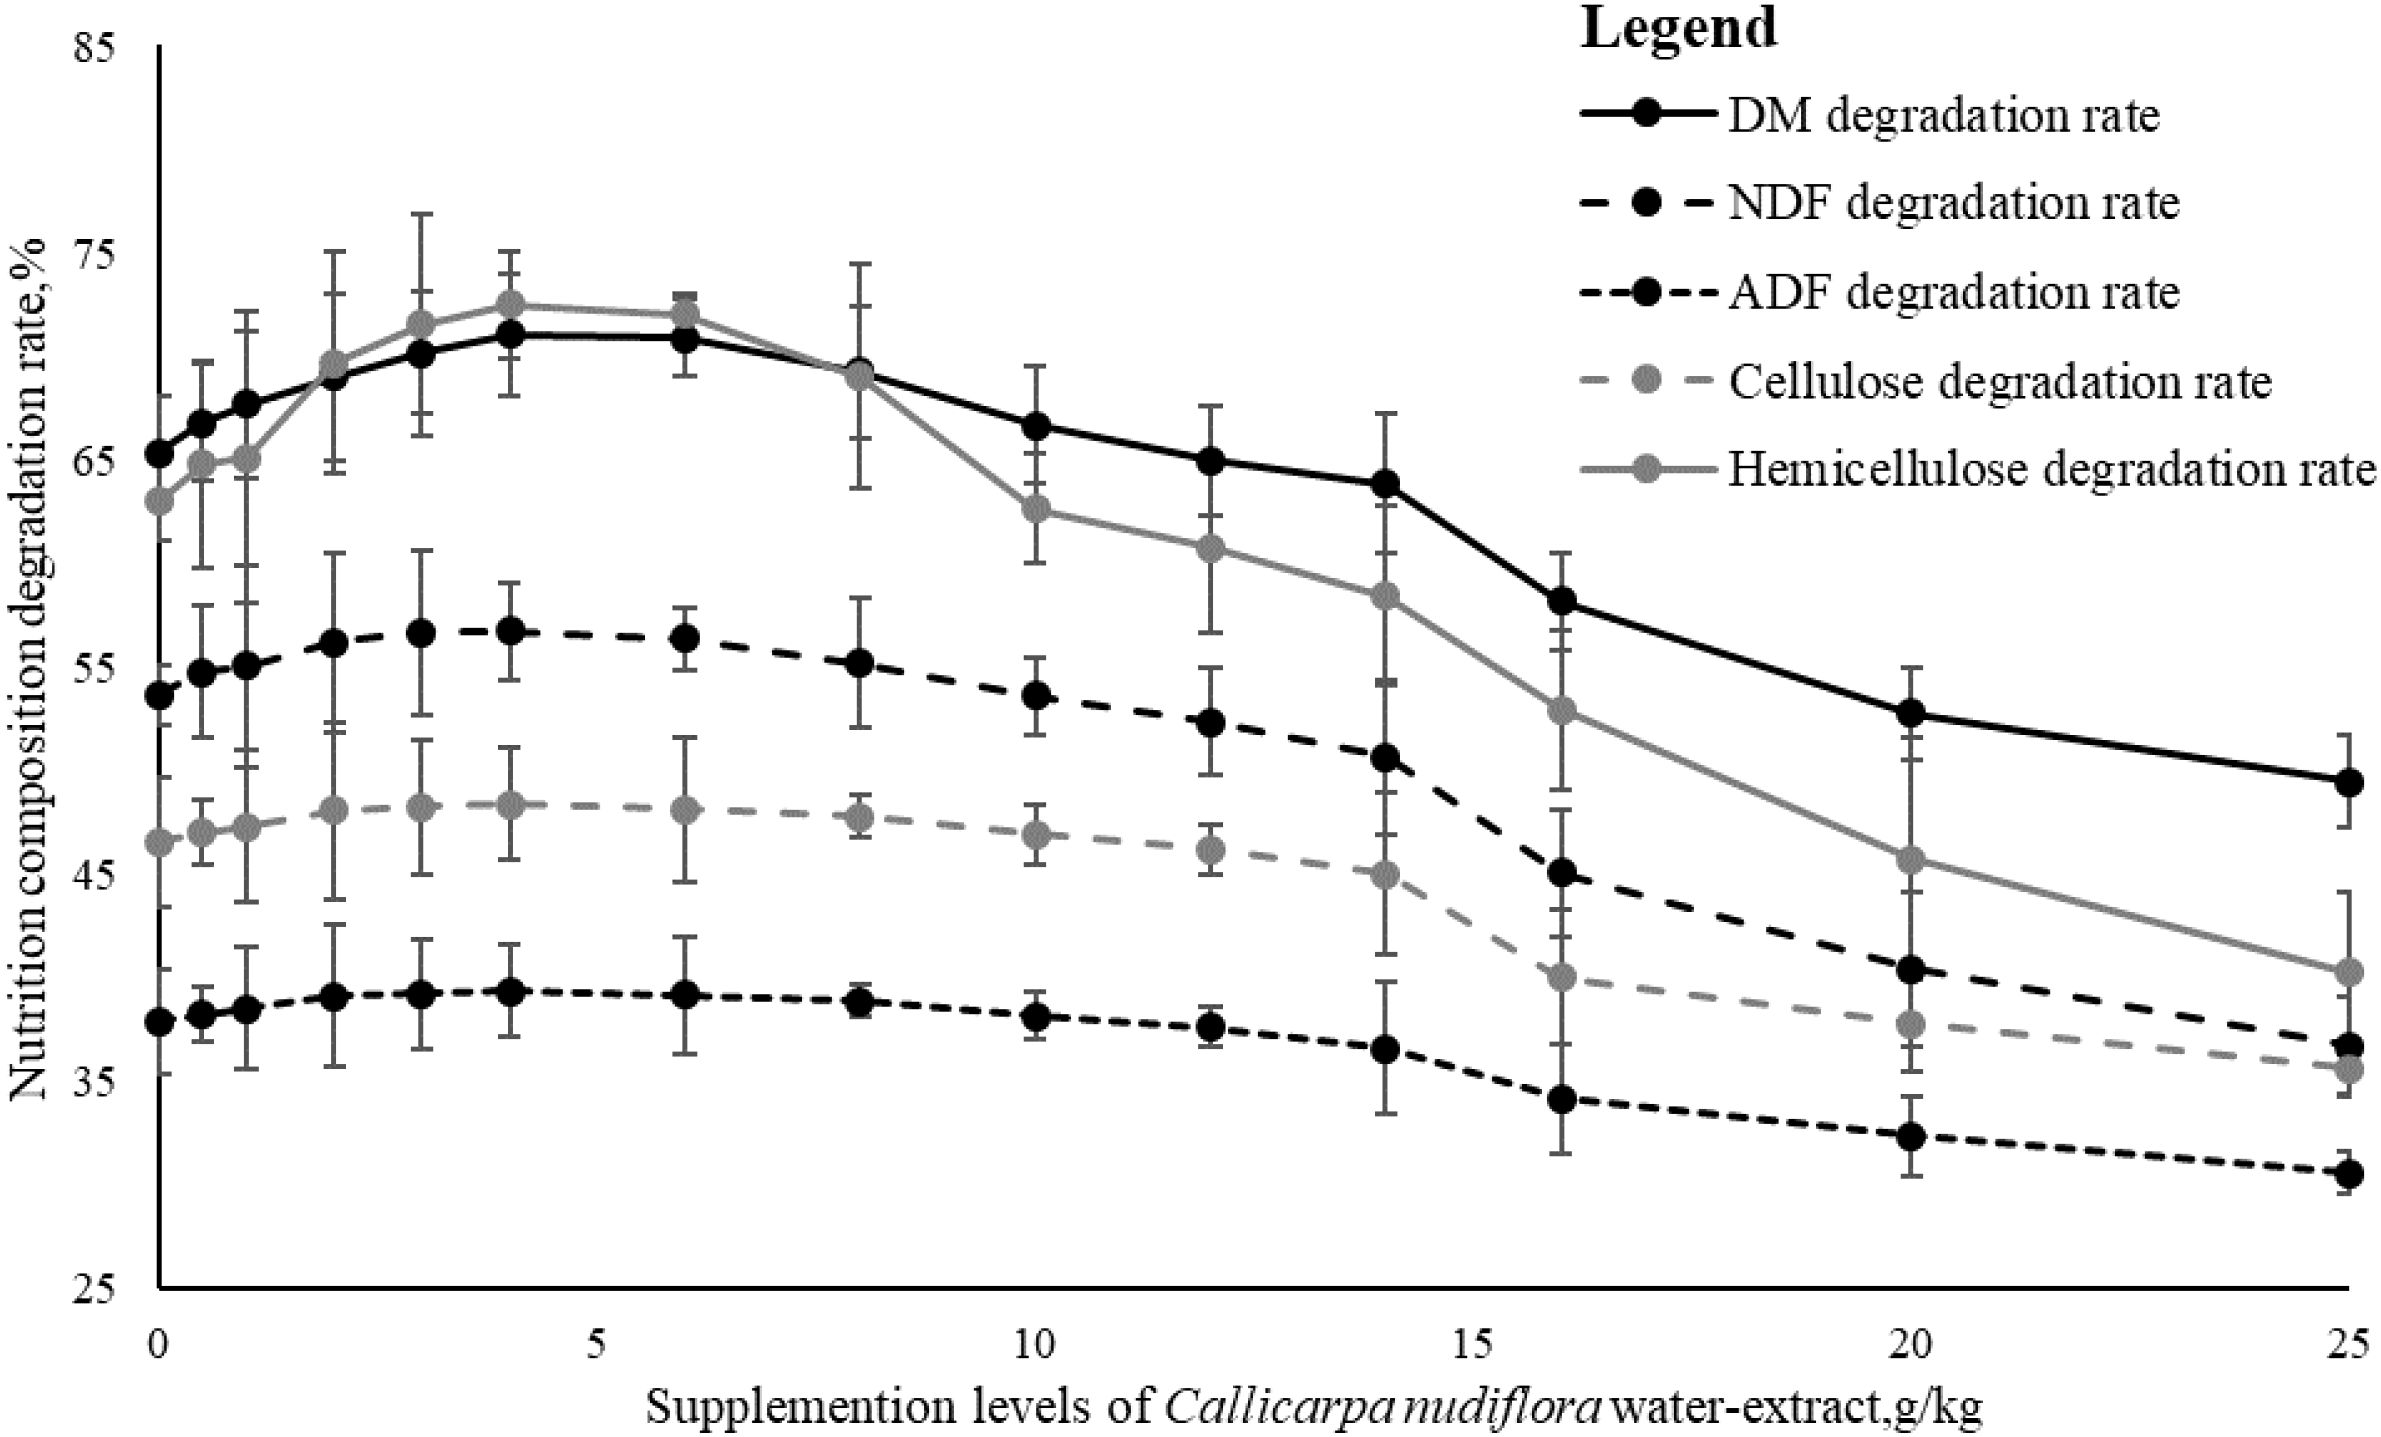
Figure 1. Effects of Callicarpa nudiflora water extract on nutrition composition degradability in vitro. The points on each line, marked with standard error bars, represented the changes in the degradation rate with different levels of C. nudiflora water extract. DM, dry matter; NDF, neutral detergent fiber; ADF, acid detergent fiber.
3.4 Rumen microbial community in vitro
Table 5 shows the effects of CW on microbial communities of in-vitro fermentation. As the CW dose increased, the relative concentration of bacteria showed a U-shaped trend (quadratic P < 0.001). The relative concentration of bacteria gradually increased from Con (4.05) to CW-8 (5.29) but began to decrease after CW-8 and reached its lowest point at CW-25 (3.44). The number of archaea gradually decreased with increasing extract concentration (linear P < 0.001) with the highest in Con (5.15) and the lowest in CW-25 (3.45). The change in fungal quantity was significantly decreasing (linear P = 0.013), and the overall fluctuation was relatively small. It reached its highest value at CW-4 (1.76) and dropped to its lowest value at CW-25 (0.95). The concentration of protozoa showed a U-shaped trend with an increasing dose of CW (ANOVA P = 0.007; quadratic P = 0.052). From 4.97 log CFU/mL (Con) to 4.05 log CFU/mL (CW-6), it gradually recovered and returned to 4.97 log CFU/mL (CW-25).
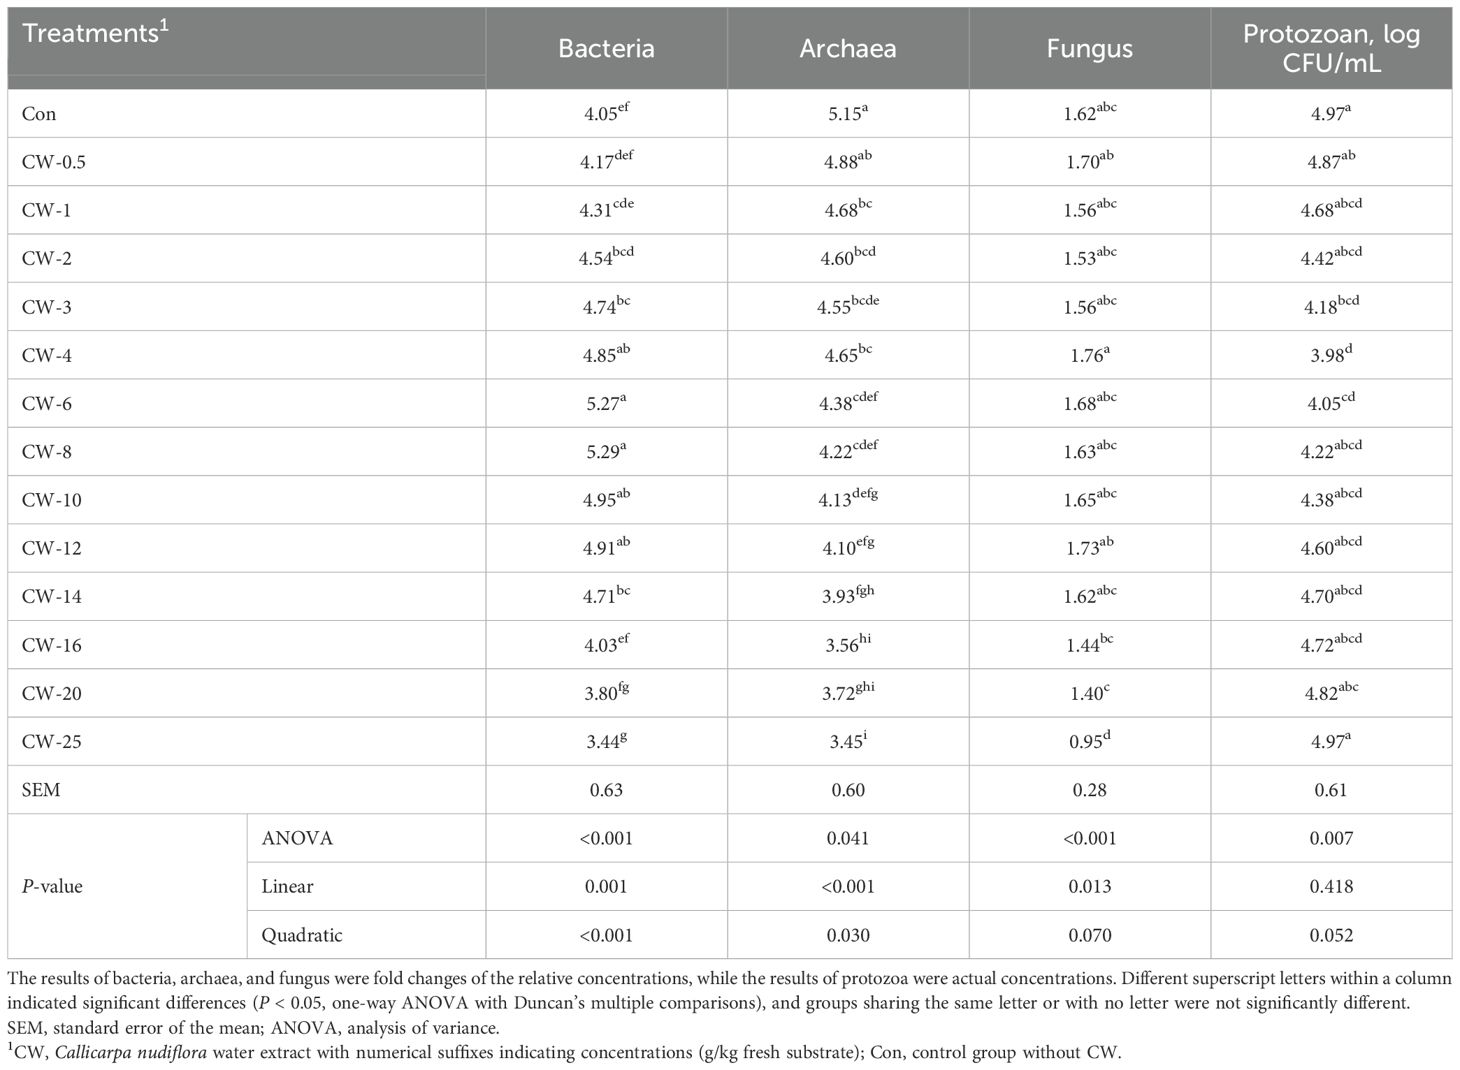
Table 5. Effects of Callicarpa nudiflora water extract on microbial community of in-vitro fermentation.
3.5 PCA and correlation analysis
PCA was performed on rumen fermentation parameters and microbial concentrations in vitro to extract the first two principal components (PC1 and PC2), which explained a cumulative variance of 70.7% (PC1: 55.92%, PC2: 14.78%). The results are shown in Figure 2. The distribution of samples in PC1 and PC2 spaces showed that each treatment group was significantly separated from Con, indicating that CW has a significant impact on rumen fermentation and microbial community structure, while the boundaries of each treatment with the doses of 4–10 g/kg of CW were unclear. In addition, when the dose of CW was less than 10 g/kg, as the dose increased, the sample gradually moved upward along PC2. When the dose of CW was greater than 6 g/kg, the sample gradually moved to the left along the PC1 axis as the dose increased. PCA revealed a dose-dependent segregation pattern: PC2 predominantly captured the gradational response to lower doses of CW (≤6 g/kg). In contrast, PC1 strongly correlated with higher doses of CW (>6 g/kg).
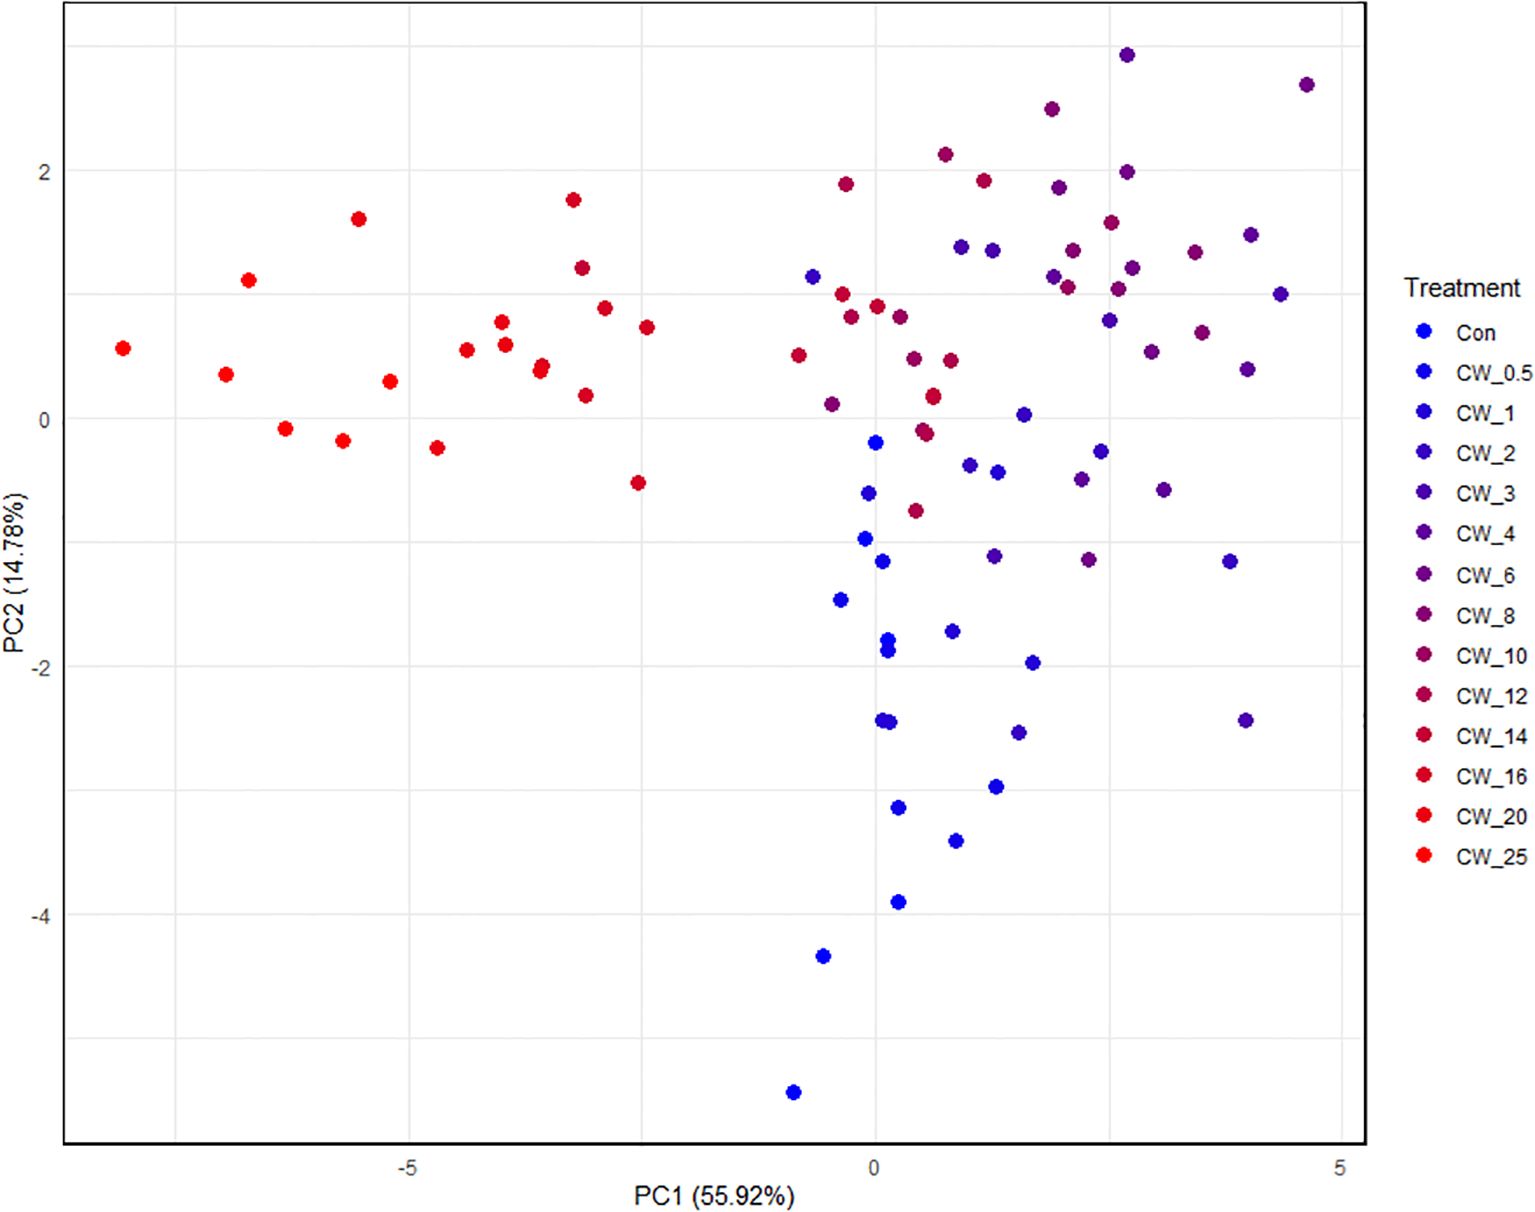
Figure 2. PCA of rumen fermentation with different doses of Callicarpa nudiflora water extract. CW, Callicarpa nudiflora water extract with numerical suffixes indicating concentrations (g/kg fresh substrate); Con, control group without CW. As the supplementation dose of CW increased, the color of the points in each treatment group gradually transitioned from blue to red; drawn using the ggplot package of R language (Version 4.0).
Figure 3 shows the Pearson correlation coefficients among multiple variables, with orange indicating a positive correlation and blue indicating a negative correlation. The darker the color, the stronger the linear relationship between the variables. There was a significant positive correlation between DM degradation rate and NDF degradation rate (R2 = 0.8685) and cellulose degradation rate (R2 = 0.6401), while there was also a significant positive correlation between NDF degradation rate and hemicellulose degradation rate (R2 = 0.7528). MCP was significantly positively correlated with the hemicellulose degradation rate (R2 = 0.6295) and bacterial relative concentration (R2 = 0.8383). The relative concentration of bacteria was significantly and positively correlated with the hemicellulose degradation rate (R2 = 0.7584). NH3–N was negatively correlated with MCP (R2 = −0.5660). MCP was negatively correlated with total gas production (R2 = −0.5583).
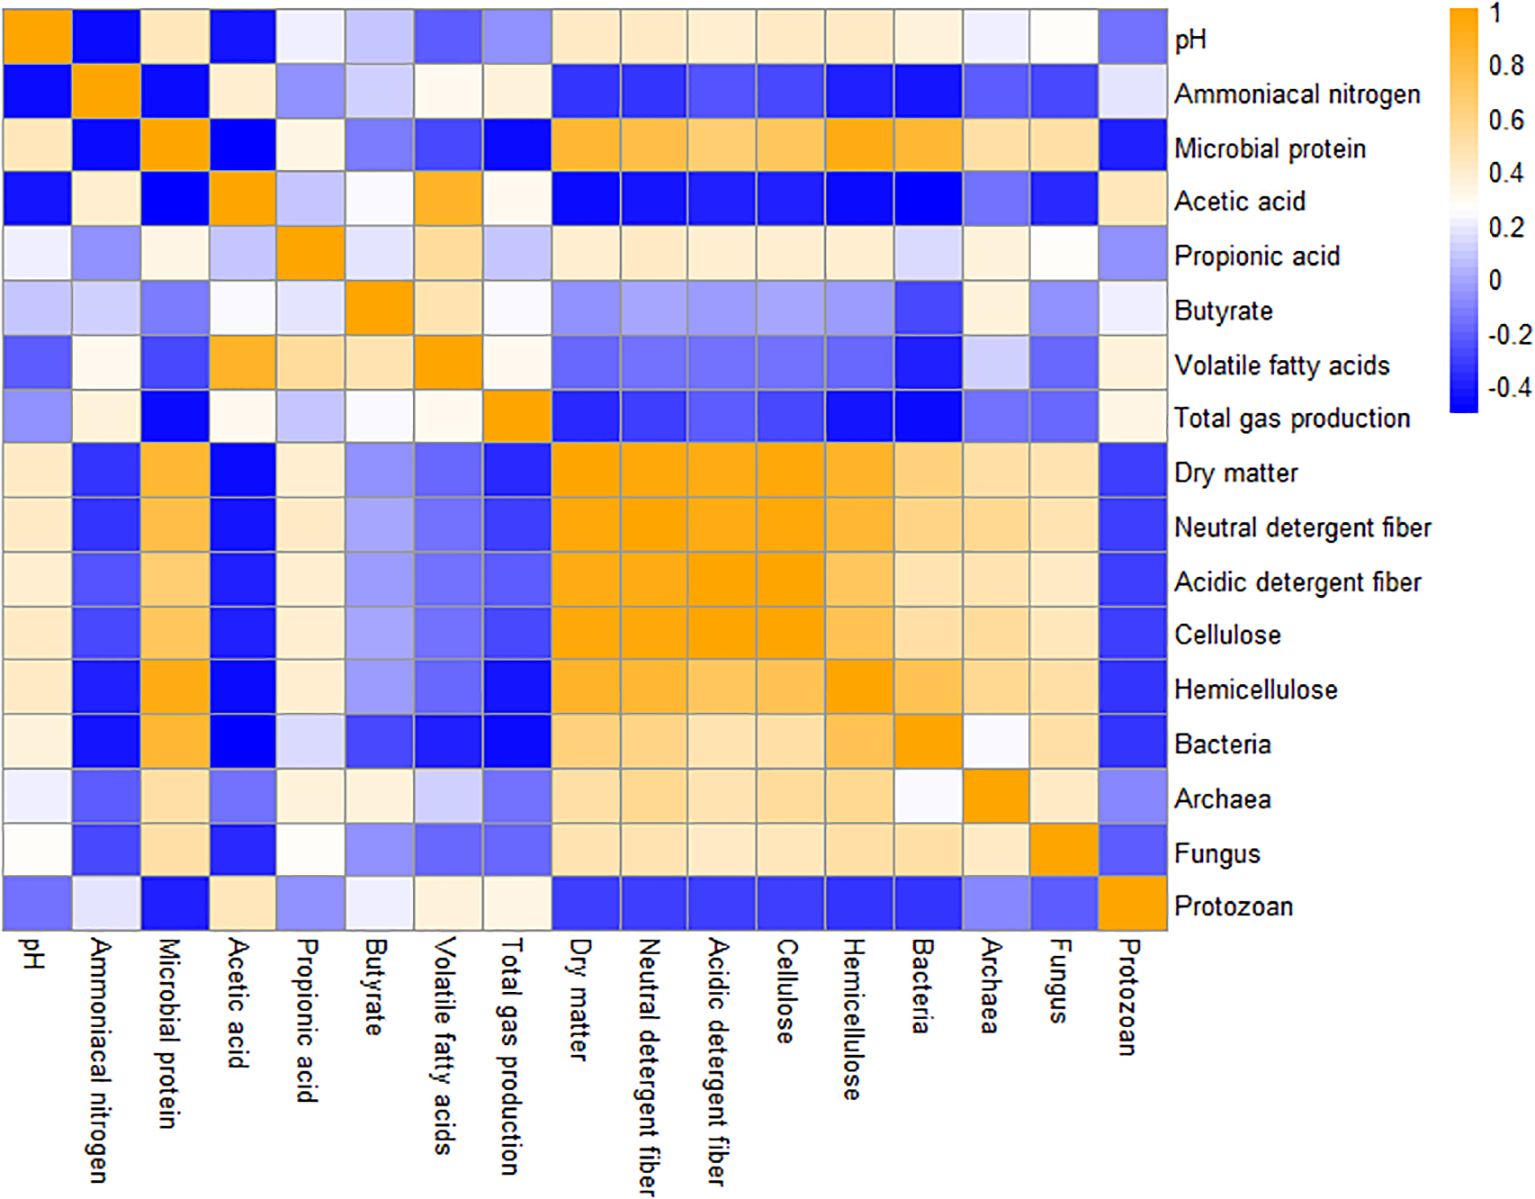
Figure 3. Correlation analysis of rumen fermentation indexes and rumen microbial community. Correlations between double variables were analyzed by the Pearson correlation coefficient. Orange and blue hues denote positive and negative correlations, respectively, and color intensity scales with the absolute value of coefficients; drawn using the pheatmap package of R language (Version 4.0).
4 Discussion
During in-vitro rumen fermentation, different supplementation levels of CW had a significant impact on in-vitro rumen fermentation. The pH was approximately 6.2 in all treatments, with no significant difference compared with Con. The results were at the lowest level of the normal pH range (6.2–7.1) recommended by Ørskov and McDonald (1979). The lower pH in all treatment groups might be mainly related to the feed composition. Higher levels of easily degradable carbohydrates can promote the production of VFAs and CO2, which can cause a rapid decrease in pH (Dijkstra et al., 2012). In this study, the VFAs and TGP were the lowest at 4–6 g/kg CW, and there was a trend of increasing pH value, but it was not significant. NH3–N and MCP are corresponding indicators. NH3–N is an important product of rumen digestion and metabolism and is also the raw material for most microorganisms to synthesize MCP (Zeng et al., 2021). MCP is a product of feed fermentation in the rumen and an important source of protein for ruminants. NH3–N as a nitrogen source and VFAs as an energy source participate in microbial protein synthesis (Abdillah et al., 2024). The concentration of MCP reflects the population of microorganisms and their ability to utilize NH3–N. A previous study has shown that adding curcumin can increase the content of microbial proteins, and 300 mg/kg of curcumin could better convert nitrogen in the diet into microbial proteins (Tian et al., 2023). In this study, NH3–N decreased and then increased with increasing dose of CW, whereas MCP initially increased and then decreased with increasing dose. NH3–N and MCP were inversely proportional to the supplementation level. CW contains a large amount of flavonoids and phenylpropanoids, which usually increase the synthesis of MCP and reduce the production of NH3–N in the rumen (Abdillah et al., 2024). Flavonoids (e.g., tannins) enhanced glutamine synthetase and glutamate dehydrogenase activity in fiber-degrading bacteria, facilitating NH3–N assimilation into microbial amino acids and thereby stimulating microbial protein synthesis (Li et al., 2022b). Phenylpropanoid compounds (e.g., ferulic acid) suppressed deaminase activity in rumen microorganisms, which attenuated amino acid degradation into ammonia. This reduction in NH3–N concentration optimized nitrogen metabolic pathways and improved nitrogen utilization efficiency (de Paula et al., 2016). VFAs in the rumen are the main source of energy for ruminants, and their content and composition can directly reflect rumen metabolic activity (Manlapig et al., 2024). In this study, AA, BA, and VFA levels showed a U-shaped trend with the increased dose of CW, while the change in PA was not significant, resulting in fermentation transforming to the mode of PA when the doses of CW were 4–6 g/kg. AA and BA are natural substrates of archaea, whereas PA is mainly produced in the ruminant stomach through the succinic and acrylic acid pathways. AA and BA, accompanied by the production of H2, can be used by archaea for the formation of CH4, and there is a positive correlation between CH4 and the ratio of AA to PA. Previous studies have shown that adding red seaweed extract, which contains flavonoids and polyphenolic compounds, accelerates PA production and reduces VFA content and CH4 production (Choi et al., 2022). This may explain the significant decrease in TGP when adding CW 4–6 g/kg in this study. Similar conclusions were obtained by adding Macleaya cordata (Zeng et al., 2021) and red osier dogwood (Gomaa et al., 2024) extracts to the feed. An increase in PA reduces H2 levels, thereby reducing the production of methane (Zhang et al., 2020).
The degradation rate of feed reflects the strength of microbial fermentation and decomposition ability. The higher the digestion rate, the better the microbial fermentation and the higher the utilization efficiency of the feed nutrients. In previous studies, the low doses of M. cordata extract (<0.21%) showed no significant change in DM digestion rate, whereas the high doses (>0.31%) resulted in a decrease in DM digestion rate (Zeng et al., 2021). In a study on the supplementation levels of honeysuckle extract to the diet, a high concentration level also resulted in a decreasing trend in the DM degradation rate (Yejun et al., 2019). This study obtained similar results, showing an inverted U-shaped trend of degradation rates for various nutrients. When the dose of CW exceeded 14 g/kg, the degradation rate was lower than that of the Con, indicating that high doses of CW may inhibit microbial fermentation. In addition, the increase in the DM degradation rate may have mainly resulted from the increase in the hemicellulose degradation rate, as demonstrated in the correlation analysis.
The rumen is a unique digestive organ in ruminants that houses a large number of bacteria, fungi, archaea, and protozoa, which play crucial roles in the health and growth performance of the host. Bacteria affect the feed efficiency of ruminants, and fermentation substrates affect the abundance and diversity of rumen microorganisms (Min et al., 2024). The functional components of CW could affect the rumen microbiota (Lemos et al., 2021). In this study, as the dose of CW increased, the relative concentration of bacteria showed an inverted U-shaped trend. This result was consistent with the changes in the nutrient degradation rate and the results of the correlation analysis. Bacteria, as the dominant population, mainly ferment complex carbohydrates such as cellulose and hemicellulose (Liu et al., 2024b). Fungi account for approximately 10%–20% of the total rumen microbiota (Huws et al., 2018). Rumen fungi are closely related to archaea (Li et al., 2024). Fungi offered physical support and contact points for archaea, enabling the latter to metabolize using fungal decomposition products. By decomposing cellulose, fungi supplied carbon sources to archaea, which in turn convert these into methane and volatile fatty acids (Li et al., 2024). As the dose of CW increased in this study, both fungi and archaea showed a decreasing trend, which might be the reason for the decrease in TGP. Protozoa coexisted in a symbiotic relationship with methanogens, while they did not directly synthesize methane, and they could indirectly influence methane production through their interactions with archaea. During their metabolic processes, protozoa fermented carbohydrates and various organic materials to yield hydrogen and formate, serving as crucial precursors for methanogenic archaea to produce methane (Hegarty, 1990). Flavonoids and phenylpropanoid compounds could reduce the number of protozoa in the rumen by 25%–49% (Kim et al., 2013), thereby reducing methane production. However, when the dose of CW exceeded 14 g/kg, both TGP and the number of protozoa showed an upward trend. This may be because the high dose of CW exerts pharmacological effects and leads to abnormal fermentation. High-dose flavonoids impair cellulose degradation efficiency and nitrogen utilization by restructuring the rumen microbial community. This is characterized by a marked increase in Bacteroidetes and Proteobacteria abundance alongside a reduction in Firmicutes and Fibrobacteres abundance. These microbial shifts drove an elevation in VFAs’ concentrations and redirected the pathways of methane production, as well as the allocation of energy within the rumen ecosystem. Simultaneously, flavonoids suppress cellulase activity, thereby diminishing fiber degradation capacity and microbial protein synthesis efficiency (Yu et al., 2023; Rabee et al., 2024).
Overall, based on the analysis of various indicators and PCA, when the dose of CW was low, it promoted fermentation, whereas when the dose was high, it exerted an inhibitory effect on fermentation. However, in-vitro systems lack host-immune feedback and anaerobic stability, and further in-vivo digestion and metabolism experiments are needed.
In conclusion, adding CW significantly affected in-vitro rumen fermentation in sheep and displayed a biphasic action: When the dose was increased to 4–6 g/kg, notable enhancements were observed in the MCP and the relative abundance of total bacteria, suggesting an improvement in the fermentation status and nitrogen utilization efficiency; as the dose continued to escalate, the significance of the difference progressively diminished until a dose of 10 g/kg was reached, at which point there was no notable disparity in the fermentation status compared to the control; when the dose surpassed 14 g/kg, the decline in the nutrient degradation rate, accompanied by an increase in NH3–N and total gas production, signaled abnormal alterations in the fermentation process and microbial balance. The optimal supplementation range was established as 4–6 g/kg, albeit with certain inherent constraints. Future in-vivo research should delve into the impact of the extract on rumen microbiota and metabolites. Additionally, taking into account factors like host immune response and anaerobic stability will further ascertain the appropriate dosage for inclusion.
Data availability statement
The data presented in the study are deposited in the Figshare repository: https://doi.org/10.6084/m9.figshare.29482610.v1.
Ethics statement
The animal study was approved by the Animal Care and Use Committee of the Institute of Grassland Research of Chinese Academy of Agricultural Sciences. The study was conducted in accordance with the local legislation and institutional requirements.
Author contributions
WY: Conceptualization, Project administration, Validation, Visualization, Writing – original draft, Writing – review & editing. RL: Conceptualization, Formal Analysis, Project administration, Software, Visualization, Writing – original draft, Writing – review & editing. WW: Methodology, Supervision, Writing – original draft. KL: Data curation, Formal Analysis, Writing – original draft. YH: Data curation, Formal Analysis, Writing – original draft. YY: Funding acquisition, Methodology, Writing – original draft. YL: Funding acquisition, Validation, Writing – review & editing. HW: Conceptualization, Funding acquisition, Project administration, Validation, Writing – review & editing.
Funding
The author(s) declare that financial support was received for the research and/or publication of this article. This work was supported by the Natural Science Foundation of Inner Mongolia Autonomous Region (2022QN03006, 2023QN03018) and Central Public-interest Scientific Institution Basal Research Fund (1610332022004, 1610332022013).
Acknowledgments
We thank Yang Jia and Yanfei Guo from Baotou Beichen Feed Technology Co., Ltd. for providing the trial animals, diet, and site. We thank the research team of Shixiu Feng from Fairy Lake Botanical Garden, Shenzhen and the Chinese Academy of Sciences for providing the Callicarpa nudiflora water extract. We thank LetPub (www.letpub.com.cn) for its linguistic assistance during the preparation of this manuscript. The instruments and equipments used in this study were from the Laboratory of Quality & Safety Risk Assessment for Forage Products (Hohhot), Ministry of Agriculture and Rural Affairs, P.R. China, and Quality and Safety Technology Center of Forage, Livestock and Agricultural Product, Institute of Grassland Research of CAAS.
Conflict of interest
The authors declare that the research was conducted in the absence of any commercial or financial relationships that could be construed as a potential conflict of interest.
Generative AI statement
The author(s) declare that no Generative AI was used in the creation of this manuscript.
Publisher’s note
All claims expressed in this article are solely those of the authors and do not necessarily represent those of their affiliated organizations, or those of the publisher, the editors and the reviewers. Any product that may be evaluated in this article, or claim that may be made by its manufacturer, is not guaranteed or endorsed by the publisher.
Supplementary material
The Supplementary Material for this article can be found online at: https://www.frontiersin.org/articles/10.3389/fanim.2025.1595795/full#supplementary-material
References
Abdillah A. E., Sarah D., Ardian A. A., Anas M. A., Aprianto M. A., Hanim C., et al. (2024). Effect of nutmeg essential oil (Myristica fragrans Houtt.) on methane production, rumen fermentation, and nutrient digestibility in vitro. Sci. Rep. 14, 3554. doi: 10.1038/s41598-024-52532-3
Antonius A., Pazla R., Masdia Putri E., Ichsan Alma’I M., Budiarti Laconi E., Diapari D., et al. (2024). Effects of herbal plant supplementation on rumen fermentation profiles and protozoan population in vitro. Vet. World 17, 1139. doi: 10.14202/vetworld.2024.1139-1148
Baker G., Smith J., and Cowan D. (2004). Review and re-analysis of domain-specific 16s primers. J. Microbiol. Meth. 55, 541–555. doi: 10.1016/j.mimet.2003.08.009
Caporaso J., Lauber C., Walters W., Berg-Lyons D., Lozupone C., Turnbaugh P., et al. (2011). Global patterns of 16s Rrna diversity at a depth of millions of sequences per sample. PNAS 108, 4516–4522. doi: 10.1073/pnas.1000080107
Castro-Montoya J., De Campeneere S., Van Ranst G., and Fievez V. (2012). Interactions between methane mitigation additives and basal substrates on in vitro methane and VFA production. Anim. Feed Sci. Tech. 176, 47–60. doi: 10.1016/j.anifeedsci.2012.07.007
Cheng G., Hao H., Xie S., Wang X., Dai M., Huang L., et al. (2014). Antibiotic alternatives: the substitution of antibiotics in animal husbandry? Front. Microbiol. 5. doi: 10.3389/fmicb.2014.00217
Choi Y., Lee S. J., Kim H. S., Eom J. S., Jo S. U., Guan L. L., et al. (2022). Red seaweed extracts reduce methane production by altering rumen fermentation and microbial composition in vitro. Front. Vet. Sci. 9. doi: 10.3389/fvets.2022.985824
Denman S. E. and McSweeney C. S. (2006). Development of a real-time PCR assay for monitoring anaerobic fungal and cellulolytic bacterial populations within the rumen. FEMS Microbiol. Ecol. 58, 572–582. doi: 10.1111/j.1574-6941.2006.00190.x
de Paula E., Samensari R., MaChado E., Pereira L., Maia F., Yoshimura E., et al. (2016). Effects of phenolic compounds on ruminal protozoa population, ruminal fermentation, and digestion in water buffaloes. Livest. Sci. 185, 136–141. doi: 10.1016/j.livsci.2016.01.021
Dijkstra J., Ellis J. L., Kebreab E., Strathe A. B., López S., France J., et al. (2012). Ruminal pH regulation and nutritional consequences of low pH. Anim. Feed Sci. Tech. 172, 22–33. doi: 10.1016/j.anifeedsci.2011.12.005
Ding X., Jin F., Xu J., Zhang S., Chen D., Hu B., et al. (2022). The impact of aquaculture system on the microbiome and gut metabolome of juvenile Chinese softshell turtle (Pelodiscus sinensis). iMeta 1, 24. doi: 10.1002/imt2.17
Duan P., Rehemujiang H., Zhang L., Lu M., Li C., Hu L., et al. (2024). Lycium barbarum (wolfberry) branches and leaves enhance the growth performance and improve the rumen microbiota in Hu sheep. Animals 14, 1610. doi: 10.3390/ani14111610
Faniyi T. O., Adewumi M., Ênio R., Prates E. R., Ayansina S., and Ayangbenro A. S. (2016). Publicações em medicina veterinária e zootecni a effect of herbs and spices (plant extracts) on rumen microbial activities: a review. Pubvet 10, 477–486. doi: 10.22256/pubvet.v10n6.477-486
Gardes M. and Bruns T. (2010). Its primers with enhanced specificity for basidiomycetes–application to the identification of mycorrhizae and rusts. Mol. Ecol. 2, 113–118. doi: 10.1111/j.1365-294X.1993.tb00005.x
Gill M. S. A., Saleem H., and Ahemad N. (2020). Plant extracts and their secondary metabolites as modulators of kinases. Curr. Top. Med. Chem. 20, 1093–1104. doi: 10.2174/1568026620666200224100219
Gomaa W. M. S., Saleem A. M., McGeough E. J., Ominski K., Chen L. Y., and Yang W. Z. (2024). Effect of red osier dogwood extract on in vitro gas production, dry matter digestibility, and fermentation characteristics of forage-based diet or grain-based diet. Heliyon 10, e27991. doi: 10.1016/j.heliyon.2024.e27991
Greathead H. (2003). Plants and plant extracts for improving animal productivity. P. Nutr. Soc 62, 279–290. doi: 10.1079/PNS2002197
Hegarty R. S. (1990). Reducing rumen methane emissions through elimination of rumen protozoa. Crop Pasture Sci. 50, 1321–1328. doi: 10.1071/AR99008
Horwitz W. (2006). Official Methods of Analysis of AOAC International (Maryland: AOAC International Publishing).
Huws S. A., Creevey C. J., Oyama L. B., Mizrahi I., Denman S. E., Popova M., et al. (2018). Addressing global ruminant agricultural challenges through understanding the rumen microbiome: past, present, and future. Front. Microbiol. 9. doi: 10.3389/fmicb.2018.02161
Kim E., Min K., Kim C., Moon Y., Kim S., and Lee C. (2013). The effect of plant extracts on in-vitro ruminal fermentation, methanogenesis and methane-related microbes in the rumen. Asian-Australas. J. Anim. Sci. 26 (4), 517–522. doi: 10.5713/ajas.2012.12480
Lemos B. J. M., Souza F. M., Arnhold E., Conceição E. C., Couto V. R. M., and Fernandes J. J. R. (2021). Effects of plant extracts from Stryphnodendron adstringens (mart.) coville, Lafoensia pacari a. st.-hil, copaifera spp., and Pterodon emarginatus Vogel on in vitro rumen fermentation. J. Anim. Physiol. An. N. 105, 639–652. doi: 10.1111/jpn.13502
Li L., Bao B., Chai X., Chen X., Su X., Feng S., et al. (2022a). The anti-inflammatory effect of callicarpa nudiflora extract on h. pylori-infected ges-1 cells through the inhibition of Ros/Nlrp3/Caspase-1/Il-1β signaling axis. Can. J. Infect. Dis. Med., 5469236. doi: 10.1155/2022/5469236
Li K., Du H., Guo W., Na M., and Na R. (2024). Alfalfa supplementation timing changes the rumen archaeal and fungal community composition and colonization in pre-weaning lambs. Front. Microbiol. 15. doi: 10.3389/fmicb.2024.1380322
Li M., Hassan F., Peng L., Xie H., Liang X., Huang J., et al. (2022b). Mulberry flavonoids modulate rumen bacteria to alter fermentation kinetics in water buffalo. PeerJ 14, e14309. doi: 10.7717/peerj.14309
Lin X., Chen G., Jiang Z., Xing Y., and Liu Y. (2024). New terpenoids from Callicarpa nudiflora and their chemotaxonomic significance. Biochem. Syst. Ecol. 116, 104872. doi: 10.1016/j.bse.2024.104872
Liu M., Huang G., Lin Y., Huang Y., Xuan Z., Lun J., et al. (2024a). Effects of dietary Callicarpa nudiflora aqueous extract supplementation on growth performance, growth hormone, antioxidant and immune function, and intestinal health of broilers. Antioxidants 13, 572. doi: 10.3390/antiox13050572
Liu S., Zheng N., Wang J., and Zhao S. (2024b). Relationships among bacterial cell size, diversity, and taxonomy in rumen. Front. Microbiol. 15. doi: 10.3389/fmicb.2024.1376994
Livak K. J. and Schmittgen T. D. (2002). Analysis of relative gene expression data using real-time quantitative PCR. Methods 25, 402–408. doi: 10.1006/meth.2001.1262
Ma Y., Guo L., Hou W., Zhuo J., Zhao M., and Liu Y. (2022). Phytochemistry, bioactivities, and future prospects of Callicarpa nudiflora: A review. Medicinal Plant Biol. 1, 1–14. doi: 10.48130/MPB-2022-0005
Ma W., Ma L., Yi B., Zhang M., Feng S., and Tian L. (2019). Antidiabetic activity of Callicarpa nudiflora extract in type 2 diabetic rats via activation of the ampk-acc pathway. Asian Pac. J. Trop. Bio. 9, 456–466. doi: 10.4103/2221-1691.270978
Makkar H. P. S., Sharma O. P., Dawra R. K., and Negi S. S. (1982). Simple determination of microbial protein in rumen liquor. J. Dairy Sci. 65, 2170–2173. doi: 10.3168/jds.S0022-0302(82)82477-6
Manlapig J. J. D., Kawakami S., and Matamura T. M. H. (2024). Effect of rice bran extract on in vitro rumen fermentation and methane production. Anim. Sci. J. 95, e13923. doi: 10.1111/asj.13923
Menke K. H., Raab L., Salewski A., Steingass H., and Schneider W. (1979). The estimation of the digestibility and metabolizable energy content of ruminant feedingstuffs from the gas production when they are incubated with rumen liquor in vitro. J. Agr. Sci. 93, 217–222. doi: 10.1017/S0021859600086305
Min B. R., Wei W., Pitta D. W., Nagaraju I., Patra A. K., He W. H., et al. (2024). Characterization of the ruminal microbiota in sheep and goats fed different levels of tannin-rich sericea lespedeza hay. J. Anim. Sci. 2024, skae198. doi: 10.1093/jas/skae198
Mthiyane F. T., Dludla P., Ziqubu K., Mthembu S., Muvhulawa N., Hlengwa N., et al. (2023). Corrigendum: a review on the antidiabetic properties of moringa oleifera extracts: focusing on oxidative stress and inflammation as main therapeutic targets. Front. Pharmacol. 14. doi: 10.3389/fphar.2023.1142410
Murray M. G. and Thompson W. F. (1980). Rapid isolation of high molecular weight plant DNA. Nucleic Acids Res. 8, 4321–4326. doi: 10.1093/nar/8.19.4321
Nanon A., Suksombat W., and Yang W. (2014). Effects of essential oils supplementation on in vitro and in situ feed digestion in beef cattle. Anim. Feed Sci. Tech. 196, 50–59. doi: 10.1016/j.anifeedsci.2014.07.006
Nong K., Qin X., Liu Z., Wang Z., Wu Y., Zhang B., et al. (2024). Potential effects and mechanism of flavonoids extract of Callicarpa nudiflora hook on dss-induced colitis in mice. Phytomedicine 128, 155523. doi: 10.1016/j.phymed.2024.155523
Ørskov E. R. and McDonald I. (1979). The estimation of protein degradability in the rumen from incubation measurements weighted according to rate of passage. J. Agr. Sci. 92, 499–503. doi: 10.1017/S0021859600063048
Preston T. R. (1998). “Tropical animal feeding: a manual for research workers,” in Animal Production and Health (Food and Agriculture Organization, Rome).
Rabee A., Ghandour M., Sallam A., Elwakeel E., Mohammed R., Sabra E., et al. (2024). Rumen fermentation and microbiota in Shami goats fed on condensed tannins or herbal mixture. BMC Vet. Res. 20, 35. doi: 10.1186/s12917-024-03887-2
Theodorou M., Williams B., Dhanoa M., McAllan A., and France J. (1994). A simple gas production method using a pressure transducer to determine the fermentation kinetics of ruminant feeds. Anim. Feed Sci. Tech. 48, 185–197. doi: 10.1016/0377-8401(94)90171-6
Tian G., Zhang X., Hao X., and Zhang J. (2023). Effects of curcumin on growth performance, ruminal fermentation, rumen microbial protein synthesis, and serum antioxidant capacity in housed growing lambs. Animals 13, 1439. doi: 10.3390/ani13091439
van Soest P. J., Robertson J. B., and Lewis B. A. (1991). Methods for dietary fiber, neutral detergent fiber, and nonstarch polysaccharides in relation to animal nutrition. J. Dairy Sci. 74, 3583–3597. doi: 10.3168/jds.S0022-0302(91)78551-2
Vera N., Gutiérrez-Gómez C., Williams P., Allende R., Fuentealba C., and Ávila-Stagno J. (2022). Comparing the effects of a pine (Pinus radiata D. Don) bark extract with a quebracho (Schinopsis balansae Engl.) extract on methane production and in vitro rumen fermentation parameters. Animals 12, 1080. doi: 10.3390/ani12091080
Vijayaraghavan K. and Ashokkumar T. (2017). Plant-mediated biosynthesis of metallic nanoparticles: A review of literature, factors affecting synthesis, characterization techniques and applications. J. Environ. Chem. Eng. 5, 4866–4883. doi: 10.1016/j.jece.2017.09.026
Yagi S., Nilofar N., Uba A. I., Caprioli G., Mustafa A. M., Angeloni S., et al. (2024). Elucidating the chemical profile and biological studies of Verbascum diversifolium Hochst. extracts. Front. Pharmacol. 15. doi: 10.3389/fphar.2024.1333865
Yejun L., Su Kyoung L., Shin Ja L., Jong-Su E., and Sung Sill L. (2019). Effects of Lonicera japonica extract supplementation on in vitro ruminal fermentation, methane emission, and microbial population. Anim. Sci. J. 90, 1170–1176. doi: 10.1111/asj.13259
Yeshi K., Ruscher R., Miles K., Crayn D., Liddell M., and Wangchuk P. (2022). Antioxidant and anti-Inflammatory activities of endemic plants of the Australian Wet Tropics. Plants 11, 2519. doi: 10.3390/plants11192519
Yu S., Li L., Zhao H., Liu M., Jiang L., and Zhao Y. (2023). Citrus flavonoid extracts alter the profiling of rumen antibiotic resistance genes and virulence factors of dairy cows. Front. Microbiol. 14. doi: 10.3389/fmicb.2023.1201262
Zeng Z., Sheng P., Zhang H., He L., Huang J., Wang D., et al. (2021). The effect of Macleaya cordata extract on in vitro ruminal fermentation and methanogenesis. Food Sci. Nutr. 9, 4561–4567. doi: 10.1002/fsn3.2436
Zhang H., Tong J., Wang Z., Xiong B., and Jiang L. (2020). Illumina MiSeq sequencing reveals the effects of grape seed procyanidin on rumen archaeal communities in vitro. Anim. Biosci. 33, 61–68. doi: 10.5713/ajas.19.0226
Zhou J., Bruns M., and Tiedje J. (1996). DNA recovery from soils of diverse composition. Appl. Environ. Microb. 62, 316–322. doi: 10.1002/bit.260490302
Keywords: plant extracts, fiber degradation, fermentation parameters, ruminant, dose effect
Citation: Yang W, Li R, Wang W, Li K, Huang Y, Ying Y, Liu Y and Wu H (2025) Biphasic effects of Callicarpa nudiflora water extract on rumen fermentation in vitro and microbial communities in sheep. Front. Anim. Sci. 6:1595795. doi: 10.3389/fanim.2025.1595795
Received: 18 March 2025; Accepted: 16 June 2025;
Published: 14 July 2025.
Edited by:
Majid Shakeri, United States Department of Agriculture, United StatesReviewed by:
Ravikanthreddy Poonooru, University of Missouri, United StatesChaichana Suriyapha, Khon Kaen University, Thailand
Copyright © 2025 Yang, Li, Wang, Li, Huang, Ying, Liu and Wu. This is an open-access article distributed under the terms of the Creative Commons Attribution License (CC BY). The use, distribution or reproduction in other forums is permitted, provided the original author(s) and the copyright owner(s) are credited and that the original publication in this journal is cited, in accordance with accepted academic practice. No use, distribution or reproduction is permitted which does not comply with these terms.
*Correspondence: Runhang Li, c2lsZW5jZWxpQDEyNi5jb20=; Hongxin Wu, d3Vob25neGluMTY4QDE2My5jb20=