 Myeongseong Lee1,2
 Brent W. Auvermann1,3*
 Luis O. Tedeschi2
 Jacek A. Koziel4
 Carolina B. Brandani1,5
 Vinícius N. Gouvêa1,2Jason K. Smith2,6
 Kenneth D. Casey1,3
- 1Texas A&M AgriLife Research, Amarillo, TX, United States
- 2Department of Animal Science, Texas A&M University, College, Station, TX, United States
- 3Department of Biological and Agricultural Engineering, Texas A&M University, College, Station, TX, United States
- 4Livestock Nutrient Management Research Unit, United States Department of Agriculture-Agricultural Research Service (USDA-ARS) Conservation and Production Research Laboratory, Bushland, TX, United States
- 5Department of Soil and Crop Sciences, Texas A&M University, College, Station, TX, United States
- 6Texas A&M AgriLife Extension Service, Amarillo, TX, United States
This review described the state of the science concerning the generation, measurement, and mitigation of ammonia (NH3) emissions from beef cattle feedyards. NH3 emissions primarily come from urinary urea in cattle manure. In the past, constant emission factors were used to inventory NH3 emissions. Currently, NH3 emission factors estimated by process-based mechanistic models reflecting various factors affecting NH3 emissions in the feedyard environment are available. This review of current literature indicated the average NH3 emissions from a beef cattle feedyard was approximately 119 g/head/day (range 24 to 318 g/head/day), and the average NH3 flux was approximately 58 µg/m2/s (range 2 to 185 µg/m2/s). Although more realistic estimates of NH3 emission flux from open-lot livestock facilities were being obtained using process-based models, there was still significant variation depending on the diet composition, manure management practices, and the feedyard environment, including both seasonal weather patterns and synoptic weather events. We note the need to improve inventories of NH3 emissions into categories of crude protein percentage, manure management implemented, and feedyard environment. Some mitigation strategies can be effective, such as diet manipulation, growth-promoting technologies, and manure or pen-surface amendments. Of those, precision diet feeding to meet but not exceed protein requirements appeared to be the most practical way to reduce ammonia emissions over the animals’ feeding period; laboratory studies suggested that shorter-term reductions in emission flux may be possible with the other approaches, but they were far more speculative at this point as to both their efficacy and their cost of implementation.
1 Introduction
Over the past few decades, livestock and poultry farmers have scaled up farming operations to meet society’s demand for high-quality meats, milk, eggs, and by-products. The concentration of animals in feeding operations has played a large role in fulfilling the demand for animal protein with fewer animals and while using fewer land resources. Concentration of animals in close proximity during a portion of their production cycle also concentrates their nutrient emissions. More specifically, these undesirable potential implications of confined (or “concentrated”) animal feeding operations (CAFOs) are caused by gas and particulate matter (PM) emissions from various types of animal wastes, including manure (feces and urine), waste feed, bedding, and wastewater. Gaseous emissions from CAFOs include NH3, greenhouse gases (carbon dioxide, CO2; methane, CH4; and nitrous oxide, N2O), and other air pollutants such as volatile organic compounds (VOCs), many of which are odorous.
NH3 emissions from CAFOs are a high-profile environmental quality concern because they can contribute to the eutrophication of surface waters, nitrate contamination of ground waters, soil acidity, secondary formation of fine PM, and impaired air quality (USEPA, 2004; Hribar, 2010; Brandani et al., 2023). Gaseous NH3 in the atmosphere has been reported as a significant contribution to the formation of airborne fine particulate matter (PM2.5) through reactions with water vapor and other air pollutants, including oxidation products of sulfur dioxide (SO2) or nitrogen oxides (NO and NO2, or NOx) (Li et al., 2008; Wyer et al., 2022). Indeed, U.S. Environmental Protection Agency (USEPA) recently reduced the annual health-based National Ambient Air Quality Standard for PM2.5 from 12.0 µg/m3 to 9.0 µg/m3 (USEPA, 2024). Since NH3 is a precursor gas that may be easier to mitigate than others among PM2.5’s other precursors (Meng et al., 2017; Gu et al., 2021; Wyer et al., 2022), if ambient PM2.5 standards are further reduced, ambient air-quality standards for NH3 may be introduced. Furthermore, NH3 may also contribute to climate change through N2O formation as an intermediate byproduct of ammonium (NH4+) oxidation in the microbial processes of nitrification and denitrification (USEPA, 2010). In addition, NH3 emissions may contribute to nitrogen (N) deposition in neighboring ecosystems, which in turn may affect ecosystem function by promoting eutrophication, soil acidification, and disrupting biodiversity (Benedict et al., 2013; Thompson et al., 2015; Morris, 2016; Brandani et al., 2023).
As public awareness and concern over the potential adverse effects of NH3 emissions on the environment and human health increased, governmental regulation of CAFOs led to a push and the adoption of sustainable management practices by livestock producers (Waldrip et al., 2015). Sound scientific evidence is needed to evaluate current and proposed regulations that go beyond encouraging practices regarding CAFOs, air quality, PM, and NH3 emissions in particular. It is necessary to understand the emission mechanisms and processes influencing emissions, know the appropriate measurement methodologies and techniques and uncertainties associated with their use, evaluate current scientific literature for feedyard-based emissions data, survey the industry feedyard management practices, anticipate the impact of emerging regulatory trends and socioeconomics on emissions, and identify the most practical approaches to mitigation and potential barriers to their adoption.
In this review, we reported the state of the science concerning NH3 emissions from beef cattle feedyards. The review is organized into five major areas: 1) pathway of NH3 emissions through N metabolism in the ruminant animal, 2) dynamics of NH3 emissions from pen surfaces, 3) methods quantifying NH3 emissions in the feedyard, 4) the current level of NH3 emissions in beef cattle feedyards, and 5) recommended management practices to mitigate NH3 emissions from feedyards. Details of the literature search methodology, including search engines, terms used, inclusion and exclusion criteria, and the total number of materials reviewed, are provided in the Supplementary Material.
2 Pathway of ammonia emissions from ruminant animal
Ruminants, specifically pre-gastric fermenters, have a unique digestive system that evolved to digest and use forage resources that are less or not digestible in monogastric animals. The unique digestive organ called the reticulo-rumen is an anaerobic microbe fermenter with the remarkable ability to convert dietary protein into microbial protein. Ruminal microorganisms can use not only dietary protein but also non-protein-N, which does not contain amino acids (e.g., urea and NH3) as N sources for microbial protein synthesis. In the reticulo-rumen, N sources are degraded by rumen microbes to peptides, amino acids, and eventually to NH3 by the deamination of amino acids and then these compounds are used to synthesize microbial protein (Hristov and Jouany, 2005; NASEM, 2016). Microbial protein has a similar amino acid composition to the amino acid composition of tissue and milk protein, which makes it almost an ideal source of amino acids for the ruminant (NRC, 2001; Hristov et al., 2011). The metabolizable protein needs of the ruminant for maintenance and production are met primarily by microbial proteins that are washed out of the reticulo-rumen and feed proteins, which are not degraded by rumen microbes, with a small contribution from endogenous N, which originates from the animal’s own viscera rather than from dietary sources such as sloughed-off intestinal cells in the post-ruminal (small and large intestine) metabolism (NRC, 2001; NASEM, 2016). A portion of NH3 produced in ruminal N metabolism is absorbed across the ruminal epithelium into the portal vein and converted mostly into urea by the urea cycle in the liver to avoid NH3 toxicity (NASEM, 2016). Urea produced by the liver is partly excreted in the urine by the kidneys, with the remainder recycled back to the gastrointestinal tract (GIT) through either direct transfer from blood across the epithelial tissue or via saliva as a N source for protein synthesis (NASEM, 2016). The process in which NH3 in the rumen is converted into urea by the liver and reused as a N source in GIT is called urea recycling (or N recycling), and it plays an important role in N preservation mechanism of the ruminant (NASEM, 2016). Undigestible and unabsorbed N sources in ruminal and post-ruminal metabolism are excreted as feces. The overall N metabolism pathway in the ruminant is shown in Figure 1.
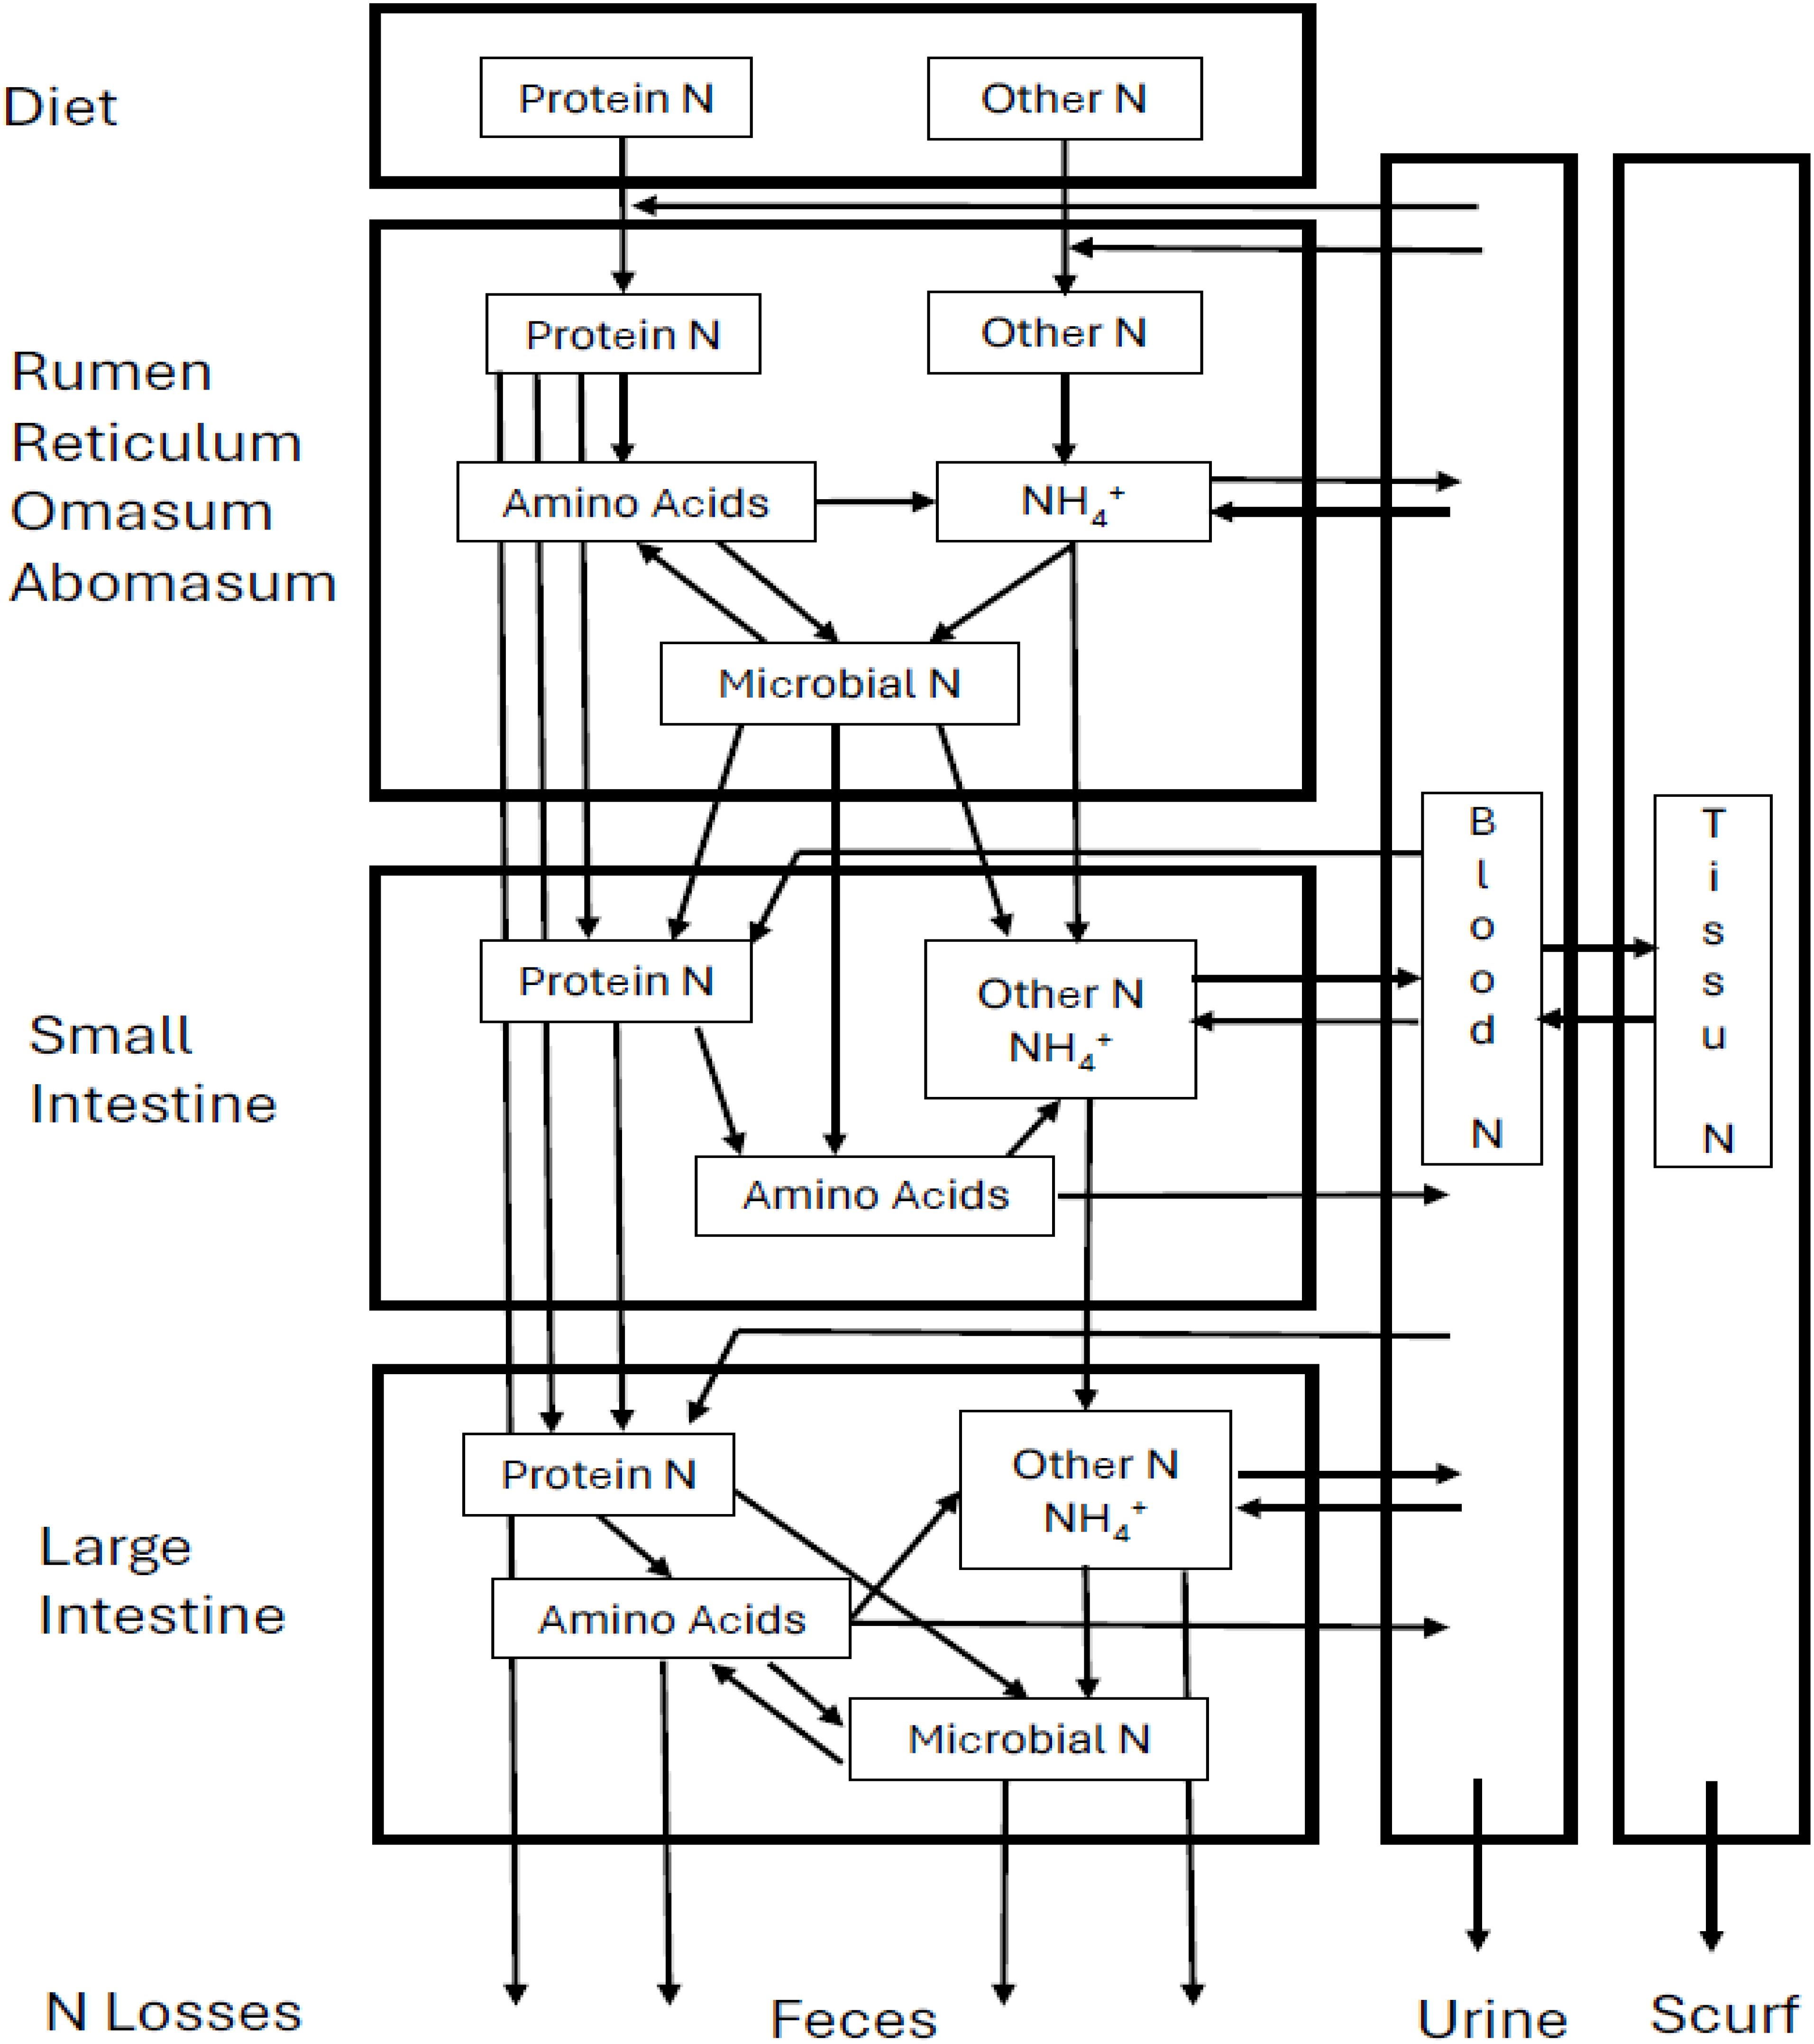
Figure 1. A schematic diagram of nitrogen metabolism in the ruminant. The diagram was reprinted from NRC (1985) and modified to incorporate concepts described by Tedeschi and Fox (2020).
The excretion of NH3 is largely determined by the form of NH3 in the ruminant’s metabolism. For example, if it is in a gas phase (NH3), it is most likely to be excreted as eructation, exhaled gas, and flatus. However, if it is in an ionized (NH4+) or solid form, it is more likely to be incorporated into the manure (feces and urine). Since the form of NH3 produced in the digestion of the ruminant is determined by the NH3/NH4+ equilibrium state (Equation 1), it is important to understand the factors that affect the NH3/NH4+ equilibrium and the ruminal and post-ruminal environments. The equilibrium between NH3 and NH4+ is not a redox-dependent reaction, but a pH and temperature (T) dependent reaction in aqueous solutions (Equations 2, 3; Emerson et al., 1975) as illustrated in Figure 2. This is because there is no change in the oxidation states of N or hydrogen (H), which is the key feature of redox reactions.
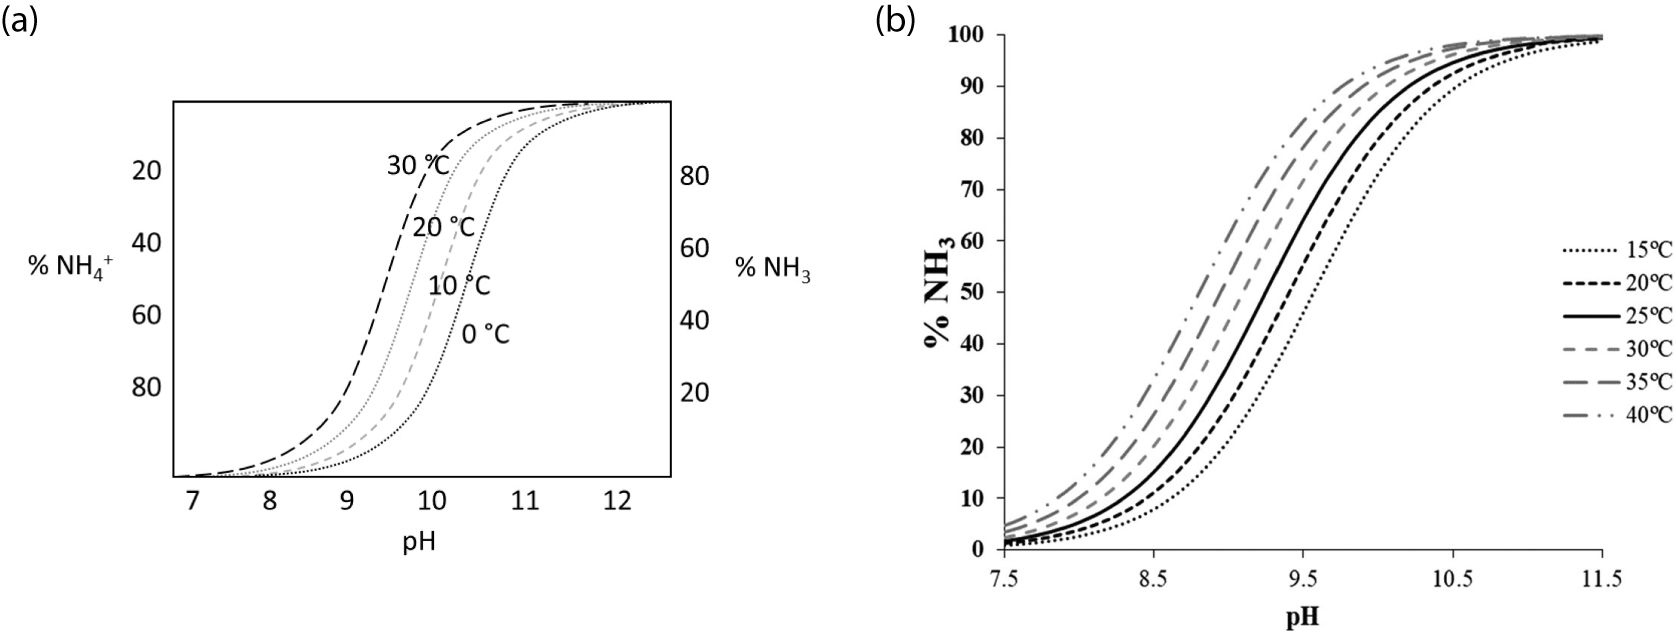
Figure 2. Equilibrium between NH4+ and NH3 as a function of pH and temperature. The images were reprinted from (a) Cofie et al. (2016), (b) Aguado et al. (2022).
The ruminal and post-ruminal environments depend on diet composition, management, and cattle’s health condition, but they are generally anaerobic, reductive (oxidation-reduction potential (Eh) of -250 to -450 mv; Van Soest, 1994),< 8 pH, and ~39°C (NASEM, 2016). Considering the general pH and T in the rumen and post-rumen, it is reasonably assumed that NH3 exists in mostly the NH4+ form. In addition, Mohiuddin and Khattar (2019) reported that the pKa of this reaction is about 9.15 and this reaction toward NH4+ occurs almost instantaneously under biological conditions (pH 7.4 and 36.5°C). However, the aqueous solution in the rumen and post-rumen is more dynamic and complex due to anaerobic microbial interactions and reductive conditions, thus in addition to pH and T, the change in pressure, ionic strength, and salinity may affect the conversion of NH3 form due to byproducts from microbial digestion and GIT metabolism.
Thus, based on the data investigated to date, we aimed to discuss specifically the form of NH3 estimated to be emitted by each NH3 emission pathway: 1) exhalation, 2) eructation, 3) flatus, and 4) the excreted N sources in manure, considering the unique N metabolism and the viscera environment of the ruminant. Environmental conditions and the predominant forms of NH3 associated with each NH3 emission pathway are described in the Supplementary Material. In summary, since pH and T are widely recognized as the primary factors influencing the chemical form of NH3 under biological conditions, NH4+ is the dominant form in the ruminant’s GIT. Consequently, most NH3 emitted from ruminants is considered to originate from excreted N in manure (Figure 3).
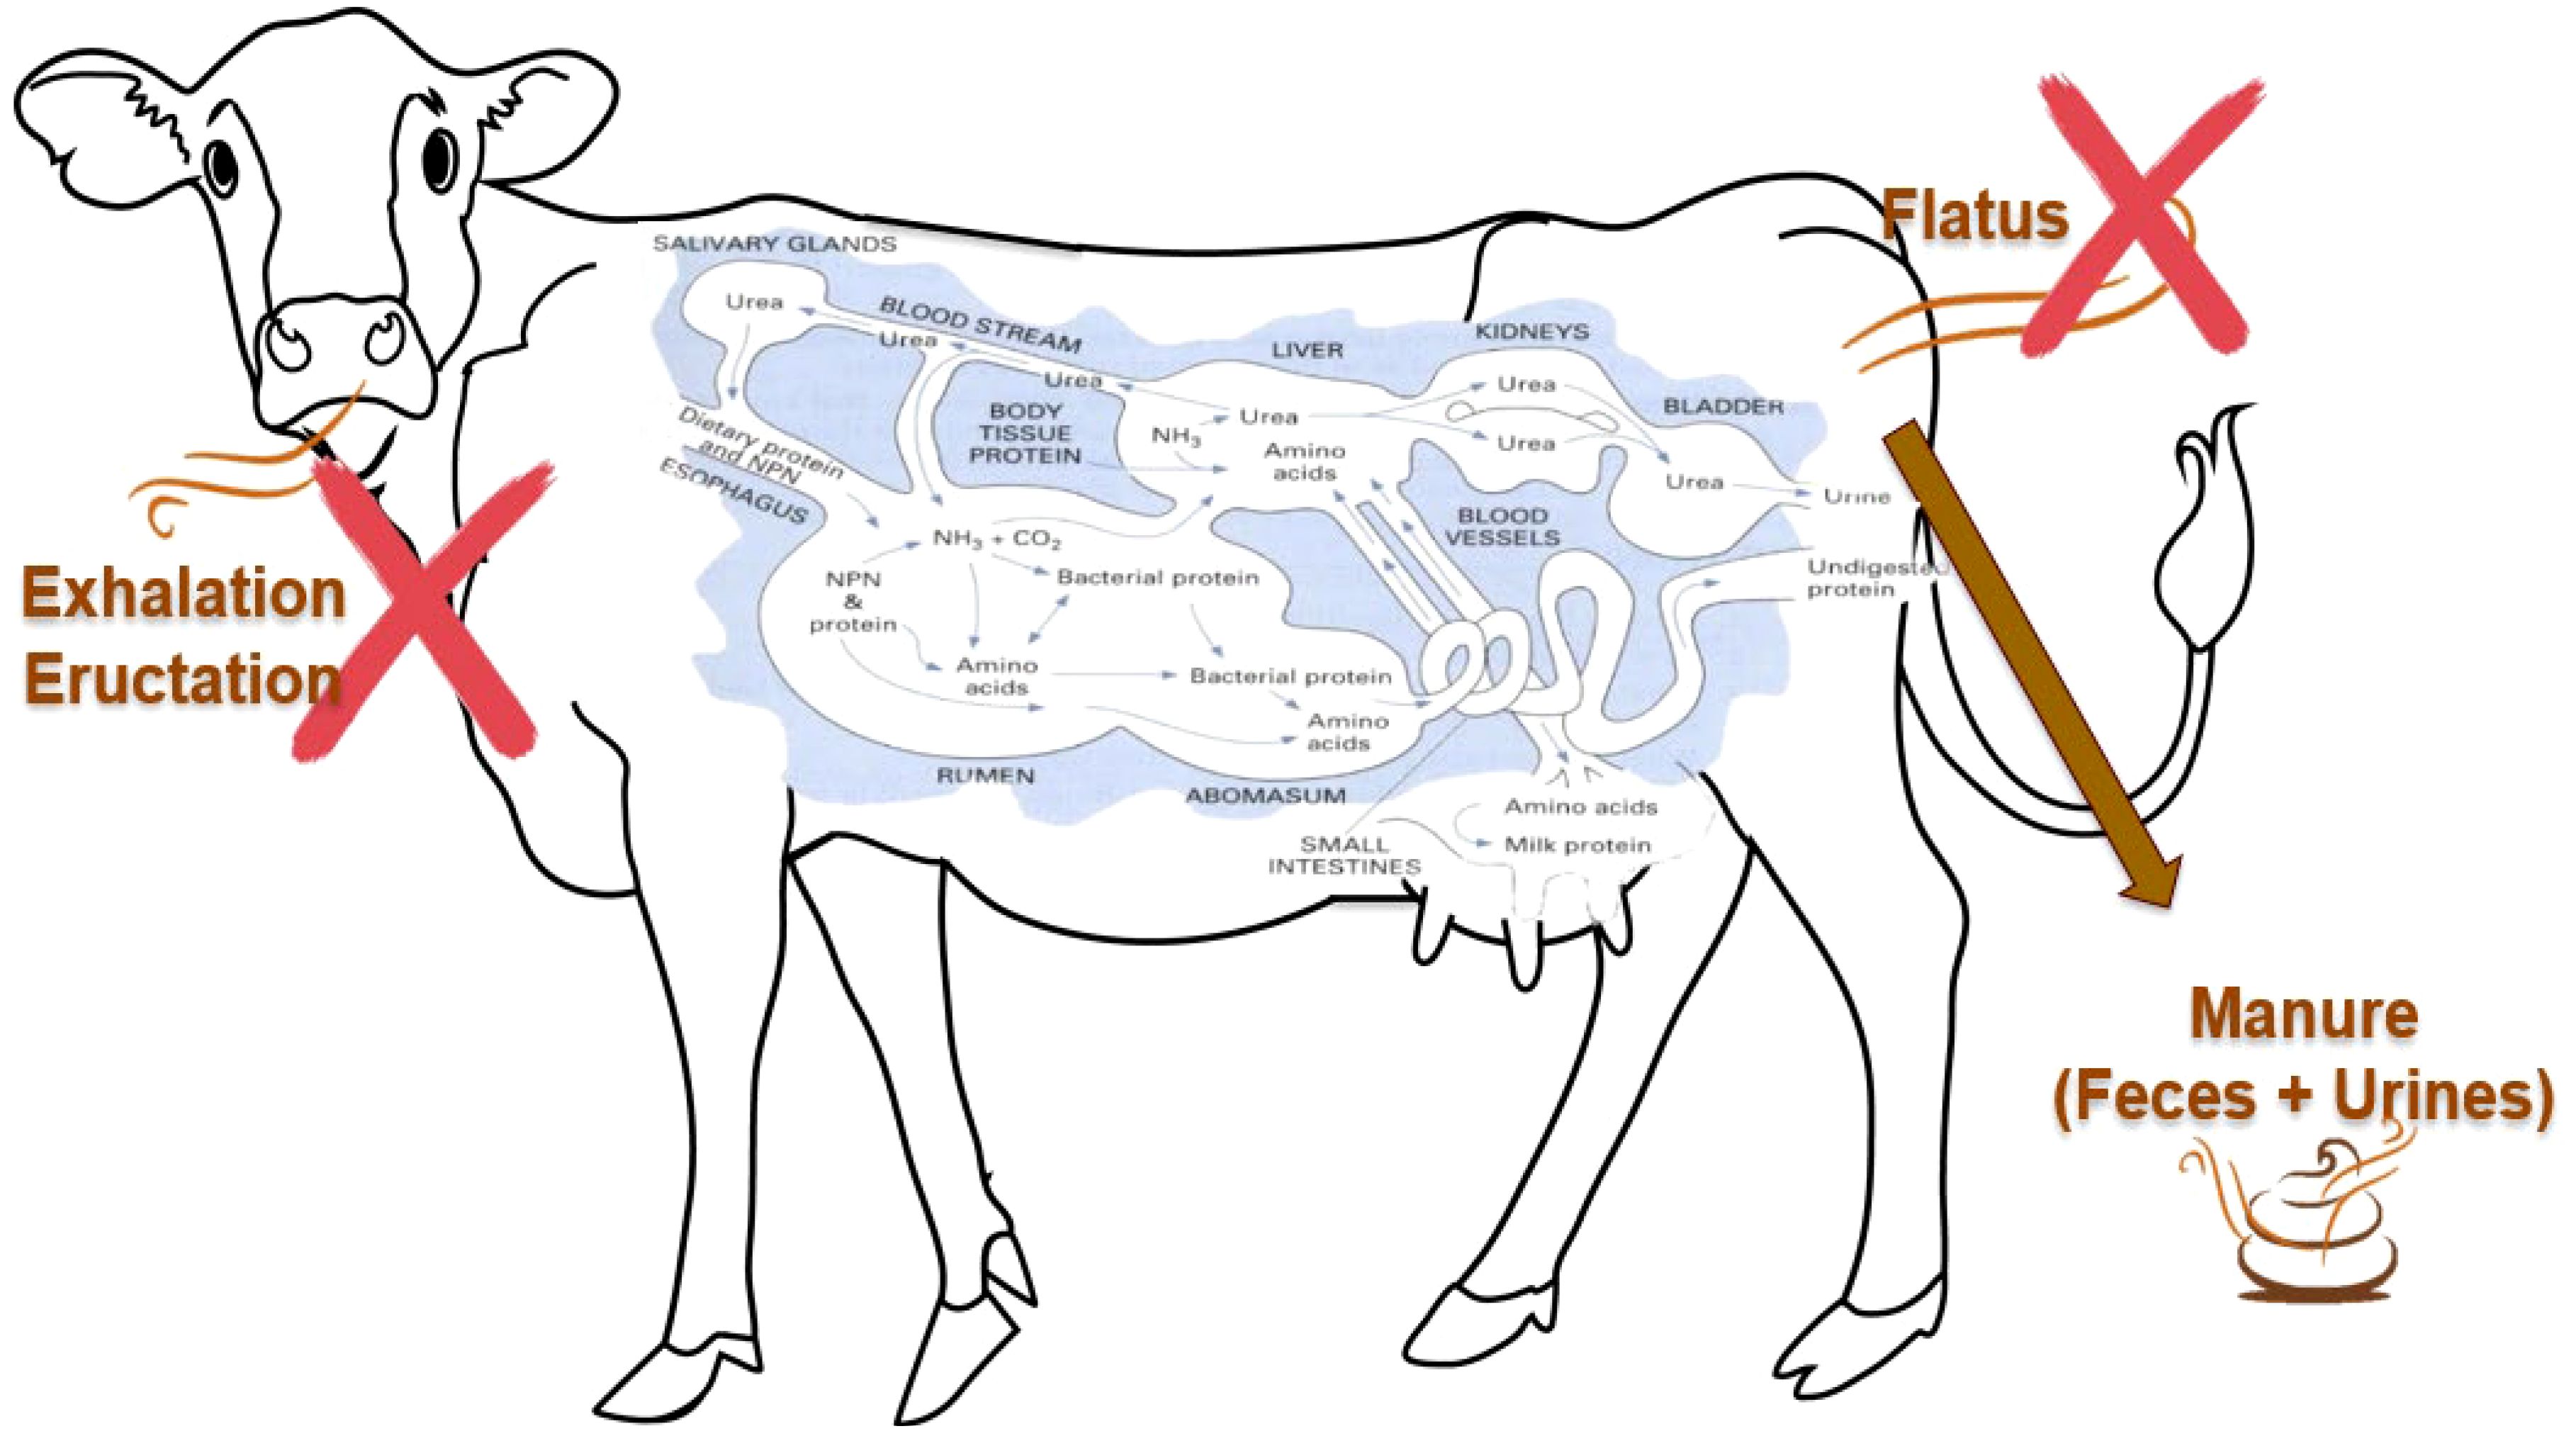
Figure 3. A schematic of ammonia emission pathways from the ruminant. The protein pathways inside the ruminant were reprinted from Vaga (2017).
3 Dynamics of ammonia emissions from pen surfaces
Excreted N in feces and urine is the main source of NH3 emissions from the beef cattle feedyard. Fecal NH3 is derived from undigested feed residues, microbial cells, endogenous secretions, sloughed cells from GIT (Waldrip et al., 2015), and urine NH3 derived from urea, hippuric acid, and purine-based catabolism residues (Bristow et al., 1992).
Urea (CO(NH2)2) is not volatile, but once it comes in contact with the urease enzyme (urea amidohydrolase), which is ubiquitous in manure and soil (Waldrip et al., 2015), it is rapidly hydrolyzed to NH3 and CO2 (Bussink and Oenema, 1998). However, NH3 from feces is generated through the slow process of organic N mineralization (Muck, 1982; Muck and Steenhuis, 1982; Waldrip et al., 2015). N compounds from feces are mineralized into NH4+ by heterotrophic microorganisms in the manure (Horton et al., 2006; Zhang et al., 2007; Vavilin et al., 2008). Mineralized NH4+ is slowly released as NH3 by diffusive and convective mass transfer (Waldrip et al., 2015). The process for volatilizing NH3 from cattle manure was summarized below (Figure 4, Equations 4-6; Brandani et al., 2023).
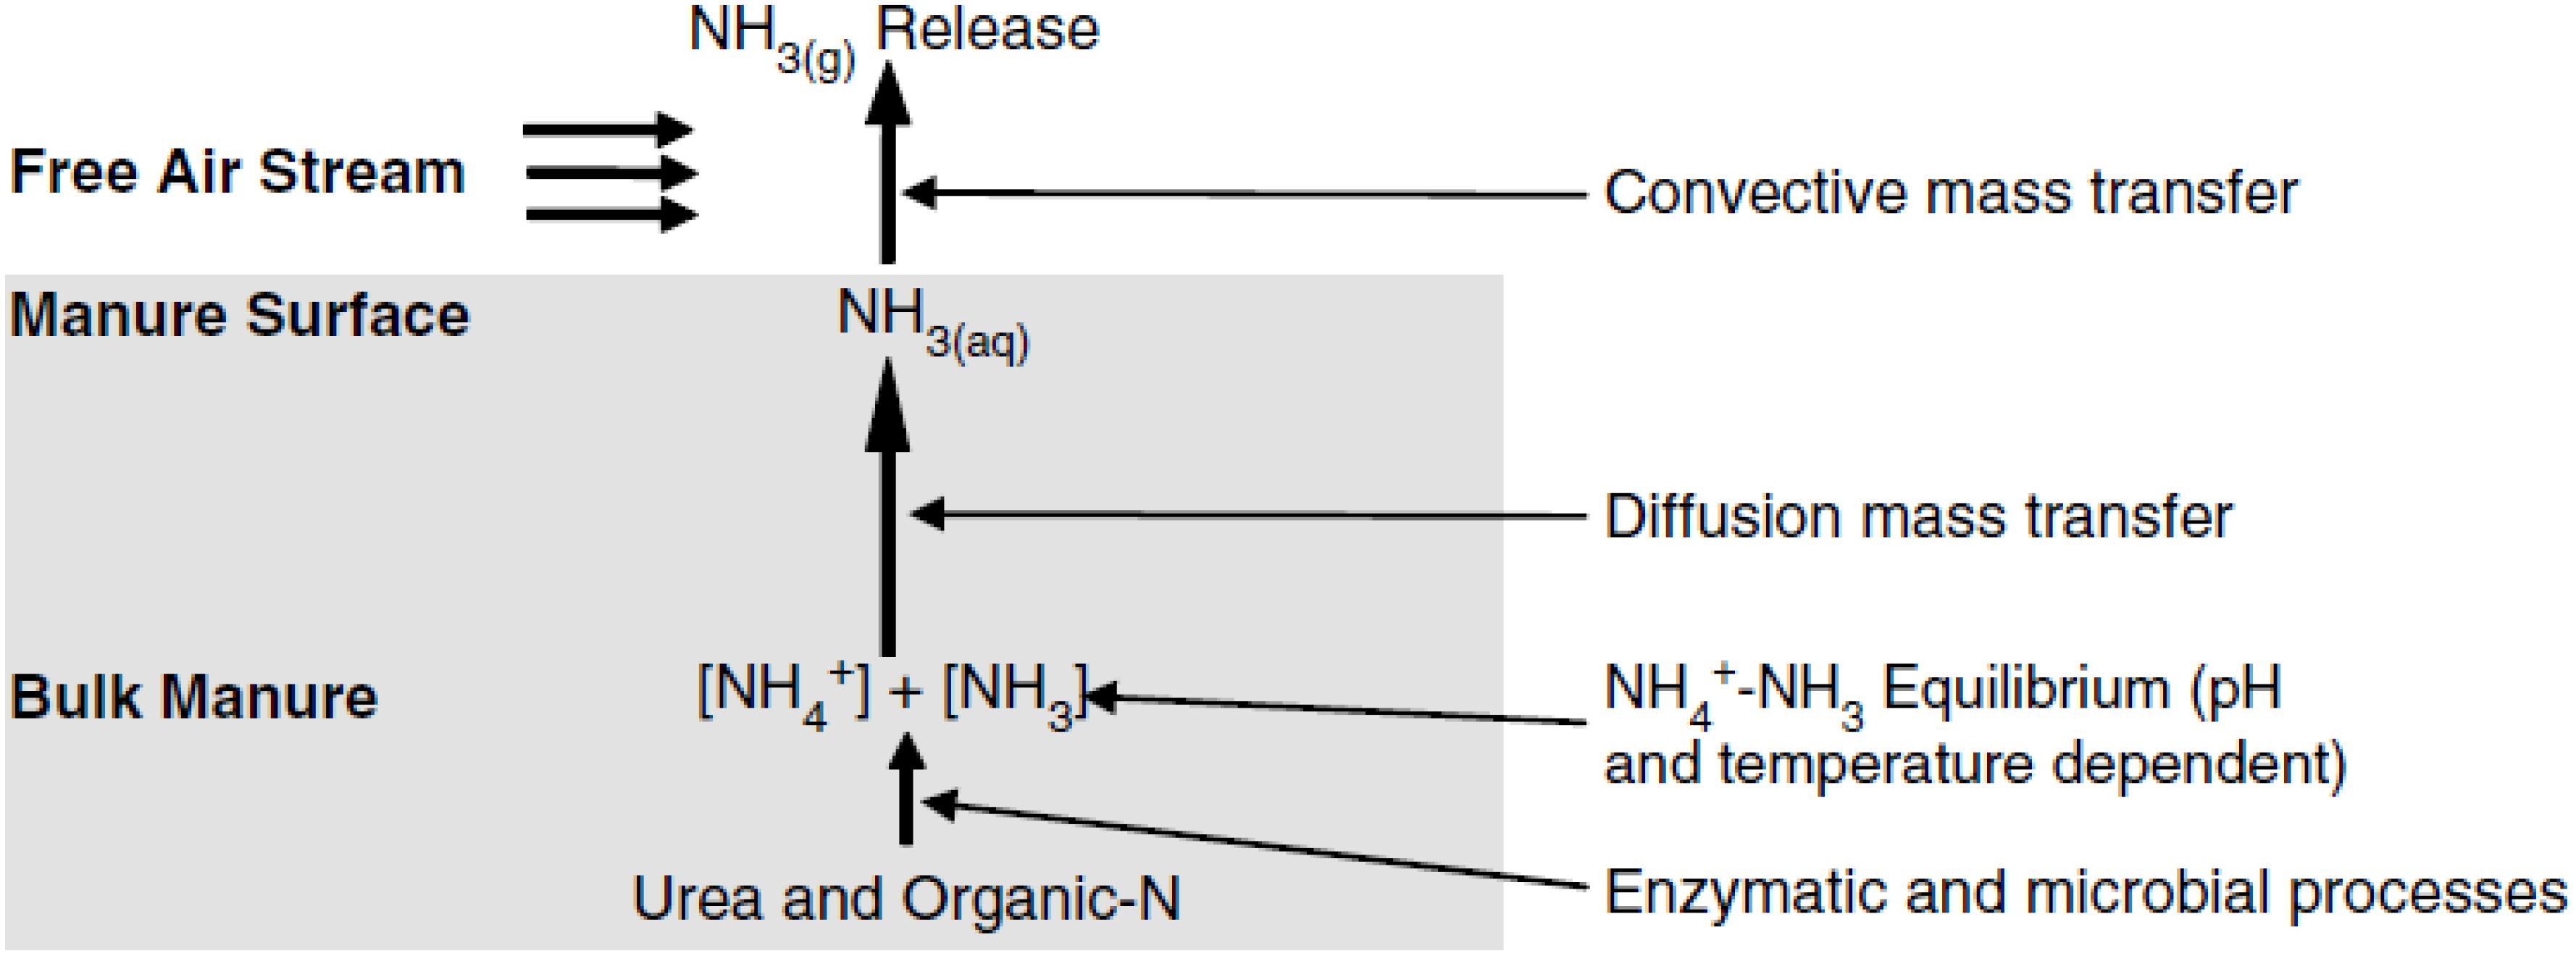
Figure 4. A conceptual model of NH3 formation and volatilization. The image was reprinted from Hristov et al. (2011).
Most NH3 emission from the beef feedyard originates from urine NH3, particularly urinary urea (Bristow et al., 1992; Bussink and Oenema, 1998; Waldrip et al., 2013a). The urinary N could be volatilized from 4% to 71% (Bussink and Oenema, 1998; Waldrip et al., 2013a), while feces N volatilization is considerably less at 1% to 13% (Bussink and Oenema, 1998). Supporting this, Lee and Hristov (2010) observed that urinary N accounted for an average of 90% of the total emitted NH3 during the first 10 d after excretion as cattle manure. In addition, several studies have reported that approximately 80% (range: 25 to 90%) of the urinary N is volatilized to NH3 within the first 24 h after manure excretion (Stewart, 1970; James et al., 1999; Cole and Todd, 2009; Lee et al., 2009). Urea represents 50% to 90% or more of total urinary N (Bussink and Oenema, 1998; Reynal and Broderick, 2005; Vander Pol et al., 2008) and proportionally increases as dietary CP level and intake increase (Cole et al., 2005; Colmenero and Broderick, 2006; Todd et al., 2006; Cole and Todd, 2009; Waldrip et al., 2013a). Waldrip et al. (2013a) reported a moderate relationship (R2 = 0.516) between dietary CP % and urinary N in finishing beef cattle.
The instantaneous magnitude and rate of NH3 loss are the result of complex physical and chemical processes on feedyard surfaces (Harper, 2005; Freney and Simpson, 2013). They depend strongly on diet composition, manure properties, environmental factors (T, precipitation, humidity, and wind turbulence), manure properties, and management practices (Sommer et al., 1991; Ni, 1999; Brandani et al., 2023). In summary, NH3 emission is mostly driven by four factors (Harper et al., 2010a): 1) total ammonia N (TAN) concentration of the manure, 2) T of the manure and pen surfaces, 3) pH of the manure and pen surfaces, and 4) the effectiveness of mass transfer and turbulent transport of the NH3 away from the manure surface. The relationship between NH3 volatilization and four key factors was summarized in the Supplementary Material. In conclusion, NH3 volatilization increases with increasing TAN concentration, T, wind speed, and pH (Sawyer et al., 1978; Sommer et al., 1991; Arogo et al., 2006; Montes et al., 2009; Todd et al., 2011). Temperature and pH have been reported to be the most important factors influencing NH3 volatilization (Arogo et al., 2006), as NH3/NH4+ are equilibrium-dependent (Figure 4). Supporting this, a significant correlation between the above parameters and NH3 volatilization was reported in Redding et al. (2019) (Table 1).
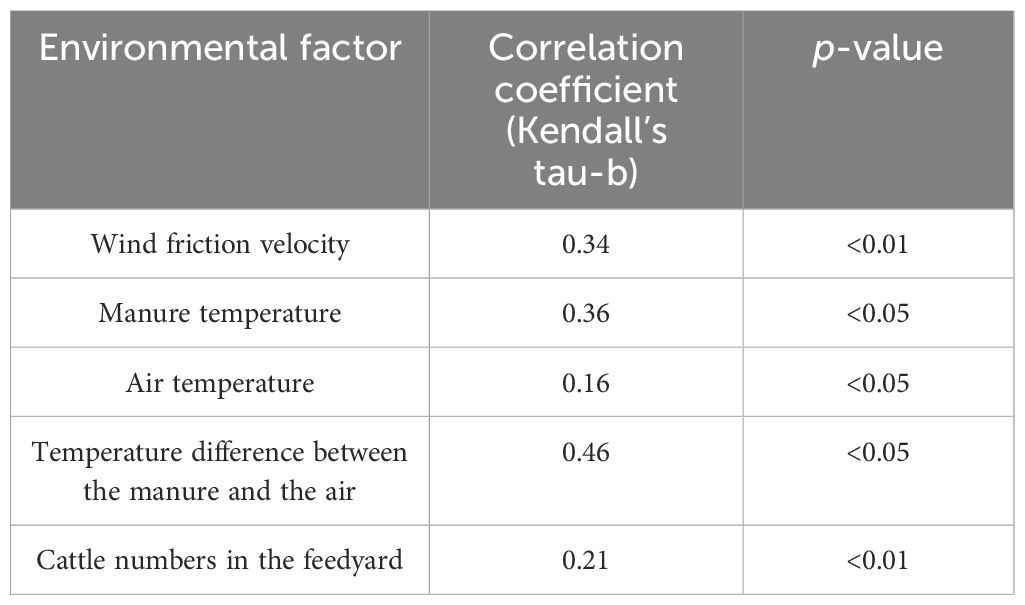
Table 1. Correlation coefficient observed between environmental factors and NH3 volatilization.
4 Quantifying ammonia emissions
To accurately quantify NH3 emissions in the feedyard, it is necessary to understand the characteristics of NH3 emissions occurring in the feedlot environment. NH3 is a colorless gas with a distinct, pungent smell. It occurs naturally and is normally found in trace amounts in the atmosphere (range: 1 to 25 ppb; Renard et al., 2004). Due to its high reactivity and the pervasiveness of the urease enzyme, the process of NH3 formation and volatilization is almost instantaneous and begins immediately after manure is excreted (Hristov et al., 2011). Once emitted into the atmosphere, NH3, where it is the dominant alkaline gas, reacts with atmospheric sulfuric and nitric acids forming ammonium sulfate, ammonium bisulfate, and ammonium nitrate, which precipitate in atmospheric water droplets as secondary fine particles (PM2.5) and are regulated by USEPA as a so-called “criteria” air pollutant (Renard et al., 2004; Brandani et al., 2023). NH3 released into the atmosphere has a short lifespan in its gas phase of 2.5 to 36 h (Xie et al., 2024).
NH3 emissions from open feedyards are generally lower than those encountered in closed or housed animal production systems (Todd et al., 2005, 2006; Hristov et al., 2011). This is because open feedyards are exposed to ambient air, allowing for dilution airflow that reduces NH3 concentrations in the atmospheric boundary layer. Although ambient conditions are spatially and temporally variable, NH3 emissions from beef feedyards are quickly dispersed by atmospheric turbulence (Waldrip et al., 2015). In other words, most agricultural open sources like a feedyards tend to be scattered both temporally and spatially, and most of the gaseous NH3 emitted by feedyards may be shortly adsorbed to surrounding cropping and natural ecosystems by dry deposition (Harper et al., 2004; Harper, 2005), converted to fine particles, or mixed into the upper atmosphere. Additionally, manure in open feedyards is typically distributed over a larger area and may dry out more quickly due to exposure to sunlight and wind. Although more NH3 may be released during the drying process, dried manure emits less NH3 compared to the wetter manure often found in closed systems. In addition, open-lot feedyards often have lower stocking density compared to animal operations under the roof, which reduces the total amount of NH3 being produced per unit of emitting area.
Quantifying gas emissions from open sources requires equipment that can measure low concentrations of NH3 quickly, accurately, and robustly. Any measurement procedure that alters the natural ambient state (e.g., manure property and turbulence at the emitting surface) will introduce bias to measured NH3 emission rates (Harper et al., 2010a). For NH3, any measurement technology that interferes with the turbulent transport process away from the source (the rate-limiting process) can result in large errors. This is unlike CH4, CO2, or NO2, which are less soluble and less affected by turbulent transport as mass-flow (biological) gases (Harper et al., 2010a). Therefore, measuring the NH3 concentration emitted in the natural ambient state with the acquisition of weather data is better for the quantification of NH3 emission in the feedyard compared to other approaches such as creating an artificial airflow inside a flux chamber.
Quantifying NH3 emissions requires at least two components: 1) a method to measure the atmospheric concentration of NH3 and 2) a method to measure weather data for converting the concentration into emission using a dispersion model or a method to directly measure the airflow rate (usually for lab scale) (Waldrip et al., 2015). It is important to note that concentration is only a percentage. 1 ppm of NH3 just means that NH3 is 0.0001% of the sampled air. It says nothing about the actual amount of NH3 injected into the atmosphere. Therefore, it is necessary to approach the term of emissions (mass per time). If the total volumetric airflow (m3/s) and the NH3 concentration (g/m3) from an emission source were measured, the two terms must be multiplied to obtain the emission rate in g/s. The main text of this review describes only the most widely used method currently applied in practice. However, the Supplementary Material provides an overview of five major approaches for measuring NH3 concentrations (acid trap, chemiluminescence, electrochemical sensor, infrared analyzer, and tunable diode analyzer) and estimating NH3 emissions (N mass balance, flow-through chamber, micrometeorological methods, air dispersion models, and satellite remote sensing). As each method has advantages, disadvantages, and applicability varies, readers are encouraged to consult all methods and select the one most appropriate for their specific research conditions and objectives.
4.1 Measurement of ammonia concentration
4.1.1 Open-path tunable diode laser absorption spectrometry
Open-path tunable diode laser absorption spectrometry (OP-TDLAS) is a technique designed to measure the path-averaged concentration of specific species within a gas mixture using laser-absorption spectrometry. The basic principle of OP-TDLAS involves passing the laser through the gas mixture, detecting the amount of light absorbed by NH3 molecules at specific wavelengths according to the change in the degree of recovery rate from the detector, and then computing the NH3 concentration based on the calibration between NH3 concentration and the amount of light absorbed at certain wavelengths (Figure 5). Such a specific waveband (so-called narrow absorption line), specifically designed for NH3, avoids mutual absorption interference of other gases such as CO2, CH4, and water vapor (Harper et al., 2010a). The amount of light absorbed by the NH3 molecules is proportional to the concentration of NH3 along the optical path. NH3 gas molecules typically absorb light in the range of around 200 (Boreal Laser INC), 620~740, or 931~954 cm-1 (Baldacchini et al., 1981; Hermanussen et al., 1986). To sum up, OP-TDLAS is designed to measure mean concentrations along an open path between the laser and the retroreflector and is a non-invasive technique.
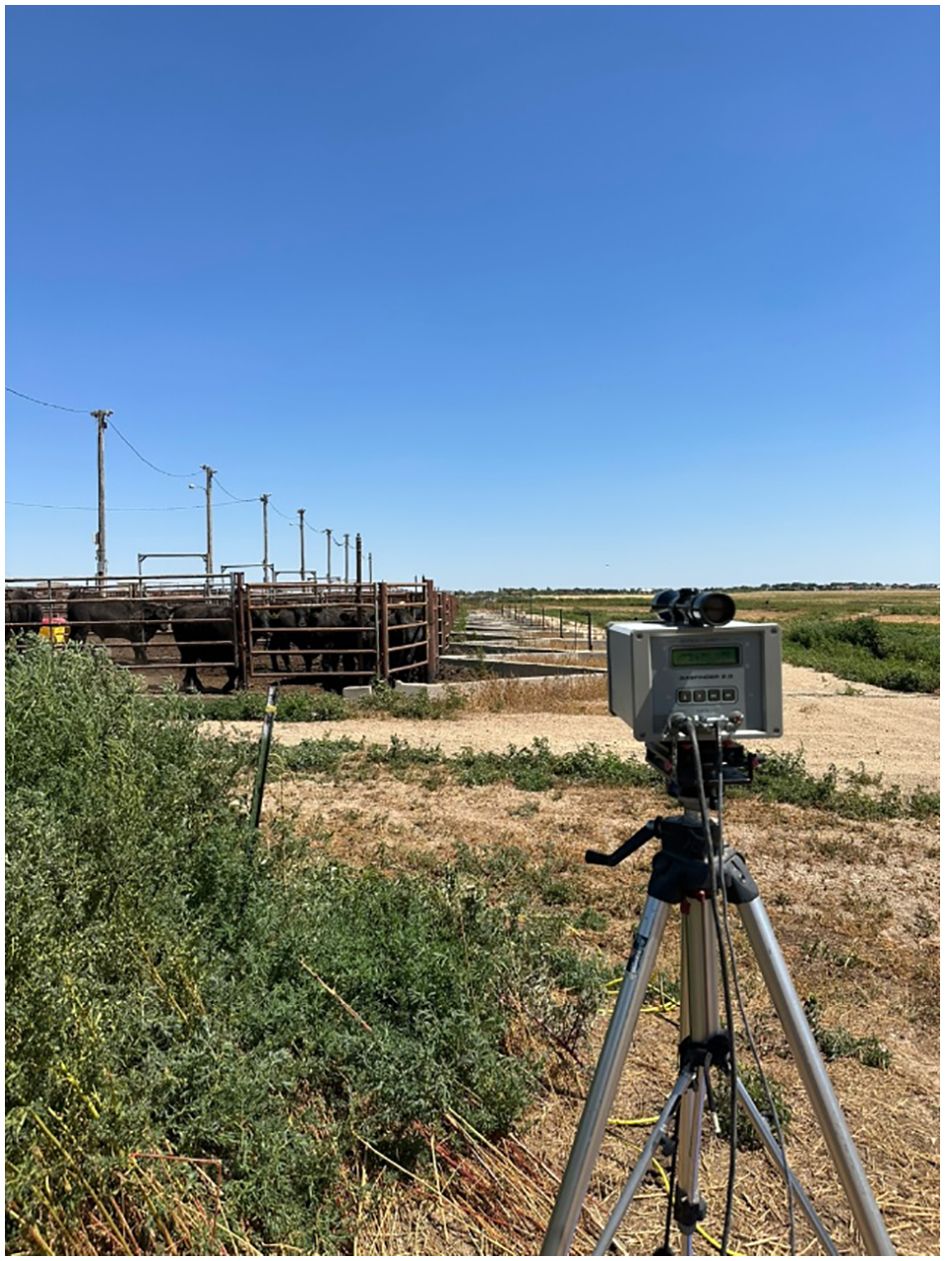
Figure 5. A figure of the OP-TDLAS on a beef cattle feed yard.
The main advantage of using OP-TDLAS at beef cattle feedyards is quick, accurate, and robust NH3 measurement in a feedyard environment where NH3 rapidly volatilizes from relatively large emitting areas. As an example, the detailed specification of OP-TDLAS by Boreal Laser Inc (Edmonton, Canada) has 8–6500 or 40-15,000 ppm-m as a detectable NH3 range and a ±2% uncertainty about reading accuracy. The response time required for measuring accurate NH3 concentration is 1 s. Once factory calibration is completed, it has a longer calibration cycle than other sensors. If stored properly, the measurement will remain accurate for several years. In addition, the open path between the laser and retroreflector can typically be covered to 5~500 m in measurements, but this can be increased further depending on the performance of the reflector. In terms of disadvantages, OP-TDLAS is expensive and requires careful maintenance. It may require skilled operators for setup, calibration, and maintenance due to the complexity of the technology involved. It is susceptible to maintaining clear line of sight between the laser and retroreflector. Environmental conditions like dust and condensation can increase the opacity of the air along the optical path and degrade the quality of an instrument’s signal.
4.2 Estimation of ammonia emissions
4.2.1 Air dispersion models
Direct measurement of NH3 emissions from open cattle feedyards is challenging due to their size, the spatial and temporal variable nature of emissions from open sources, and the labor, cost, and time consumption associated with measuring and maintaining instruments (Bonifacio et al., 2013). One may sidestep these problems by using an atmospheric dispersion model to deduce the emission indirectly (Flesch et al., 2004). Air dispersion models are mathematical tools used to characterize the atmospheric processes that disperse a pollutant emitted by a source and simulate the transport and dispersion of air pollutants in the atmosphere based on measured weather data and gas emissions (or concentration). These models help assess the NH3 emission at various locations downwind from a source, providing valuable information for air quality management, environmental impact assessments, and regulatory compliance.
In the case of open beef feedyards, several air modeling systems could be applied such as 1) Gaussian model-based AERMOD (American Meteorological Society/Environmental Protection Agency Regulatory Model) system and 2) backward Lagrangian stochastic (bLS) model-based WindTrax system, but bLS model-based WindTrax is generally applicable for beef cattle feedyards.
4.2.1.1 Gaussian model-based AERMOD system
A Gaussian dispersion model describes the transport of pollutants from a point source as a steady-state plume whose horizontal and vertical spread are modeled as Gaussian distributions whose parameters are specified by ensembles of weather variables affecting boundary-layer turbulence. The AERMOD System is a steady-state, Gaussian plume model that incorporates air dispersion based on planetary boundary layer turbulence structure and scaling concepts, including treatment of both surface and elevated sources, and both simple and complex terrain (USEPA, available online: https://www.epa.gov/scram/air-quality-dispersion-modeling). It is the preferred regulatory dispersion model of USEPA and is a free system used for emission estimation of target gases across various industries. An advantage of such Gaussian model-based system is that the plume dispersion parameters are based on theory and inputs are well characterized by experimental data (Arogo et al., 2006). However, this Gaussian assumption is not valid for all variables associated with the atmosphere for all time, scales, and dynamics (Goodliff et al., 2020). Specifically, Harper et al. (2011) pointed out that it is hard to expect such universality of Gaussian distribution since the atmosphere in the feedyard does not adhere to Gaussian assumptions. In other words, the shortcomings and limitations of Gaussian model arise from the many simplifying assumptions implicit in the mathematical solutions of these models (such as conditions of steady, uniform flow and homogenous turbulence), and the assumption of vertical Gaussian concentration distribution which is often not realized in the boundary layer (Arogo et al., 2006).
4.2.1.2 bLS model-based WindTrax
Lagrangian stochastic models (LS) describe the trajectories of tracer particles in turbulence from a statistical perspective of random velocity fields. They are considered by some authors the most natural and accurate means of calculating atmospheric transport (Wilson and Sawford, 1996). Flesch et al. (1995) developed a “backwards” variant of this type of model, otherwise known as the bLS dispersion model. The bLS dispersion model calculates an ensemble of particle trajectories that are distinguished by each passing through an observation point (Flesch et al., 1995). In other words, particles are released at the receptor location and travel backward in time to the source location in bLS; by contrast, in forward or standard LS, particles are released at the source and travel to the receptor location (Li and Du, 2020). Specifically, the bLS model tracks the movement of individual air parcels or particles as they disperse in the atmosphere based on measured weather data and gas concentration. When used in conjunction with OP-TDLAS measurements of pollutant concentrations, thousands of model trajectories are calculated upwind of the OP-TDLAS path for the prevailing wind conditions (Harper et al., 2010a). The important information relating the concentration to the emissions is the set of trajectory intersections with the ground (touchdowns), and the needed concentration-emission rate (C-Q) relationship is determined by those touchdowns according to Equations 7, 8 (Flesch et al., 2004).
Where: Q: NH3 emission rate (kg/m2/s) from the area source of known configuration. C: NH3 concentration (mg/m3); Cb = the background NH3 concentration (mg/m3). (C/Q)sim: a model prediction of the ratio of concentration to the emission. N: the total number of (computational) particles released from the source. W0: the vertical velocity at touchdown within the source (m3/min per surface area; m2).
The advantages of the bLS dispersion model are its ability to accurately represent wind features near the ground, their role in gas transport, (Harper et al., 2011) and to be faster and more flexible in calculating turbulent dispersion from surface area sources than “forward” models (Flesch et al., 1995). Therefore, it is a particularly good choice for calculating the relationship between gas concentration and emission rate for ground-level sources and for concentration observations taken near the source (Harper et al., 2011). However, it assumes that the atmospheric surface layer is homogeneous, that flow is stationary and that the source strength is spatially uniform (Flesch and Wilson, 2005), assumptions that may be challenged by the complexity of some CAFOs (Hristov et al., 2011). To date, there is much previous research on the bLS being used to calculate gas emissions from feedyards (Harper et al., 2004; McGinn et al., 2007; Van Haarlem et al., 2008). Flesch et al. (2004) reported that bLS diagnoses the strength of a small ground-level source with small bias (within 2%), however, Harper et al. (2010a) and Harper et al. (2010b) compared the bLS accuracies to tracer gas studies, showing a nominal bLS accuracy of 100 ± 10%.
bLS model-based WindTrax is an easy-to-use graphical interface designed for the assessment of turbulent transport on the micro-meteorological scale and for simulating short-range atmospheric dispersion (for horizontal distances within about 1 km of the source) using bLS models (Thunder Beach Scientific, available online: http://www.thunderbeachscientific.com/). This program is free, and guidelines and introductions are provided so that users can use them correctly. Before running the program, users should carefully review the associated documentation for detailed guidance on model inputs, options, and best practices.
5 Ammonia emission factors from beef cattle feedyard
Although measurements of NH3 emission have been improved, direct measurements at each feedyard are not feasible due to the time, cost, and labor required. In addition, NH3 emissions in beef cattle feedyards vary greatly depending on the diet (e.g., CP%), environmental conditions (e.g., air T, wind speed, turbulence, and precipitation), and operation-specific management practices (e.g., stocking density, manure storage, feeding management, and manure handling). Thus, measurements taken at one point in time on one feedyard may not accurately capture seasonal and temporal fluxes of emissions that occur due to changes in weather, animal diet, or other management practices (Waldrip et al., 2015). Although the emissions cannot be represented in a single value due to variables in the operation-specific management practices and environment, the need for a standard representing NH3 emissions in general from livestock operations for inventory purposes is being highlighted.
In the past, researchers focused on measuring emissions and comparing them to constant emission factors (EF), which are derived from the literature by selecting data from studies that measured emissions from operations that are assumed to represent production facilities for a specific livestock type and region. Although they are not a perfect standard, constant EF are often used by regulatory agencies and environmental advocacy groups to estimate the footprint of specific animal-production systems (Battye et al., 1994; USEPA, 2004; Eggleston et al., 2006). A review by Faulkner and Shaw (2008) identified a wide range of constant EF for NH3 from beef cattle and proposed an annual NH3 EF of 13.0 kg/animal for beef cattle feedyards, which is the same as that used by the USEPA for inventory purposes (USEPA, 2004). Despite frequent use in setting policy and inventory of emissions, constant EF have proven insufficient for quantifying gas fluxes from many systems, including feedyards (Todd et al., 2013; Waldrip et al., 2013b, 2014). This is because using a single EF and applying it universally cannot account for the previously discussed temporal and spatial differences in management practices and climatic conditions (NRC, 2002, 2003). Therefore, NRC (2003) identified the need for improved resolution in emissions reporting for animal agriculture and recommended a process-based modeling approach that includes mass balance constraints.
Process-based modeling uses mathematical models to simulate the many processes and interactions that occur within a system such as a beef cattle feedyard. Dynamic process-based models that quantify emissions based on classical principles of thermodynamics and kinetics potentially provide a cost-effective method of estimating emissions and evaluating how changing climate and management practices affect emissions from animal agriculture (Waldrip et al., 2015). Representative process-based modeling used to quantify NH3 emissions from beef cattle feedyards includes IHF, modified mass difference approach, flux-gradient technique (ECV), and IDM.
We have summarized results reported to date for NH3 flux (µg/m2/s) and the NH3 EF (per capita emission rates; PCER, g/head/d) using several process-based models by season (Tables 2, 3). Open path laser was often used to measure the NH3 concentration and bLS Inverse dispersion model was widely used to convert the measured NH3 concentration into NH3 emissions from the beef cattle feedyard. A wide range of NH3 flux has been reported, from 2 to 185 µg/m2/s (average 58 µg/m2/s). It was generally found that NH3 flux follows the following order: summer > autumn > spring > winter. Also, a wide range of NH3 emissions have been reported ranging from 24 to 318 g/head/d, and average 119 g/head/d. The highest NH3 emissions were observed in the autumn, but the variation was large in each season, thus, no significant differences were represented between seasons (p > 0.05). It was found that 9 to 116 (average 43) NH3 kg/head/y are emitted annually.
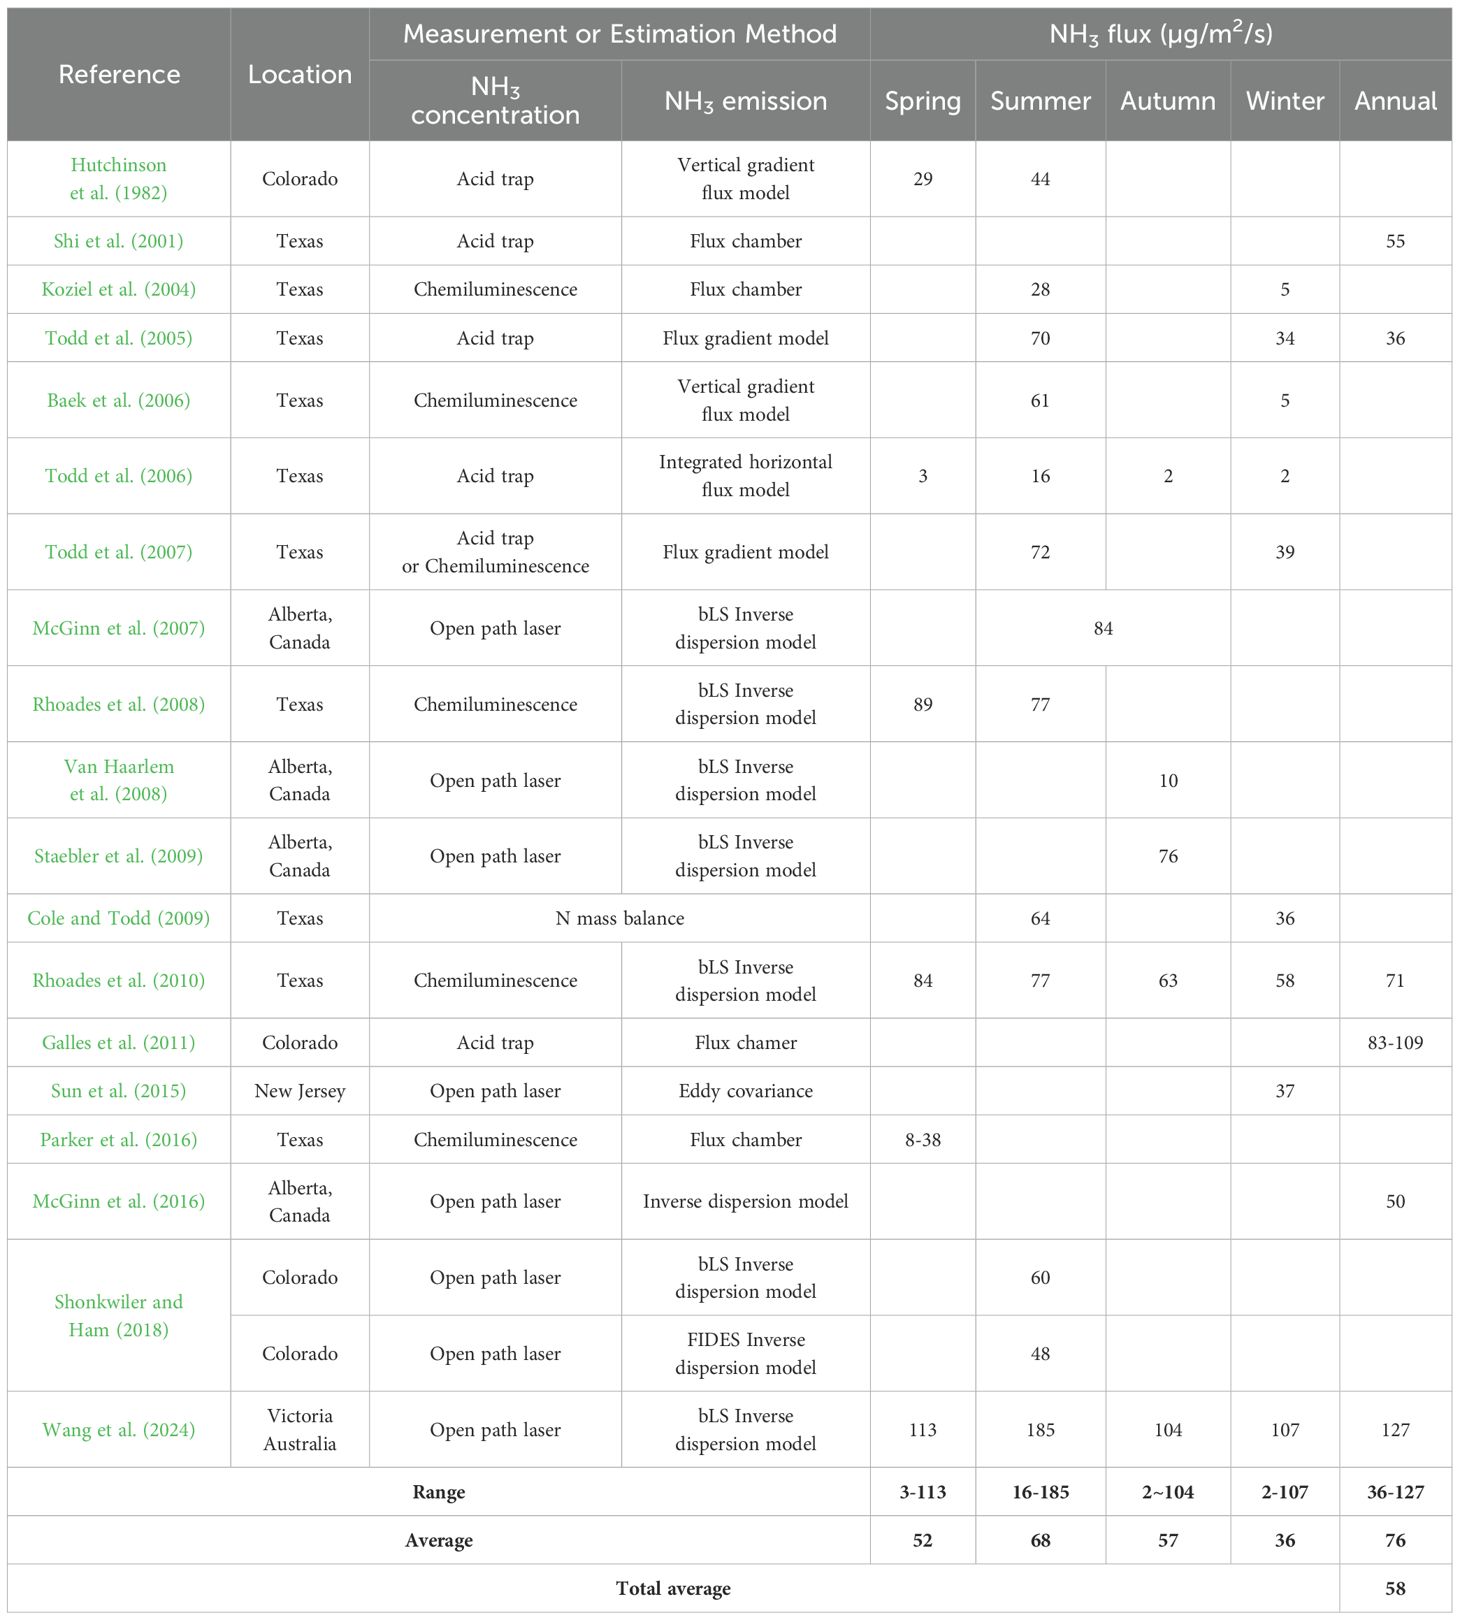
Table 2. Seasonal NH3 flux from beef cattle feedyards.
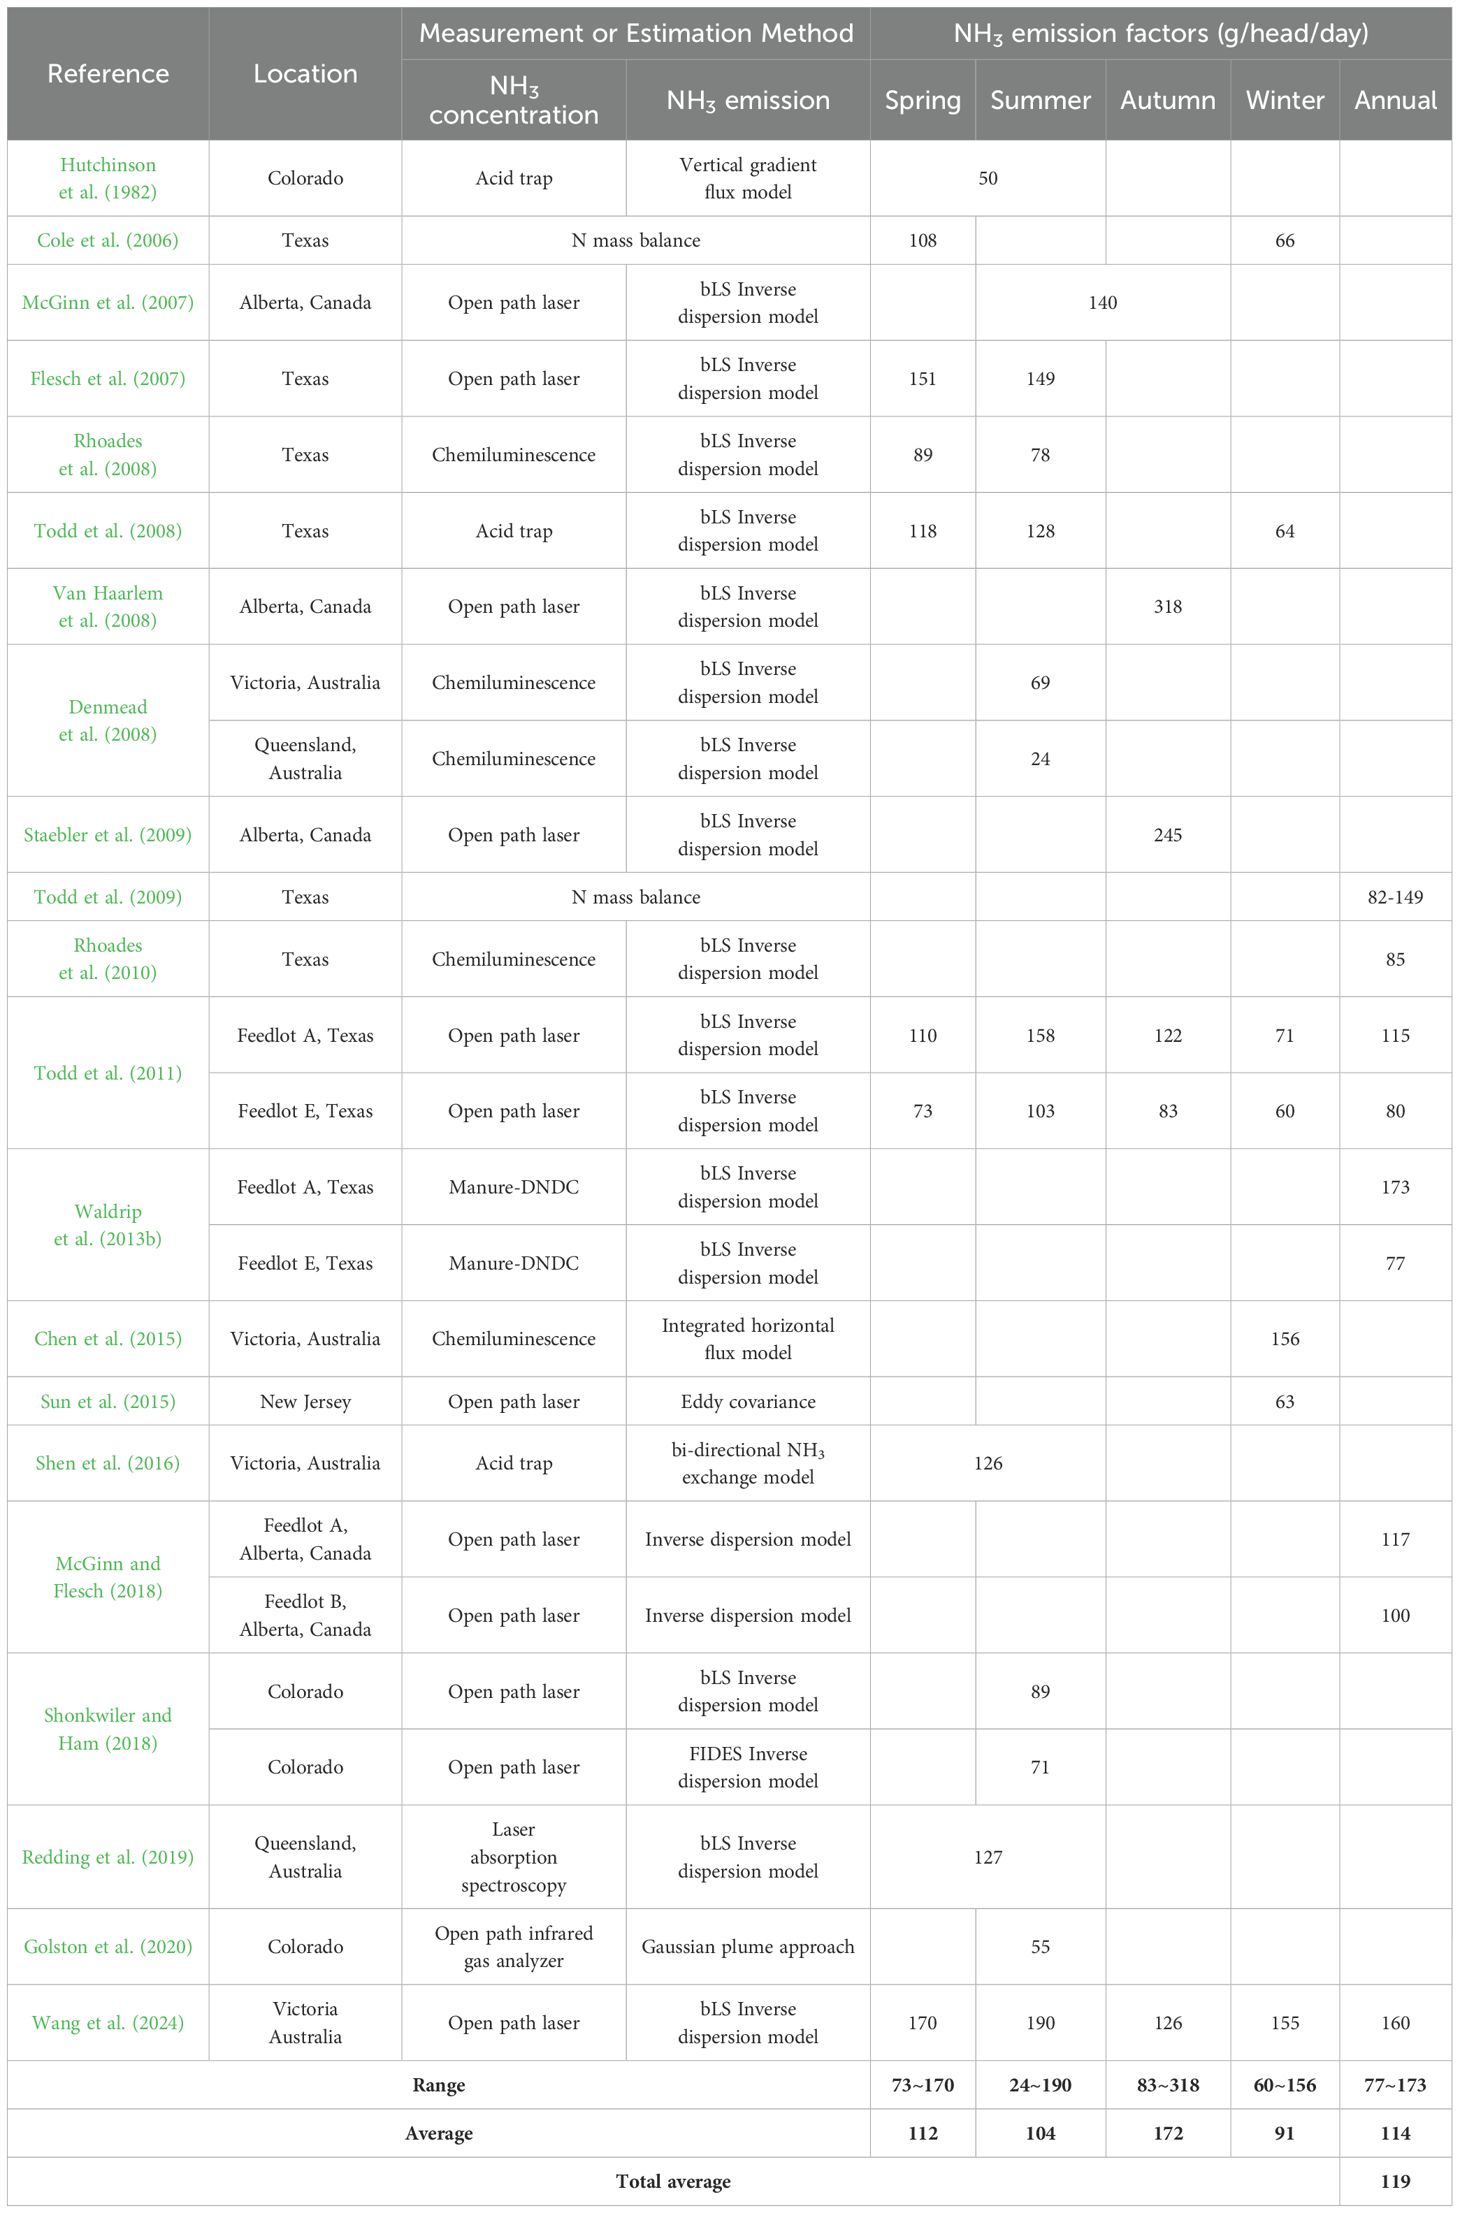
Table 3. Seasonal NH3 emissions from beef cattle feedyards.
Although it is agreed that more realistic NH3 EF are being obtained using process-based models, there is still significant variation of estimated NH3 EF depending on the diet, the model used, and the feedyard environment. This deviation is most likely caused by differences in geographical environment and management implemented in actual feedyards as well as inherent assumptions made in modeling. Therefore, when investigating EF in the future, a detailed description of the environment, diet, and management practices implemented by the feedyard is necessary to evaluate the impact of each category of manure management implemented and the feedyard environment and estimate accurate EF for each scenario. We suggest an investigation list of feedyard environments to aid in assessing NH3 emissions in Table 4. The information on feedyard management and diet reported in the previous papers to date is insufficient to implement this categorization. Improved models and measurement equipment are still needed for estimating more accurate NH3 EF measurements under the ever-changing feedyard environment in the future.
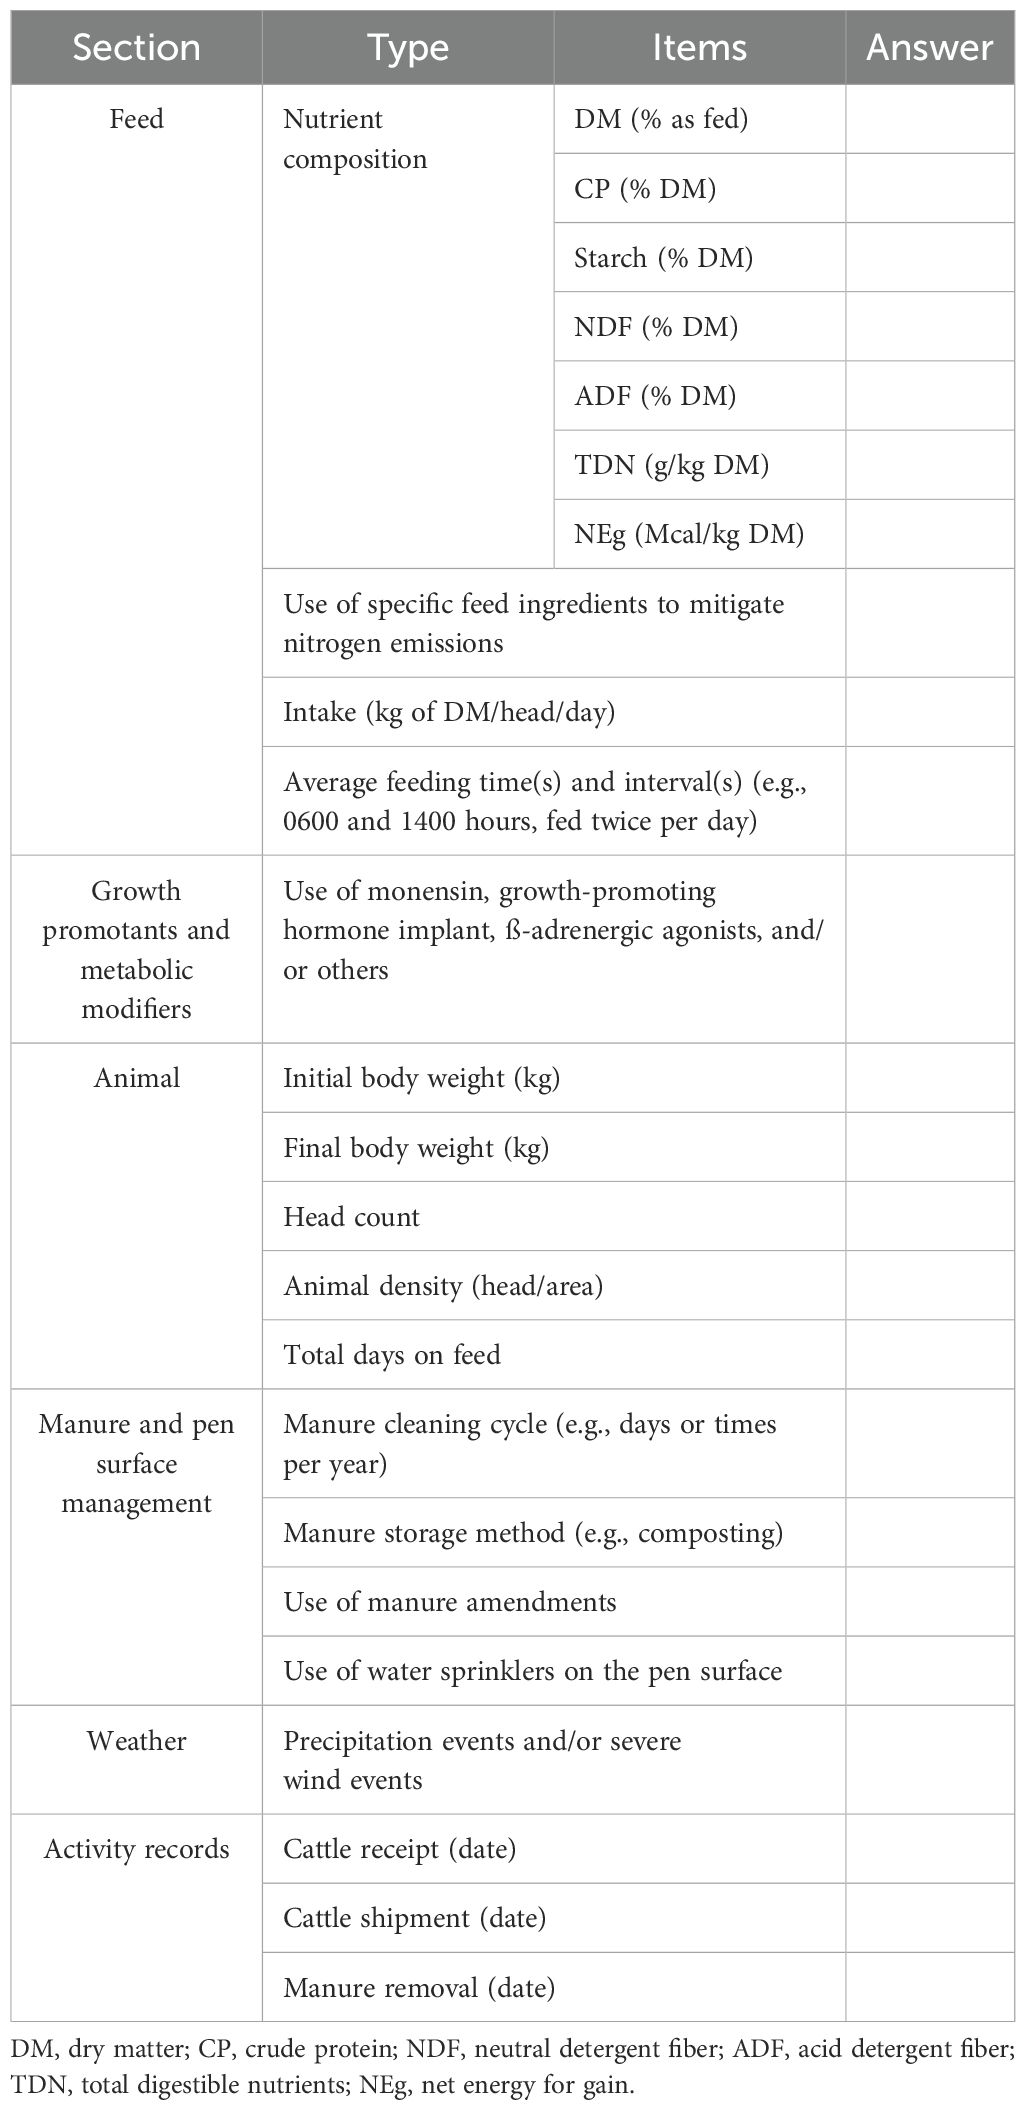
Table 4. Investigation list of feedyard management and environment.
6 Management practices to mitigate ammonia emissions
The major best management practices (BMP) available for use to mitigate NH3 emissions in open-lot livestock facilities have been listed and recommended by USDA-NRCS (Table 5; Brandani et al., 2023). BMP can be divided into management for pre- and post-excretion stages (Waldrip et al., 2015). The primary method of NH3 mitigation in the pre-excretion stage is fundamentally precise diet feeding to meet beef cattle requirements, dietary manipulation to decrease N excretion (e.g., adjusting dietary CP concentration to meet animal’s need through phase feeding or oscillating), and supplementation to increase animal production (e.g., use of growth-promoting technologies). Methods for the post-excretion stage include applying the manure amendments to suppress hydrolysis of excreted urinary urea (e.g., use of urease inhibitors) or to capture (or absorb) the generated NH4+ or NH3 (e.g., use of biochar as absorbents).
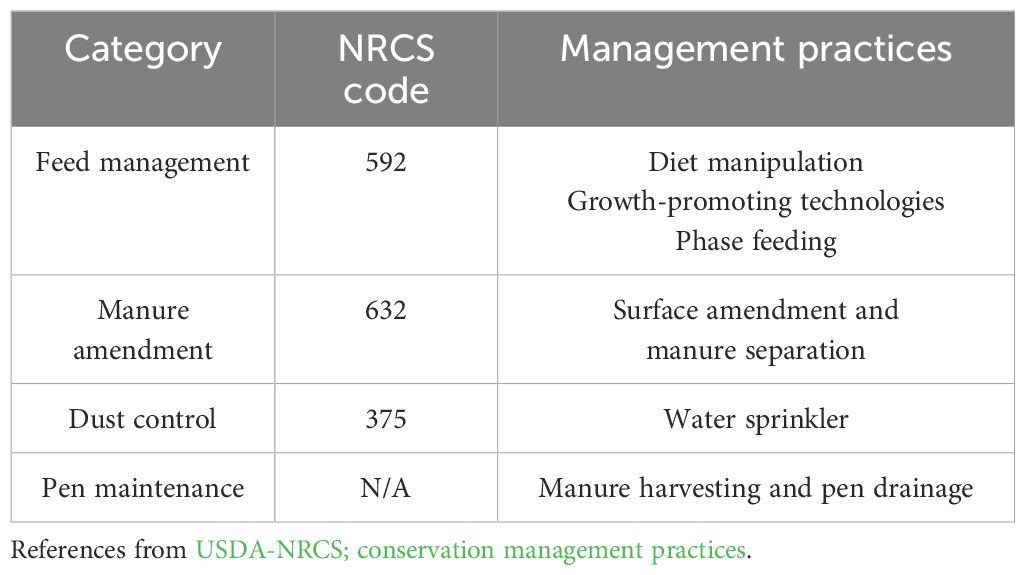
Table 5. Best management practices (BMP) for open-lot livestock facilities to decrease NH3 deposition.
The fundamental solution to mitigate NH3 emission in beef cattle feedyards is to minimize N excretion in manure by optimizing pre-excretion stages management, but there is an intrinsic limitation in achieving this goal due to the inefficient utilization of feed N in the ruminant. The efficiency of N utilization in ruminants is typically low (around 25%) and highly variable (10% to 40%) compared with the higher efficiency of other production animals (Calsamiglia et al., 2010). The low efficiency implies that unutilized N is being released as manure into the environment. The excretion of manure with high N has the potential to increase NH3 emissions into the environment. Any practice or condition that increases manure N content should generally be expected to increase NH3 emissions. With typical finishing diets, approximately 10 to 20% of N intake is retained in animal tissues, 30 to 50% of fed N is excreted in the feces, and 40 to 70% of fed N is excreted in urine (Cole and Todd, 2009). Although it is most likely impossible to dramatically improve the inherently low efficiency of N utilization in cattle, the efficiency of N utilization can be improved through the understanding and modification of factors regulating the efficiency of N utilization in key processes, including N capture in the rumen, protein degradation, digestion and absorption in the GIT and AA utilization in peripheral tissues (Calsamiglia et al., 2010). In addition, proper processing of forages and feed, such as chopping and steam flaking, enhances digestibility, thereby improving feed efficiency. Therefore, the direction we should take to mitigate NH3 emissions in feedyards is to maximize the use of feed N by optimizing the pre-excretion management while simultaneously minimizing the environmental impacts using post-excretion management. The summarized NH3 mitigation practices are organized into the pre- and post-excretion stages below.
6.1 Ammonia mitigation practices in the pre-excretion stage
6.1.1 Precision feeding
The terminology of precision feeding was coined to suggest that livestock feeding can be fine-tuned to maintain or improve performance and better realize other benefits (Reddy and Krishna, 2009). In other words, the ingredients and chemical composition of the diet are modified over the growth stage of the animal so that the nutrient composition of the diet more closely meets the nutrient requirements of the animal and the excreted nutrients in manure are minimized (Brandani et al., 2023). The terminology of precision feeding has expanded its meaning to include mitigating the environmental impacts of animal production while maintaining or improving animal performance. The expansion of the term’s meaning is fundamentally due to the improvement of nutritional models based on the accumulated knowledge of livestock nutrient requirements and use by the animal, along with the development of feeding systems, which have made it possible to feed livestock closer to their requirements, thus reducing wastes (such as wasted feed ingredient, water, manure, and gas emissions) while maintaining or improving animal performance. Details regarding the development of nutritional models, as well as opportunities for improvement in current nutrition models, are presented in the Supplementary Material.
Ideally, a nutritionist can balance animal performance with subsequent effects on the environment using current nutrient models. However, the question remains whether precision feeding can be realistically applied to a commercial beef cattle feedyard (Waldrip et al., 2015). This is because there are several challenges to overcome for precision feeding to be practical. Factors that limit the practicality of precision feeding include (1) variability in animal nutrient requirements, (2) seasonal and climatic effects, (3) variability in the composition of feed ingredients, (4) logistics, and (5) variability in the estimation of DMI (Cole, 2003). Most of these limitations revolve around the risk of adversely affecting animal health or performance and feedyard benefits (Waldrip et al., 2015). For this reason, many nutritionists often incorporate safety margins in their dietary formulations and feeding recommendations to protect against such factors in order to ensure that the diet meets the nutrient requirements of the animal. A practical example of such safety margins is formulating the diet to contain more CP% than is expected to be required to meet the animal’s requirements. However, it is important to note that the decision to overfeed crude protein, as an example, may also be influenced by feed ingredient price and/or availability, such as when ingredient price encourages overfeeding N as a means of minimizing the cost of gain.
Although we acknowledge the practical limitations of implementing precision feeding, scientific advancements to date have led to the development of several effective strategies within precision feeding systems to mitigate NH3 emissions. Representative examples include phase feeding and the use of growth-promoting technologies, which will be discussed in detail next. Dietary protein requirements decrease as cattle mature because of reduced protein deposition and simultaneous increase in fat deposition (Hristov et al., 2011; Waldrip et al., 2015). Phase feeding is a type of precision feeding where dietary protein concentrations are reduced late in the feeding period (Waldrip et al., 2015). Use of growth-promoting technologies are used in tandem with precision feeding strategies to maximize the efficiency and effectiveness of nutrient utilization by cattle, specifically for improving growth, feed efficiency, and production sustainability (Tedeschi et al., 2003). In conclusion, we believe that the factors limiting the practical use of precision feeding can ultimately be alleviated through the accumulation of knowledge and technology development from continued research, although the logistical hurdles of implementation at the feedyard-level remain to be overcome. Addressing these limitations and overcoming these hurdles to the adoption of precision feeding will help to maintain or improve animal performance while minimizing NH3 emissions.
6.1.2 Manipulation of crude protein concentration and protein type
NH3 emissions from beef cattle feedyards are sensitive to dietary CP concentrations (Cole et al., 2005; Todd et al., 2006, 2011). Approximately 25 to 50% of N intake is lost into the atmosphere as NH3 when beef cattle are fed CP to meet their physiological and growth needs (Hristov et al., 2011; Todd et al., 2013). By reducing dietary CP content to match animal needs more closely, more urea recycling is stimulated, overall feed efficiency improves, and N losses are minimized (Galles, 2011). In previous studies, it was reported that NH3 emission, as a consequence of volatilization of excreted N, could be reduced by a maximum of 67% when CP% in the feed was adjusted to around 10-11% from 13-16% (Table 6) in some situations. According to Menezes et al. (2016), the CP% of the diet for Nellore bulls was reduced from 14% to 10%, resulting in no significant difference in animal performance and carcass characteristics. However, it is important to note that reducing dietary CP levels below that required to meet the N needs of rumen fermentation and the AA needs of the animal would be expected to reduce growth performance and feed efficiency under most scenarios (Cole et al., 2005; Proctor, 2023). As a similar strategy to avoid these concerns, the method of phase feeding and oscillating dietary CP, which is the approach to more accurately apply CP according to the growth stage of livestock or environment, has been reported to mitigate N excretion and NH3 emissions (Table 6).
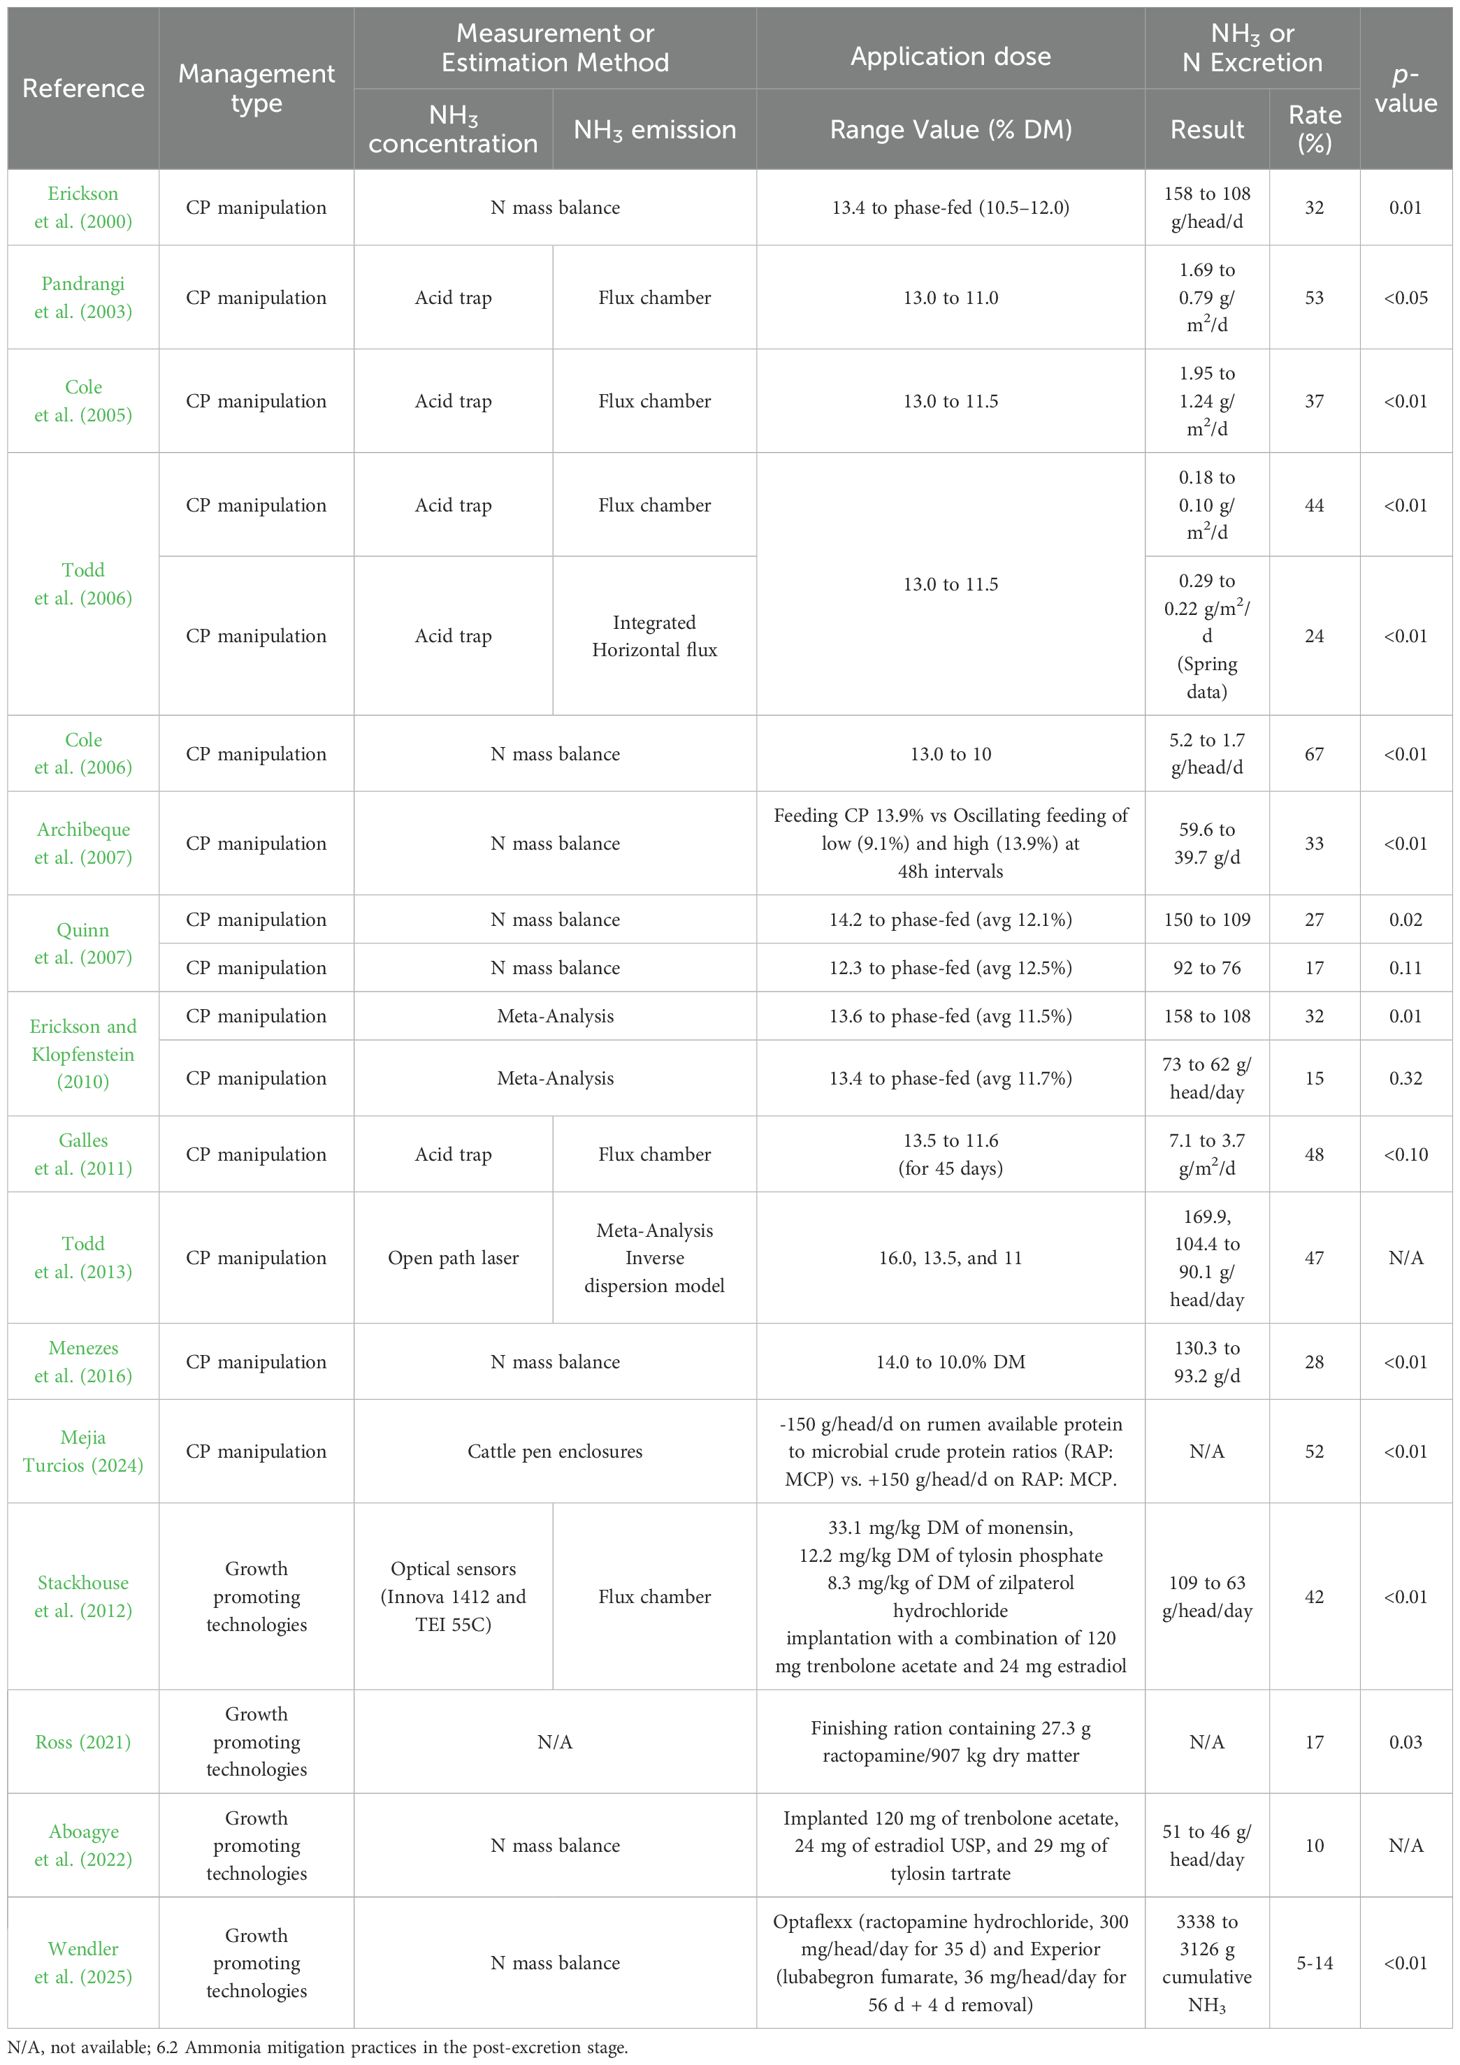
Table 6. Evaluation of management practices to mitigate NH3 emission in the pre-excretion stage.
In addition, manipulating the type of protein source in the diet can be helpful to mitigate N losses in manure. There are two types of protein: rumen degradable protein (RDP) and rumen undegradable protein (RUP). RDP is the protein broken down by the microbes in the rumen and used for microbial growth. RUP is the protein that escapes fermentation in the rumen and is digested in the small intestine. In beef cattle, 40 to 80% of non-retained N is excreted in the urine, and this quantity typically increases as dietary CP and RDP concentrations increase in the diet (NASEM, 2016). Therefore, N excretion can be reduced by increasing the proportion of RUP from the protein source required to satisfy the protein requirements (RDP+RUP) of cattle in the diet. However, it is important to ensure that RDP levels are high enough to satisfy the N requirement of the rumen microorganisms, as a deficiency would be expected to decrease the extent of fermentation and ultimately increase NH3 emission intensity due to decreased feed efficiency. Increasing RUP level is also expected to increase N utilization efficiency by enhancing urea recycling to compensate for rumen microbial requirements due to RDP deficiency. Cole et al. (2005) reported that as RUP among the protein sources in the diet increased, the N excretion emitted from the urine decreased, and it affected the actual mitigation of NH3 emissions. In addition, Batista et al. (2016) reported that corresponding with increased N intake, urinary N excretion was greater with supplementation, but supplementation did not affect fecal N excretion. Nevertheless, in response to RUP, fecal N excretion linearly increased, but urinary N excretion was not affected. In terms of NH3 mitigation in ruminants, it is considered the reduced urinary N excretion will have a more positive effect on mitigating NH3 emissions than the increased fecal N excretion by replacing RDP with RUP. However, there are a few things to consider with RUP. Batista et al. (2016), in their meta-analysis, reported that for diets with around 15% CP, a decrease in the efficiency of the incorporation of recycled N into ruminal microbial N was observed, with an efficiency of around 21%. This indicates that the efficiency of recycled N use is lower from RUP than the efficiency of consumed N use from RDP. Feeding RUP above requirements directly causes N excretion in manure. Also, to take advantage of efficient N recycling as RUP increases, the diet must be formulated to meet the energy requirements. This suggests that without an appropriate energy supply, enhanced N reuse from rumen microorganisms may not be obtained due to the lack of the carbon resources required for microbial protein production, leading only to increased N excretion rather than production of protein sources. In conclusion, decreasing CP concentration in the diet can potentially decrease NH3 emissions, although it also decreases average daily gain, which can increase days on feed, the amount of manure deposited in the pens, and consequent increase in NH3 emissions. Therefore, careful diet manipulation is needed to avoid unintended negative consequences for animal production and the environment.
6.1.3 Growth-promoting technologies
Growth-promoting technologies (implants and feed additives) are commonly used to reduce NH3 emissions by less N excretion through increasing the efficiency of energy use for growth and by low cumulative NH3 emissions from fewer days on feed required to reach finished weight. Although the specific mechanism for increasing productivity by growth-promoting technologies in beef cattle is different, growth-promoting technologies such as hormone implants and ß-adrenergic agonists increase nutrient use for protein synthesis and indirectly lead to decreased lipogenesis (Hutcheson et al., 1997; Nichols et al., 2002; Lean et al., 2014). It was reported that implants enhance both ADG and feed conversion, while implanted cattle often have less marbling and lower quality grades (Preston and Herschler, 1992; Selk, 1999; Ohnoutka et al., 2021). Also, monensin, which is generally included as a growth-promoting technology, is an ionophore antimicrobial that increases overall energy yield from feed and improves animal growth performance by increasing the ratio of propionate to acetate and decreasing the deamination of amino acids through preferentially inhibiting gram-positive bacteria in the rumen (Perry et al., 1976; Russell and Strobel, 1988; Tedeschi et al., 2003). Also, it prevents and controls Coccidiosis caused by Eimeria ssp in ruminants. An increase in protein synthesis with growth-promoting technologies would be expected to reduce N excretion. It has been reported that the use of conventional productivity-enhancing technologies (combination of implant, monensin, tylosin, ß-adrenergic agonists, and others), mitigated NH3 emissions by 10~42%, but the effect of only implants mitigated 17% of NH3 emissions (Stackhouse et al., 2012; Ross, 2021; Aboagye et al., 2022; Table 6). Additionally, the effect of only ß-adrenergic agonists reduced NH3 emissions by 5 to 14% (Wendler et al., 2025; Table 6). The detailed mechanisms and effects of each growth-promoting technology are summarized in Brandani et al. (2023).
6.2 Ammonia mitigation practices in the post-excretion stage
6.2.1 Manure amendments
Manure amendment can be divided into chemical and physical amendments (Brandani et al., 2023). The NH3 mitigation mechanism of chemical amendments is to add chemical compounds to manure to suppress the hydrolysis of excreted urinary urea or to create an environment with low pH, which is an unfavorable condition for NH3 volatilization to occur. Representative examples of chemical amendments include urease inhibitors, N-(n-Butyl) thiophosphoric triamide, calcium chloride, humate, and aluminum sulfate. Physical amendments, such as biochar, carbon-rich material or biomass, bentonite, viscous plastic clay, and zeolite, microporous, crystalline aluminosilicate materials, act to adsorb NH3 before being released into the atmosphere from the pen surface (Brandani et al., 2023).
Evaluation of manure amendment on the open feedyard surface to mitigate NH3 emission has shown a wide range (19 to 98%) in mitigation effectiveness (Table 7). The urease inhibitor reduced NH3 emissions by 26–66% on the manure surface in lab and pilot-scale studies but did not show significant mitigation at the field scale. However, nitrogen fertilizers coated with the urease inhibitors showed a significant mitigation of NH3 emissions on grassland (67-79%). This suggests that further research is needed to determine the best application methods for urease inhibitors to achieve significant NH3 reduction in feedyard manure. The effects of calcium chloride, humate, and aluminum sulfate, which lower the pH and inhibit urease decomposition, resulted in a mitigation rate of 20 to 71% (Shi et al., 2001; Spiehs and Woodbury, 2022) at the lab and pilot scale. As physical amendments, the lignite showed a mitigation rate of 66% (Chen et al., 2015) at the pilot scale. In addition, the mixture of biochar and bentonite showed a mitigation rate of 43%, and a 3% addition of zeolite reduced 10% of NH3 emission (Szymula et al., 2021) at the lab scale. However, the low cost-efficiencies and the negligible financial benefit of NH3 suppression made it challenging for manure amendment to be widely adopted in the feedyard. There is a growing need for technology that is economically advantageous and can be easily adapted to mitigate NH3 emissions in the beef cattle feedyard effectively and at scale. In this respect, water application using sprinklers is one option exhibiting some promise (Lupis et al., 2012).
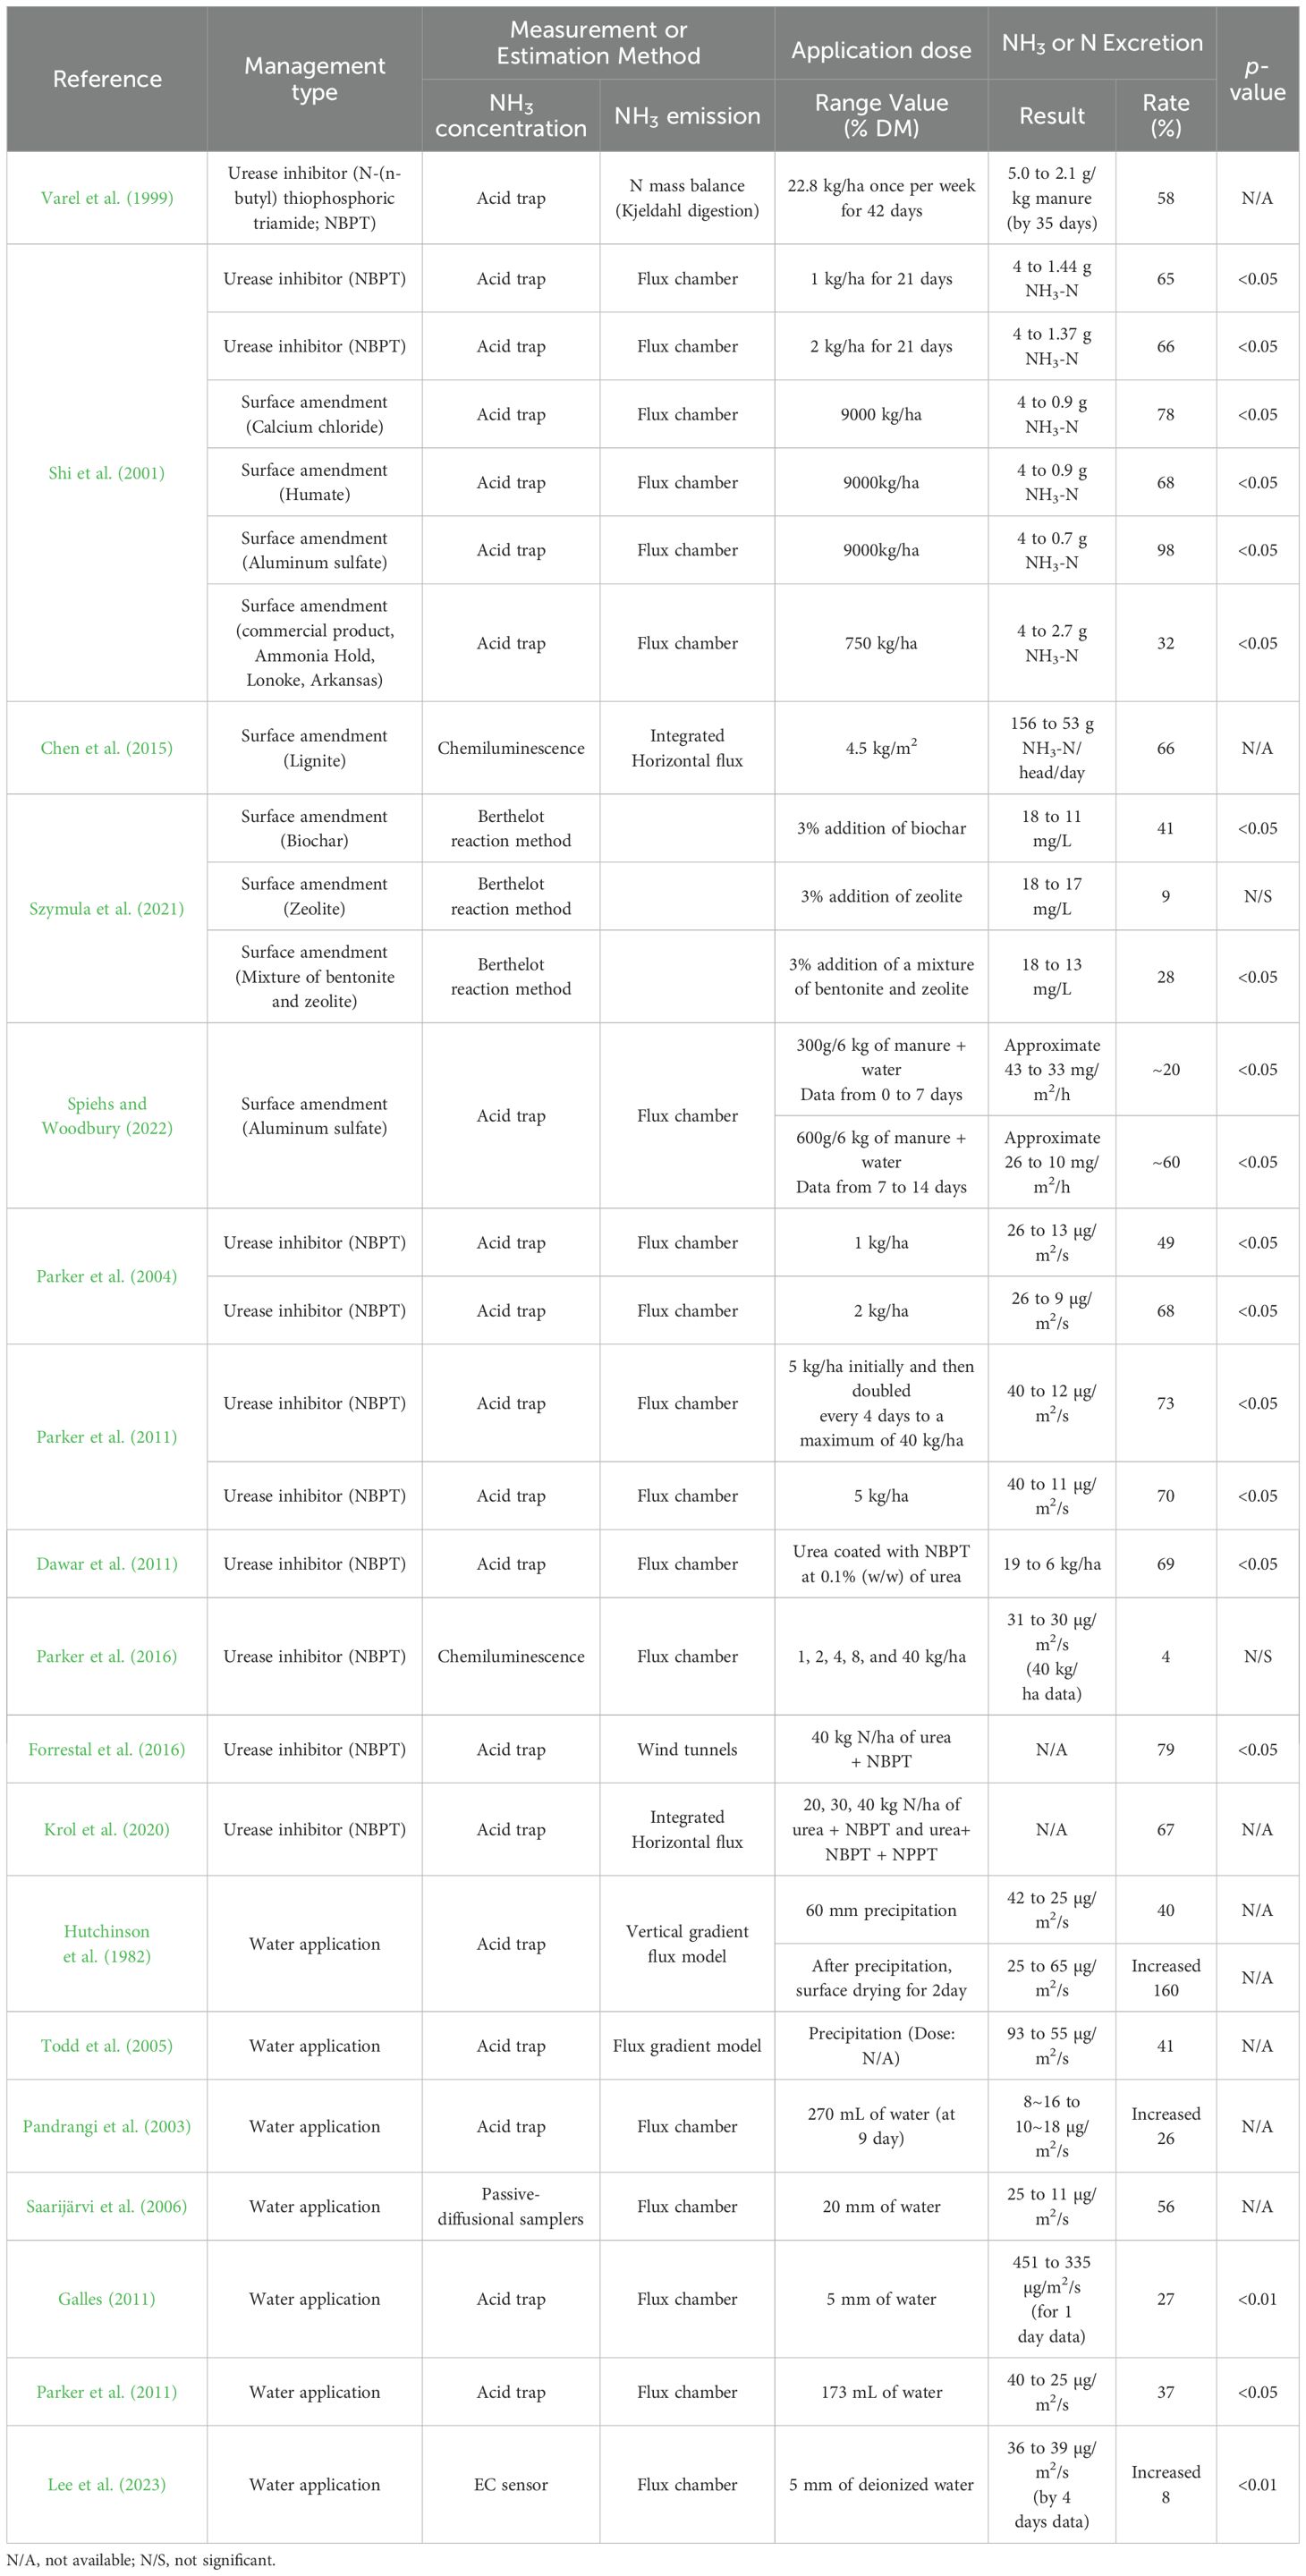
Table 7. Evaluation of management practices to mitigate NH3 emission in the post-excretion stage.
6.2.2 Water application
Water sprinklers are recognized to decrease dust emissions and have been adopted by some to mitigate heat stress for cattle, but they have not been used to mitigate NH3 from the beef cattle feedyard (Brandani et al., 2023). The mechanism of water application to mitigate NH3 comes from a dilution effect, which could relate to the simple leaching of aqueous NH4+ away from the surface or absorption of volatilized NH3. Hutchinson et al. (1982) suggested that precipitation events cause a dramatic increase in the size of the reservoir available for NH3 to exist in solution-diluting the NH4+ concentration and effectively decreasing the area of the air/water interface in the manure, the boundary at which volatilization occurs (40% NH3 mitigation). However, a significant increase in NH3 (160% NH3 generation) was reported two days after precipitation, which leads us to question the temporal impact and whether water application is actually effective in mitigating NH3 emissions in time scales relevant to feedyard management. Therefore, there is still a concern that it may cause more NH3 volatilization in the long term by increasing the microbially mediated production of aqueous NH3 within the water-filled pore space of the manure on the pen surface (Lee et al., 2023). As proof of this, a few studies have reported results contrary to the NH3 mitigation with the water application (Table 7).
In summary, there is scientific agreement that the water application may mitigate NH3 emissions (27~56%) under carefully controlled conditions and over short time scales. However, because of the lack of consensus on the use of water application, there is a concern that the NH3 mitigation due to water sprinkling is temporary and generates more NH3 during the evaporation process, especially when rapid evaporation of water occurs due to hot, windy weather. The impact of the water application on NH3 emissions continues to be investigated and a clearer interpretation of this is expected to emerge in the future.
7 Discussion
The current major hurdle facing cattle feedyards in applying the above BMPs solely for NH3 mitigation is whether the practically achievable benefits justify their costs. To be specific, feed composition is made close to the requirements of cattle with safety margins, and the pre-excretion technologies (e.g., growth-promoting technologies) are used to increase the nutrient-use efficiency of cattle, minimizing the nutrient excretion in most feedyards. According to Legesse et al. (2018), through such improvements in livestock management and in reproductive efficiency, NH3 (kg) emitted per beef (kg) decreased 20% from 1981 to 2011. However, some studies have reported that the expansion of large-scale intensive livestock operations, such as CAFOs, has contributed to increasing total NH3 emissions (Legesse et al., 2018; Schultz et al., 2019; Wyer et al., 2022). Therefore, to mitigate NH3 emissions, higher-precision feeding and active use of pre- and post-excretion practices are necessary. However, overly strict implementation of precision feeding strategies may introduce unintended variability in livestock performance and increase operational costs due to reduced safety margins and the need to modify existing feedyard infrastructure. In addition, post-excretion BMPs constitute essentially unrecoverable expenses unless the BMP facilitates the production of a marketable product. Therefore, the benefits of the practices implemented to mitigate NH3 emissions while bearing additional costs are an important factor in the feedyard’s decision to implement BMP.
High ambient NH3 concentrations (average 42 ppm) have been reported to have a negative impact on the bovine lungs in respiration chamber-scale experiments, leading to increased total white cell and mononucleated cell counts (p< 0.05, Accioly et al., 2004). However, a knowledge gap exists on the effect of ambient NH3 concentrations in the feedyard on animal productivity. Reported background concentrations of NH3 at feedyards typically range from<1 to 2000 µg/m3 (0–3 ppm at 25 °C, 1 atm; Todd et al., 2005; Hristov et al., 2011). However, as highlighted by Hristov et al. (2011), the concentration of atmospheric NH3 is highly variable in various forms (gas, particulate, and liquid) and depends on the presence of other compounds. Consequently, NH3 concentrations are subject to considerable variability due to a combination of environmental and feedyard management factors, and under certain conditions, concentrations may reach levels that can potentially affect animal productivity. Additional research is needed to evaluate potential productivity improvement and its link to mitigating NH3. Such studies could support the necessity of NH3 mitigation efforts and offer practical benefits for livestock operations.
Based on the results currently reported, the following additional benefits can be considered for the use of BMP related to NH3 mitigation. Precision feeding and diet manipulation aims to provide nutrient supply more precisely with the nutrient requirements, thus the benefits include economic returns through reduced excretion to the environment and improved efficiency of resource utilization by leading to decreased feed intake and thereby decreased enteric CH4 emissions (Zuidhof, 2020; Galyean and Hales, 2023). Growth-promoting technologies increase the efficiency of energy and nutrient use, thereby increasing animal productivity and mitigating environmental effects while reducing the amount of time required to finish cattle. As an example, ionophores, one of the growth-promoting technologies, may decrease protein degradation in the rumen, increase feed protein utilization, and reduce N losses (Tedeschi et al., 2003). In addition, it can decrease feed intake (4%) without affecting animal performance, and mitigate 25% of enteric CH4 emissions (Tedeschi et al., 2003).
In the case of manure amendment, it is not directly related to animal performance, but it is related to benefits for manure value (C:N ratio) and the mitigation of other gases (H2S, GHGs, and VOCs). The C:N ratio in manure could vary greatly depending on diet, manure storage, manure management, and feedyard environments. It is generally reported that the C:N ratio of beef and dairy manure is 10 to 15:1 (Okopi et al., 2024). While close to the optimal C:N ratio (20 to 30:1) for net N mobilization through soil microorganisms (Hadas et al., 1992), manure C is insufficient in most cases. Manure amendments, which are a C source and particularly physical amendment, can improve C:N ratio and a MC (50-70%) for composting and land application. In addition, manure amendments have been reported to be effective in mitigating various gas emissions from cattle manure (Wheeler et al., 2011; Spiehs et al., 2019; Kaikiti et al., 2021; Chen et al., 2024). However, manure amendment could cause secondary air pollution from physical amendment (e.g., PM from biochar, Gelardi et al., 2019) or chemicals (e.g., CH4 and H2S from aluminum sulfate, Spiehs et al., 2019) added to prevent NH3 gas volatilization. Since research on manure amendments has focused on target gas mitigation, there has been little research on the generation of by-products or gases after application (Maurer et al., 2016). It is important to be cautious when using the amendments to avoid secondary, perverse effects.
Lastly, the practice of water application was proposed as a method to reduce heat stress in terms of animal production, but it could potentially improve feed efficiency during the summer (Mader and Davis, 2004). Water application may be a cost-effective solution for industry PM control in some circumstances (Yonkofski et al., 2019), and it has been reported to have the mitigation effect of other gases (GHGs such as CH4 and N2O) as well (Parker et al., 2021). Precipitation, which is the natural way to apply water, was observed to mitigate the emission of CH4 and N2O below detection levels for several days after the precipitation event in the feedyard (Parker et al., 2021). In lab-scale experiments, increased N2O emission has been observed after precipitation for several days (Parker et al., 2017, 2018), but this phenomenon has not been observed on the field scale (Parker et al., 2021). Further research is still needed because there are concerns about more gas volatilization during the drying process after water application and practical research is necessary into how water can be applied to feedyards as precipitation to achieve beneficial effects.
The direction we should take to mitigate NH3 emissions in feedyards is to maximize N-use efficiency of beef cattle by optimizing the pre-excretion management while simultaneously minimizing the environmental impacts using post-excretion management. To encourage the adoption of a given management practice, more research is needed to quantify its benefits, to describe as fully as possible the conditions under which those benefits may be realized in practice and at scale, to develop new promising practices, and to reckon transparently with a practice’s perverse effects, if any.
8 Conclusion
NH3 emitted from beef cattle feedyards is a high-profile environmental concern because of health hazards, its contribution to fine particulate formation, and contamination of air and surface waters. Mitigation of NH3 emissions addresses social concerns, minimizes the risk of undesirable environmental events, and is important to the sustainability of the beef industry. In this review, we reported the state of the science concerning NH3 emissions from beef cattle feedyards, methods for quantifying NH3 emissions, NH3 EF, and some management practices to mitigate NH3. Ammonia emissions primarily come from urinary urea in cattle manure on feedyard surfaces. A significant portion of the N in the manure is converted to NH4+ and is eventually volatilized to the atmosphere as NH3. In the past, constant EFs were used to inventory NH3 emissions. Currently, NH3 EF estimated by process-based mechanistic models reflecting various factors affecting NH3 emissions in the feedyard environment are available. As process-based mechanistic models, the backward Lagrangian stochastic model was widely used to convert NH3 concentration measurements into emissions in the beef cattle feedyard. This review of current literature indicated the average NH3 emissions from the cattle feedyard as 119 g/head/day (ranging from 24 to 318 g/head/day), and the average NH3 flux rate as 58 µg/m2/s (ranging from 2 to 185 µg/m2/s). Although it is agreed that more realistic NH3 EF are being obtained using process-based models, there is still significant variation of estimated NH3 EF depending on the diet composition, the manure management, and the feedyard environment. We note the need to improve inventories of NH3 emissions into categories of manure management implemented and feedyard environment. Some mitigation strategies can be effective, such as manipulating the diet to reduce N excretion, increasing animal performance with growth-promoting technologies, and using manure amendments. Of those, precision diet feeding to meet, but not exceed, protein requirements appears to be the most practical way to reduce N losses. However, careful diet manipulation and additional research are needed to avoid unintended negative consequences for animal production.
Author contributions
ML: Data curation, Formal Analysis, Investigation, Visualization, Writing – original draft, Writing – review & editing. BA: Conceptualization, Funding acquisition, Methodology, Project administration, Resources, Supervision, Validation, Writing – original draft, Writing – review & editing. LT: Methodology, Resources, Validation, Writing – review & editing. JK: Methodology, Resources, Validation, Writing – review & editing. CB: Resources, Validation, Writing – review & editing. VG: Resources, Validation, Writing – review & editing. JS: Resources, Validation, Writing – review & editing. KC: Resources, Validation, Writing – review & editing.
Funding
The author(s) declare that financial support was received for the research and/or publication of this article. This research was funded by the NRCS Conservation Innovation Grant (project number NR213A750013G037), and additional support was provided by the Colorado Livestock Association.
Conflict of interest
The authors declare that the research was conducted in the absence of any commercial or financial relationships that could be construed as a potential conflict of interest.
Generative AI statement
The author(s) declare that no Generative AI was used in the creation of this manuscript.
Publisher’s note
All claims expressed in this article are solely those of the authors and do not necessarily represent those of their affiliated organizations, or those of the publisher, the editors and the reviewers. Any product that may be evaluated in this article, or claim that may be made by its manufacturer, is not guaranteed or endorsed by the publisher.
Supplementary material
The Supplementary Material for this article can be found online at: https://www.frontiersin.org/articles/10.3389/fanim.2025.1608387/full#supplementary-material
References
Aboagye I. A., Cordeiro M. R., McAllister T. A., May M. L., Hannon S. J., Booker C. W., et al. (2022). Environmental performance of commercial beef production systems utilizing conventional productivity-enhancing technologies. Trans. Anim. Sci. 6, txac074. doi: 10.1093/tas/txac074
Accioly J. M., Taylor E. G., Costa N. D., Pethick D. W., White C. L., Pluske J. R., et al. (2004). Effect of atmospheric ammonia on bovine lung. Sci. Access 1, 1–4. doi: 10.1071/SA0401001
Aguado D., Noriega-Hevia G., Ferrer J., Seco A., and Serralta J. (2022). PLS-based soft-sensor to predict ammonium concentration evolution in hollow fibre membrane contactors for nitrogen recovery. J. Water Process Eng. 47, 102735. doi: 10.1016/j.jwpe.2022.102735
Archibeque S. L., Freetly H. C., Cole N. A., and Ferrell C. L. (2007). The influence of oscillating dietary protein concentrations on finishing cattle. II. Nutrient retention and ammonia emissions. J. Anim. Sci. 85, 1496–1503. doi: 10.2527/jas.2006-208
Arogo J., Westerman P. W., Heber A. J., Robarge W. P., and Classen J. J. (2006). “Ammonia emissions from animal feeding operations,” in 2006 ASABE Annual International Meeting. 1 (St. Joseph, Michigan: American Society of Agricultural and Biological Engineers). doi: 10.13031/2013.20247
Baek B. H., Todd R., Cole N. A., and Koziel J. A. (2006). Ammonia and hydrogen sulphide flux and dry deposition velocity estimates using vertical gradient method at a commercial beef cattle feedlot. Int. J. Global Environ. Issues 6, 189–203. doi: 10.1504/IJGENVI.2006.010154
Baldacchini G., Marchetti S., and Montelatici V. (1981). Diode laser measurements of NH3 absorption lines over the range 931–954 cm– 1. J. Mol. Spectrosc. 86, 115–121. doi: 10.1016/0022-2852(81)90109-0
Batista E. D., Detmann E., Titgemeyer E. C., Valadares Filho S. C., Valadares R. F. D., Prates L. L., et al. (2016). Effects of varying ruminally undegradable protein supplementation on forage digestion, nitrogen metabolism, and urea kinetics in Nellore cattle fed low-quality tropical forage. J. Anim. Sci. 94, 201–216. doi: 10.2527/jas.2015-9493
Battye R., Battye W., Overcash C., and Fudge S. (1994). Development and selection of ammonia emission factors (Washington D.C.: U.S. Environmental Protection Agency, Contract number 68-D3-0034).
Benedict K. B., Day D., Schwandner F. M., Kreidenweis S. M., Schichtel B., Malm W. C., et al. (2013). Observations of atmospheric reactive nitrogen species in Rocky Mountain National Park and across northern Colorado. Atmospheric Environ. 64, 66–76. doi: 10.1016/j.atmosenv.2012.08.066
Bonifacio H. F., Maghirang R. G., Razote E. B., Trabue S. L., and Prueger J. H. (2013). Comparison of AERMOD and WindTrax dispersion models in determining PM10 emission rates from a beef cattle feedlot. J. Air Waste Manage. Assoc. 63, 545–556. doi: 10.1080/10962247.2013.768311
Brandani C. B., Lee M., Auvermann B. W., Parker D. B., Casey K. D., Crosman E. T., et al. (2023). Mitigating ammonia deposition derived from open-lot livestock facilities into Colorado’s Rocky Mountain National Park: State of the science. Atmosphere 14, 1469. doi: 10.3390/atmos14101469
Bristow A. W., Whitehead D. C., and Cockburn J. E. (1992). Nitrogenous constituents in the urine of cattle, sheep and goats. J. Sci. Food Agric. 59, 387–394. doi: 10.1002/jsfa.2740590316
Bussink D. W. and Oenema O. (1998). Ammonia volatilization from dairy farming systems in temperate areas: a review. Nutrient Cycling Agroecosystems 51, 19–33. doi: 10.1023/A:1009747109538
Calsamiglia S., Ferret A., Reynolds C. K., Kristensen N. B., and Van Vuuren A. M. (2010). Strategies for optimizing nitrogen use by ruminants. Animal 4, 1184–1196. doi: 10.1017/S1751731110000911
Chen B., Koziel J. A., Bialowiec A., and O’Brien S. C. (2024). The potential role of biochar in mitigating gaseous emissions from livestock waste–A mini-review. J. Environ. Manage. 370, 122692. doi: 10.1016/j.jenvman.2024.122692
Chen D., Sun J., Bai M., Dassanayake K. B., Denmead O. T., and Hill J. (2015). A new cost-effective method to mitigate ammonia loss from intensive cattle feedlots: application of lignite. Sci. Rep. 5, 16689. doi: 10.1038/srep16689
Cofie O., Nikiema J., Impraim R., Adamtey N., Paul J., and Koné D. (2016). Co-composting of solid waste and fecal sludge for nutrient and organic matter recovery Vol. 3 (IWMI. CGIAR Research program on Water, Land and Ecosystems), 47. doi: 10.5337/2016.204
Cole N. A. (2003). “Precision feeding: Opportunities and limitations,” in Proc. Plains Nutr. Council Spring Conf. Publ. No. AREC, 03-13. (Texas).
Cole N. A., Clark R. N., Todd R. W., Richardson C. R., Gueye A., Greene L. W., et al. (2005). Influence of dietary crude protein concentration and source on potential ammonia emissions from beef cattle manure. J. Anim. Sci. 83, 722–731. doi: 10.2527/2005.833722x
Cole N. A., Defoor P. J., Galyean M. L., Duff G. C., and Gleghorn J. F. (2006). Effects of phase-feeding of crude protein on performance, carcass characteristics, serum urea nitrogen concentrations, and manure nitrogen of finishing beef steers. J. Anim. Sci. 84, 3421–3432. doi: 10.2527/jas.2006-150
Cole N. A. and Todd R. W. (2009). “Nitrogen and phosphorus balance of beef cattle feedyards,” in Proceedings of the Texas animal manure management issues conference, TX, USA. 17–24 (St. Joseph, Michigan: Round Rock).
Colmenero J. O. and Broderick G. A. (2006). Effect of dietary crude protein concentration on milk production and nitrogen utilization in lactating dairy cows. J. Dairy Sci. 89, 1704–1712. doi: 10.3168/jds.S0022-0302(06)72238-X
Dawar K., Zaman M., Rowarth J. S., Blennerhassett J., and Turnbull M. H. (2011). Urease inhibitor reduces N losses and improves plant-bioavailability of urea applied in fine particle and granular forms under field conditions. Agriculture, Ecosystems & Environment 144 (1), 41–50. doi: 10.1016/j.agee.2011.08.007
Denmead O. T., Chen D., Griffith D. W. T., Loh Z. M., Bai M., and Naylor T. (2008). Emissions of the indirect greenhouse gases NH3 and NOx from Australian beef cattle feedlots. Australian. J. Exp. Agric. 48, 213–218. doi: 10.1071/EA07276
Eggleston H. S., Buendia L., Miwa K., Ngara T., and Tanabe K. (2006). 2006 IPCC guidelines for national greenhouse gas inventories (Kanagawa, Japan: U.S. Department of Energy Office of Scientific and Technical Information). Available at: https://www.osti.gov/etdeweb/biblio/20880391.
Emerson K., Russo R. C., Lund R. E., and Thurston R. V. (1975). Aqueous ammonia equilibrium calculations: effect of pH and temperature. J. Fisheries Board Canada 32, 2379–2383. doi: 10.1139/f75-274
Erickson G. and Klopfenstein T. (2010). Nutritional and management methods to decrease nitrogen losses from beef feedlots. J. Anim. Sci. 88, E172–E180. doi: 10.2527/jas.2009-2358
Erickson G. E., Milton C. T., and Klopfenstein T. J. (2000). “Dietary protein effects on nitrogen excretion and volatilization in open-dirt feedlots,” in Animal, agricultural and food processsing wastes. Proceedings of the Eighth International Symposium, Des Moines, Iowa, USA, Vol. 9. 297–304. doi: 10.5555/20013011378
Faulkner W. B. and Shaw B. W. (2008). Review of ammonia emission factors for United States animal agriculture. Atmospheric Environ. 42, 6567–6574. doi: 10.1016/j.atmosenv.2008.04.021
Flesch T. K. and Wilson J. D. (2005). Estimating tracer emissions with a backward Lagrangian stochastic technique. Micrometeorol. Agric. Syst. 47, 513–531. doi: 10.2134/agronmonogr47.c22
Flesch T. K., Wilson J. D., Harper L. A., Crenna B. P., and Sharpe R. R. (2004). Deducing ground-to-air emissions from observed trace gas concentrations: A field trial. J. Appl. Meteorol. Climatol. 43, 487–502. doi: 10.1175/1520-0450(2004)043<0487:DGEFOT>2.0.CO;2
Flesch T. K., Wilson J. D., Harper L. A., Todd R. W., and Cole N. A. (2007). Determining ammonia emissions from a cattle feedlot with an inverse dispersion technique. Agric. For. Meteorol. 144, 139–155. doi: 10.1016/j.agrformet.2007.02.006
Flesch T. K., Wilson J. D., and Yee E. (1995). Backward-time Lagrangian stochastic dispersion models and their application to estimate gaseous emissions. J. Appl. Meteorol. Climatol. 34, 1320–1332. doi: 10.1175/1520-0450(1995)034<1320:BTLSDM>2.0.CO;2
Forrestal P. J., Harty M., Carolan R., Lanigan G. J., Watson C. J., Laughlin R. J, et al. (2016). Ammonia emissions from urea, stabilized urea and calcium ammonium nitrate: insights into loss abatement intemperate grassland. Soil Use and Management 32, doi: 92-100. doi: 10.1111/sum.12232
Freney J. R. and Simpson J. R. (2013). Gaseous loss of nitrogen from plant-soil systems Vol. 9 (Springer Science & Business Media). doi: 10.1007/978-94-017-1662-8
Galles K. J. (2011). Practical strategies for reducing ammonia volatilization from feedlots along Colorado’s Front Range. (Master thesis), Colorado State University, Fort Collins, Clorado.
Galles K. J., Ham J., Westover E., Stratton J., Wagner J., Engle T., et al. (2011). Influence of reduced nitrogen diets on ammonia emissions from cattle feedlot pens. Atmosphere 2, 655–670. doi: 10.3390/atmos2040655
Galyean M. L. and Hales K. E. (2023). Feeding management strategies to mitigate methane and improve production efficiency in feedlot cattle. Animals 13, 758. doi: 10.3390/ani13040758
Gelardi D. L., Li C., and Parikh S. J. (2019). An emerging environmental concern: Biochar-induced dust emissions and their potentially toxic properties. Sci. Total Environ. 678, 813–820. doi: 10.1016/j.scitotenv.2019.05.007
Golston L. M., Pan D., Sun K., Tao L., Zondlo M. A., Eilerman S. J., et al. (2020). Variability of ammonia and methane emissions from animal feeding operations in northeastern Colorado. Environ. Sci. Technol. 54, 11015–11024. doi: 10.1021/acs.est.0c00301
Goodliff M., Fletcher S., Kliewer A., Forsythe J., and Jones A. (2020). Detection of non-Gaussian behavior using machine learning techniques: a case study on the Lorenz 63 model. J. Geophysical Research: Atmospheres 125, e2019JD031551. doi: 10.1029/2019JD031551
Gu B., Zhang L., Van Dingenen R., Vieno M., Van Grinsven H. J., Zhang X., et al. (2021). Abating ammonia is more cost-effective than nitrogen oxides for mitigating PM2.5 air pollution. Science 374, 758–762. doi: 10.1126/science.abf8623
Hadas A., Feigenbaum S., Molina J. A. E., and Clapp C. E. (1992). Factors affecting nitrogen immobilization in soil as estimated by simulation models. Soil Sci. Soc. America J. 56, 1481–1486. doi: 10.2136/sssaj1992.03615995005600050024x
Harper L. A. (2005). Ammonia: measurement issues. Micrometeorol. Agric. Syst. 47, 345–379. doi: 10.2134/agronmonogr47.c15
Harper L. A., Denmead O. T., and Flesch T. K. (2011). Micrometeorological techniques for measurement of enteric greenhouse gas emissions. Anim. Feed Sci. Technol. 166, 227–239. doi: 10.1016/j.anifeedsci.2011.04.013
Harper L. A., Flesch T. K., Weaver K. H., and Wilson J. D. (2010b). The effect of biofuel production on swine farm methane and ammonia emissions. J. Environ. Qual. 39, 1984–1992. doi: 10.2134/jeq2010.0172
Harper L. A., Flesch T. K., and Wilson J. D. (2010a). Ammonia emissions from broiler production in the San Joaquin Valley. Poultry Sci. 89, 1802–1814. doi: 10.3382/ps.2010-00718
Harper L. A., Sharpe R. R., Parkin T. B., De Visscher A., Van Cleemput O., and Byers F. M. (2004). Nitrogen cycling through swine production systems: Ammonia, dinitrogen, and nitrous oxide emissions. J. Environ. Qual. 33, 1189–1201. doi: 10.2134/jeq2004.1189
Hermanussen J., Bizzarri A., and Baldacchini G. (1986). Diode laser measurements of ammonia absorption lines over the range 620–740 cm– 1. J. Mol. Spectrosc. 119, 291–298. doi: 10.1016/0022-2852(86)90025-1
Horton H. R., Moran L. A., Scrimgeour K. G., Perry M. D., and Rawn J. D. (2006). “Principles of biochemistry,” in Principles of biochemistry (New Jersey: Pearson College Div), 852–852.
Hribar C. (2010). Understanding concentrated animal feeding operations and their impact on communities (National Association of Local Boards of Health, Bowling Green, Ohio: Centers for Disease Control and Prevention). Available at: https://stacks.cdc.gov/view/cdc/59792.
Hristov A. N., Hanigan M., Cole A., Todd R., McAllister T. A., Ndegwa P. M., et al. (2011). Ammonia emissions from dairy farms and beef feedlots. Can. J. Anim. Sci. 91, 1–35. doi: 10.4141/CJAS10034
Hristov A. N. and Jouany J. P. (2005). “Factors affecting the efficiency of nitrogen utilization in the rumen,” in Nitrogen and phosphorus nutrition of cattle: reducing the environmental impact of cattle operations, (CABI Digital Library) 117–166. doi: 10.1079/9780851990132.0117
Hutcheson J. P., Johnson D. E., Gerken C. L., Morgan J. B., and Tatum J. D. (1997). Anabolic implant effects on visceral organ mass, chemical body composition, and estimated energetic efficiency in cloned (genetically identical) beef steers. J. Anim. Sci. 75, 2620–2626. doi: 10.2527/1997.75102620x
Hutchinson G. L., Mosier A. R., and Andre C. E. (1982). Ammonia and amine emissions from a large cattle feedlot. J. Environ. Qual. 11, 288–293. doi: 10.2134/jeq1982.00472425001100020028x
James T., Meyer D., Esparza E., Depeters E. J., and Perez-Monti H. (1999). Effects of dietary nitrogen manipulation on ammonia volatilization from manure from Holstein heifers. J. Dairy Sci. 82, 2430–2439. doi: 10.3168/jds.S0022-0302(99)75494-9
Kaikiti K., Stylianou M., and Agapiou A. (2021). Use of biochar for the sorption of volatile organic compounds (VOCs) emitted from cattle manure. Environ. Sci. pollut. Res. 28, 59141–59149. doi: 10.1007/s11356-020-09545-y
Koziel J. A., Baek B. H., Spinhirne J. P., Parker D., and Cole N. A. (2004). “Emissions of ammonia and hydrogen sulfide from beef cattle pens in Texas,” in In the proceedings of the AgEng, ‘Engineering the Future’ conference, Leuven, Belgium.
Krol D. J., Forrestal P. J., Wall D., Lanigan G. J., Sanz-Gomez J., and Richards K. G. (2020). Nitrogen fertilisers with urease inhibitors reduce nitrous oxide and ammonia losses, while retaining yield in temperate grassland. Sci. Total Environ. 725, 138329. doi: 10.1016/j.scitotenv.2020.138329
Lean I. J., Thompson J. M., and Dunshea F. R. (2014). A meta-analysis of zilpaterol and ractopamine effects on feedlot performance, carcass traits and shear strength of meat in cattle. PloS One 9, e115904. doi: 10.1371/journal.pone.0115904
Lee M., Brandani C. B., Bush K. J., Ferguson G. B., Willis W., Campbell T. N., et al. (2023). “The effect of water application on ammonia emissions from open-lot livestock-feeding surfaces,” in 2023 ASABE Annual International Meeting (St. Joseph, Michigan: American Society of Agricultural and Biological Engineers). doi: 10.13031/aim.223011050
Lee C. and Hristov A. N. (2010). Origin of ammonia nitrogen volatilized from dairy manure. J. Dairy Sci. 93, 691–691.
Lee C., Hristov A. N., and Silva S. (2009). Effect of ammonia volatilization on manure nitrogen isotope composition. J. Dairy Sci. 92, 146.
Legesse G., Kroebel R., Alemu A. W., Ominski K. H., McGeough E. J., Beauchemin K. A., et al. (2018). Effect of changes in management practices and animal performance on ammonia emissions from Canadian beef production in 1981 as compared with 2011. Can. J. Anim. Sci. 98, 833–844. doi: 10.1139/cjas-2017-0184
Li S. and Du K. (2020). Comparisons of forward-in-time and backward-in-time Lagrangian stochastic dispersion models for micro-scale atmospheric dispersion. J. Air Waste Manage. Assoc. 70, 425–435. doi: 10.1080/10962247.2020.1728424
Li H., Xin H., Burns R. T., Hoff S. J., Harmon J. D., Jacobson L. D., et al. (2008). “Ammonia and PM emissions from a tom Turkey barn in Iowa,” in 2008 ASABE Annual International Meeting (St. Joseph, Michigan: American Society of Agricultural and Biological Engineers). doi: 10.13031/2013.24972
Lupis S. G., Galles K. J., Ham J. M., Stratton J. J., Davis J. G., and Embertson N. (2012). Best management practices for reducing ammonia emissions: feedlot pen management. Environment 40, 5137–5145.
Mader T. L. and Davis M. S. (2004). Effect of management strategies on reducing heat stress of feedlot cattle: feed and water intake. J. Anim. Sci. 82, 3077–3087. doi: 10.2527/2004.82103077x
Maurer D. L., Koziel J. A., Harmon J. D., Hoff S. J., Rieck-Hinz A. M., and Andersen D. S. (2016). Summary of performance data for technologies to control gaseous, odor, and particulate emissions from livestock operations: Air management practices assessment tool (AMPAT). Data Brief 7, 1413–1429. doi: 10.1016/j.dib.2016.03.070
McGinn S. M. and Flesch T. K. (2018). Ammonia and greenhouse gas emissions at beef cattle feedlots in Alberta Canada. Agric. For. Meteorol. 258, 43–49. doi: 10.1016/j.agrformet.2018.01.024
McGinn S. M., Flesch T. K., Crenna B. P., Beauchemin K. A., and Coates T. (2007). Quantifying ammonia emissions from a cattle feedlot using a dispersion model. J. Environ. Qual. 36, 1585–1590. doi: 10.2134/jeq2007.0167
McGinn S. M., Janzen H. H., Coates T. W., Beauchemin K. A., and Flesch T. K. (2016). Ammonia emission from a beef cattle feedlot and its local dry deposition and re-emission. J. Environ. Qual. 45, 1178–1185. doi: 10.2134/jeq2016.01.0009
Mejia Turcios S. E. (2024). Evaluation of different approaches to reduce greenhouse gases and air pollutants from feedlot cattle production. Doctoral dissertation, UC Davis, CA, US.
Menezes A. C. B., Valadares Filho S. C., e Silva L. C., Pacheco M. V. C., Pereira J. M. V., Rotta P. P., et al. (2016). Does a reduction in dietary crude protein content affect performance, nutrient requirements, nitrogen losses, and methane emissions in finishing Nellore bulls? Agriculture Ecosyst. Environ. 223, 239–249. doi: 10.1016/j.agee.2016.03.015
Meng Z., Lin W., Zhang R., Han Z., and Jia X. (2017). Summertime ambient ammonia and its effects on ammonium aerosol in urban Beijing, China. Sci. Total Environ. 579, 1521–1530. doi: 10.1016/j.scitotenv.2016.11.159
Montes F., Rotz C. A., and Chaoui H. (2009). “Process modeling of ammonia volatilization from ammonium solution and manure surfaces: a review with recommended models,” in 2009 ASABE Annual International Meeting, Vol. 52. 1707–1720 (St. Joseph, Michigan: American Society of Agricultural and Biological Engineers). doi: 10.13031/2013.29133
Morris K. (2016). 2014 data summary of wet nitrogen deposition at Rocky Mountain National Park. Health Environ. Res. Oline.
Muck R. E. (1982). Urease activity in bovine feces. J. Dairy Sci. 65, 2157–2163. doi: 10.3168/jds.S0022-0302(82)82475-2
Muck R. E. and Steenhuis T. S. (1982). Nitrogen losses from manure storages. Agric. Wastes 4, 41–54. doi: 10.1016/0141-4607(82)90053-1
NASEM (2016). Nutrient Requirements of Beef Cattle. Eighth Revised Edition (Washington, DC, USA: National Academies of Sciences, Engineering, and Medicine).
Ni J. (1999). Mechanistic models of ammonia release from liquid manure: a review. J. Agric. Eng. Res. 72, 1–17. doi: 10.1006/jaer.1998.0342
Nichols W. T., Galyean M. L., Thomson D. U., and Hutcheson J. P. (2002). Effects of steroid implants on the tenderness of beef. Prof. Anim. Scientist 18, 202–210. doi: 10.15232/S1080-7446(15)31523-0
NRC (2001). Nutrient requirements of dairy cattle. 7th rev. ed (Washington, DC. USA: National Academy Press).
NRC (2002). The scientific basis for estimating air emissions from animal feeding operations: Interim report (Washington, DC: National Academies Press).
NRC (2003). Air emissions from animal feeding operations: Current knowledge, future needs (Washington, DC: National Academies Press).
Ohnoutka C. A., Bondurant R. G., Boyd B. M., Hilscher F. H., Nuttelman B. L., Crawford G. I., et al. (2021). Evaluation of coated steroidal combination implants on feedlot performance and carcass characteristics of beef heifers fed for constant or varying days on feed. Appl. Anim. Sci. 37, 41–51. doi: 10.15232/aas.2020-02013
Okopi S., Li Y., and Xu F. (2024). “Biomass Digestion,” in Encyclopedia of Sustainable Technologies (Elsevier), 236–251. doi: 10.1016/B978-0-323-90386-8.00051-6
Pandrangi S., Parker D. B., Greene L. W., Almas L. K., Rhoades M. B., and Cole N. A. (2003). “Effect of dietary crude protein on ammonia emissions from open-lot beef cattle feedyards,” in 2003 ASAE Annual International Meeting (St. Joseph, Michigan: American Society of Agricultural and Biological Engineers). doi: 10.13031/2013.13889
Parker D. B., Casey K. D., Willis W., and Meyer B. (2021). “Nitrous oxide and methane emissions from beef cattle feedyard pens following large rainfall events,” in 2021 ASABE Annual Meeting, Vol. 64. 1211–1225 (St. Joseph, Michigan: American Society of Agricultural and Biological Engineers). doi: 10.13031/trans.14480
Parker D. B., Pandrangi S., Greene L. W., Almas L. K., Cole N. A., Rhoades M. B., et al. (2004). “Application rate and timing effects on urease inhibitor performance for minimizing ammonia emissions from beef cattle feedyards,” in 2004 ASAE Annual International Meeting (St. Joseph, Michigan: American Society of Agricultural and Biological Engineers). doi: 10.13031/2013.16787
Parker D. B., Rhoades M. B., Cole N. A., and Sambana V. P. (2011). “Effect of urease inhibitor application rate and rainfall on ammonia emissions from beef manure,” in 2011 ASABE Annual Meeting, Vol. 55. 211–218 (St. Joseph, Michigan: American Society of Agricultural and Biological Engineers). doi: 10.13031/2013.41248
Parker D. B., Rhoades M. B., Koziel J. A., Baek B. H., Waldrip H. M., and Todd R. W. (2016). Urease inhibitor for reducing ammonia emissions from an open-lot beef cattle feedyard in the Texas High Plains. Appl. Eng. Agric. 32, 823–832. doi: 10.13031/aea.32.11897
Parker D. B., Waldrip H. M., Casey K. D., Todd R. W., Willis W. M., and Webb K. (2017). Temporal nitrous oxide emissions from beef cattle feedlot manure after a simulated rainfall event. J. Environ. Qual. 46, 733–740. doi: 10.2134/jeq2017.02.0042
Parker D. B., Waldrip H. M., Casey K. D., Woodbury B. L., Spiehs M. J., Webb K., et al. (2018). How do temperature and rainfall affect nitrous oxide emissions from open-lot beef cattle feedyard pens? Trans. ASABE 61, 1049–1061. doi: 10.13031/trans.12788
Perry T. W., Beeson W. M., and Mohler M. T. (1976). Effect of monensin on beef cattle performance. J. Anim. Sci. 42, 761–765. doi: 10.2527/jas1976.423761x
Preston R. L. and Herschler R. C. (1992). Controlled release estradiol/progesterone anabolic implant in cattle (Lubbock (TX: Texas Tech Univ Agric Sci Tech Rep), 5.
Proctor J. A. (2023). Implications of site and extent of protein digestion in growing and finishing cattle. [Doctoral dissertation] (College Station, Texas: Texas A&M University).
Quinn S. A., Erickson G. E., Klopfenstein T. J., Stowell R. R., and Sherwood D. M. (2007). Effect of phase feeding protein on cattle performance and nitrogen mass balance in open feedlots. Board Regents Univ. Nebraska.
Redding M. R., Lewis R., and Shorten P. R. (2019). Simultaneous measurements of ammonia volatilisation and deposition at a beef feedlot. Anim. Production Sci. 59, 160–168. doi: 10.1071/AN17310
Reddy D. V. and Krishna N. (2009). Precision animal nutrition: A tool for economic and eco-friendly animal production in ruminants. Livestock Res. Rural Dev. 21, 36.
Renard J. J., Calidonna S. E., and Henley M. V. (2004). Fate of ammonia in the atmosphere—a review for applicability to hazardous releases. J. Hazardous Materials 108, 29–60. doi: 10.1016/j.jhazmat.2004.01.015
Reynal S. M. and Broderick G. A. (2005). Effect of dietary level of rumen-degraded protein on production and nitrogen metabolism in lactating dairy cows. J. Dairy Sci. 88, 4045–4064. doi: 10.3168/jds.S0022-0302(05)73090-3
Rhoades M. B., Auvermann B. W., Cole N. A., Todd R. W., Parker D. B., Caraway E. A., et al. (2008). “Ammonia concentration and modeled emission rates from a beef cattle feedyard,” in 2008 Providence, Rhode Island, June 29–July 2, 2008 ( St. Joseph, Michigan: American Society of Agricultural and Biological Engineers). doi: 10.13031/2013.24774
Rhoades M. B., Parker D. B., Cole N. A., Todd R. W., Caraway E. A., Auvermann B. W., et al. (2010). Continuous ammonia emission measurements from a commercial beef feedyard in Texas. Trans. ASABE 53, 1823–1831. doi: 10.13031/2013.35808
Ross E. G. (2021). Mitigation of gaseous emissions from beef and dairy cattle through feed additives and manure supplements. University of California, Davis.
Russell J. B. and Strobel H. J. (1988). Effects of additives on in vitro ruminal fermentation: a comparison of monensin and bacitracin, another gram-positive antibiotic. J. Anim. Sci. 66, 552–558. doi: 10.2527/jas1988.662552x
Saarijärvi K., Mattila P. K., and Virkajärvi P. (2006). Ammonia volatilization from artificial dung and urine patches measured by the equilibrium concentration technique (JTI method). Atmospheric Environ. 40, 5137–5145. doi: 10.1016/j.atmosenv.2006.03.052
Sawyer C. N., McCARTY P. L., and Parkin G. F. (1978). “Chemistry for environmental engineering,” in National Meeting of the American Chemical Society. (New York).
Schultz A. A., Peppard P., Gangnon R. E., and Malecki K. M. (2019). Residential proximity to concentrated animal feeding operations and allergic and respiratory disease. Environ. Int. 130, 104911. doi: 10.1016/j.envint.2019.104911
Selk G. (1999). Implants for suckling steer and heifer calves and potential replacement heifers. Compendium Continuing Educ. Practicing Veterinarian 21.
Shen J., Chen D., Bai M., Sun J., Coates T., Lam S. K., et al. (2016). Ammonia deposition in the neighbourhood of an intensive cattle feedlot in Victoria, Australia. Sci. Rep. 6, 32793. doi: 10.1038/srep32793
Shi Y., Parker D. B., Cole N. A., Auvermann B. W., and Mehlhorn J. E. (2001). Surface amendments to minimize ammonia emissions from beef cattle feedlots. Trans. ASAE 44, 677. doi: 10.13031/2013.6105
Shonkwiler K. B. and Ham J. M. (2018). Ammonia emissions from a beef feedlot: Comparison of inverse modeling techniques using long-path and point measurements of fenceline NH3. Agric. For. Meteorol. 258, 29–42. doi: 10.1016/j.agrformet.2017.10.031
Sommer S. G., Olesen J. E., and Christensen B. T. (1991). Effects of temperature, wind speed and air humidity on ammonia volatilization from surface applied cattle slurry. J. Agric. Sci. 117, 91–100. doi: 10.1017/S0021859600079016
Spiehs M. J. and Woodbury B. (2022). Effect of using aluminum sulfate (alum) as a surface amendment in beef cattle feedlots on ammonia and sulfide emissions. Sustainability 14, 1984. doi: 10.3390/su14041984
Spiehs M. J., Woodbury B. L., and Parker D. B. (2019). Ammonia, hydrogen sulfide, and greenhouse gas emissions from lab-scaled manure bedpacks with and without aluminum sulfate additions. Environments 6, 108. doi: 10.3390/environments6100108
Stackhouse K. R., Rotz C. A., Oltjen J. W., and Mitloehner F. M. (2012). Growth-promoting technologies decrease the carbon footprint, ammonia emissions, and costs of California beef production systems. J. Anim. Sci. 90, 4656–4665. doi: 10.2527/jas.2011-4654
Staebler R. M., McGinn S. M., Crenna B. P., Flesch T. K., Hayden K. L., and Li S. M. (2009). Three-dimensional characterization of the ammonia plume from a beef cattle feedlot. Atmospheric Environ. 43, 6091–6099. doi: 10.1016/j.atmosenv.2009.08.045
Stewart B. A. (1970). Volatilization and nitrification of nitrogen from urine under simulated cattle feedlot conditions. Environ. Sci. Technol. 4, 579–582. doi: 10.1021/es60042a004
Sun K., Tao L., Miller D. J., Zondlo M. A., Shonkwiler K. B., Nash C., et al. (2015). Open-path eddy covariance measurements of ammonia fluxes from a beef cattle feedlot. Agric. For. Meteorol. 213, 193–202. doi: 10.1016/j.agrformet.2015.06.007
Szymula A., Wlazło Ł., Sasáková N., Wnuk W., and Nowakowicz-Dębek B. (2021). The use of natural sorbents to reduce ammonia emissions from cattle faeces. Agronomy 11, 2543. doi: 10.3390/agronomy11122543
Tedeschi L. O. and Fox D. G. (2020). The Ruminant Nutrition System: Vol. 1 - An Applied Model for Predicting Nutrient Requirement and Feed Utilization in Ruminants. 3rd Edition (Ann Arbor, MI: XanEdu publication).
Tedeschi L. O., Fox D. G., and Tylutki T. P. (2003). Potential environmental benefits of ionophores in ruminant diets. J. Environ. Qual. 32, 1591–1602. doi: 10.2134/jeq2003.1591
Thompson T. M., Rodriguez M. A., Barna M. G., Gebhart K. A., Hand J. L., Day D. E., et al. (2015). Rocky Mountain National Park reduced nitrogen source apportionment. J. Geophysical Research: Atmospheres 120, 4370–4384. doi: 10.1002/2014JD022675
Todd R. W., Cole N. A., and Clark R. N. (2006). Reducing crude protein in beef cattle diet reduces ammonia emissions from artificial feedyard surfaces. J. Environ. Qual. 35, 404–411. doi: 10.2134/jeq2005.0045
Todd R. W., Cole N. A., Clark R. N., Flesch T. K., Harper L. A., and Baek B. H. (2008). Ammonia emissions from a beef cattle feedyard on the southern High Plains. Atmospheric Environ. 42, 6797–6805. doi: 10.1016/j.atmosenv.2008.05.013
Todd R. W., Cole N. A., Harper L. A., and Flesch T. K. (2007). “Flux-gradient estimates of ammonia emissions from beef cattle feedyard pens,” in International Symposium on Air Quality and Waste Management for Agriculture, 16–19 September 2007, Broomfield, Colorado. 81 (St. Joseph, Michigan: American Society of Agricultural and Biological Engineers). doi: 10.13031/2013.23877
Todd R. W., Cole N. A., Harper L. A., Flesch T. K., and Baek B. H. (2005). “Ammonia and gaseous nitrogen emissions from a commercial beef cattle feedyard estimated using the flux-gradient method and N: P ratio analysis,” in Proc. Symposium State of the Science: Animal Manure and Waste Management. (San Antonio, Texas).
Todd R. W., Cole N. A., Parker D. B., Rhoades M., and Casey K. (2009). “Effect of feeding distiller’s grain on dietary crude protein and ammonia emissions from beef cattle feedyards,” in Proceedings of the Texas Animal Manure Management Issues (TAMMI) Conference. (Round Rock, Texas) 37–44.
Todd R. W., Cole N. A., Rhoades M. B., Parker D. B., and Casey K. D. (2011). Daily, monthly, seasonal, and annual ammonia emissions from Southern High Plains cattle feedyards. J. Environ. Qual. 40, 1090–1095. doi: 10.2134/jeq2010.0307
Todd R. W., Cole N. A., Waldrip H. M., and Aiken R. M. (2013). Arrhenius equation for modeling feedyard ammonia emissions using temperature and diet crude protein. J. Environ. Qual. 42, 666–671. doi: 10.2134/jeq2012.0371
USDA-NRCS Conservation management practices. Available online at: https://www.nrcs.usda.gov/resources/guides-and-instructions/conservation-practice-standards (Accessed March 21, 2025).
USEPA (2004). Ammonia emissions from animal husbandry operations (Washington D.C.: United States Environmental Protection Agency, National emission inventory).
USEPA (2010). Methane and nitrous oxide emissions from natural sources (Washington D.C.: United States Environmental Protection Agency).
USEPA (2024). National ambient air quality standards (NAAQS) for PM (Washington D.C.: United States Environmental Protection Agency). Available at: https://www.epa.gov/pm-pollution/national-ambient-air-quality-standards-naaqs-pm.
Vaga M. (2017). Investigating ruminal nitrogen metabolism. (Doctoral dissertation): Swedish Universitatis of Agricultural Sciences, Umeå, Sweden.
Vander Pol M., Hristov A. N., Zaman S., and Delano N. (2008). Peas can replace soybean meal and corn grain in dairy cow diets. J. Dairy Sci. 91, 698–703. doi: 10.3168/jds.2007-0543
Van Haarlem R. P., Desjardins R. L., Gao Z., Flesch T. K., and Li X. (2008). Methane and ammonia emissions from a beef feedlot in western Canada for a twelve-day period in the fall. Can. J. Anim. Sci. 88, 641–649. doi: 10.4141/CJAS08034
Van Soest P. J. (1994). Nutritional ecology of the ruminant Vol. 476 (Ithaca, NY: Cornell University Press).
Varel V. H., Nienaber J. A., and Freetly H. C. (1999). Conservation of nitrogen in cattle feedlot waste with urease inhibitors. J. Anim. Sci. 77, 1162–1168. doi: 10.2527/1999.7751162x
Vavilin V. A., Fernandez B., Palatsi J., and Flotats X. (2008). Hydrolysis kinetics in anaerobic degradation of particulate organic material: an overview. Waste Manage. 28, 939–951. doi: 10.1016/j.wasman.2007.03.028
Waldrip H. M., Cole N. A., and Todd R. W. (2015). Nitrogen sustainability and beef cattle feedyards: II. Ammonia emissions. Prof. Anim. Scientist 31, 395–411. doi: 10.15232/pas.2015-01395
Waldrip H. M., Rotz C. A., Hafner S. D., Todd R. W., and Cole N. A. (2014). Process-based modeling of ammonia emission from beef cattle feedyards with the integrated farm systems model. J. Environ. Qual. 43, 1159–1168. doi: 10.2134/jeq2013.09.0354
Waldrip H. M., Todd R. W., and Cole N. A. (2013a). Prediction of nitrogen excretion by beef cattle: A meta-analysis. J. Anim. Sci. 91, 4290–4302. doi: 10.2527/jas.2012-5818
Waldrip H. M., Todd R. W., Li C., Cole N. A., and Salas W. H. (2013b). Estimation of ammonia emissions from beef cattle feedyards using the process-based model Manure-DNDC. Trans. ASABE 56, 1103–1114. doi: 10.13031/trans.56.9906
Wang Q., Flesch T. K., Bai M., Zhang M., and Chen D. (2024). Seasonal ammonia emissions from an intensive beef cattle feedlot in Victoria Australia. J. Environ. Manage. 351, 119898. doi: 10.1016/j.jenvman.2023.119898
Wendler W. M., Davis M. S., Koers W. C., Rincker P. J., Pyatt N. A., Lucherk L. W, et al. (2025). Effect of beta-agonist type and timing of Experior feeding on calculated cumulative ammonia gas emissions, live growth performance, and carcass outcomes, and objective tenderness outcomes of feedlot steers. Translational Animal Science, txaf009. doi: 10.1093/tas/txaf009
Wheeler E. F., Adviento-Borbe M. A. A., Brandt R. C., Topper P. A., Topper D. A., Elliott H. A., et al. (2011). Evaluation of odor emissions from amended dairy manure: preliminary screening. Agric. Eng. International: CIGR J. 13.
Wilson J. D. and Sawford B. L. (1996). Review of Lagrangian stochastic models for trajectories in the turbulent atmosphere. Boundary-layer meteorol. 78, 191–210. doi: 10.1007/BF00122492
Wyer K. E., Kelleghan D. B., Blanes-Vidal V., Schauberger G., and Curran T. P. (2022). Ammonia emissions from agriculture and their contribution to fine particulate matter: A review of implications for human health. J. Environ. Manage. 323, 116285. doi: 10.1016/j.jenvman.2022.116285
Xie Y., Wang W., Chen Y., Qian Z., Chen J., Tong J., et al. (2024). NH3 emissions and lifetime estimated by satellite observations with differential evolution algorithm. Atmosphere 15, 251. doi: 10.3390/atmos15030251
Yonkofski C. M., Appriou D., and Downs J. L. (2019). Dust Control Planning (No. PNNL-29152) (Richland, WA, USA: U.S. Department of Energy, Pacific Northwest National Lab.(PNNL). doi: 10.2172/1593515
Zhang B., He P. J., Lü F., Shao L. M., and Wang P. (2007). Extracellular enzyme activities during regulated hydrolysis of high-solid organic wastes. Water Res. 41, 4468–4478. doi: 10.1016/j.watres.2007.06.061
Keywords: gas quantification, emission factors, emission mitigation, feedyard management practices, air quality, sustainable agriculture
Citation: Lee M, Auvermann BW, Tedeschi LO, Koziel JA, Brandani CB, Gouvêa VN, Smith JK and Casey KD (2025) Ammonia emissions from beef cattle feedyards: a review. Front. Anim. Sci. 6:1608387. doi: 10.3389/fanim.2025.1608387
Received: 08 April 2025; Accepted: 03 June 2025;
Published: 02 July 2025.
Edited by:
Titus Zindove, Lincoln University, New ZealandReviewed by:
Diego Ignacio Manriquez, Colorado State University, United StatesRangarirayi Lucia Mhindu, Midlands State University, Zimbabwe
Copyright © 2025 Lee, Auvermann, Tedeschi, Koziel, Brandani, Gouvêa, Smith and Casey. This is an open-access article distributed under the terms of the Creative Commons Attribution License (CC BY). The use, distribution or reproduction in other forums is permitted, provided the original author(s) and the copyright owner(s) are credited and that the original publication in this journal is cited, in accordance with accepted academic practice. No use, distribution or reproduction is permitted which does not comply with these terms.
*Correspondence: Brent W. Auvermann, QnJlbnQuQXV2ZXJtYW5uQGFnLnRhbXUuZWR1