 Alexander Weinberg1*
 Franziska Witte2
 Dana Carina Schubert1
 Karl Rohn3
 Martin Hoeltershinken4Victoria Eva Hancock5Werner Sitzmann5Nino Terjung2
 Christian Visscher1
- 1Institute for Animal Nutrition, University of Veterinary Medicine, Hannover, Germany
- 2Deutsches Instiut für Lebensmittel e.V (DIL) German Institute of Food Technologies, Quakenbrueck, Germany
- 3Institute for Veterinary Biometry and Epidemiology, University of Veterinary Medicine Hannover, Foundation, Hannover, Germany
- 4Clinic for Cattle, University of Veterinary Medicine, Hannover, Germany
- 5International Research Association for Feed Technology e.V., Brunswick, Germany
Anthropogenic climate change is primarily caused by CO2 and CH4 emissions, with a significant portion originating from agriculture and livestock. Reducing methane emissions in ruminant husbandry has been a longstanding goal. Therefore, in this study, we aimed to influence the fermentation processes in the artificial rumen model (rumen simulation technique, RUSITEC) using five different carbons—one activated carbon (AC) and four biochars (BCs)—and one control without supplement. The carbons were included at 2% of dry matter (DM) of the basal diet, which corresponded to 0.3 g DM of the assigned additive. The treatments were conducted on 12 fermenters with two replications (n = 4/treatment) in a randomized block design. The experimental period consisted of a 7-day adaptation phase and an 8-day data and sample collection phase. Parameters included gas volume, gas composition, disappearance rates, volatile fatty acid (VFA) production, and nutrient digestion. Except for biochar (BC) 3, carbons showed no impact on gas parameters, while BC 3 decreased CO2 production (p = 0.0453), gas volume (p = 0.0255), and the ratio of CO2 (p = 0.0304), CH4 (p = 0.0304), and gas volume (p = 0.0304) to disappeared organic matter (dOM). BC 3 also showed a tendency to decrease in methane production (p = 0.0878). The effects on produced VFA were only found for BC 3, which reduced the daily production of total VFA (p = 0.0226), acetic acid (p = 0.0248), propionic acid (p = 0.0166), i-butyric acid (p = 0.0366), and the ratio of VFA to dry matter loss (p = 0.0172) and to dOM (p = 0.0304), while pH (p = 0.0309) was higher compared to the control. Only BC 3 had decreasing effects on disappearance rates (p = 0.0304). Although BC 3 reduces greenhouse gas emissions, it does so at the expense of fermentation, as indicated by its decreasing impact on digestion rate, VFA production, and the resulting increase in pH. In conclusion, biochar has the potential to affect rumen fermentation in vitro. However, general statements regarding the effects of biochars on fermentation cannot be derived from this experiment; each biochar source needs to be evaluated individually.
1 Introduction
Global climate warming poses one of the major challenges currently faced by humanity (Randers and Goluke, 2020). In addition to CO2 emissions from burning fossil fuels, methane emissions from livestock significantly contribute to the greenhouse effect. Methane has 86 times more warming potential than CO2 over a 20-year period, though it has a shorter atmospheric half-life (12.4 vs. 92 years for CO2) (Tutak and Brodny, 2019). It is noteworthy that released methane has an average half-life of 12.4 years, in comparison to carbon dioxide, which has a half-life of 92 years (Moore and Braswell, 1994; Tutak and Brodny, 2019). Therefore, reducing emitted methane can have a more rapid impact on mitigating climate change (Harmsen et al., 2020). Fundamentally, methane production in the foregut of ruminants is an inevitable process, wherein members of the Archaea family reduce compounds such as CO2, generated during the fermentation of nutrients, to methane using H2 (Abken et al., 1998; Breves et al., 2022). This process constitutes approximately 27% of anthropogenic methane emissions (Bačėninaitė et al., 2022). Nevertheless, in recent decades, research has been conducted both in vivo and in vitro to explore dietary options to reduce methane formation in the rumen.
Regarding methane reduction in cattle feeding, an approved feed additive is already available. This 3-nitrooxypropanol acts by inactivating methyl coenzyme M reductase. However, it is noteworthy that 3-nitrooxypropanol can achieve a sustained inhibition of methane production only when taken repeatedly at 5-h intervals (Van Wesemael et al., 2019). In in-vitro studies using the rumen simulation technique (RUSITEC), the methane-reducing effect of 3-nitrooxypropanol has also been demonstrated (Guyader et al., 2017; Romero-Pérez et al., 2017). However, in the study by Guyader et al. (2017), only nitrate was able to trigger a more effective reduction compared to 3-nitrooxypropanol (NOP) and anthraquinone. Nonetheless, it should be noted that nitrate feeding can lead to reduced feed intake, increased susceptibility to infections, reproductive disorders, and, particularly in inadequately adapted animals, the risk of nitrate poisoning causing internal suffocation through methemoglobin formation (Bruning-Fann and Kaneene, 1993; Ao and Emeritus, 2008; Van Wyngaard et al., 2018).
It has also been demonstrated that the use of oils in the fermentation load has a reducing impact on methane production (Dong et al., 1997; Machmüller et al., 1998; Soliva et al., 2011; Vargas et al., 2020). For instance, in the study by Dong et al. (1997), the control feed produced 72.3% more methane compared to coconut oil feeding. In the experimental feed, 10% oil was included in the ration. However, in cattle feeding, the maximum allowable fat content is 6% in dry matter (DM) (Bionaz et al., 2020). If a higher proportion of fat is used in the ration, the surfaces of fiber components may be coated, hindering raw fiber digestion (Oslage, 1984). The use of seaweed has also been shown to reduce methane concentration in the produced fermentation gas (Künzel et al., 2022; Roskam et al., 2022). In the study by Künzel et al. (2022), the algae Ascophyllum nodosum and Fucus vesiculosus were administered at two different doses (2.5% and 5%). Only at a dosage of 5% of total DM was the methane concentration lowered. Nonetheless, the iodine concentration at this dosage was 70 mg/kg DM, and for dairy cows, a content of 5 mg/kg DM is already toxic (Council, 2001; Zarczynska and Swierczynski, 2023). Furthermore, the use of algae led to a slower overall fermentation rate, associated with reduced nutrient breakdown and inhibition of volatile fatty acid production, thereby slowing down fermentation efficiency and providing the animal with less energy and nutrients (Künzel et al., 2022).
Another promising additive for methane reduction is biochar. Initial studies have shown that the use of biochar at dosages ranging from 2% to 7.2% of DM in the experimental ration can reduce methane production (Saleem et al., 2018; Teoh et al., 2019a; Schubert et al., 2021; Tamayao et al., 2021a). The exact mechanism by which biochar can influence methane production is not yet fully understood. It has also been demonstrated that biochar affects the digestibility, enhancing the feed efficiency (Leng et al., 2012; Saleem et al., 2018). This is reflected in the cited studies by an increased production of volatile fatty acids (VFAs) and an enhancement in the percentage digestibility. Regarding this aspect, it also might be possible to reduce the relative methane emissions by increasing productivity, as increased productivity leads to a proportional reduction in methane load per production unit (Johnson et al., 1996; Camer-Pesci et al., 2023).
Biochar is produced through the pyrolysis of plant materials, with manufacturing parameters such as pyrolysis temperature, duration, and the choice of raw materials, which vary depending on the raw material, the season and year, and the production process. The raw materials of biochars can vary significantly, ranging from wood logs, agricultural residues, byproducts of alcohol, and vegetable oil production (Das et al., 2021). Similarly, the pyrolysis process itself exhibits diversity, with various methods available to pyrolyze the raw material. Key factors influencing the process include heating rate, maximum temperature, duration, and the use of additional aids such as steam and pressure (Das et al., 2021). Accordingly, biochars not only differ from activated charcoal in terms of characteristics such as pore size and pore size distribution but also exhibit a broad range of variations among individual biochars (Rogovska et al., 2012; Janu et al., 2021). Hence, it is crucial to assess each biochar individually for its effects on fermentation and methane reduction.
Against this background, this in-vitro study, using RUSITEC, investigated the effects of four different biochars and one activated charcoal compared to control feeding on fermentation parameters, methane and carbon dioxide production, and the disappearance rate of the provided substrates.
2 Materials and methods
2.1 Ethics approval statement
The rumen fluid extraction for the experiment was approved by the Lower Saxony State Office for Consumer Protection and Food Safety (LAVES; reference: 33.8-42502.05.17A238).
2.2 Experimental design and treatments
The in-vitro experiment was conducted using the RUSITEC apparatus (rumen simulation technique), comprising a total of 12 fermenters with two replicates, aimed at assessing the effects of different carbons on the fermentation process. The experiments ran for 15 days according to Ramos et al. (2018); Tamayao et al. (2021a), and Vargas et al. (2023). The experimental design was completely randomized with six different treatments, each with four replications (N = 24, n = 4). The six treatments included a control (without additive), activated charcoal, and four different biochars. The number of replications, limited to four, as well as the principles of the experimental design, including the associated statistical analysis, was based on the works of Müller, Brede et al. (2020); Brede et al. (2021); Pfau et al. (2021), and Brede et al. (2022). The dosage of activated charcoal or biochar was 2% based on the amount of fermentation substrate (15 g DM). The 15-day experimental period was divided into a 7-day adaptation phase and an 8-day experimental phase (Figure 1). Throughout the entire experiment, fermentation parameters (supernatant volume, gas quantity, pH, redox potential, volatile fatty acids, and ammonia content in the fermenter and supernatant) were measured daily. Additionally, during the experimental phase, methane concentration in the produced gas and the disappearance rate of nutrients from the fermentation substrate were determined. The precise experimental procedure is described in Section 2.4.
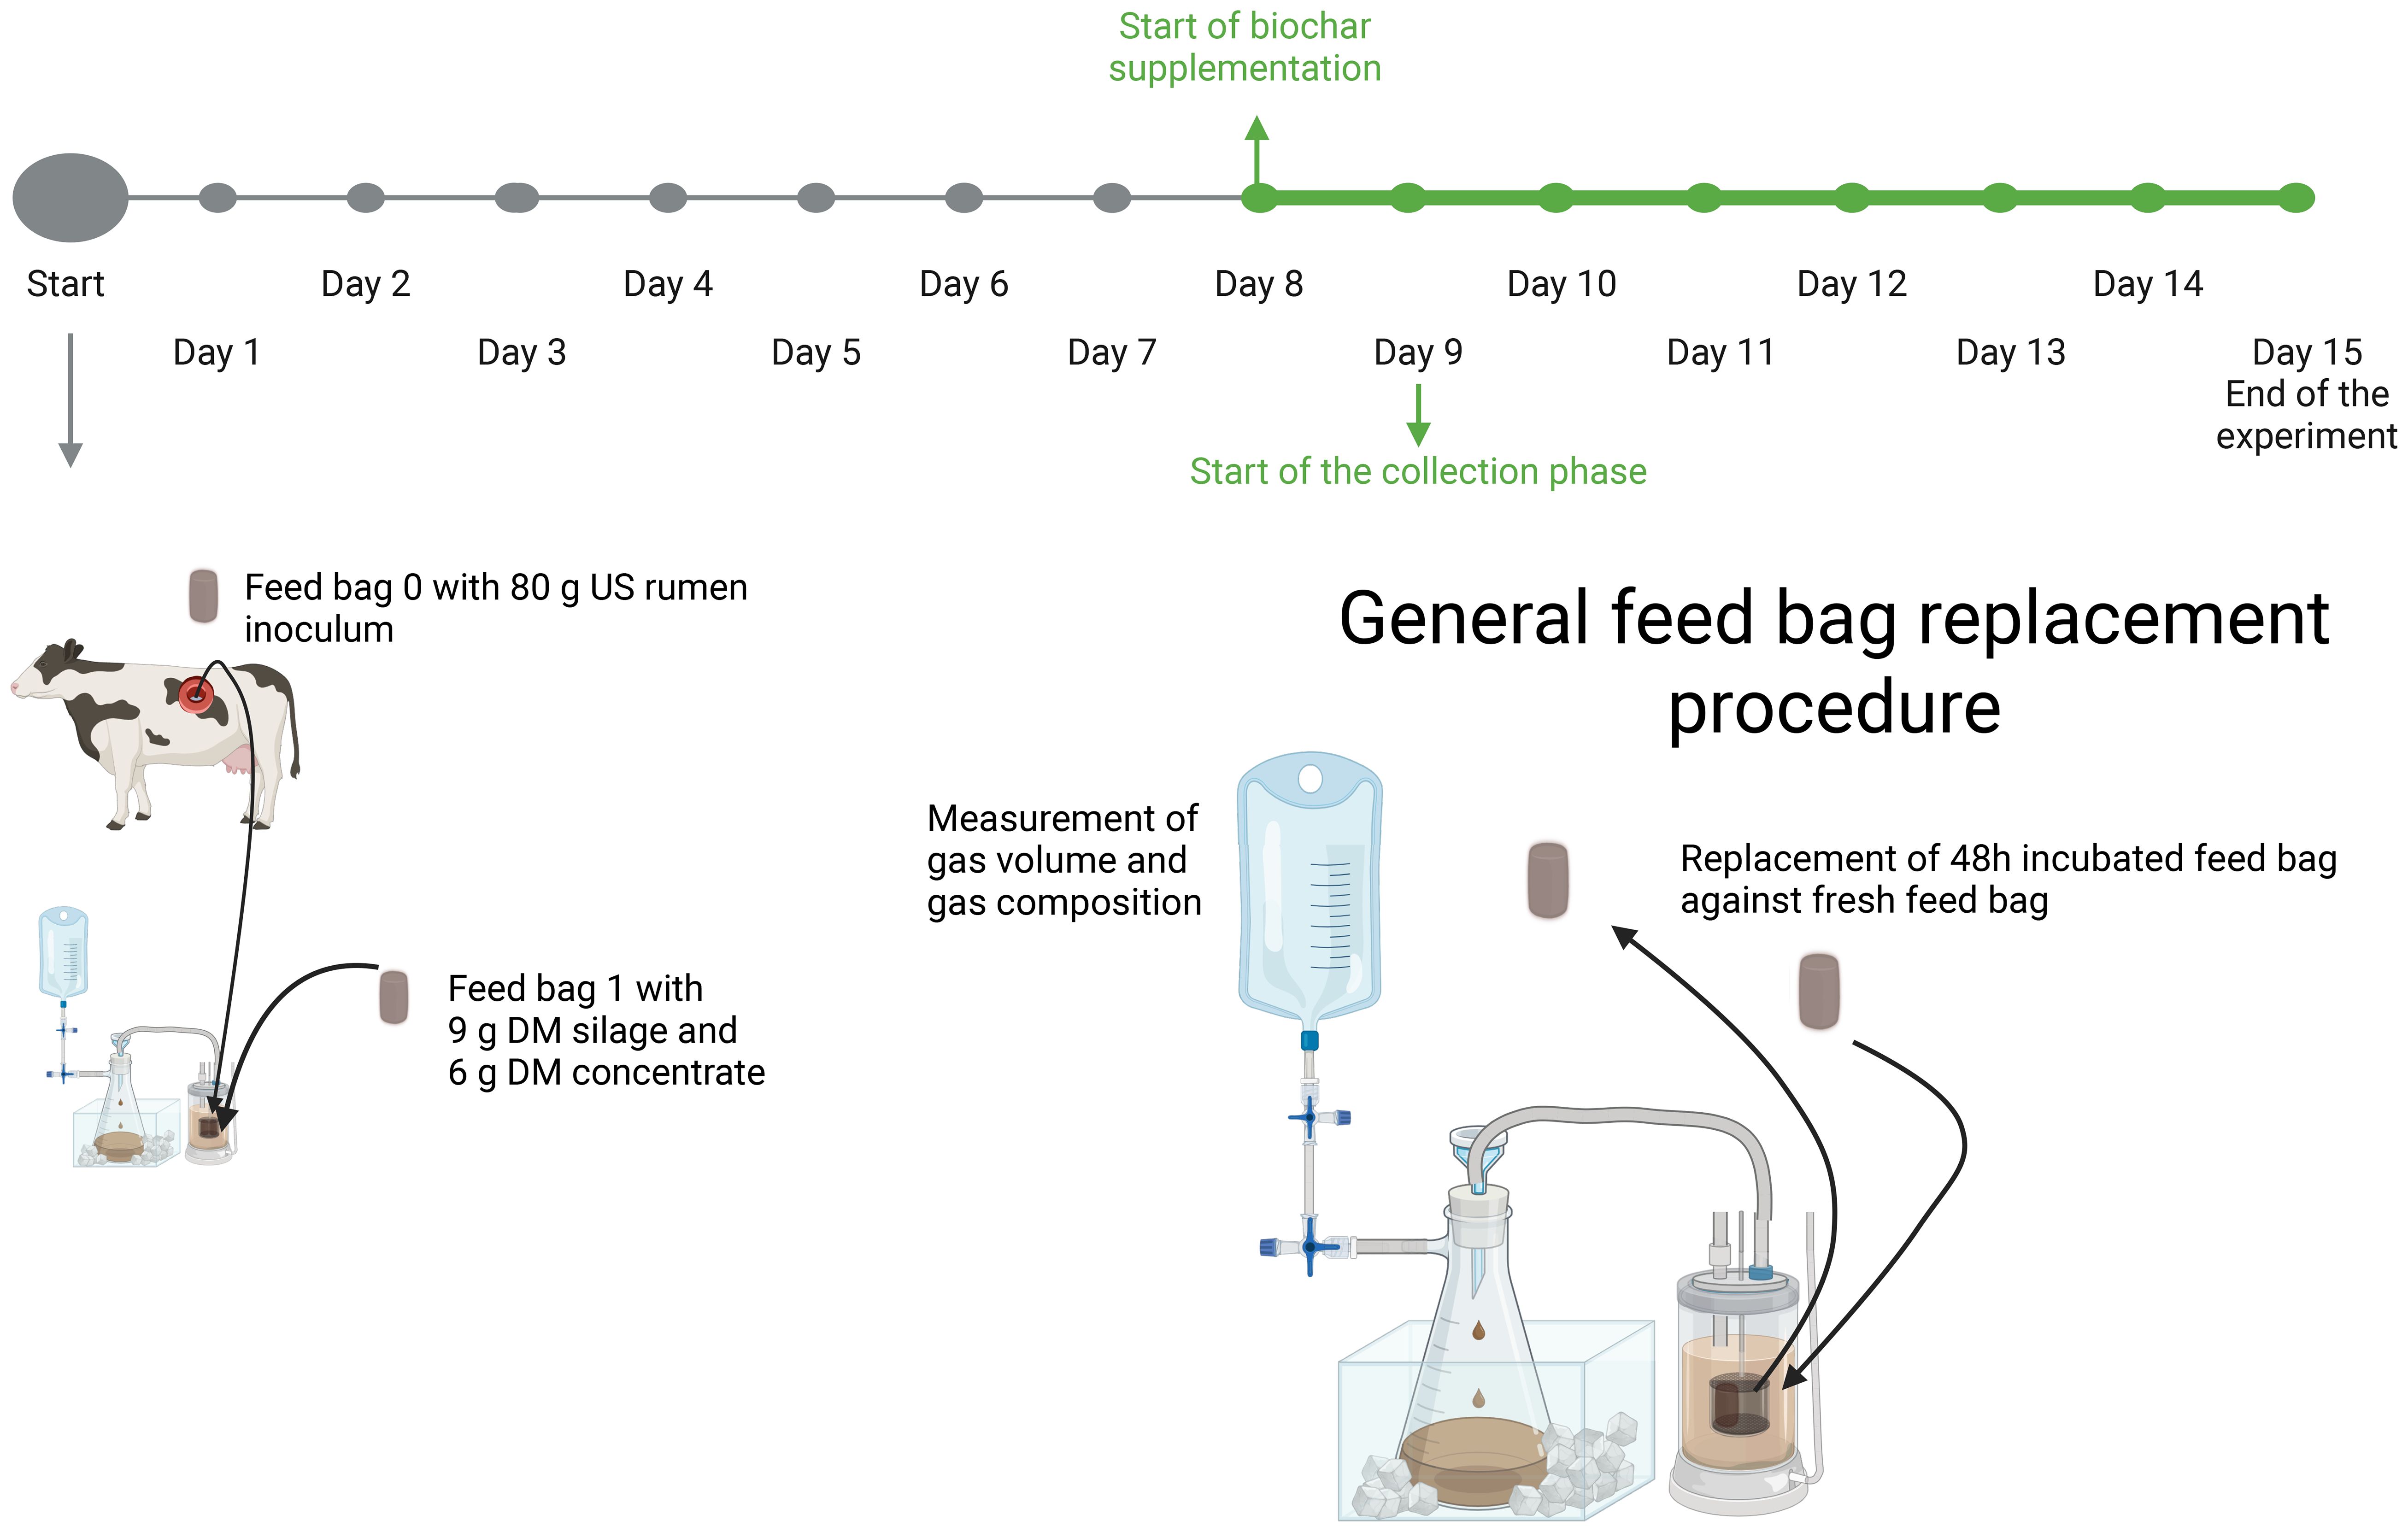
Figure 1. Schematic representation of the experimental setup used in the RUSITEC study. The adaptation phase is indicated in grey, and the experimental phase is highlighted in green. The diagram illustrates a simplified RUSITEC system, consisting of a fermenter, a feed bag chamber with a nylon bags (50 µm mesh size), an overflow tank, and a gas bag. At the start of the experiment, both 800 mL of filtered rumen fluid and 80 g solid rumen content were collected from a donor animal. Each day, the feed bag incubated for 48 hours was replaced. The daily feed ration consisted of 9 g dry matter (DM) silage and 6 g DM concentrate. Beginning on day 8, an additional 2% biochar (0,3 g DM) was added daily. Figure created with BioRender.com.
2.3 Characterization of the carbons
In 2020, 10 biochars with feed approval according to EBC and/or GMP standards for Germany were selected and characterized by the research partner, German Institute of Food Technologies (DIL Deutsches Institut für Lebensmitteltechnik e.V., Quakenbrück, Germany). Based on these investigations, four biochars were selected and examined using the RUSITEC system in comparison to activated carbon. To determine particle size distribution of the biochars and the activated carbon, dry sieve analysis in accordance with DIN 66165-1:1987–04 and DIN 66165-2:1987–04 was used, and 50 to 100 g of each carbon was weighed with an accuracy of ±0.1 g and sieved by a sieve shaker. The sieves used had mesh sizes ranging between 0.125 mm and 4 mm. Subsequently, all the sieves were weighed, and the percentage distribution on the respective sieves was determined (Table 1). This investigation was conducted at the International Research Association for Feed Technology (IFF, Internationale Forschungsgemeinschaft Futtermitteltechnik e.V., Brunswick, Germany), and the data were made available as part of a collaborative effort. For visual representation, all five charcoals were photographed under the same conditions, on a white background with a ruler for size clarification (Figure 2). The specific surface area was provided by the German Institute of Food Technologies (DIL Deutsches Institut für Lebensmitteltechnik e.V., Quakenbrück, Germany) in accordance with the method of Müller (2021). The specific surface area, the raw material, and the pyrolysis temperature of the carbons are shown in Table 2.
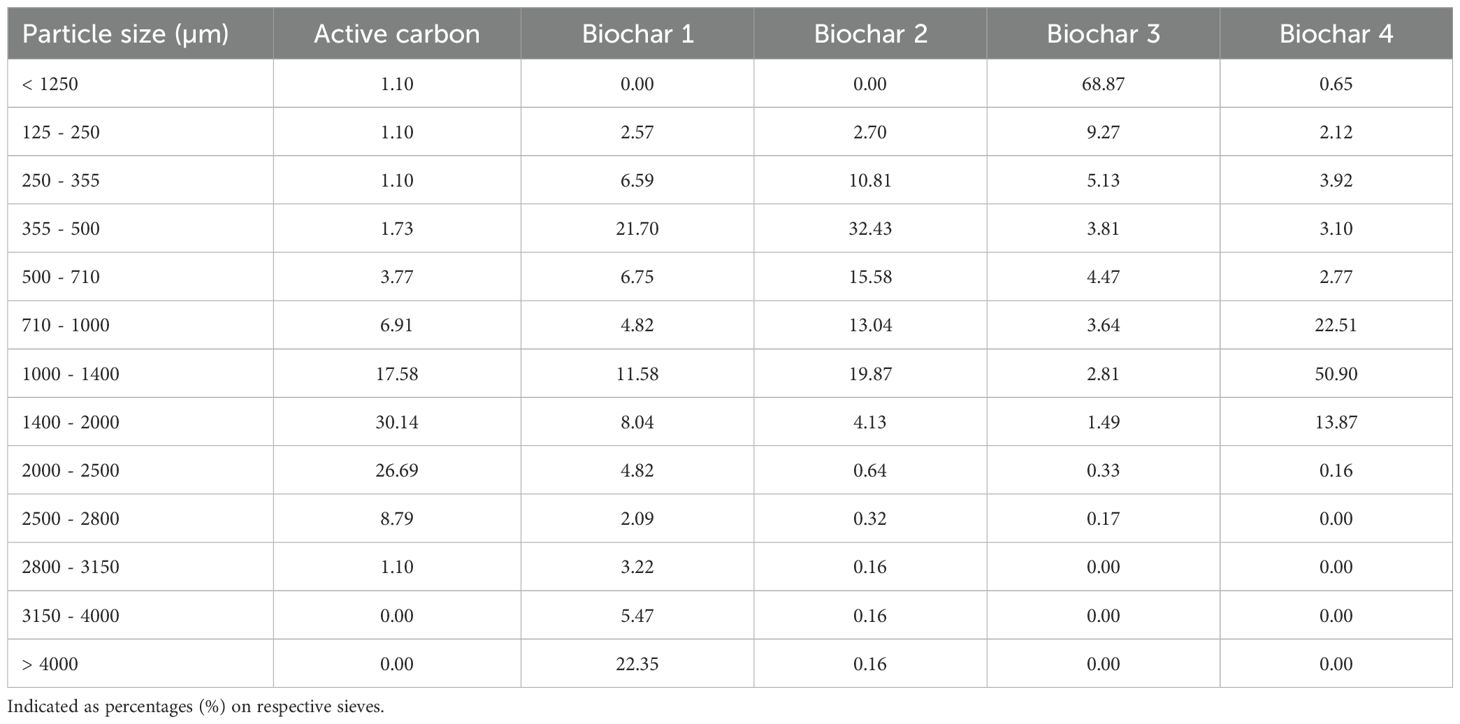
Table 1. Particle size distribution (percentage by mass) of active carbon and biochars.
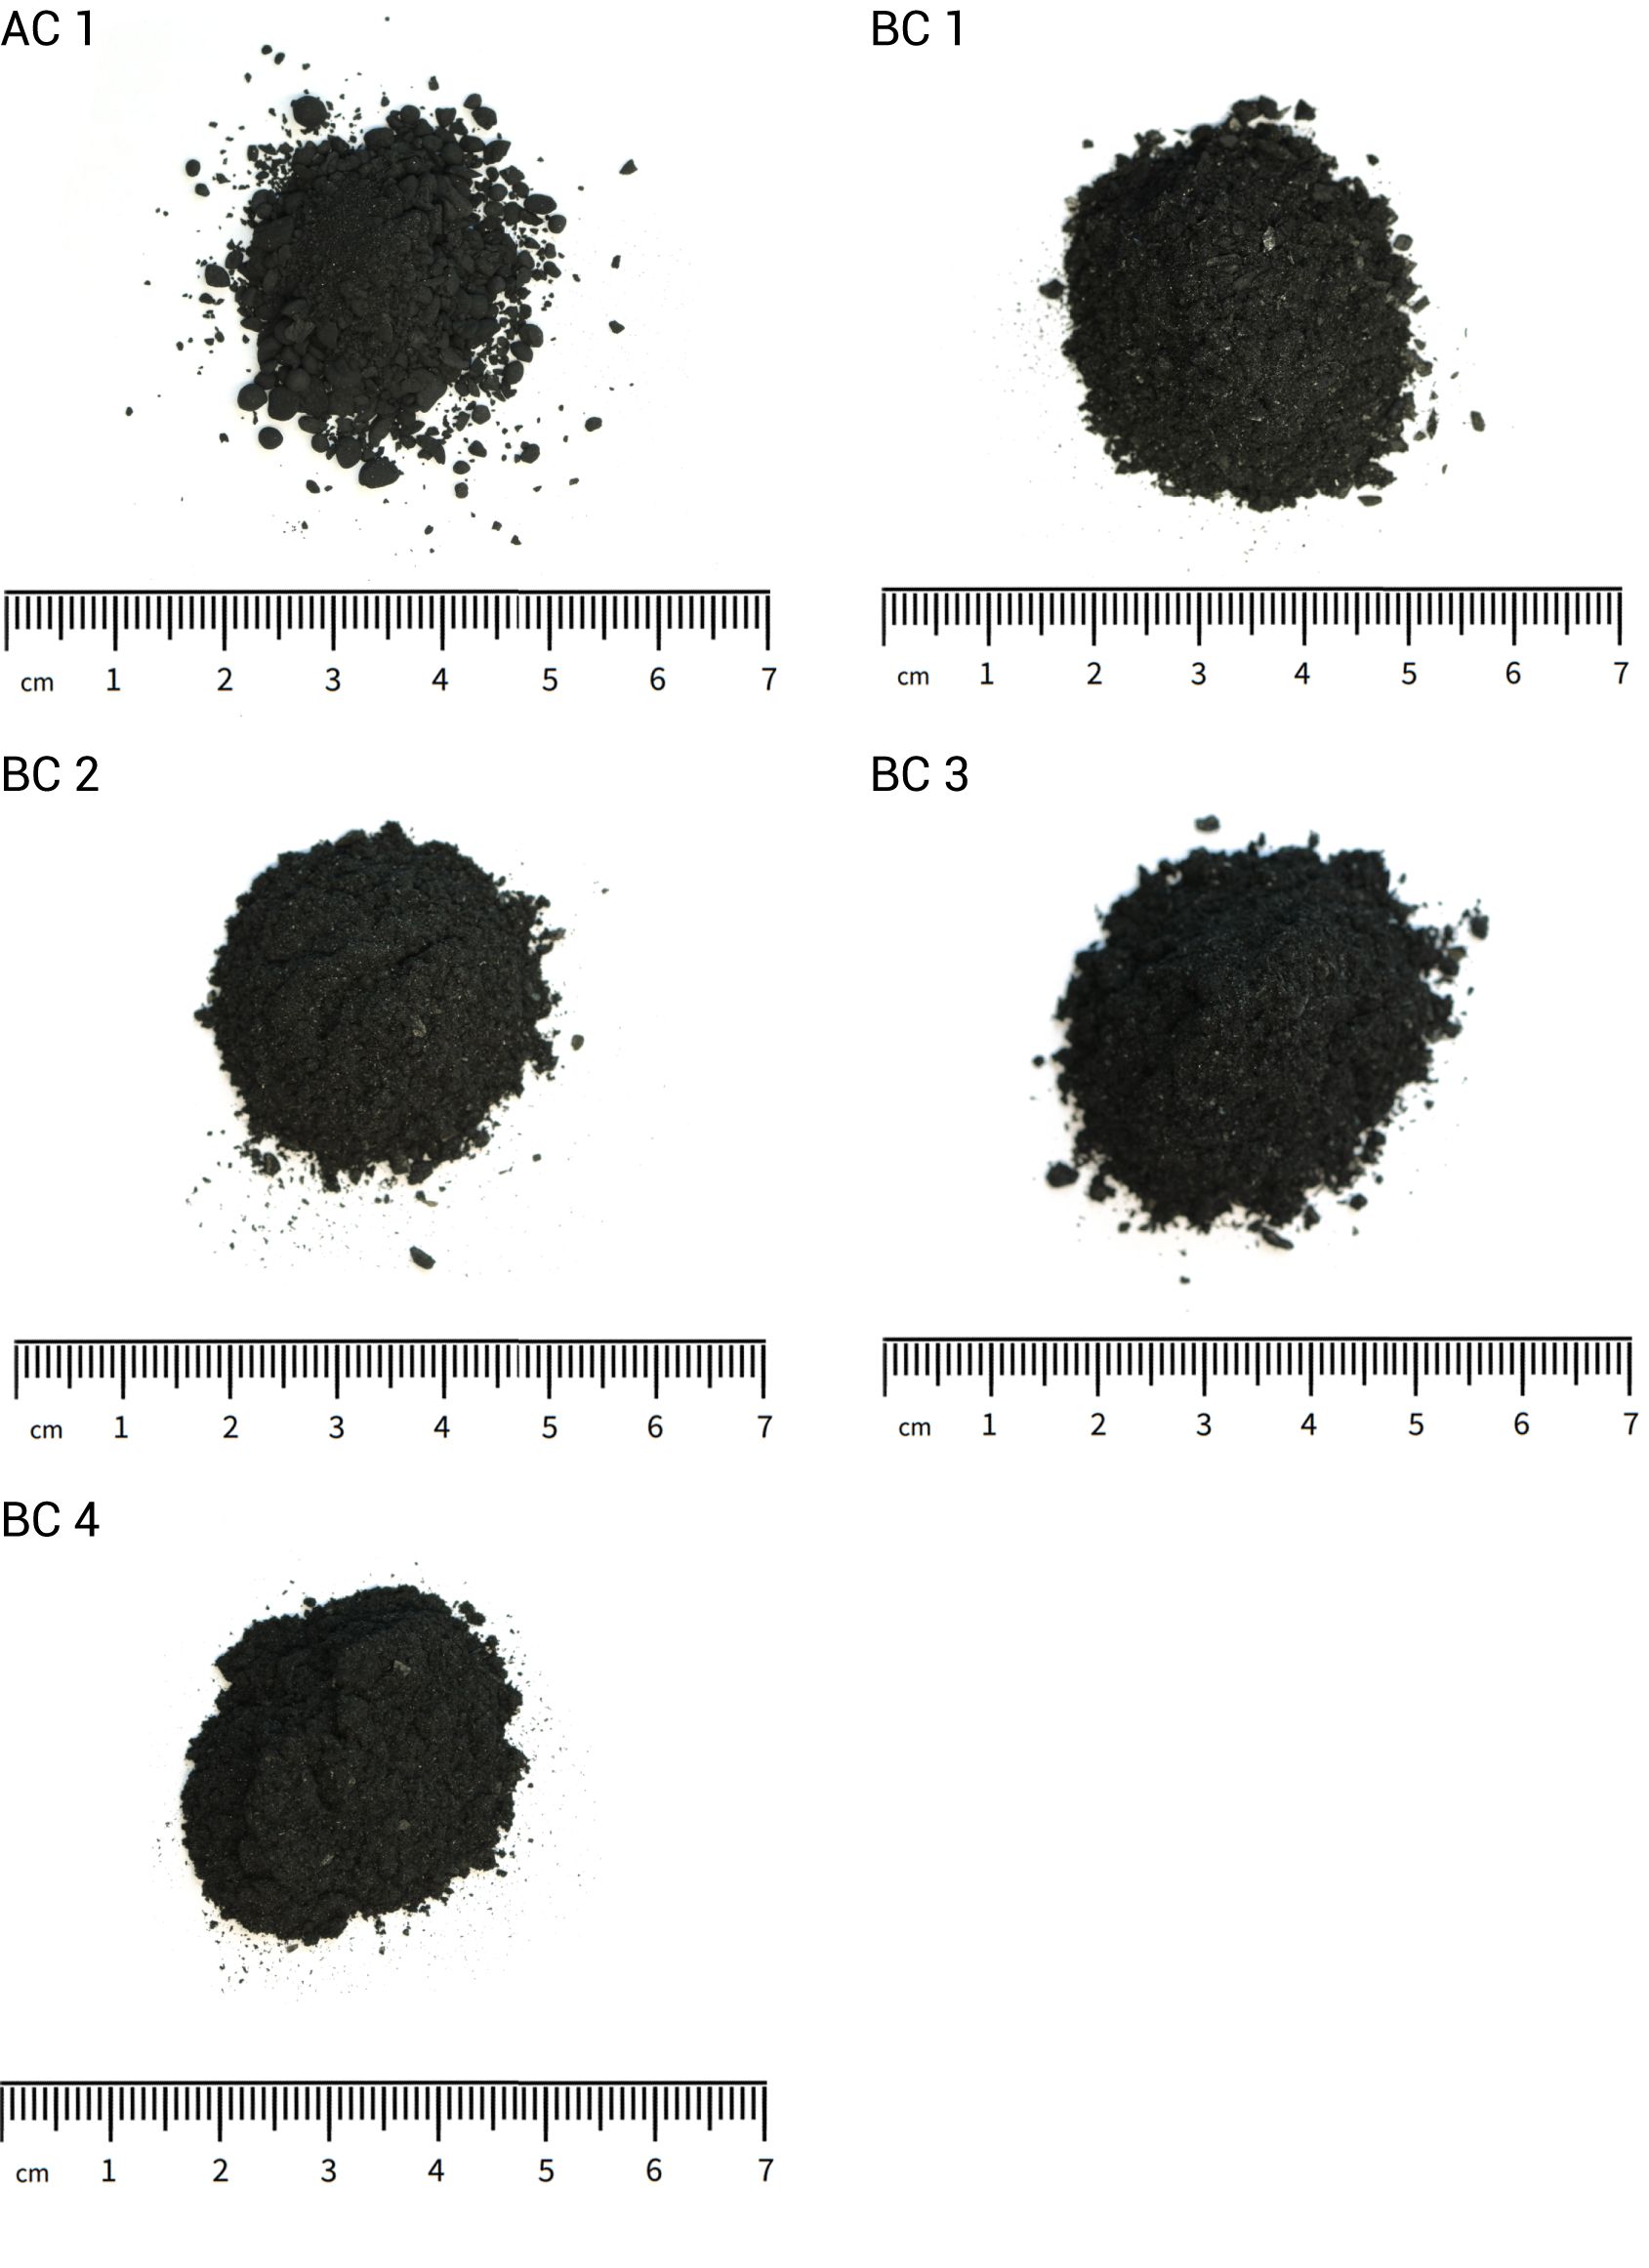
Figure 2. Graphical representation of the additives, one gram was used for each picture. AC 1 (active carbon); BC 1 (Biochar 1); BC 2 (Biochar 2); BC 3 (Biochar 3); BC 4 (Biochar 4).
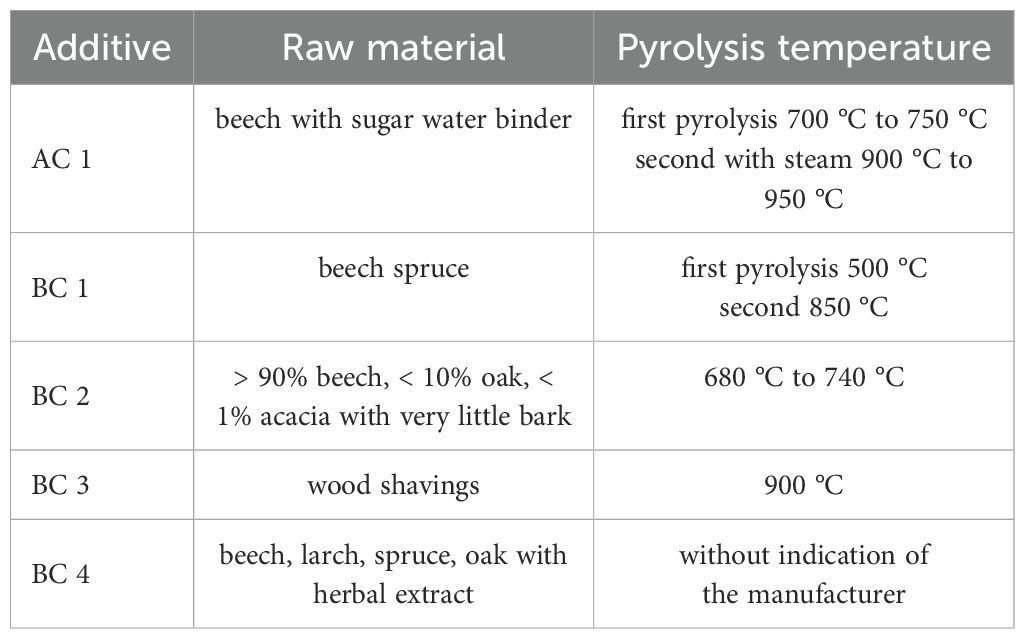
Table 2. Raw material and pyrolysis temperature of the additives.
2.4 Substrate preparation, experimental substrate, and rumen inoculum
The experimental substrate consisted of grass silage and conventional concentrate (Laktaria Lin 21 Pell., AGRAVIS Mischfutter Leine-Weser GmbH, Hildesheim, Germany) in a ratio of 60:40. The chemical composition of the silage, concentrate, and the corresponding mixture of both feeds is displayed in Table 3. The silage used as the fermentation substrate in the experiment was obtained from the Farm for Education and Research Ruthe, University of Veterinary Medicine Hannover, Foundation, Sarstedt, Germany. Silage was directly collected from the fresh cutting surface of the silo, sampled from six different locations using a silage drill. Following collection, the forage was immediately vacuum-sealed at a pressure of −1 bar. In the laboratory, the silage was manually cut to 10-mm-long particles, homogenized for daily use during the experiment, and pre-portioned. The samples were stored in the dark at −1 bar and 4°C. The concentrate was based on corn, rapeseed meal, wheat bran, and sugar beet molasses pellets and was sourced from a commercial feed manufacturer (Laktaria Lin 21 Pellets). The concentrate was freshly weighed daily for use in the experiment. Each fermentation substrate mixture contained a total of 15 g (DM), consisting of 9 g (DM) silage and 6 g (DM) concentrate. This mixture was placed in nylon bags (pore size 50 µm, in-situ concentrate bags 6.75 cm × 12 cm, ANKOM Technology Corp, Macedon, NY, USA). During the experimental phase (from day 8 onward, 10 out of the 12 fermenters received different additives, while the remaining two continued to receive only the substrate mixture. This process was repeated a second time. The first additive was activated charcoal (AC), and the remaining four were biochars: biochar 1 (BC 1), BC 2, BC 3, and BC 4. The raw materials of the individual carbons are listed in Table 2. The carbons were added to the substrate bags from the 8th day of the experiment at an amount of 0.3 g DM (equivalent to 2% of the substrate DM). At the start of the experiment, the rumen inoculum was obtained at 09:00 from a rumen-fistulated, non-lactating German Holstein cow at the Clinic for Cattle of the University of Veterinary Medicine Hannover, Foundation, Hanover, Germany. The donor animal was fed 10 kg of fresh matter (FM) silage and 3 kg of FM concentrate 2.5 h before the collection. The fresh rumen fluid was immediately separated from solids by double gauze and transferred to pre-warmed vessels. These vessels were pre-filled with nitrogen to minimize the impact of oxygen.
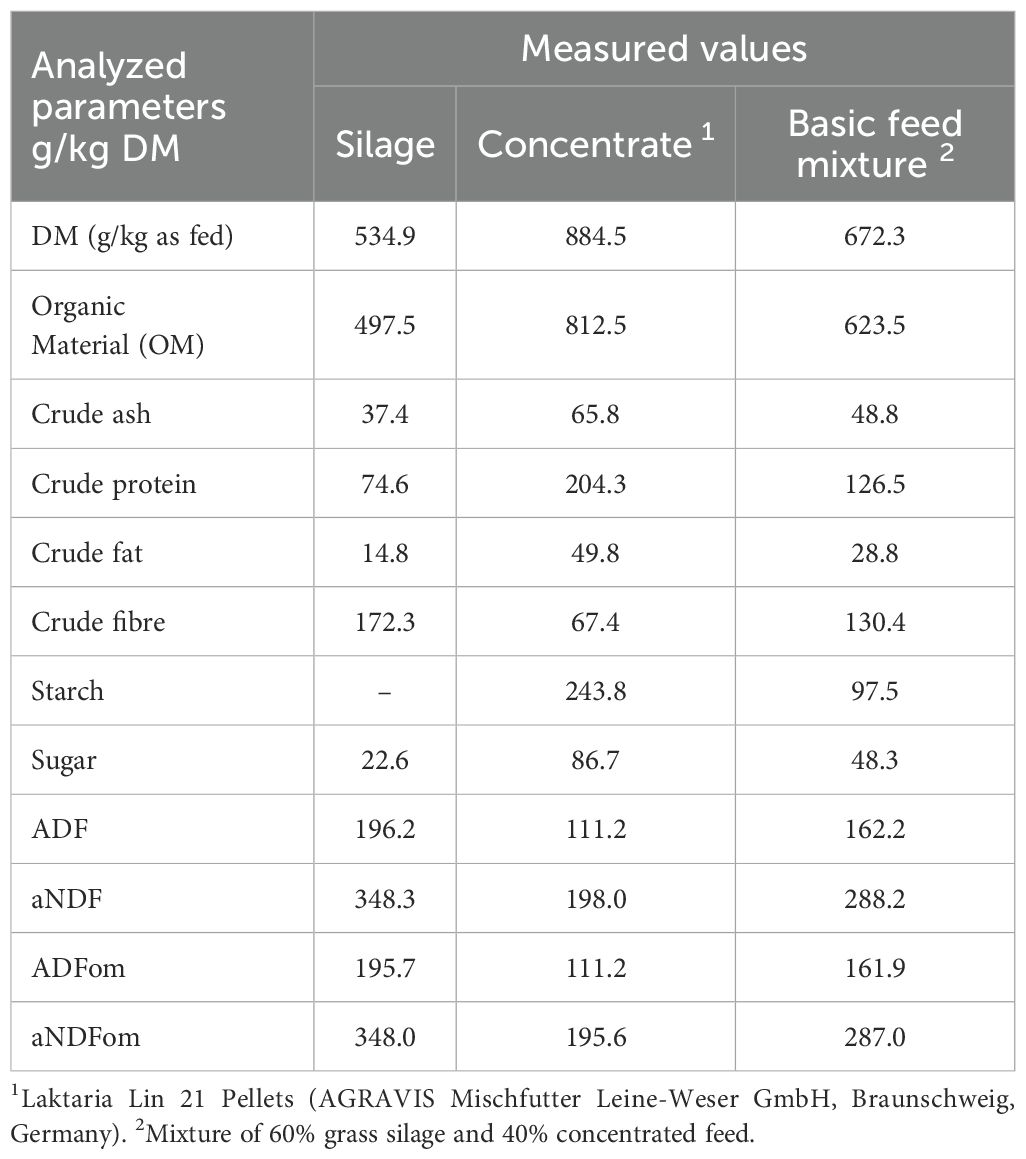
Table 3. Analysed values of the processed feed.
2.5 RUSITEC experimental procedure
Each RUSITEC consisted of 12 fermentation chambers with a volume of 1,000 mL. Within each chamber, there was a movable, perforated 350-mL feed chamber. The holes in the smaller feed chamber allowed its content to react evenly with the liquid in the fermentation chamber. An electric motor continuously moved the feed chamber to simulate rumen motility. Each fermenter had an inlet for buffer and a drainage opening through which wastewater discharged into a collection flask (capacity 2 L). To stop the fermentation processes within the collection flasks, the wastewater was cooled to below 4°C using ice. A gas collection bag was attached to each wastewater flask to collect the produced gas. A schematic representation of the RUSITEC apparatus can be seen in Figure 3. At the start of the experiment, each fermentation chamber was filled with 800 mL of filtered rumen fluid. The experimental design is presented in Figure 1. On day 1 of the experiment, the feed containers of each fermentation chamber were filled with a nylon bag containing 80 g (wet weight) of solid rumen content and a bag with the fermentation substrate. The rumen contents were exchanged for a bag with the fermentation substrate after 24 h. The fermentation substrate was incubated for 48 h each. Accordingly, one bag was exchanged for a fresh one every 48 h of fermentation. After removal, the nylon bags were rinsed with 40 mL of pre-warmed McDougall’s buffer (McDougall, 1948) and kneaded for 60 s to release adhering microorganisms. The rinsing solution was then transferred to a second vessel with a new feeding bag to transfer the microorganisms to the new substrate. Each fermenter was continuously supplied with McDougall’s buffer at a flow rate of 33.33 mL/h, resulting in a daily inflow of 800 mL (McDougall, 1948). The supplied buffer was mixed with ion-free water and contained the following (per liter): 9.8 g of NaHCO3, 9.3 g of Na2HPO4 × 12H2O, 0.47 g of NaCl, 0.57 g of KCl, 0.04 g of CaCl2 × 2H2O, and 0.06 g of MgCl2 × 6H2O.
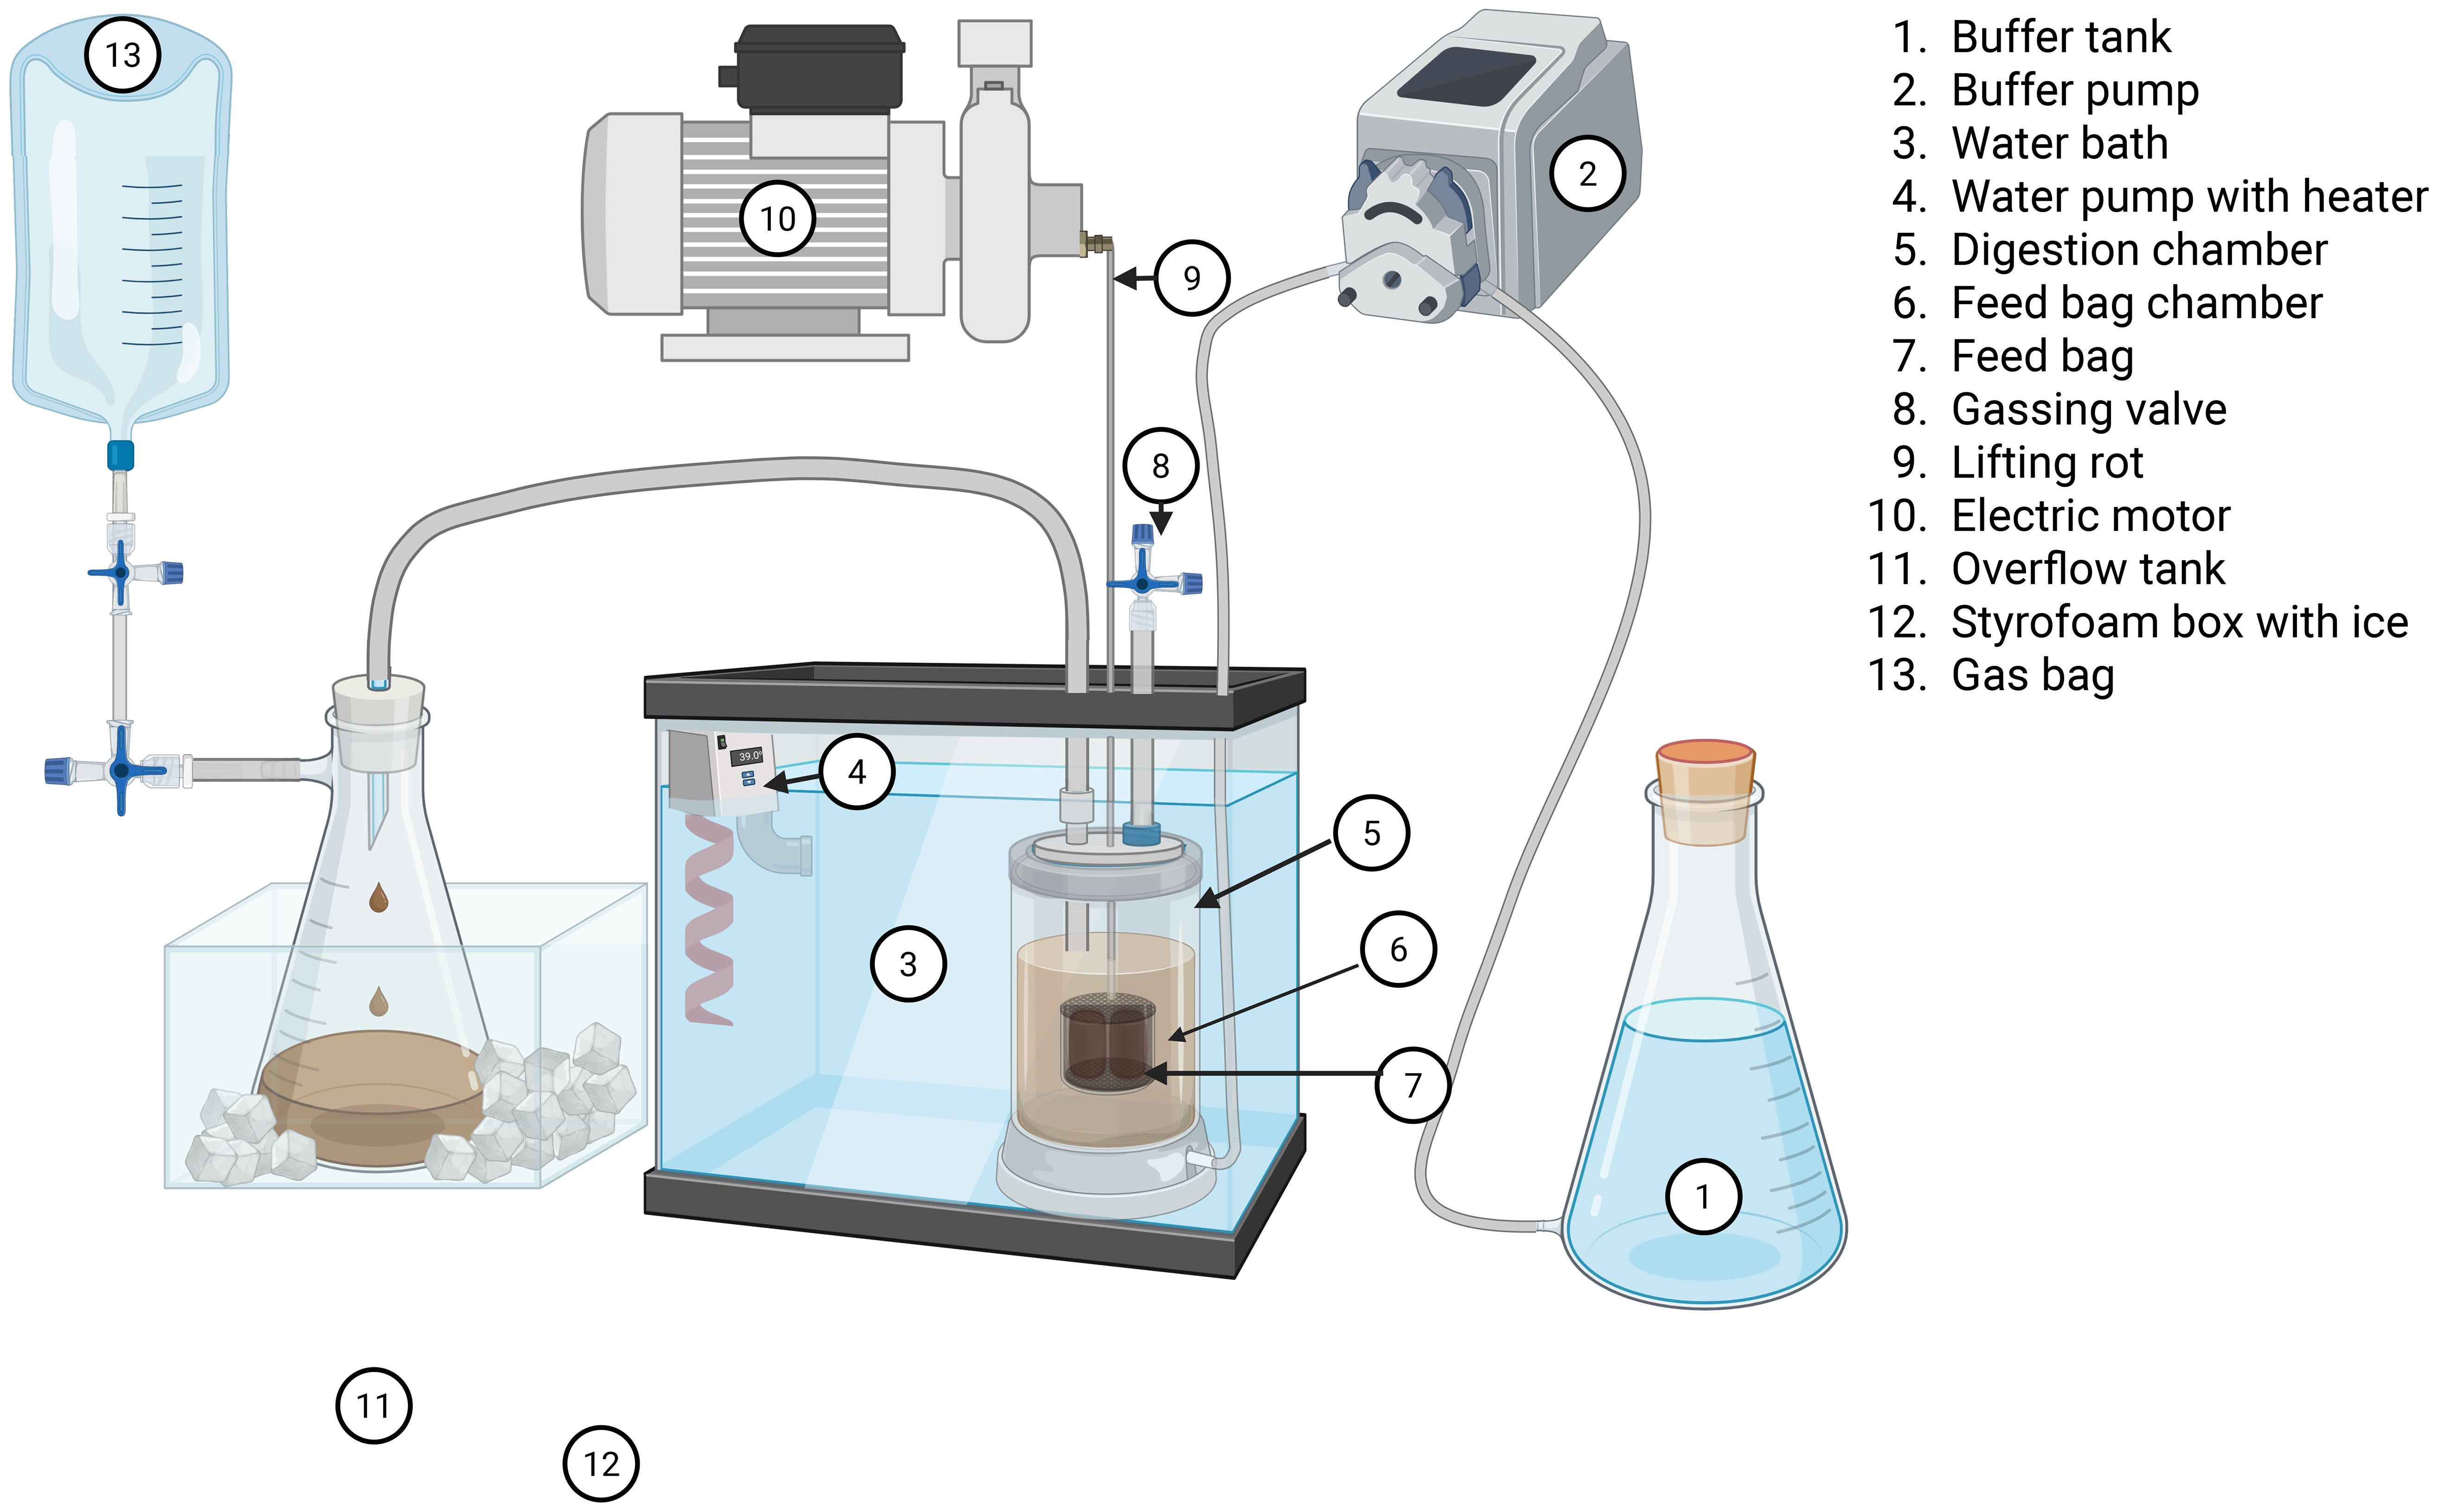
Figure 3. Schematic representation of a RUSITEC with labeling of individual components, Figure was created with BioRender.com.
2.6 Produced gas and methane concentration
The daily produced gas was collected in airtight bags connected to the overflow vessels. The gas volume was determined daily using the water displacement method. Methane concentration was determined from the 8th day onward in the produced gas. During the volume measurement of the produced gas, gas samples were taken using gas sampling mice (gas sampling mouse 50 mL with a double one-way valve, LAT – Labor- und Analysen-Technik GmbH, Garbsen, Germany). These were then sealed airtight and stored at room temperature until analysis. The Institute of Sanitary Engineering and Waste Management (Leibniz University, Hanover, Germany) conducted the analysis of gas composition [air (N2 + O2), methane (CH4), and carbon dioxide (CO2)]. The determination of CH4 and CO2 was carried out using a gas chromatograph (GC 2014, Shimadzu Europa GmbH, Duisburg, Germany). Nitrogen and oxygen were not separated but measured together as an air peak. The injection temperature was set at 110°C, and the separation was carried out on a 2.1-m-long glass column with an inner diameter of 2.6 mm, packed with HayeSep Q. This was operated isothermally at 60°C with helium as the carrier gas at a flow rate of 27 mL per minute. The ratio of CO2 to CH4 was determined by dividing the two daily produced molar masses of each fermenter.
2.7 Redox potential and pH
Redox potential and pH were determined daily directly in the respective fermenters during loading. The respective values were noted at the end of the feeding procedure. For measuring the redox potential, the electrode GR105-BNC (GHM GROUP- Greisinger, GHM Messtechnik GmbH, Regenstauf, Germany) was used, and for the pH value, the electrode GE 100 BNC (GHM GROUP- Greisinger, GHM Messtechnik GmbH, Regenstauf, Germany) was used. The GPRT 1400 AN (GHM GROUP- Greisinger, GHM Messtechnik GmbH, Regenstauf, Germany) was used as the measuring device.
2.8 Ammonia concentration and volatile fatty acids
The VFAs were analyzed according to the standard methods of the VDLUFA (2012). For daily determination of volatile fatty acids and ammonia concentration, 5 mL of liquid was pipetted from both the fermenter and the overflow fluid. After withdrawal, all samples were centrifuged at 4,600×g for 10 min. For determining volatile fatty acids, 1 mL of the supernatant was mixed with 0.1 mL of internal standard [17% phosphoric acid and 4-methylvaleric acid (0.25 mL/100.25 mL)] and frozen at −20°C until analysis. For analysis, the samples were thawed, centrifuged again at 3,000 rpm, transferred to an autosampler vial (WICOM Germany GmbH, Heppenheim, Germany), and examined by gas chromatography using a flame ionization detector (GC 2014, Shimadzu Europa GmbH, Duisburg, Germany). The ammonia concentration was determined using the Berthelot reaction. For determining the ammonia content, two 50 µL aliquots of liquid were taken from each centrifuged sample and mixed with 5 mL each of phenol solution (9.97 g of phenol, 0.051 g of sodium nitroprusside dihydrate, and 1,000 mL of aqua bidest.) and sodium hypochlorite solution (25 mL of 5 mol NaOH, 5 mL of 12% sodium hypochlorite, and 1,000 mL of aqua bidest.). The mixture was incubated for 10 min at room temperature. Subsequently, incubation at 60°C on a shaking plate for an additional 10 min followed. From each generated sample, 1 mL was transferred to cuvettes and measured three times at 546 nm in a photometer (BIOCHEMISTRY ANALYSER prietest ECO, QMLab, Steinfurt, Germany) to determine the average.
2.9 Nutrient digestion
The apparent dry matter loss (DML) was determined from an aliquot of the feed bags from day 8 to day 15. The assessable nylon bags were rinsed under cold tap water until the water showed no cloudiness. The prepared bags were frozen at −20°C until analysis. For analysis, the samples were thawed at room temperature for 24 h and then dried at 60°C for at least 48 h until a constant weight was achieved (Teoh et al., 2019b; Pérez-Ruchel et al., 2023). The DML was determined based on the dried weights minus the bag weights. The dried samples from each fermenter were combined after weighing and analyzed for their composition (Maia et al., 2019; Teoh et al., 2019b).
The additional digestive parameters, such as crude protein, crude fat, crude fiber, and ash content, were determined following the guidelines outlined by the Association of German Agricultural Analytic and Research Institutes (Naumann and Bassler, 2012; VDLUFA, 2012). The crude protein content was determined using the Dumas combustion method (vario MAX CNS, Elementar Analysensysteme GmbH, Langenselbold, Germany), where the measured total nitrogen content was multiplied by 6.25. Crude fat content was determined through extraction with petroleum ether, followed by drying. The crude fiber content was determined by washing with acid and alkali, followed by ashing at 550°C in a muffle furnace. The ash content was determined by ashing at 600°C for 7 h in the muffle furnace. Enzymatic starch content was measured photometrically using a UV test kit at a wavelength of 340 nm (UV-1900 i, Shimadzu Deutschland GmbH, Duisburg, Germany). Total sugar content was analyzed by inverting with sodium thiosulfate (Titrator TitroLine7000, Xylem Analytics GmbH & Co. KG, Weilheim, Germany). The acid detergent fiber (ADF) content was determined by boiling in ADF solution, followed by drying at 103°C for at least 12 h and ashing at 500°C in the muffle furnace for at least 1 h. The ADFom content was also calculated by back-weighing the ash. For the neutral detergent fiber (aNDF) and aNDFom content, the same procedure was used as for ADF determination, with the difference lying in the solution in which the sample was boiled. The loss of organic material (dOM) and apparent digestibility (AD) were calculated as per the following formulas:
2.10 Statistical analysis
The data were recorded in Excel spreadsheets (Excel, version 2016, Microsoft Corporation, Redmond, Washington, USA) and analyzed using SAS® statistical software, version 9.4M7 with SAS Enterprise Guide, version 7.15 (SAS Institute, Cary, North Carolina, USA).
Due to the small sample size, it is not feasible to reliably test for normal distribution. This dataset with n = 4 was created by pooling the aliquot of the feed bags from each individual fermenter, as the amount was too small for daily analysis. Consequently, the non-parametric pairwise Wilcoxon rank-sum test was employed for comparisons between treatments and the control. The effect of the treatments during 7 days (seven measurement points) was analyzed using a two-way analysis of variance with treatment as an independent factor and the days as repeated measures with compound symmetry as covariance structure, taking into account an interaction. Multiple pairwise tests of the treatments versus the control were calculated using Dunnett’s test. The SAS-Mixed procedure was used for the linear model. Statistical significance was considered at p <0.05, and tendencies were discussed for 0.05 ≥ p ≤ 0.10. The repetition of treatments with n = 4 was based on current literature (Brede et al., 2020; Guo et al., 2021; Terry et al., 2023). Based on the small number of fermenters per treatment (n = 4), the power for the comparison of produced methane is 0.307.
3 Results
3.1 Gas production
Upon examination of the daily collected gas values, the used carbons AC, BC 1, BC 2, and BC 4 exhibited no effects. The daily produced gas volume varied for all treatment groups, with values ranging from 1,899 mL to 2,218 mL, reflecting average measurements. In comparison, the control group produced 2,340 mL of gas. All the other reported gas values were also averages of the treatments, and the values of the control are provided in brackets for comparison. The measured percentage concentrations for pCO2 (percentage of CO2 content) varied from 30.1% to 33.7% (34.9%). The values for pCH4 (percentage of CH4 content) ranged from 5.72% to 6.64% (6.90%) in the fermentation gas. The daily generated molar masses fell within the range of 26.6 mmol/day to 34.3 mmol/day (37.2 mmol/day) for tCO2 (total CO2 content) and 5.03 mmol/day to 6.89 mmol/day (7.32 mmol/day) for tCH4 (total CH4 content). For the carbons AC, BC 1, BC 2, and BC 4, no effects in the gas volume to dry matter loss ratio (204–228 mL/g) were observed, and the ratio for the control was 225 mL/g. The ratios of CO2 to digested organic material ranged from 2.57 mmol/g to 3.03 mmol/g for the carbons and were 3.24 mmol/g for the control. The ratios of CH4 to digested organic material ranged from 0.492 mmol/g to 0.597 mmol/g for the carbons and were 0.636 mmol/g for the control. Additionally, the ratios of total gas volume to digested organic material ranged from 187 mL/g to 198 mL/g, while the values for the control were at 205 mL/g. A tentative reduction in influence was noted for char AC on pCO2 concentration (30.1% to 34.9%) in fermentation gas (p = 0.0838) and on the produced molar mass of CO2 (28.6 mmol/day to 37.2 mmol/day) (p = 0.0964). The application of BC 3 resulted in a significant reduction in the produced tCO2 quantity from 37.2 mmol/day to 26.6 mmol/day (p = 0.0453) as well as a decrease in the gas volume to disappeared dry matter ratio from 225 mL/g to 190 mL/g (p = 0.0199). BC 3 also exhibited a lower daily gas volume produced with 2,340 mL compared to 1,899 mL (p = 0.0255) and gas volume to dOM ratio from 205 mL/g in the control to 184 mL/g (p = 0.0304). The ratio of total produced carbon dioxide to dOM was significantly reduced from 3.24 mmol/g to 2.58 mmol/g (p = 0.0304), along with a decrease in the ratio of total produced methane to dOM from 0.636 mmol/g to 0.488 mmol/g (p = 0.0304). Additionally, there was a noticeable tendency toward a reduction in the daily produced quantity of CH4 (p = 0.0878) from 7.32 mmol/day to 5.03 mmol/day. The detailed results can be found in Table 4, and the corresponding p-values are presented in Table 5.
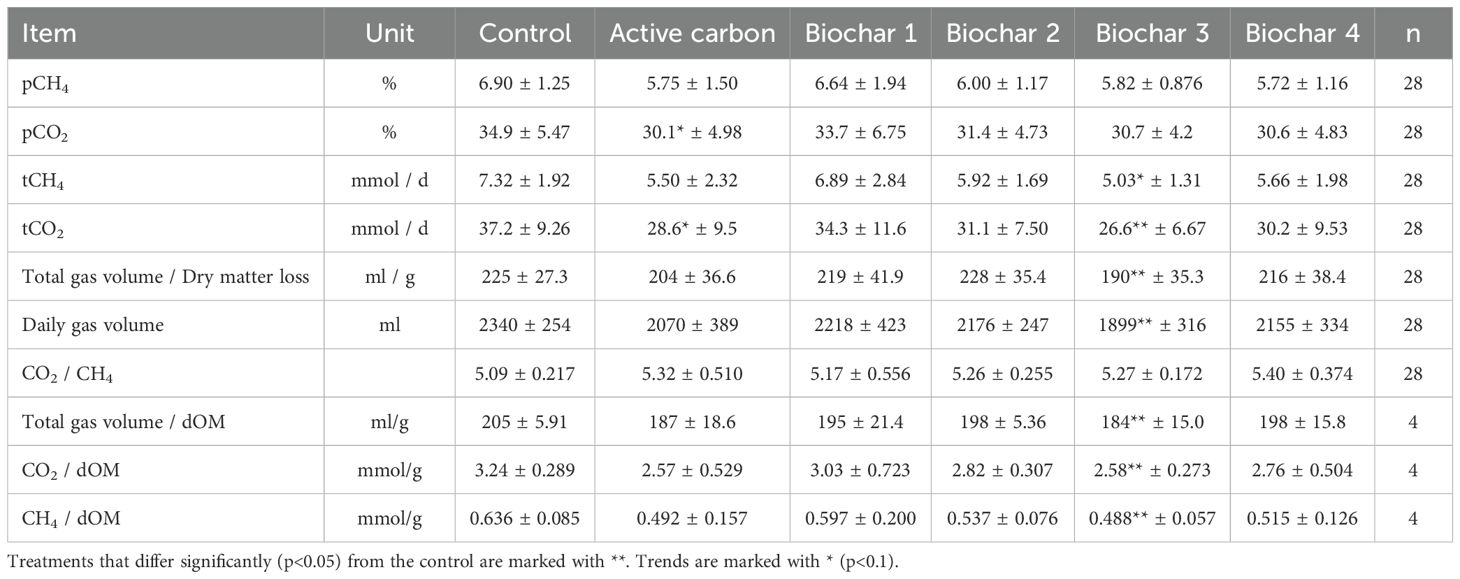
Table 4. Daily measured fermentation gas values and the ratio to the daily dry matter loss.
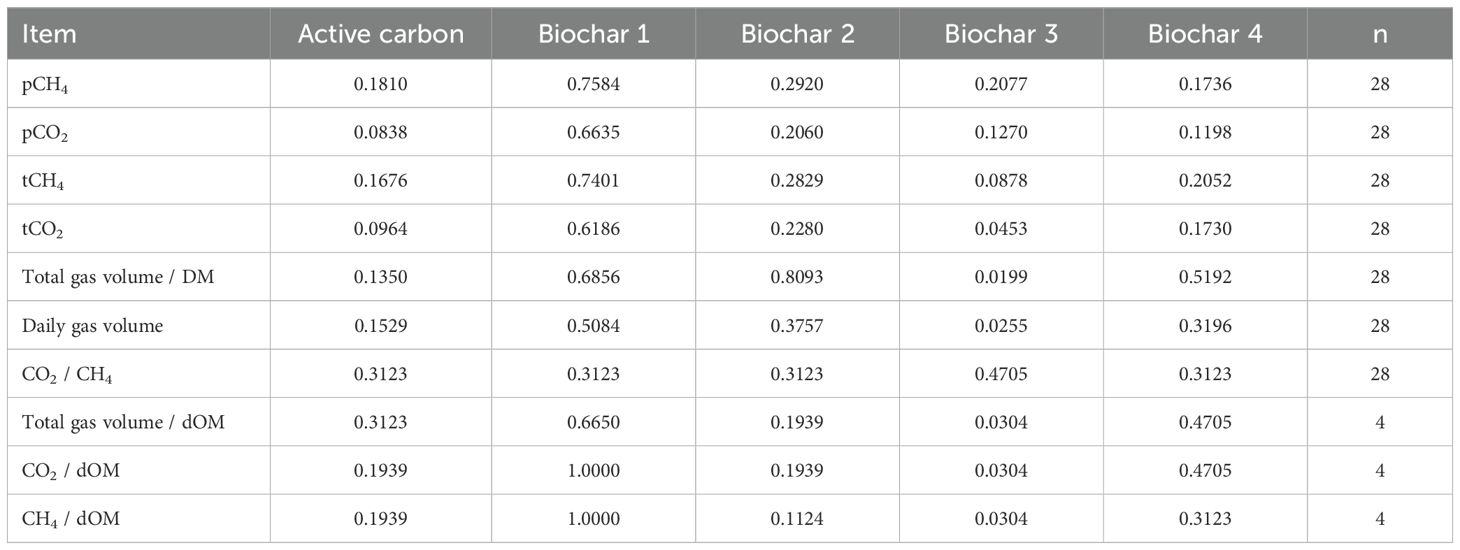
Table 5. P-values for the daily measured fermentation gas values and the ratio to the daily dry matter loss for the comparison of each treatment to the control.
3.2 Volatile fatty acids
The data regarding VFAs are presented in Table 6, and the corresponding p-values can be found in Table 7. The additives AC, BC 1, BC 2, and BC 4 demonstrated no effects on the average daily produced quantity of VFA, ranging from 59.8 mmol/day to 64.9 mmol/day. The application of BC 3 exhibited a decreasing impact on the production of various VFA compared to the control. Acetic acid decreased from 34.7 mmol/day to 27.7 mmol/day (p = 0.0248), and propionic acid decreased from 13.7 mmol/day to 10.1 mmol/day (p = 0.0166). Furthermore, the quantity of i-butyric acid was reduced compared to the control, from 0.698 mmol/day to 0.600 mmol/day (p = 0.0366), as well as i-valeric acid from 2.58 mmol/day to 2.23 mmol/day (p = 0.0304). The application of BC 3 also lowered the daily total produced VFA from 64.9 mmol/day to 54.4 mmol/day (p = 0.0226) and the overall produced VFA from 521 mmol to 439 mmol (p = 0.0304). The ratio of total produced VFA to digested organic material decreased from 6.5 mmol/g to 6.07 mmol/g (p = 0.0304). Additionally, the ratio of VFA to dry matter loss was reduced from 6.21 mmol/g in the control to 5.48 mmol/g with the addition of BC 3 (p = 0.0172). Conversely, BC 3 had an elevating effect on the pH value from 6.77 to 6.85 (p = 0.0309). The addition of BC 3 resulted in an increasing tendency for the acetic acid-to-propionic acid ratio in the control from 2.55 to 2.75 (p = 0.0566). On the other hand, there was a decreasing tendency in comparison to the control in digested organic material from 80.0 g to 72.3 g (p = 0.0606). The addition of BC 1 showed a decreasing tendency for the daily produced amount of i-valeric acid, 2.32 mmol/day compared to the control with 2.58 mmol/day (p = 0.0979).
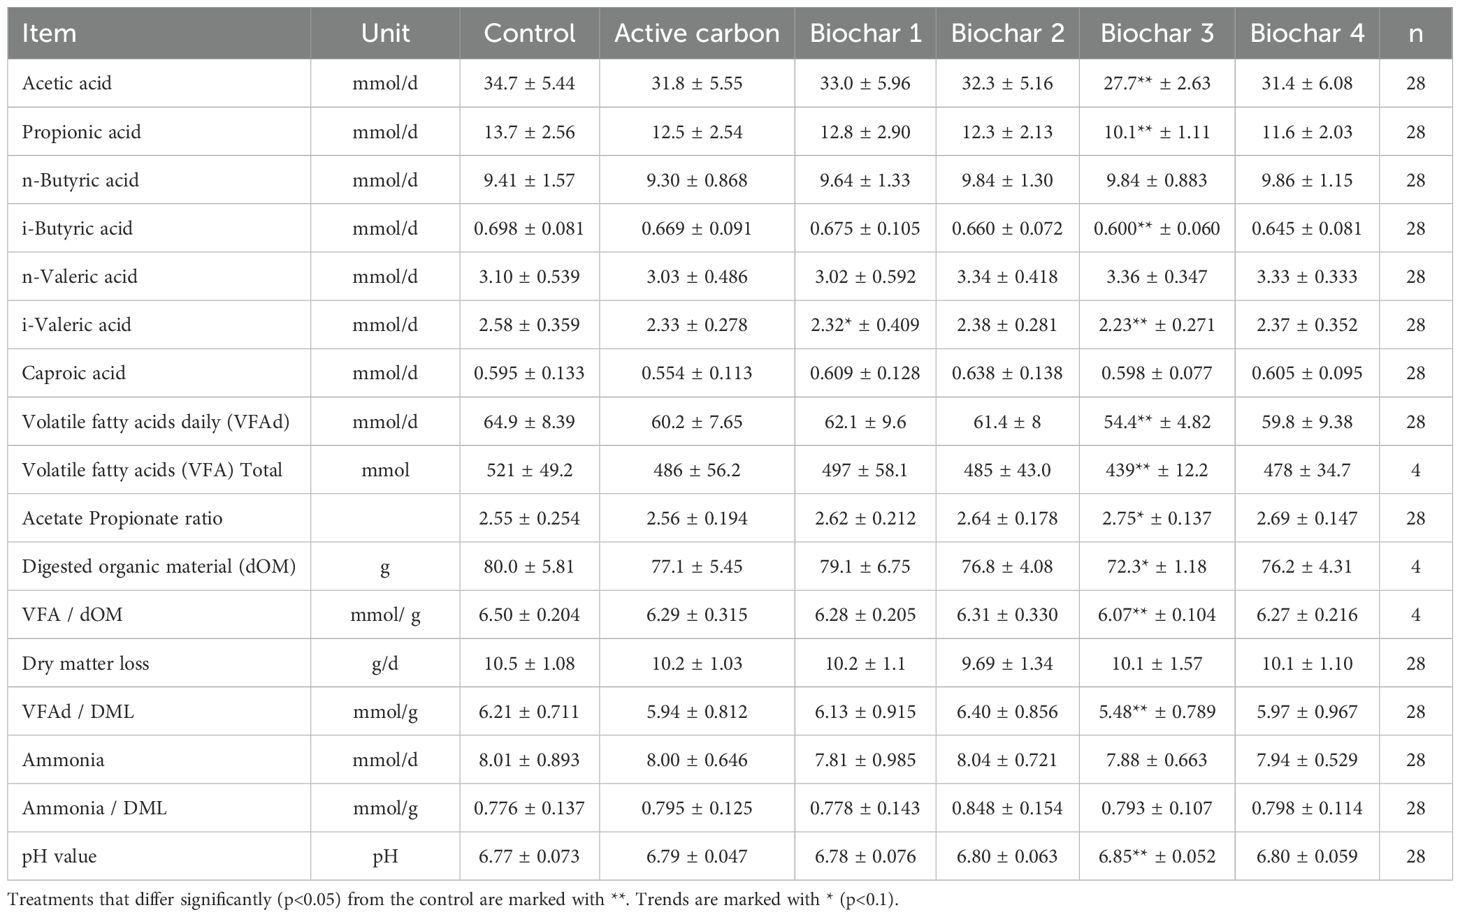
Table 6. Average daily volatile fatty acids produced with additional ratio to organic material digestion from day 8 to 15.
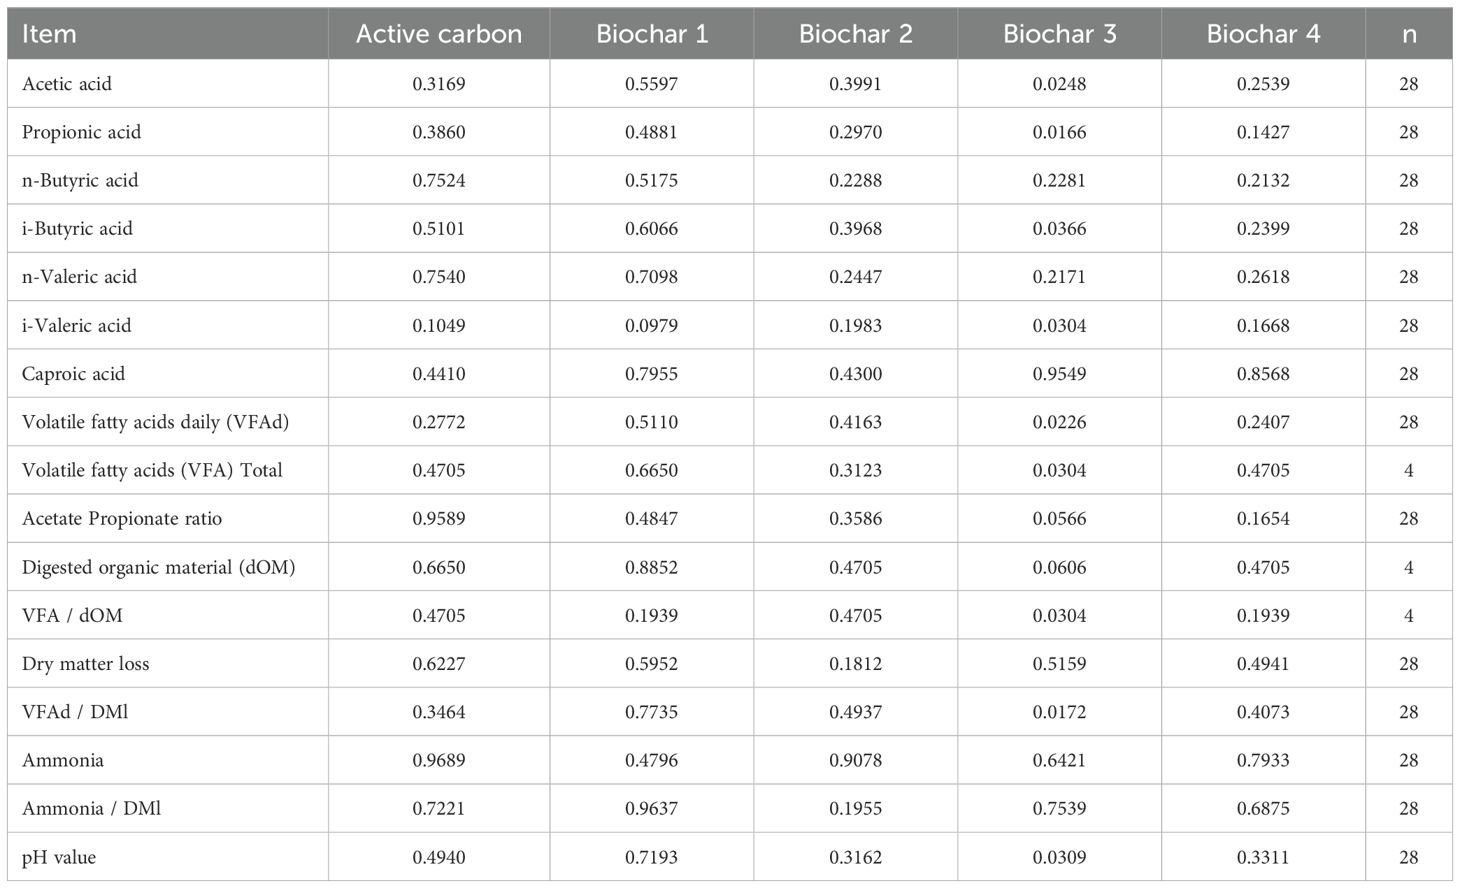
Table 7. P-values for average daily volatile fatty acids produced with additional ratio to organic material digestion from day 8 to 15 compared to control.
3.3 Digestibility
The addition of BC 3 resulted in a lower digestibility of 64.3% in comparison to 72.5% for the control (p = 0.0304). Similarly, it had a diminishing effect on the digestibility of organic material, decreasing it from 71.8% to 63.7% (p = 0.0304), crude fiber from 48.2% to 32.1% (p = 0.0304), ash from 80.8% to 72.9% (p = 0.0304), ADF from 46.9% to 30.4% (p = 0.0304), aNDF from 54.2% to 40.0% (p = 0.0304), ADFom from 47.6% to 31.2% (p = 0.0304), and aNDFom from 61.5% to 40.6% (p = 0.0304). Similarly, the addition of BC 4 had a reducing effect on the apparent digestibility of aNDFom, lowering it from 61.5% in the control to 46% (p = 0.0304). Conversely, BC 2 exhibited only a reducing tendency for the apparent digestibility of aNDFom to 47.0% (p = 0.0606). All the other additives had no effect on the apparent digestibilities. The mentioned data and corresponding p-values can be found in Tables 8, 9.
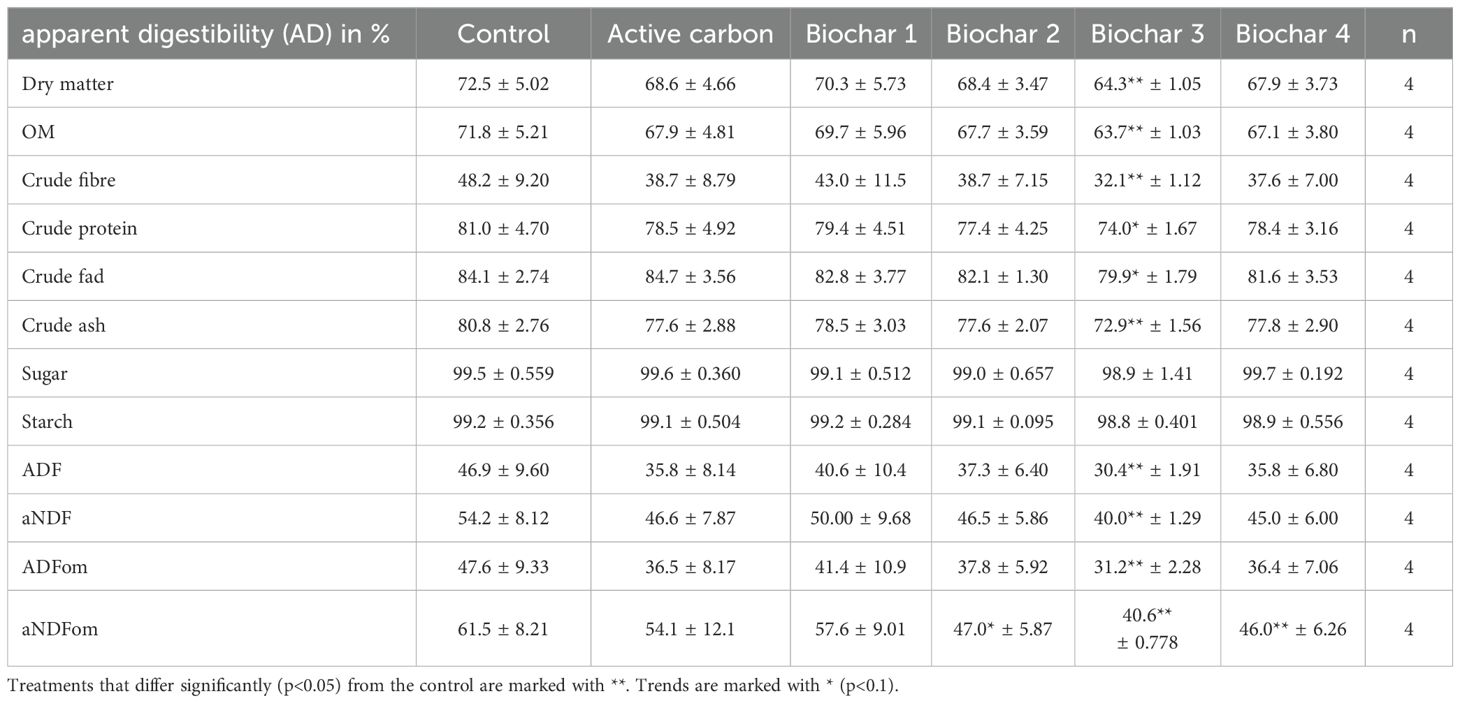
Table 8. Apparent digestibility of the different treatments expressed as a percentage.
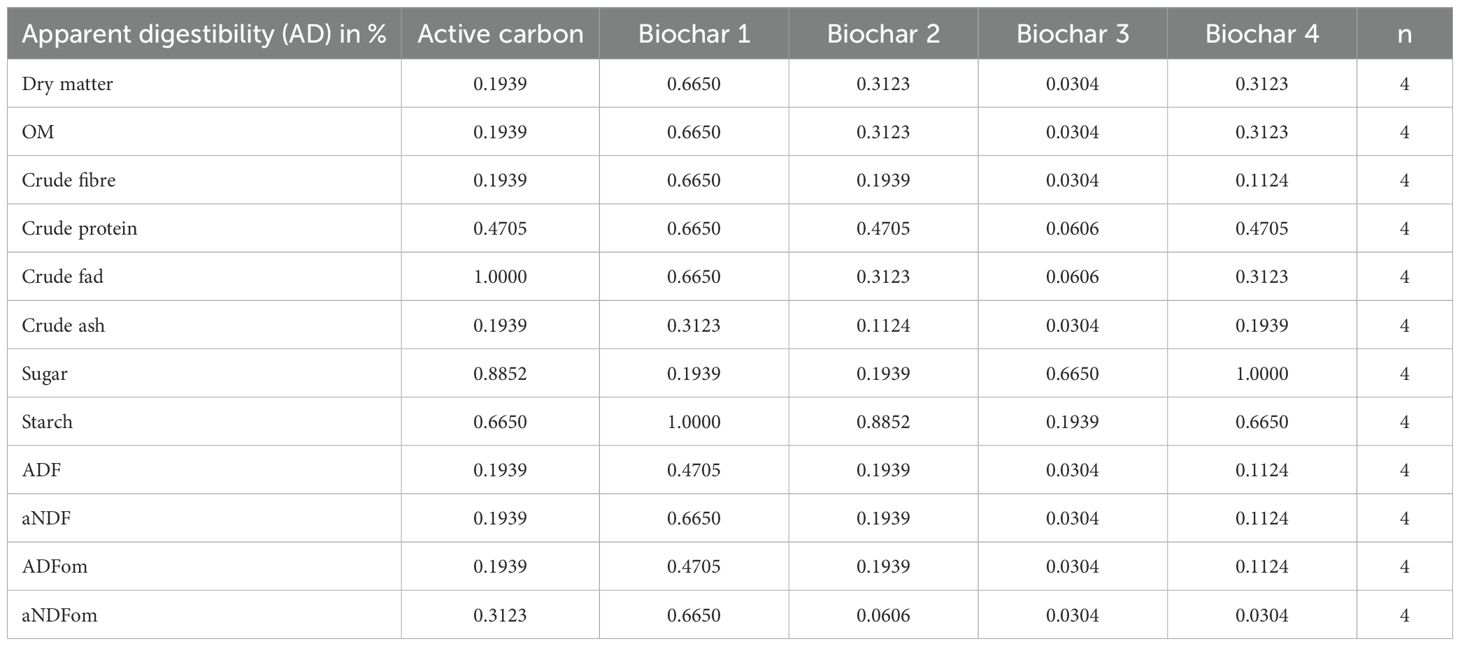
Table 9. P-values for the apparent digestibility expressed as a percentage of the different additives compared to the control.
4 Discussion
The key finding of this in-vitro study using the RUSITEC system was that among the five carbon sources, only BC 3 significantly influenced gas production, fermentation parameters, and digestibility. The aim of this study was to investigate the effects of five different carbon additives (one activated carbon, four biochars) compared to control feeding without additives on fermentation parameters, methane and carbon dioxide production, and the disappearance rate of fermentation substrates.
4.1 Volatile fatty acids and ammonia production
In the present study, it was observed that certain carbon additives may have an inhibitory effect on VFA production. The addition of BC 3 resulted in a significant reduction by 16.2% in the daily average production of total VFA (64.9 mmol/day to 54.4 mmol/day). Similar findings were reported by Tamayao et al. (2021a) and Tamayao et al. (2022). In the former study, the control treatment produced 56.8 mmol/day of VFA compared to 56.4 mmol/day with biochar supplementation. In the latter study by Tamayao et al. (2022), in the first experiment, the concentration of produced VFA decreased by 4% from 75 mmol/L in the control to 72 mmol/L with the addition of 4.5% DM of biochar. Contrary results were reported by Teoh et al. (2019b), where the use of biochar showed no effect on VFA production. Conversely, the treatment with biochar in the study by Saleem et al. (2018) resulted in an increase in VFA production. Without carbon, volatile fatty acids were produced at a rate of 64.0 mmol/day, while supplementation with 2% biochar increased this to 68.5 mmol/day.
The acetate-to-propionate ratio is a crucial tool for describing the fermentation pattern, providing insights into the microbial composition in the fermentation fluid (Van Kessel and Russell, 1996; Russell, 1998; Christophersen et al., 2008). Similar to the descriptions by McFarlane et al. (2017) and Tamayao et al. (2021b), the use of biochar in this study did not significantly affect the acetate-to-propionate ratio. Only the use of BC 3 showed an increasing tendency (p = 0.0566), with the control having a lower quotient of 2.55 compared to BC 3 with 2.75. This could indicate an inhibition of propionic acid production. Such a shift in the fermentation pattern could be indicative of enhanced fiber digestion due to BC 3, as increased fiber digestion tends to shift the VFA pattern in favor of acetic acid (Ungerfeld, 2020; Arowolo et al., 2022). Additionally, considering the ratio of VFA to dOM, it is more likely that fiber digestion was less strongly inhibited compared to propionic acid production. This is evident when examining the ratio of produced VFAs to dOM; the treatment with BC 3 exhibited a significantly lower quotient at 6.07 mmol/g compared to 6.50 mmol/g for the control. This is more indicative of an overall fermentation inhibition with a concomitant reduced production of VFAs.
In this study, no significant impact on ammonia (NH3) production was observed. Similar findings were reported by Pereira et al. (2014) and Tamayao et al. (2021b). According to the study by Cabeza et al. (2018), the use of biochar reduced ammonia production. Additionally, this study demonstrated that the production conditions of biochar also have effects on ammonia concentration. In that study, five different raw materials were charred under two different temperatures, and their effects were compared. In the study by Cabeza et al. (2018), the control produced 1.89 mmol/g of DM ammonia, whereas the treatment with BC from Miscanthus straw pellets produced only 1.03 mmol/g of DM ammonia. On the contrary, the study by Saleem et al. (2018) suggested that with an increasing proportion of biochar in the diet, ammonia production increased. This study demonstrated that without BC, only 6.6 mmol/day of ammonia was produced. However, with the administration of 2% BC, an ammonia level of 7.3 mmol/day was measured. This suggests that biochar may have an enhancing effect on either proteolysis and the deamination of proteinaceous dietary components or the incorporation of ammonia into microbial protein (Cabeza et al., 2018).
4.2 Digestibility
With the exception of BC 3, the used charcoals exhibited no significant impact on the apparent digestibility of organic material. In BC 3, the digestibility of OM was significantly lower than in the control treatment. Also, when feeding biochar to growing cattle at concentrations of 0%, 0.8%, and 3% of total mixed ration (TM), no significant difference in the apparent digestion of organic material could be observed (Winders et al., 2019). The results from the in-vitro study by Tamayao et al. (2022), who utilized supplements of 4.5%, 13.5%, and 22.5%, demonstrated a linear decrease in dry matter loss with increased addition of biochar. Likewise, the study by O’Reilly et al. (2021) revealed a reduction in in-vitro digestibility of dry matter with increased biochar supplementation. Conversely, Saleem et al. (2018) illustrated in their study that incorporating biochar positively affected the apparent digestibility of organic matter. In that study, digestibility increased with higher biochar supplementation, reaching 75.2% at a 2% addition of biochar. Saleem et al. (2018) also demonstrated a positive effect of biochar supplementation at a rate of 2% on the apparent digestibility of neutral detergent fiber (39.9% vs. 46.4%) and acid detergent fiber (29.9% vs. 38.2%). In the present study, due to the addition of 2% BC, no significant differences in fiber digestion were detected.
4.3 Gas production
In the present study, adding AC, BC 1, BC 2, and BC 4 to the basal diet had no effect on gas production. Only BC 3 significantly reduced gas production compared to the control feeding. This is evident in the daily gas volume produced, with the control yielding 2,340 mL/day compared to the BC 3 treatment, which produced 1,899 mL/day. With the exception of BC 3, similar findings were reported by Leng et al. (2012), where administering 5% BC after 24 and 48 h showed no significant differences in total gas production. This observation was also reflected in the ratio of produced gas volume compared to apparent digestibility when using most additives. Similar findings were reported by Pereira et al. (2014), who stated that the use of biochars produced from different raw materials (corn straw and pine wood) and at varying production temperatures did not yield significant differences in gas production.
The percentage of CO2 (30.1% up to 34.9%) and methane (5.72% up to 6.90%) in the produced gas indicates that the supplementation with biochar has no effect, except for the AC treatment, which showed a tendency to reduce carbon dioxide concentration (p < 0.1) from 34.9% in the control to 30.1% in the AC application. However, when considering the tCO2, the tendency in reduction through the AC treatment remains evident, but the administration of BC 3 significantly reduced tCO2 production from 37.2 mmol/day in the control to 26.6 mmol/day. Nonetheless, there was only a tendency toward reduced daily methane production (p = 0.0878). In comparison to the control with 7.32 mmol/day of methane, the BC 3 treatment yielded only 5.03 mmol/day of methane. Furthermore, the study by Durmic et al. (2022) also demonstrated that some BCs have no influence on methane generation, while one BC was able to reduce methane production by 8.6%. In the present study, this tendency is also evident in the ratio of produced gas volume relative to apparent digestibility with most additives. Given that the produced gas volume is significantly influenced by the loss rate of fermented material (Xue et al., 2015), this study also computed the ratio of produced gas quantity to the apparent digestibility of dry matter. While the control yielded 205 mL/g, the BC 3 treatment only produced 184 mL/g. Consequently, the BC 3 treatment exhibited approximately 10.3% less gas production per gram of digested organic material compared to the control without additives.
Conversely, no significant differences were observed among the other treatments. Similar findings were also reported in the study by Tamayao et al. (2022), albeit not to this extent. However, the use of 4.5% DM biochar was able to reduce the ratio of produced gas to DML by 1%, from 189.6 ml/g in the control to 187.8 mL/g (Tamayao et al., 2022). Similar findings were also obtained in the study by Cabeza et al. (2018), thus indicating that the use of biochar has a negative impact on gas production. In that study, the control produced 267 mL/g DM compared to the treatment with biochar from Miscanthus straw, which only produced 252 mL/g DM. Cabeza et al. (2018) proposed that the employed carbons, due to their large surface area and porous structure, exhibit increased gas adsorption capacity, leading to some of the gas being bound to the carbon. However, this proposition seems untenable when considering the difference observed in the present study. Although the Brunauer–Emmett–Teller (BET) surface area of AC is 875 m²/g and that of BC 3 is only 221 m²/g, the biochar with a significantly lower value is supposed to have absorbed more gas (Table 2). It is more likely that the fermentation was inhibited rather than 441 mL of gas being trapped in 0.3 g DM of biochar. The BC 3 treatment exhibits the highest pH value at 6.85, induced by the inhibited VFA production. This inhibited production of VFA probably resulted in the understandable slowing down of gas production. On the contrary, it was also demonstrated in the study by Tamayao et al. (2022) that the use of different biochars can lead to an increase in the ratio, i.e., 189.6 mL/g in the control to 191.6 mL/g, representing a 1.1% increase. In the study by Sperber et al. (2022), where steers were fed with 0.8% DM BC, a 3.5% increase in the ratio of produced CO2 to fed DM was also observed.
The aim of this study was to investigate the effects of carbon sources on rumen fermentation, gas production, and in-vitro digestibility. The parameters of gas production and in-vitro digestibility must always be considered in context. Due to inhibited digestibility, gas production is also reduced (Wang et al., 2016). As demonstrated in the study by Wang et al. (2016), inhibition of methane production can lead to inhibition of digestion in in-vitro studies, thereby reducing overall total gas production. Simultaneously, it was observed that the production of VFA was also diminished. Reduced digestibility is typically associated with a decrease in animal performance and should be taken into account for livestock feeding accordingly (Chibisa et al., 2020). In this study, for BC 3, both in-vitro digestibility and gas production were lower compared to the control. However, with BC 3, gas production was more strongly reduced than digestion, as evidenced by the lower ratio of produced gas to digested organic material. Thus, the reduced gas production can be attributed not only to decreased digestibility but also to other effects of the carbon source. This inhibition in fermentation is further reflected in the effectiveness of VFA production and its ratio to the apparent digestion of organic material, with an observed decrease of 6.62%. A reduction in VFA production may indicate inhibition of rumen metabolism. The microorganisms and their products resulting from this process constitute the majority of the ruminant’s energy requirements (Fu et al., 2023). Considering this, the results for BC 3 from this study should be interpreted with caution and potentially investigated in further in-vivo experiments. This is to either further substantiate the findings or refute them due to interactions in live animals.
Given the small sample size of four individuals, and although the comparison-wise type I error rate for each individual test was considered, the experiment-wise error rate (Bonferroni) for multiple pairwise comparisons was not. For example, the comparison for methane between treatment 1 and treatment 2 only resulted in a power of 0.307. Here, at least 18 fermenters per group would be necessary for a power of 0.8. With an alpha adjustment according to Bonferroni, at least 27 fermenters per group would be required for 5 group comparisons against a control (p < 0.01). Due to the cost structure of the project, which this study was part of, and the aim to compare the carbons for a subsequent study, an increase in the sample size was not feasible. Thus, the results from this study can only be regarded as indicative. However, in order to draw conclusions for the entire population, further studies with a significantly higher sample size are required.
5 Conclusion
The use of specific wood-based biochars (2%) in a grass silage-based feed ration can have a mitigating effect on greenhouse gas production, which was shown for the RUSITEC system. However, it can simultaneously inhibit the production of VFAs and digestibility while increasing the pH value. Thus, biochar has the potential to affect rumen fermentation in vitro. Nonetheless, this statement cannot be generalized for all carbons used. Four of the five carbons introduced had no effect on fermentation or fermentation products. Further investigations are required for a more precise assessment of the impact of biochars on fermentation, as the results are only to a limited extent transferable to use in animals and should be assessed by in-vivo tests.
Data availability statement
The raw data supporting the conclusions of this article will be made available by the authors, without undue reservation.
Ethics statement
The animal study was approved by The Lower Saxony State Office for Consumer Protection and Food Safety (LAVES; reference: 33.8-42502.05.17A238). The study was conducted in accordance with the local legislation and institutional requirements.
Author contributions
AW: Data curation, Formal analysis, Investigation, Methodology, Visualization, Writing – original draft, Writing – review & editing. MH: Conceptualization, Methodology, Writing – review & editing. KR: Data curation, Writing – review & editing. VH: Writing – review & editing. FW: Writing – review & editing, Project administration. WS: Funding acquisition, Writing – review & editing. NT: Project administration, Writing – review & editing, Funding acquisition, Resources. DS: Writing – review & editing, Conceptualization, Data curation, Formal analysis, Investigation, Methodology, Visualization, Writing – original draft. CV: Conceptualization, Data curation, Formal analysis, Funding acquisition, Investigation, Methodology, Project administration, Resources, Supervision, Visualization, Writing – original draft, Writing – review & editing.
Funding
The author(s) declare that financial support was received for the research and/or publication of this article. This IGF project AiF 21975N is funded through the AiF as part of the Industrial Collective Research (IGF) program of the German Federal Ministry for Economic Affairs and Climate Protection (BMWK) based on a resolution of the German Bundestag. This publication has been supported by the German Research Foundation and the Foundation of the University of Veterinary Medicine Hannover within the framework of the Open Access Publishing support program.
Acknowledgments
We wish to thank Frances Sherwood-Brock for proofreading the manuscript to ensure the correctness of the English language. Figures 2, 3 were created with BioRender.com on 20 December 2023.
Conflict of interest
The authors declare that the research was conducted in the absence of any commercial or financial relationships that could be construed as a potential conflict of interest.
Generative AI statement
The author(s) declare that no Generative AI was used in the creation of this manuscript.
Publisher’s note
All claims expressed in this article are solely those of the authors and do not necessarily represent those of their affiliated organizations, or those of the publisher, the editors and the reviewers. Any product that may be evaluated in this article, or claim that may be made by its manufacturer, is not guaranteed or endorsed by the publisher.
Abbreviations
AC, active carbon; AD, apparent digestibility; BC, biochar; BW, body weight; DM, dry matter; DML, dry matter loss; dOM, digested organic material; FM, fresh mass; pCO2, percentage of carbon dioxide; pCH4, percentage of methane; RUSITEC, rumen simulation technique; tCO2, total amount of carbon dioxide; tCH4, total amount of methane; TM, total mixed ration; VFA, volatile fatty acid.
References
Abken H.-J., Tietze M., Brodersen J., Bäumer S., Beifuss U., and Deppenmeier U. (1998). Isolation and characterization of methanophenazine and function of phenazines in membrane-bound electron transport of Methanosarcina mazei Go1. J. bacteriology 180, 2027–2032. doi: 10.1128/JB.180.8.2027-2032.1998
Ao R. L. and Emeritus D. (2008). The potential of feeding nitrate to reduce enteric methane production in ruminants. A Rep. to department Climate change Canberra Australia.
Arowolo M. A., Zhang X. M., Wang M., Wang R., Wen J. N., Hao L. Z., et al. (2022). Proper motility enhances rumen fermentation and microbial protein synthesis with decreased saturation of dissolved gases in rumen simulation technique. J. Dairy Sci. 105, 231–241. doi: 10.3168/jds.2021-20165
Bačėninaitė D., Džermeikaitė K., and Antanaitis R. (2022). Global warming and dairy cattle: How to control and reduce methane emission. Animals 12, 2687. doi: 10.3390/ani12192687
Bionaz M., Vargas-Bello-Pérez E., and Busato S. (2020). Advances in fatty acids nutrition in dairy cows: From gut to cells and effects on performance. J. Anim. Sci. Biotechnol. 11, 1–36. doi: 10.1186/s40104-020-00512-8
Brede M., Haange S.-B., Riede S., Engelmann B., Jehmlich N., Rolle-Kampzczyk U., et al. (2022). Effects of different formulations of glyphosate on rumen microbial metabolism and bacterial community composition in the rumen simulation technique system. Front. Microbiol. 13, 873101. doi: 10.3389/fmicb.2022.873101
Brede M., Orton T., Pinior B., Roch F.-F., Dzieciol M., Zwirzitz B., et al. (2020). PacBio and Illumina MiSeq amplicon sequencing confirm full recovery of the bacterial community after subacute ruminal acidosis challenge in the RUSITEC system. Front. Microbiol. 11, 1813. doi: 10.3389/fmicb.2020.01813
Brede J., Peukert M., Egert B., Breves G., and Brede M. (2021). Long-term Mootral application impacts methane production and the microbial community in the rumen simulation technique system. Front. Microbiol. 12, 691502. doi: 10.3389/fmicb.2021.691502
Breves G., Diener M., and Gäbel G. (2022). Physiologie der Haustiere (Oswald-Hesse-Straße 50 • 70469 Stuttgart: Georg Thieme Verlag KG).
Bruning-Fann C. and Kaneene J. (1993). The effects of nitrate, nitrite, and N-nitroso compounds on animal health. Veterinary Hum. Toxicol. 35, 237–253.
Cabeza I., Waterhouse T., Sohi S., and Rooke J. (2018). Effect of biochar produced from different biomass sources and at different process temperatures on methane production and ammonia concentrations in vitro. Anim. Feed Sci. Technol. 237, 1–7. doi: 10.1016/j.anifeedsci.2018.01.003
Camer-Pesci B., Laird D. W., van Keulen M., Vadiveloo A., Chalmers M., and Moheimani N. R. (2023). Opportunities of Asparagopsis sp. cultivation to reduce methanogenesis in ruminants: A critical review. Algal Res. 76, 103308.
Chibisa G. E., Beauchemin K. A., Koenig K. M., and Penner G. B. (2020). Optimum roughage proportion in barley-based feedlot cattle diets: total tract nutrient digestibility, rumination, ruminal acidosis, short-chain fatty absorption, and gastrointestinal tract barrier function. J. Anim. Sci. 98, skaa160. doi: 10.1093/jas/skaa160
Christophersen C., Wright A. G., and Vercoe P. (2008). In vitro methane emission and acetate: propionate ratio are decreased when artificial stimulation of the rumen wall is combined with increasing grain diets in sheep. J. Anim. Sci. 86, 384–389. doi: 10.2527/jas.2007-0373
Council N. R. (2001). Nutrient requirements of dairy cattle: 2001 (Stuttgart: National Academies Press).
Das S., Mohanty S., Sahu G., Rana M., and Pilli K. (2021). “Biochar: A sustainable approach for improving soil health and environment,” in Soil erosion-current challenges and future perspectives in a changing world, vol. 1. , 5772.
Dong Y., Bae H., McAllister T., Mathison G., and Cheng K. (1997). Lipid-induced depression of methane production and digestibility in the artificial rumen system (RUSITEC). Can. J. Anim. Sci. 77, 269–278. doi: 10.4141/A96-078
Durmic Z., Vercoe P., and Joseph S. (2022). Fit-for-purpose biochar to improve efficiency in ruminants. 74.
Fu Y., Yao S., Wang T., Lu Y., Han H., Liu X., et al. (2023). Effects of melatonin on rumen microorganisms and methane production in dairy cow: Results from in vitro and in vivo studies. Microbiome 11 (1), 196.
Guo T., Guo T., Cao Y., Guo L., Li F., Li F., et al. (2021). Changes in the fermentation and bacterial community by artificial saliva pH in RUSITEC system. Front. Nutr. 8, 760316. doi: 10.3389/fnut.2021.760316
Guyader J., Ungerfeld E. M., and Beauchemin K. A. (2017). Redirection of metabolic hydrogen by inhibiting methanogenesis in the rumen simulation technique (RUSITEC). Front. Microbiol. 8, 235465. doi: 10.3389/fmicb.2017.00393
Harmsen M., van Vuuren D. P., Bodirsky B. L., Chateau J., Durand-Lasserve O., Drouet L., et al. (2020). The role of methane in future climate strategies: mitigation potentials and climate impacts. Climatic Change 163, 1409–1425. doi: 10.1007/s10584-019-02437-2
Janu R., Mrlik V., Ribitsch D., Hofman J., Sedláček P., Bielská L., et al. (2021). Biochar surface functional groups as affected by biomass feedstock, biochar composition and pyrolysis temperature. Carbon Resour. Conversion 4, 36–46. doi: 10.1016/j.crcon.2021.01.003
Johnson D. E., Ward G., and Ramsey J. J. (1996). “Livestock methane: current emissions and mitigation potential,” in Nutrient management of food animals to enhance and protect the environment, 219–234.
Künzel S., Yergaliyev T., Wild K. J., Philippi H., Petursdottir A. H., Gunnlaugsdottir H., et al. (2022). Methane reduction potential of brown seaweeds and their influence on nutrient degradation and microbiota composition in a rumen simulation technique. Front. Microbiol. 13, 889618. doi: 10.3389/fmicb.2022.889618
Leng R., Preston T., and Inthapanya S. (2012). Biochar reduces enteric methane and improves growth and feed conversion in local “Yellow” cattle fed cassava root chips and fresh cassava foliage. Livestock Res. Rural Dev. 24, 199.
Machmüller A., Ossowski D., Wanner M., and Kreuzer M. (1998). Potential of various fatty feeds to reduce methane release from rumen fermentation in vitro (Rusitec). Anim. feed Sci. Technol. 71, 117–130. doi: 10.1016/S0377-8401(97)00126-0
Maia M. R., Fonseca A. J., Cortez P. P., and Cabrita A. R. (2019). In vitro evaluation of macroalgae as unconventional ingredients in ruminant animal feeds. Algal Res. 40, 101481. doi: 10.1016/j.algal.2019.101481
McDougall E. I. (1948). Studies on ruminant saliva. 1. The composition and output of sheep’s saliva. Biochem. J. 43, 99–109. doi: 10.1042/bj0430099
McFarlane Z. D., Myer P. R., Cope E. R., Evans N. D., Bone T. C., Bliss B. E., et al. (2017). Effect of biochar type and size on in vitro rumen fermentation of orchard grass hay. Agric. Sci. 325
Moore B. III and Braswell B. (1994). The lifetime of excess atmospheric carbon dioxide. Global biogeochemical cycles 8, 23–38. doi: 10.1029/93GB03392
Müller B. R. (2021). Preparation and characterization of K2CO3-doped powdered activated carbon for effective in-vitro adsorption of deoxynivalenol. Bioresource Technol. Rep. 15, 100703. doi: 10.1016/j.biteb.2021.100703
Naumann C. and Bassler R. (2012). “Methoden der landwirtschaftlichen Forschungs-und Untersuchungsanstalt, Biochemische Untersuchung von Futtermitteln,” in Methodenbuch III (einschließlich der achten Ergänzungen).
O’Reilly G. C., Huo Y., Meale S. J., and Chaves A. V. (2021). Dose response of biochar and wood vinegar on in vitro batch culture ruminal fermentation using contrasting feed substrates. Trans. Anim. Sci. 5, txab107. doi: 10.1093/tas/txab107
Oslage H. (1984). Einsatzmöglichkeiten von Fetten in der Ernährung landwirtschaftlicher Nutztiere. Fette Seifen Anstrichmittel 86, 25–33. doi: 10.1002/lipi.19840860107
Pereira R. C., Muetzel S., Arbestain M. C., Bishop P., Hina K., and Hedley M. (2014). Assessment of the influence of biochar on rumen and silage fermentation: A laboratory-scale experiment. Anim. Feed Sci. Technol. 196, 22–31. doi: 10.1016/j.anifeedsci.2014.06.019
Pérez-Ruchel A., Britos A., Alvarado A., Fernández-Ciganda S., Gadeyne F., Bustos M., et al. (2023). Impact of adding tannins or medium-chain fatty acids in a dairy cow diet on variables of in vitro fermentation using a rumen simulation technique (RUSITEC) system. Anim. Feed Sci. Technol. 305, 115763. doi: 10.1016/j.anifeedsci.2023.115763
Pfau F., Hünerberg M., Südekum K.-H., Breves G., Clauss M., and Hummel J. (2021). Effects of dilution rate on fermentation characteristics of feeds with different carbohydrate composition incubated in the rumen simulation technique (RUSITEC). Front. Anim. Sci. 2, 715142. doi: 10.3389/fanim.2021.715142
Ramos A. F., Terry S. A., Holman D. B., Breves G., Pereira L. G., Silva A. G., et al. (2018). Tucumã oil shifted ruminal fermentation, reducing methane production and altering the microbiome but decreased substrate digestibility within a RUSITEC fed a mixed hay–concentrate diet. Front. Microbiol. 9, 1647. doi: 10.3389/fmicb.2018.01647
Randers J. and Goluke U. (2020). An earth system model shows self-sustained thawing of permafrost even if all man-made GHG emissions stop in 2020. Sci. Rep. 10, 18456. doi: 10.1038/s41598-020-75481-z
Rogovska N., Laird D., Cruse R., Trabue S., and Heaton E. (2012). Germination tests for assessing biochar quality. J. Environ. Qual. 41, 1014–1022. doi: 10.2134/jeq2011.0103
Romero-Pérez A., Okine E., Guan L., Duval S., Kindermann M., and Beauchemin K. (2017). Rapid Communication: Evaluation of methane inhibitor 3-nitrooxypropanol and monensin in a high-grain diet using the rumen simulation technique (Rusitec). J. Anim. Sci. 95, 4072–4077.
Roskam E., Kirwan S. F., Kenny D. A., O’Donnell C., O’Flaherty V., Hayes M., et al. (2022). Effect of brown and green seaweeds on diet digestibility, ruminal fermentation patterns and enteric methane emissions using the rumen simulation technique. Front. Anim. Sci. 3, 1021631. doi: 10.3389/fanim.2022.1021631
Russell J. (1998). The importance of pH in the regulation of ruminal acetate to propionate ratio and methane production in vitro. J. Dairy Sci. 81, 3222–3230. doi: 10.3168/jds.S0022-0302(98)75886-2
Saleem A. M., Ribeiro G. O. Jr., Yang W. Z., Ran T., Beauchemin K. A., McGeough E. J., et al. (2018). Effect of engineered biocarbon on rumen fermentation, microbial protein synthesis, and methane production in an artificial rumen (RUSITEC) fed a high forage diet. J. Anim. Sci. 96, 3121–3130. doi: 10.1093/jas/sky204
Schubert D. C., Chuppava B., Witte F., Terjung N., and Visscher C. (2021). Effect of two different biochars as a component of compound feed on nutrient digestibility and performance parameters in growing pigs. Front. Anim. Sci. 2, 633958. doi: 10.3389/fanim.2021.633958
Soliva C. R., Amelchanka S. L., Duval S. M., and Kreuzer M. (2011). Ruminal methane inhibition potential of various pure compounds in comparison with garlic oil as determined with a rumen simulation technique (Rusitec). Br. J. Nutr. 106, 114–122. doi: 10.1017/S0007114510005684
Sperber J., Troyer B., Erickson G., and Watson A. (2022). Evaluation of the effects of pine-sourced biochar on cattle performance and methane and carbon dioxide production from growing and finishing steers. Trans. Anim. Sci. 6, txac152. doi: 10.1093/tas/txac152
Tamayao P., Ribeiro G. O., McAllister T. A., Ominski K. H., Okine E. K., and McGeough E. J. (2022). Effects of biochar source, level of inclusion, and particle size on in vitro dry matter disappearance, total gas, and methane production and ruminal fermentation parameters in a barley silage-based diet. Can. J. Anim. Sci. 102, 133–144. doi: 10.1139/cjas-2021-0007
Tamayao P., Ribeiro G. O., McAllister T. A., Ominski K. H., Saleem A. M., Yang H. E., et al. (2021b). Effect of pine-based biochars with differing physiochemical properties on methane production, ruminal fermentation, and rumen microbiota in an artificial rumen (RUSITEC) fed barley silage. Can. J. Anim. Sci. 101, 577–589. doi: 10.1139/cjas-2020-0129
Tamayao P., Ribeiro G., McAllister T., Yang H., Saleem A., Ominski K., et al. (2021a). Effects of post-pyrolysis treated biochars on methane production, ruminal fermentation, and rumen microbiota of a silage-based diet in an artificial rumen system (RUSITEC). Anim. Feed Sci. Technol. 273, 114802. doi: 10.1016/j.anifeedsci.2020.114802
Teoh R., Caro E., Holman D. B., Joseph S., Meale S. J., and Chaves A. V. (2019a). Effects of hardwood biochar on methane production, fermentation characteristics, and the rumen microbiota using rumen simulation. Front. Microbiol. 10. doi: 10.3389/fmicb.2019.01534
Teoh R., Caro E., Holman D. B., Joseph S., Meale S. J., and Chaves A. V. (2019b). Effects of hardwood biochar on methane production, fermentation characteristics, and the rumen microbiota using rumen simulation. Front. Microbiol. 10, 463406. doi: 10.3389/fmicb.2019.01534
Terry S. A., Krüger A. M., Lima P. M., Gruninger R. J., Abbott D. W., and Beauchemin K. A. (2023). Evaluation of rumen fermentation and microbial adaptation to three red seaweeds using the rumen simulation technique. Animals 13, 1643. doi: 10.3390/ani13101643
Tutak M. and Brodny J. (2019). Forecasting methane emissions from hard coal mines including the methane drainage process. Energies 12, 3840. doi: 10.3390/en12203840
Ungerfeld E. M. (2020). Metabolic hydrogen flows in rumen fermentation: principles and possibilities of interventions. Front. Microbiol. 11, 589. doi: 10.3389/fmicb.2020.00589
Van Kessel J. A. S. and Russell J. B. (1996). The effect of pH on ruminal methanogenesis. FEMS Microbiol. Ecol. 20, 205–210. doi: 10.1111/j.1574-6941.1996.tb00319.x
Van Wesemael D., Vandaele L., Ampe B., Cattrysse H., Duval S., Kindermann M., et al. (2019). Reducing enteric methane emissions from dairy cattle: Two ways to supplement 3-nitrooxypropanol. J. dairy Sci. 102, 1780–1787. doi: 10.3168/jds.2018-14534
Van Wyngaard J., Meeske R., and Erasmus L. J. (2018). Effect of dietary nitrate on enteric methane emissions, production performance and rumen fermentation of dairy cows grazing kikuyu-dominant pasture during summer. Anim. Feed Sci. Technol. 244, 76–87. doi: 10.1016/j.anifeedsci.2018.08.005
Vargas J. E., Andrés S., López-Ferreras L., Snelling T. J., Yáñez-Ruíz D. R., García-Estrada C., et al. (2020). Dietary supplemental plant oils reduce methanogenesis from anaerobic microbial fermentation in the rumen. Sci. Rep. 10, 1613. doi: 10.1038/s41598-020-58401-z
Vargas J. E., López-Ferreras L., Andrés S., Mateos I., Horst E. H., and López S. (2023). Differential diet and pH effects on ruminal microbiota, fermentation pattern and fatty acid hydrogenation in RUSITEC continuous cultures. Fermentation 9, 320. doi: 10.3390/fermentation9040320
VDLUFA (2012). Handbuch der Landwirtschaftlichen Versuchs-und Untersuchungsmethodik (VDLUFA-Methodenbuch), Bd. III. Die chemische Untersuchung von Futtermitteln (Germany: VDLUFA Verlag Darmstadt).
Wang M., Wang R., Yang S., Deng J. P., Tang S. X., and Tan Z. L. (2016). Effects of three methane mitigation agents on parameters of kinetics of total and hydrogen gas production, ruminal fermentation and hydrogen balance using in vitro technique. Anim. Sci. J. 87, 224–232. doi: 10.1111/asj.2016.87.issue-2
Winders T. M., Jolly-Breithaupt M. L., Wilson H. C., MacDonald J. C., Erickson G. E., and Watson A. K. (2019). Evaluation of the effects of biochar on diet digestibility and methane production from growing and finishing steers. Trans. Anim. Sci. 3, 775–783. doi: 10.1093/tas/txz027
Xue Y., Liu H., Chen S., Dichtl N., Dai X., and Li N. (2015). Effects of thermal hydrolysis on organic matter solubilization and anaerobic digestion of high solid sludge. Chem. Eng. J. 264, 174–180. doi: 10.1016/j.cej.2014.11.005
Keywords: greenhouse gases, fermentation, RUSITEC, biochar, methane reduction
Citation: Weinberg A, Witte F, Schubert DC, Rohn K, Hoeltershinken M, Hancock VE, Sitzmann W, Terjung N and Visscher C (2025) Effects of activated carbon and four different biochars on fermentation in the artificial rumen (RUSITEC). Front. Anim. Sci. 6:1609709. doi: 10.3389/fanim.2025.1609709
Received: 10 April 2025; Accepted: 03 June 2025;
Published: 08 July 2025.
Edited by:
Michael D. Flythe, United States Department of Agriculture, United StatesReviewed by:
Ravikanthreddy Poonooru, University of Missouri, United StatesNatalie Gilks Farny, Worcester Polytechnic Institute, United States
Copyright © 2025 Weinberg, Witte, Schubert, Rohn, Hoeltershinken, Hancock, Sitzmann, Terjung and Visscher. This is an open-access article distributed under the terms of the Creative Commons Attribution License (CC BY). The use, distribution or reproduction in other forums is permitted, provided the original author(s) and the copyright owner(s) are credited and that the original publication in this journal is cited, in accordance with accepted academic practice. No use, distribution or reproduction is permitted which does not comply with these terms.
*Correspondence: Alexander Weinberg, YWxleGFuZGVyLndlaW5iZXJnQHRpaG8taGFubm92ZXIuZGU=