 Renee Maxine Petri1
 Birgit Antlinger2
 Lorenz Johannes Khol3Christina Gruber2
 Jutta Cordula Kesselring2*
- 1Agriculture and Agri-Food Canada, Sherbrooke Research and Development Centre, Quebec, QC, Canada
- 2dsm-firmenich, Animal Nutrition and Health R&D-Center, Tulln, Austria
- 3Clinical Center for Ruminant and Camelid Medicine, University of Veterinary Medicine, Vienna, Austria
There is a growing need for alternative research models to reduce or replace animal use in feed and feed additive testing. In vitro model development could provide value added data in the assessment of feed additives for microbial modulation in cattle where animal variation in intake can impact results. This study aimed to refine and evaluate the in vitro model of subacute ruminal acidosis (SARA) and assess how variations in buffer and feed additive supplementation could influence microbial fermentation and community composition. Using the rumen simulation technique (RUSITEC) with a SARA model, buffer dilution and feed additive supplementation were compared for their influence on microbial fermentation and community composition. Results showed that buffer dilution, combined with dietary changes, effectively induced SARA in vitro, with a significant impact on ruminal pH and fermentation parameters. Acetate production and pH were lower in reactors supplemented with Saccharomyces cerevisiae (AY), especially under low buffering conditions, suggesting AY’s potential to mitigate ruminal dysbiosis. Microbial protein and protozoa abundance also changed in response to dietary and buffer adjustments. The results of this study support the use of in vitro models for more controlled, reproducible testing of feed additives, with potential applications in improving nutritional interventions and rumen microbial stability.
1 Introduction
In vitro methods have become common in ruminant nutrition and microbiology to reduce animal use and minimize variability from animal behaviors (Vinyard and Faciola, 2022). While batch cultures are useful for nutritional analysis, the continuous-flow Rumen Simulation Technique (RUSITEC) is essential for microbiological studies due to the time required for adaptation to the system, dietary changes, or treatments. Furthermore, in comparison to the batch culture method which uses a shaking apparatus to simulate rumen contractions, the RUSITEC model can use either spinning, horizontal, vertical or 3 dimensional movements to mimic the agitation associated with rumen digestion. However, variations in RUSITEC design may affect experiment outcomes and their relevance to in vivo models (Czerkawski and Breckenridge, 1977). Technological advances necessitate ongoing adjustments to RUSITEC to address contemporary research questions more accurately.
In vitro systems also offer advantages such as controlled intake, flow rate, and rumen conditions, reducing confounding variables like animal behavior and allowing clearer assessments of feed or additives’ effects on digestion and rumen microbiota. Nonetheless, system and input variations, buffer composition, and experimental diets introduce variability in the literature. One commonly used modification is the use of diluted buffers with highly fermentable diets to mimic the low ruminal pH observed in subacute ruminal acidosis (SARA; Mickdam et al., 2016). Subacute ruminal acidosis in dairy cattle is generally marked by a ruminal pH of 5.8 or less for 180 minutes or more within a 24-h period (Plaizier et al., 2008). By invoking these conditions in vitro, the SARA model enables the study of feed additives for SARA mitigation and microbiota support without inducing SARA in cattle (Petri et al., 2019; Orton et al., 2020; Guo et al., 2022b, 2024).
Saccharomyces cerevisiae (AY) supplementation has been shown to enhance dry matter intake (DMI), rumen pH, volatile fatty acid (VFA) profiles, and nutrient digestibility in vivo (Callaway and Martin, 1997; Dias et al., 2018; Neubauer et al., 2018; Knollinger et al., 2022). Saccharomyces cerevisiae may also increase fiber-adhering cellulolytic bacteria, improving fiber digestion and rumen bacterial growth (Callaway and Martin, 1997; Neubauer et al., 2018). Given cellulolytic bacteria’s sensitivity to low pH, AY supplementation may help mitigate ruminal dysbiosis. However, the exact mode of action in the rumen is still unclear and can be largely impacted by animal feed intake, sorting behaviors and time spent ruminating (Neubauer et al., 2018). RUSITEC offers a valid model system to remove animal behavior impacts on rumen fermentation while still allowing access to fermentation and microbial measurements.
Therefore, the objective of this experiment was to validate mechanical adaptations to a traditional RUSITEC using a SARA simulation model while testing the reproducibility of the SARA challenge and AY supplementation on the microbial population in vitro. We hypothesized that modifying the reactor agitation style would improve the consistency in fermentation and microbial community data in a SARA model, and that supplementation with Saccharomyces cerevisiae would mitigate the negative effects of SARA by stabilizing rumen pH and supporting microbial community diversity.
2 Materials and methods
2.1 Experimental setup
For the validation of modifications to a RUSITEC system at the Research Center, Tulln, Austria, a total of three experimental runs were performed. For each run, treatments were randomly assigned to in vitro reactors, using random numbers in MS Excel. Each treatment was replicated three times per run therefore, the total number of statistical replicates per treatment were n=9. Each experimental run (Figure 1), with 12 fermenter units, consisted of an adaptation phase (Adaptation: d 1 to d 5) to the high concentrate diet (Table 1) to adapt the rumen inoculum and its microbiota to in vitro conditions (Adaptation phase). During this phase, all reactors received normal buffer (100%; Table 2) and a high forage diet (Forage). On day five, all reactors were switched to the high concentrate diet (HC) and half of the reactors (n = 6) were also changed to receive the diluted buffer (50% buffer; Cantalapiedra-Hijar et al., 2011), while the remaining six reactors continued to receive the 100% buffer (Sampling phase; Figure 1). Experimental diets were formulated to be easily digestible, and representative of a typical intensive dairy ration (HC; 40:60 Forage: Concentrate). Dietary forage was obtained from the donor diets and cut to 1cm particle size.
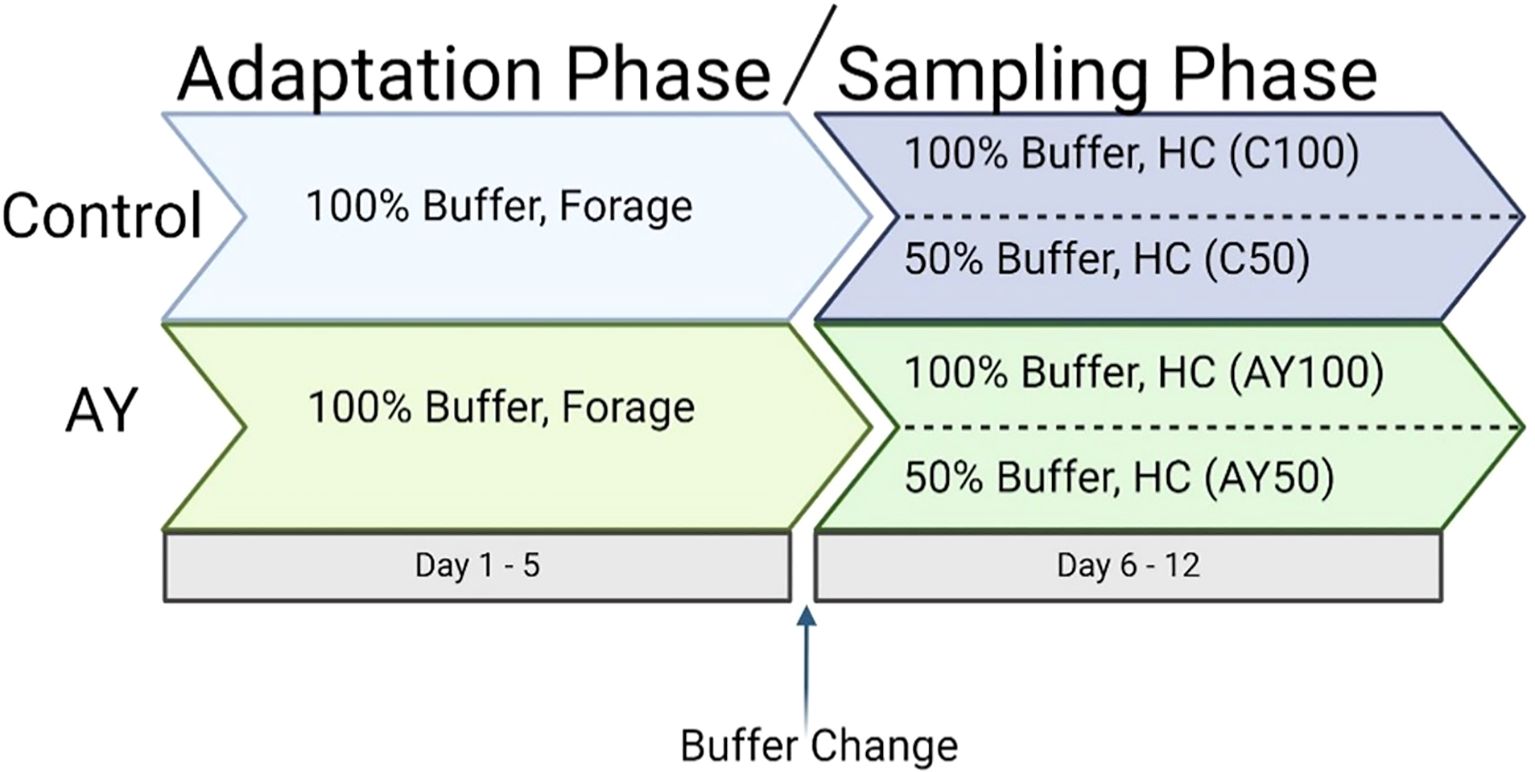
Figure 1. Schematic representation of the experimental run design. 100% buffer, normal buffer; 50% buffer, diluted buffer; Forage, Donor diet; HC, high concentrate diet; C, control no additive; AY, autolyzed yeast.
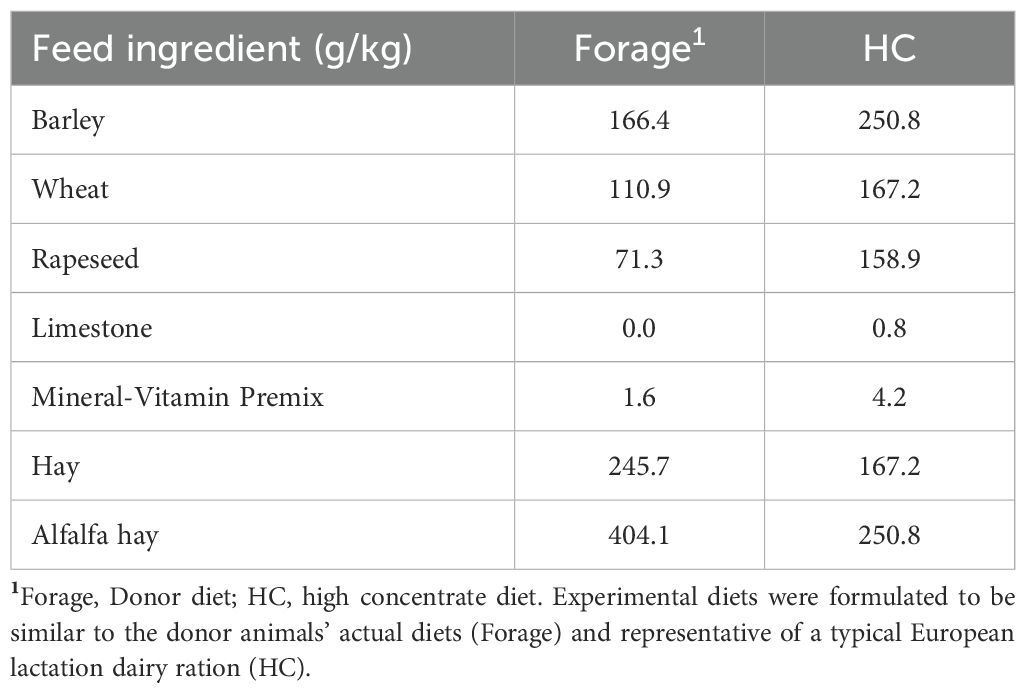
Table 1. Experimental diet composition.
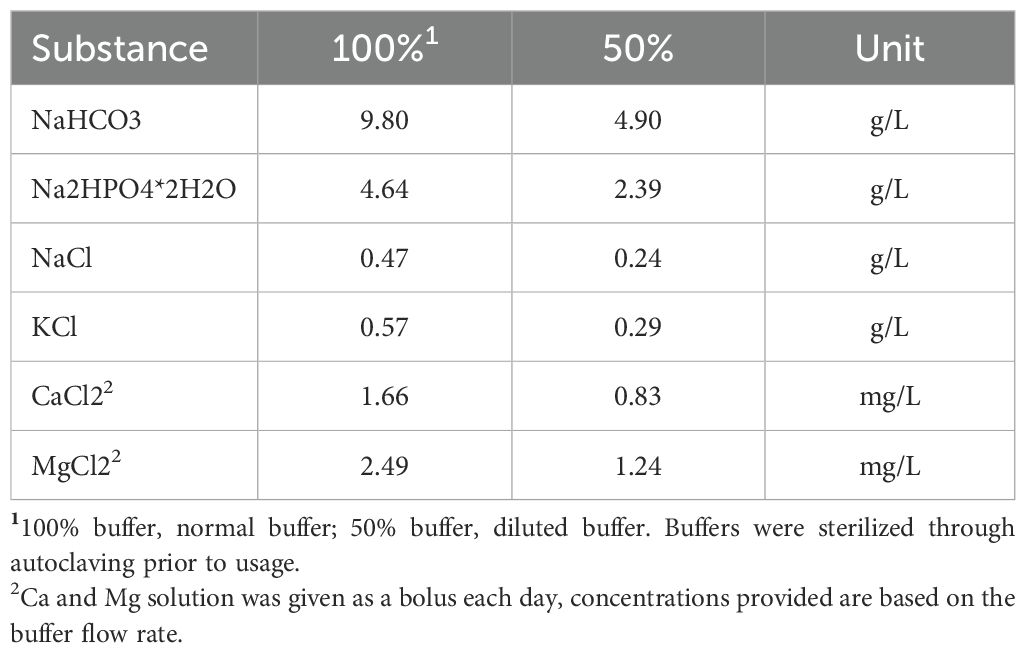
Table 2. Composition of artificial buffers for in vitro fermentation.
Additionally, autolyzed yeast (AY, Levabon®, DSM ANH) was used to test the system’s sensitivity and reproducibility of response to a common feed additive at a dosage relative to 20g/cow/day (600 mg/reactor/day) as recommended by nutritionists. The AY was introduced in six of the twelve reactors from the start and continuously fed to those reactors throughout the entire trial.
2.2 RUSITEC system description
The RUSITEC is a semi-continuous fermentation system consisting of twelve reactors of 1250 mL volume in 39°C water baths, designed for typically 12-day long rumen simulation experiments. Adaptions were made to the reactors to include continual pH and redox monitoring, feed was agitated in a 360° rotation instead of the traditional vertical motion, rotational motion was intermittent with a pause in rotation after each axis rotation to mimic the break in ruminal contractions seen physiologically. In addition, reactor lids were fitted with waste valves and 3-way ports for buffer flow, feeding, and sampling. Twenty grams feed was supplied daily in nylon mesh in situ bags (mesh opening 105µm, Saati). Each feed bag was fixed to the rotating axis and fermented in the reactor for 48 hours. Artificial saliva buffer was continuously pumped in the reactors with a syringe pump prototype (Grotec) at 30.2 mL/h for 60% reactor turnover in 24h. Gas was collected in gas bags (PLASTIGAS® 400 x 400 mm, Linde). Reactors were sealed with a tri-clamp to maintain anaerobic conditions.
2.3 Reactor initiation
Rumen fluid and solid digesta were obtained through a fistula from the same cow for each trial (University of Veterinary Medicine Vienna) consistently fed a forage diet with supplementation (Table 1). The rumen fluid was strained through a sieve (1.2 mm) to separate the fluid from feed particles. Material was transported to the RUSITEC in a temperature regulated container to maintain 39°C during transport. Prior to inoculation, a 50 mL sample was frozen at -80°C for further analysis.
Each reactor was filled with an inoculum mixture of 50% rumen fluid, 30% pre-warmed reverse osmosis (RO)-water, and 20% of prewarmed 100% buffer. The pH of this solution was adjusted to 7 ± 0.2. Solid digesta (approximately 100 g) was blended twice with 60 mL of liquid inoculum mixture in a paddle blender (AESAP 1064, AES Chemunex, BagLight Polysilk 100) for 120 seconds, and the resulting suspension of fiber-adherent microbes was combined with the inoculum mixture. Subsamples of the inoculum mixture were taken and frozen at -80°C for further analysis. In total, 1.25 L of the inoculation mixture were filled in each reactor and reactors were immediately placed in a pre-warmed water bath at 39°C. One in situ bag filled with the forage diet was attached to the appropriated holders on the axis. In addition, 600 mg of autolyzed yeast (AY, Levabon® Rumen E) was added to half of the reactors (Figure 1).
2.4 Sampling
The reactor lids were fitted with pH probes measuring every 3 minutes throughout the experiment. Every day, the 48h feed bags and reactor liquid samples were taken for dry matter disappearance, microbial genomic DNA, microbial protein and SCFA analysis. In situ bags were washed for 30 minutes with tap water in a washing cage to remove the planktonic, not tightly adhering microbes. All samples were then stored at -20°C until further analysis. Reactor liquid was aspired through a sampling port in the reactor lid and feed bag samples were taken when new feed was introduced. Samples for SCFA analysis were first centrifuged for 30 minutes at 16–600 x g at room temperature to remove debris, and then the supernatant was stored without additive at -20°C. Ten percent sterile glycerol was added to samples for microbial protein analysis (proteins associated with microbial cells), and all other samples were stored without additive at -20°C for further analysis.
2.5 Diet and fermentation analyses
For calculating dry matter disappearance, the difference was measured between the weight of dried fresh feed samples and the dried 48h collected feed from the reactors (washed to remove adherent microbes). Drying was completed 105°C for three days in an oven.
For SCFA analysis, 300µL thawed supernatant was acidified in 1160 µL of 5 mM H2SO4 and then clarified following the Carrez method (Carrez, 1909; VWR, Austria). Samples were then filtered through a 0.2 µm syringe filter into a glass HPLC vial and analyzed on a ICSep Ion 300 (Transgenomic) with a refractive index detector and 5mM H2SO4 as mobile phase at 42°C.
2.6 Microbial analysis
For quantification of the bacterial protein, samples were defrosted and vortexed for 1 minute. The samples were centrifuged at 100 x g at 10°C for 5 minutes to remove debris. The supernatant was centrifuged again at 20–000 x g at 10°C for 30 minutes. The obtained pellet was washed with 1 mL of 100% McDougall buffer before centrifuging at 20–000 x g for 30 minutes at 10°C. The final pellet was re-suspended in 1mL 0.5 M NaOH. Cells were lysed at 100°C for ten minutes, then centrifuged at 25–000 x g for 30 minutes at 10°C. Bacterial protein was measured at 750 nm with a colorimetric Lowry assay, following the manufacturer’s instructions (DC protein assay kit, Bio-Rad) against a bovine serum albumin (BSA) standard curve.
2.7 DNA extraction and molecular analysis
Sample preparation and DNA extraction are based on previous work (Yu and Morrison, 2004). After thawing on ice, reactor fluid samples were centrifuged at 12000 x g at 4°C (5810 R, Eppendorf, Germany), and the supernatant discarded. The weight of the resulting pellet was recorded. In comparison, washed feed bags were thawed at 4°C overnight. and then each sample was homogenized twice for 5 min using a peddle blender (AES Chemunex, France) together with 90 ml of sterile cold buffer (0.9% NaCl with 1% Tween 20). In between homogenization steps, the feed particles were incubated at 4°C overnight. After homogenization, thirty mL of the homogenate was centrifuged at 12000 x g at 4°C (5810 R, Eppendorf, Germany) and the supernatant discarded.
For all samples, the DNA extraction method combined bead beating in a high-concentrated SDS- & EDTA-buffer (Precellys glass beads/tubes, VWR, Austria) with salting-out of DNA with isopropanol and subsequent column-based clean-up for protein- RNA- and contaminant-removal using the QIAamp DNA Stool Kit (Qiagen). After extraction, DNA quantity was measured using a DNA Tapestation (Agilent Technologies, USA). Amplicon libraries were prepared using the universal 16S primers U341F (CCTAYGGGRBGCASCAG) and a modified 806R (GGACTACNNGGGTATCTAAT; Sundberg et al., 2013). Samples (LGC Genomics GmbH, Germany) were sequenced on an Illumina MiSeq sequencer. Samples were also analyzed for 16S and 18S using quantitative real-time polymerase chain reaction (qPCR). Protozoa 18S rDNA was amplified using the primer pair P-SSU-316-f -GCTTTCGATGGTAGTGTATT and P-SSU-539r-AGTACGATTAGAGGGCAAGT targeting a 233 bp fragment as described by (Sylvester et al., 2004). The amplification was carried out using a two-step PCR protocol, which included an initial denaturation at 95°C for 5 minutes, followed by 40 cycles of denaturation at 95°C for 20 seconds and annealing at 54.4°C for 30 seconds. Following the qPCR amplification, a melt curve analysis was performed to confirm the specificity of amplified product from 60°C to 95°C. A synthetic 999 bp long 18S rDNA gene fragment of AM158460 Ostracodinium dentatum (GeneStrand #11104042066, Eurofins Genomics, Germany) was used to prepare a standard curve. Bacterial 16S rDNA was amplified using primer U16SRT-F-ACTCCTACGGGAGGCAGCAGT and U16SRT-R-TATTACCGCGGCTGCTGGC (Clifford et al., 2012) targeting a 198 bp fragment. The amplification included an initial denaturation at 95°C for 2 minutes, followed by 40 cycles of denaturation at 95°C for 20 seconds, primer binding at 58°C for 30 seconds and annealing at 72°C for 15 seconds. Finally, a 25 minute melt curve analysis from 60°C to 95°C was performed. A standard curve was prepared using a synthetic 750 bp long fragment (GeneStrand # 11104064289, Eurofins Genomics, Germany) based on AP027461 Escherichia coli.
2.8 Bioinformatics
Sequence data were analyzed with the open-source bioinformatics pipeline QIIME2 (version 2-2022.11), based on the recommended workflow of QIIME2 tutorials (Caporaso et al., 2010; Navas-Molina et al., 2013). Briefly, sequences of low quality were trimmed, and primers removed (120 nt). Samples were denoised, dereplicated for single-end sequences and chimeric sequences found and subsequently filtered. The resulting tables were further filtered to exclude mitochondrial contamination. Taxonomy was assigned with a Naive Bayes classifier trained for the specific 16S rRNA gene target regions against the database of SILVA138 (accessed Oct 2022; Quast et al., 2012). A total of 4,803 ASVs were found, with a median of 24,010 sequences per sample. The filtered amplicon sequence variants (ASVs) tables were used to calculate abundance-based observed features, Chao1 (Chao, 1984), and Shannon index (Shannon, 1948), as well as Bray-Curtis distances (Lozupone and Knight, 2008). Microbial diversity was evaluated with phyloseq (v1.38.0; McMurdie and Holmes, 2013) using ggplot2 for graphical representation (v3.4.0; Villanueva and Chen, 2019). The percent relative abundances of all ASVs were calculated and ASVs were ranked according to their abundance. Sequences have been submitted to the NCBI SRA under Bioproject number:PJRNA1199526.
2.9 Statistical analysis
Statistical analysis was conducted using R version 4.0.2, using a linear mixed model to evaluate treatment effects. The experimental design followed a replicated factorial structure with fixed effects including a three-way interaction between treatment (Control vs. AY), buffer type (50 vs. 100%) and time. The model accounted for repeated measures by including fermenter ID as a random effect, recognizing that each fermenter was an experimental unit sampled multiple times. For the analysis of short-chain fatty acids (SCFAs) and diversity indicators, a baseline variable representing donor cow rumen fluid properties was added to the three-way interaction term of the fixed factor to enhance model fit. Effects and their interactions were assessed using Type III ANOVA (via the ‘car’ package). To reflect differences in the variability across treatments, a separate variance structure was specified for each parameter. The parameter ‘time below pH threshold’ was analyzed using a hurdle model (implemented with the ‘pscl’ package). Model fit was evaluated using the ‘lattice’ and ‘latticeExtra’ packages and effect sizes estimated using the package ‘emmeans’. Statistical significance was declared at P ≤ 0.05, and trends were considered when P < 0.10.
3 Results
3.1 pH
Continuous pH measurement delivered a measurement every three minutes (Supplementary Figure 1). The mean pH per day was computed per reactor (Figure 2). During adaptation, there were no significant differences between the mean pH for all treatments, whereas during the acidosis challenge (d6 - d12) pH was lower in the 50% buffer treatment groups compared to the 100% buffer (p < 0.001). There was a significant interaction between the dietary change to an easily fermentable grain diet combined with a buffer dilution (p < 0.001). There was a trend towards interaction between AY supplementation and acidosis challenge (d6 – d12) (p = 0.05822). Parameters for a SARA challenge were not met, as pH did not decrease below 5.8 for 180 minutes per day (Plaizier et al., 2008).

Figure 2. Mean pH per day based on continuous measurement (every 3 minutes). Whiskers represent the standard deviation. C, control; AY, autolyzed yeast; 50, 50% diluted buffer; 100, standard McDougall buffer. Arrow indicating first day of sampling.
Estimated marginal means of linear trends were computed to investigate the direction of these interaction effects, and the model predicted buffer dilution to lower the pH by -0.1 (p < 0.0001). When AY was included, this effect was -0.1010 ± 0.0118 (± SE; p < 0.0001) and without AY the effect was -0.0815 ± 0.0121 (p < 0.0001). Therefore, AY was predicted to decrease pH by 0.02298 ± 0.0121 (p = 0.0582). These effects were not predicted in reactors containing 100% buffer.
The daily mean nadir per reactor was computed from the continuously measured pH dataset (Supplementary Table 1), validating that the high concentrate diet (HC) lowered the nadir (p < 0.001), and the buffer dilution interacted significantly with the HC during d6 – d12 (p < 0.001). Supplementation with AY also interacted significantly with HC and a three-way interaction between HC, AY, and buffer was observed (p = 0.01762). For reactors on HC diet, the model predicted buffer dilution (from 1 to 0.5) to lower the nadir by -0.08 ± 0.0095 (± SE; p < 0.0001) in reactors also receiving AY. Without AY, the effect of buffer dilution was -0.05 ± 0.009 (p < 0.0001). The model predicted AY supplementation to have a significant effect only in 50% buffer reactors (p = 0.0121).
As pH did not drop below the SARA threshold of 5.8, analysis of the results between treatments was done with an adjusted pH threshold of 6.2 to assess the predictability of the statistical model. All parameters in the statistical model significantly predicted the length of time below cutoff (pH 6.2) including buffer, diet change, and feed additive (AY). Significant interactions between diet, buffer and feed additive were found (Table 3). All three factors had effects on time below pH cutoff in the same direction. The Odds ratio of having a pH below 6.2 is 2.94 for HC diet (p < 0.001) and 1.93 for AY supplementation (p = 0.016). Analysis of time below 6.0 yielded too few data for modelling the count part (length of time below cutoff), it can only model the zero part (probability of falling below cutoff at all). Only AY supplementation turned out to significantly increase the odds (to 2.5) of pH falling below a cutoff of 6.0.
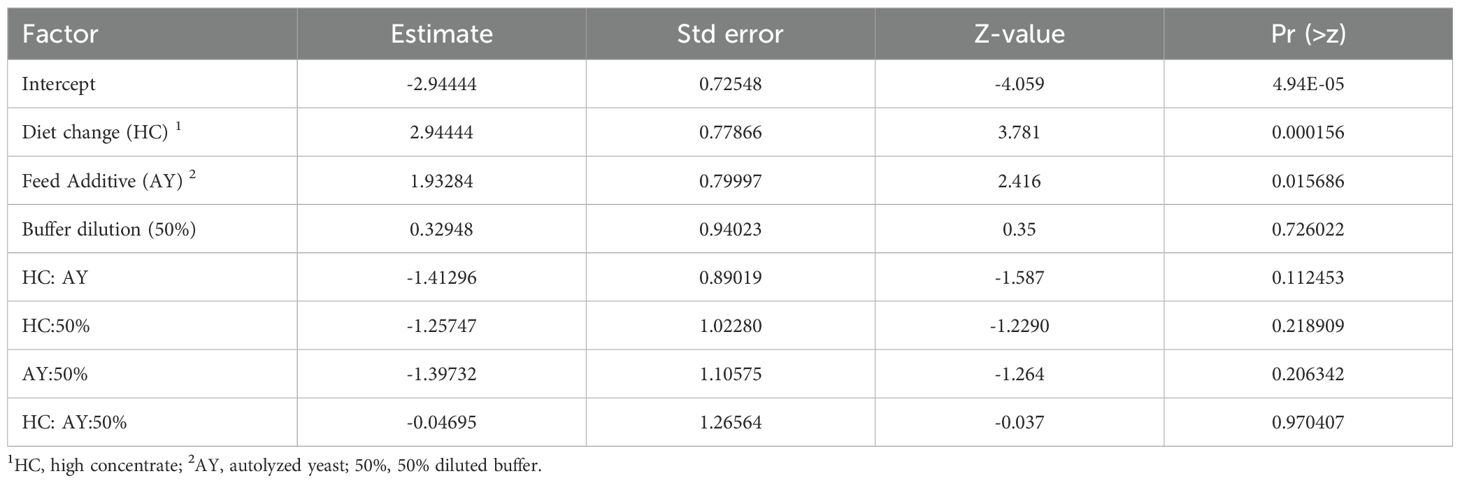
Table 3. Odds ratios for pH below 6.2 based on diet change, buffer dilution, and feed additive supplementation.
3.2 Dry matter disappearance
Dry matter disappearance DMD of the high forage diet during adaptation (d1 - d5) did not respond to AY supplementation and was on average 67% (Supplementary Table 1). After the switch to an easily digestible acidotic diet, the DMD developed from 75% to 68% over time in reactors with 50% diluted buffer. In the reactors with 100% diluted buffer DMD also declined over time, but at a more gradual slope to 72% at the end of the experiment. No significant effects of time, buffer or AY were observed.
3.3 Fermentation
Neither the addition of feed additive nor the dilution of buffer had significant impacts on the fermentation parameters during the sampling phase (d6 – d12: Table 4). However, there was an impact on propionate, butyrate and valerate over the days, with propionate decreasing over time with the change of diet (Table 4).
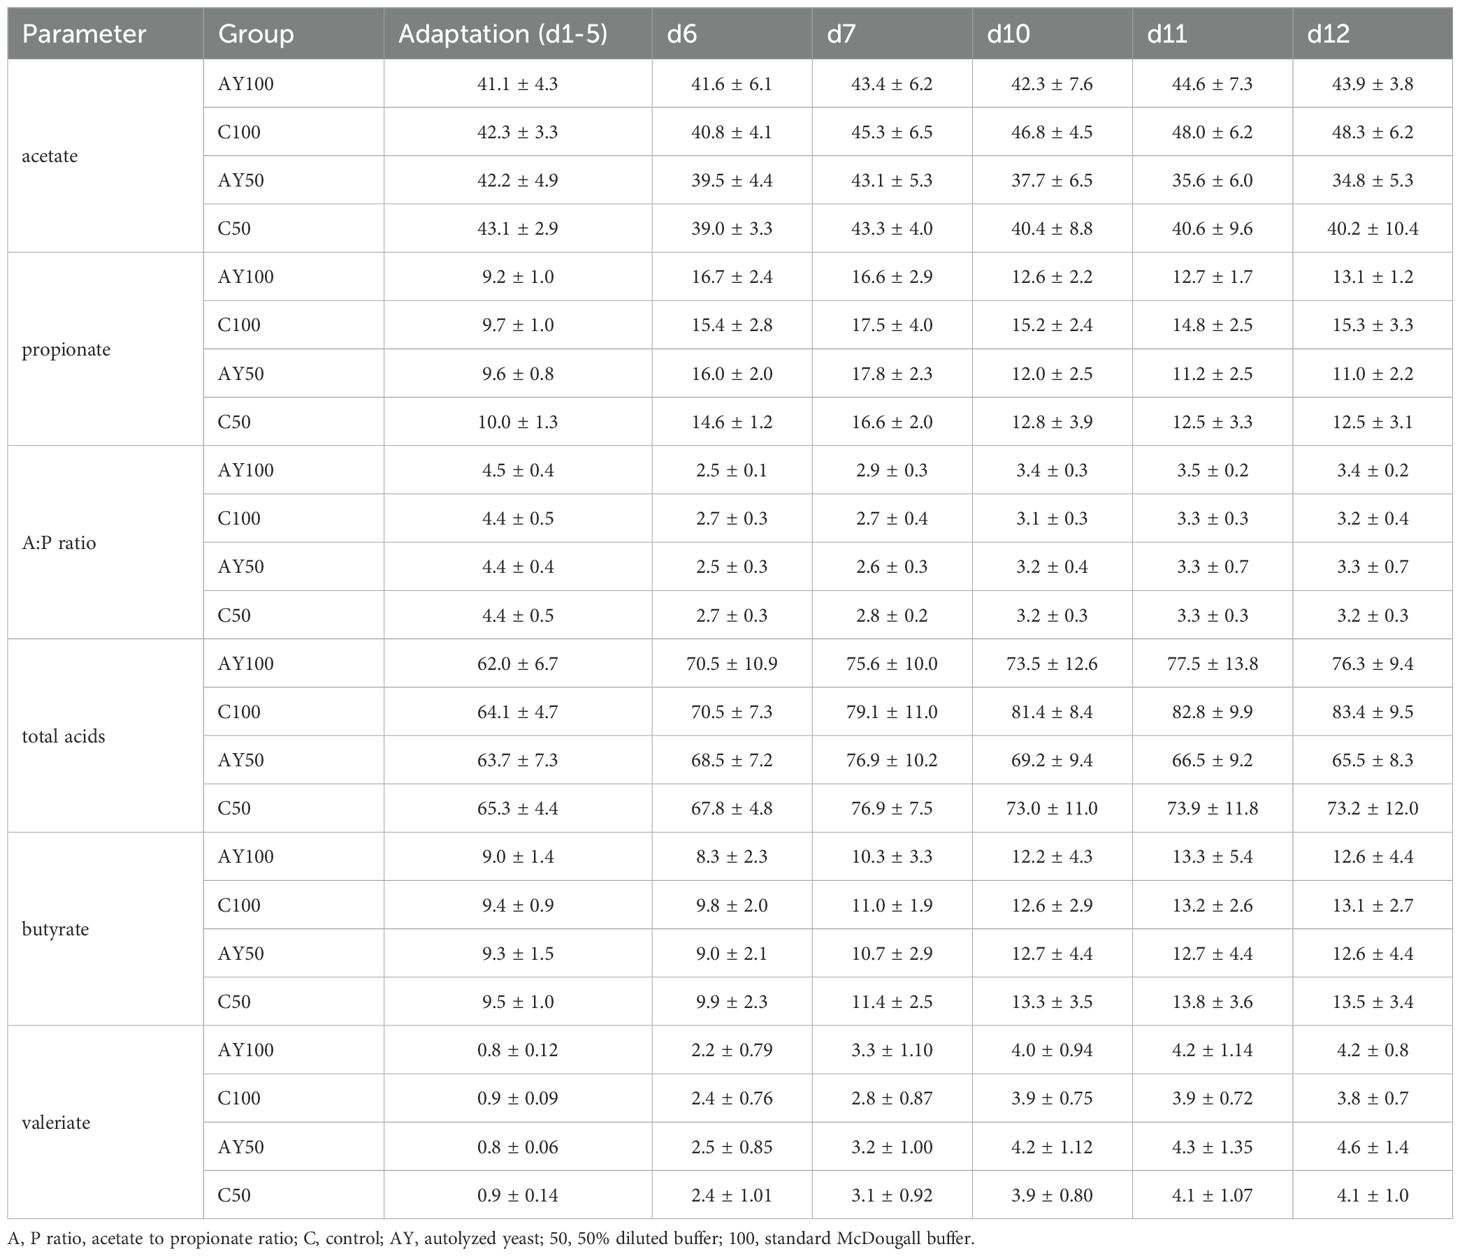
Table 4. Mean daily values for relative proportions of acetate, propionate, butyrate and valeriate, the total measured short-chain fatty acids (mmol/l) as well as the acetate to propionate ratio for each treatment ± the standard deviation.
Mean production of acetate showed a trend for an interaction effect between buffer dilution and day of sampling during the sampling phase (d6 – d12; Table 5). Acetate in reactors with 100% buffer followed a stable, slightly upwards sloping trend over time, whereas acetate in reactors on a 50% buffer declined over time after the dietary switch (d6). This corresponded to similar trends in total SCFA seen in the buffer by day interaction (Table 4). Statistical analysis showed that acetate levels dropped over time only on a diluted buffer (50%) and this trend was also significant in reactors that also received AY. Higher acetate values were calculated in reactors with AY100 compared to AY50 (p = 0.0214). The acetate: propionate ratio significantly increased over time (Table 4), and there was also a trend for AY×buffer interaction but predicted marginal means did not show this interaction and could not show any significant trends for the AY×buffer interaction.

Table 5. Summary of p-values of type III ANOVA during sampling phase (d6 - d12) for fermentation parameters.
3.4 Relative microbial abundance
Using quantitative real-time PCR, bacterial and protozoal abundance was measured in reactor liquid on d10, d11 and d12 (sampling) and additionally bacterial abundance was measured from collected feed samples on the same days. The buffer dilution (d6 – d12) significantly reduced the abundance of protozoa in reactor liquid (p = 0.0003; Figure 3A). There was a trend for a 3-way interaction between the buffer dilution, dietary change, and feed additive. Interestingly, there were no significant differences in 16S gene copies for bacterial abundance based on feed additive, buffer dilution and the interaction in neither the reactor liquid nor the collected feed (Figures 3B, C, respectively).
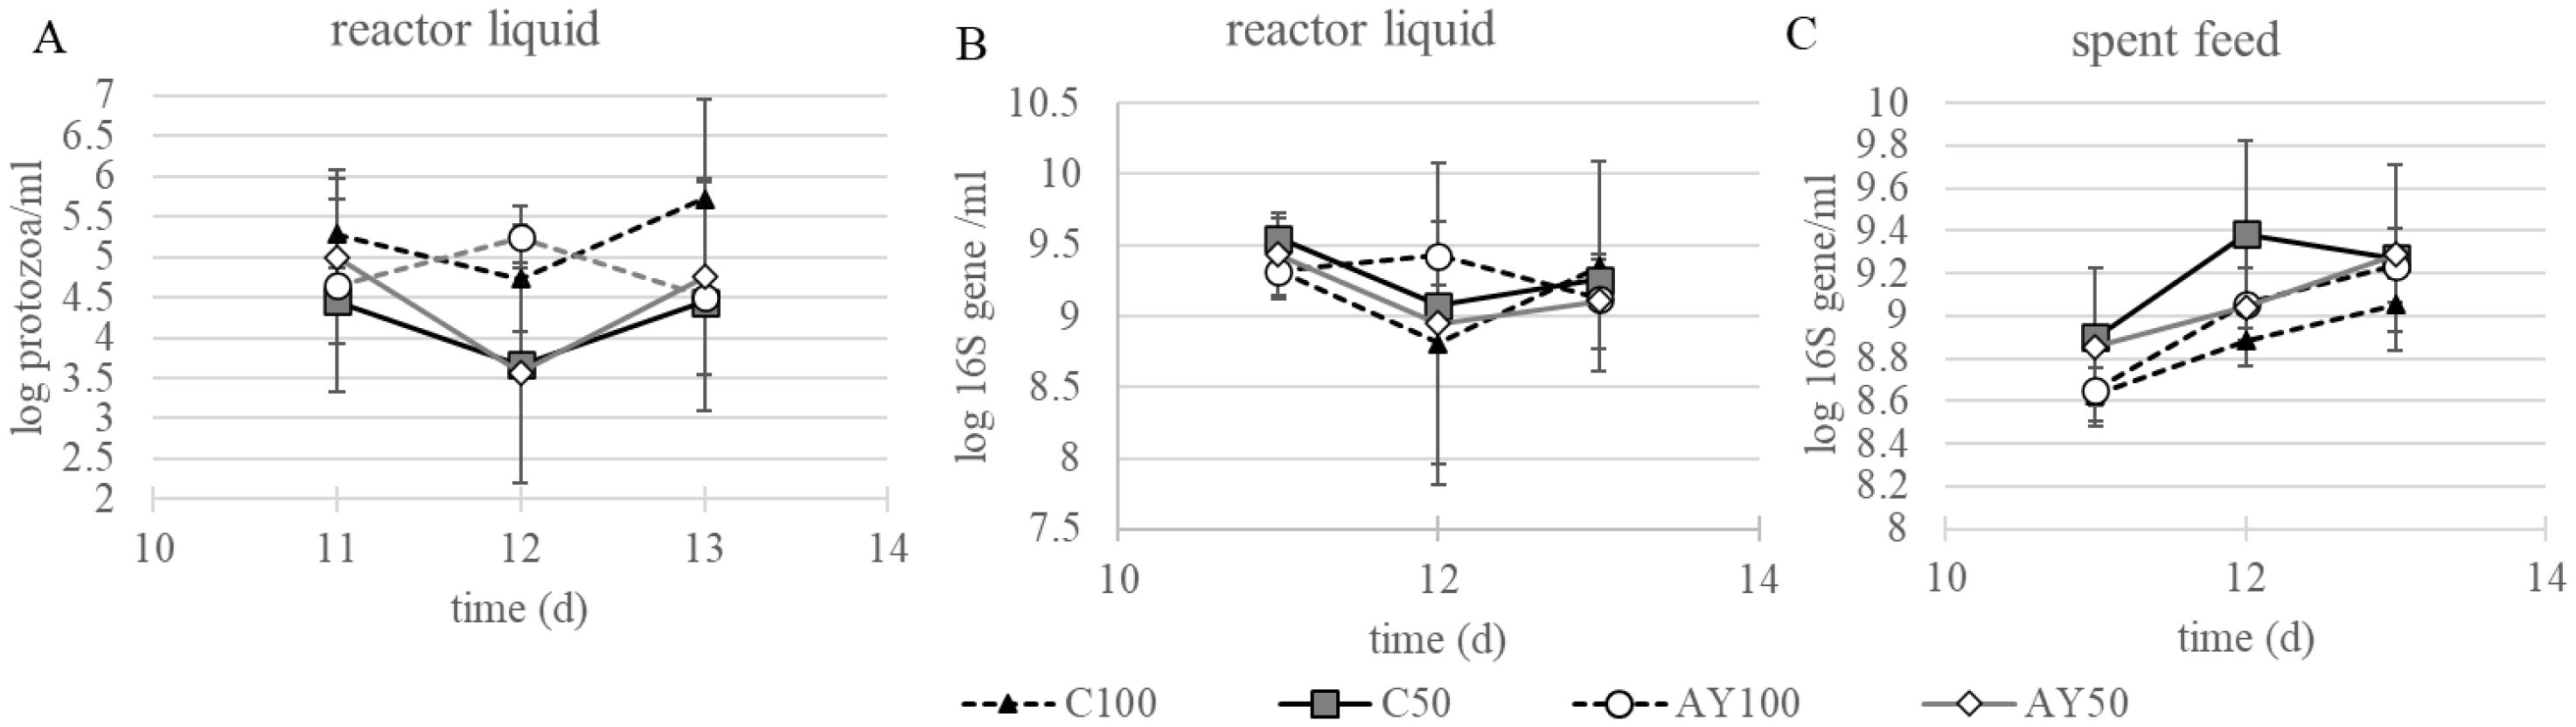
Figure 3. Log copy of 18S (A) protozoa and 16S (B) bacteria in the liquid content of the reactors and 16S log copy number of bacteria in the collected feed (C). AY, autolyzed yeast; C, control; 50, 50% diluted buffer; 100, standard McDougall buffer.
3.5 Microbial protein
Microbial protein in reactor liquid and solid fractions was not affected by buffer dilution or autolyzed yeast (AY) supplementation (Table 6). Microbial protein in reactor liquid significantly decreased over time (Supplementary Table 1, p<0.001) with the switch to HC diet but remained unaffected in collected feed.
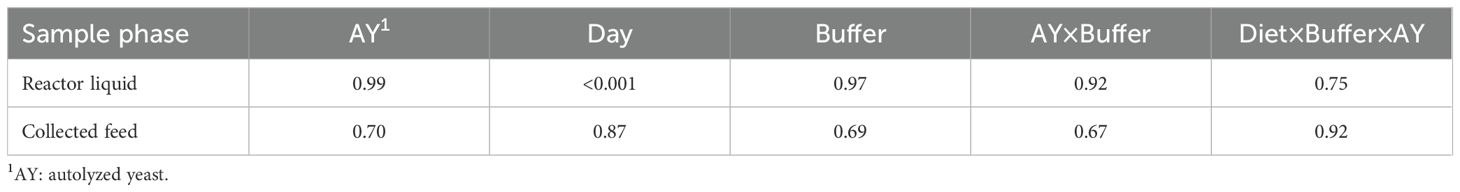
Table 6. Summary of p-values of type III ANOVA during sampling phase (d2 – d12) for microbial protein in the liquid and collected feed components of the reactor.
3.6 Microbial diversity
To look at the impact of reactor adaptations and acidotic feeding on the microbial diversity of the total microbiome (reactor liquid and collected feed), 16S rRNA gene sequences were combined from the 2 matrices for alpha diversity. Comparison of the interactions between diet, buffer and feed additive showed no impact on the Shannon index (Figure 4). For the statistical model, reactor liquid and collected feed were analyzed together and separately. The factor of day was used as data after 24h of incubation was available for the reactor liquid. Most factors (AY, day, buffer dilution) showed no impact on diversity with the exception that in the reactor liquid, there seemed to be a trend for an interaction with buffer for impacting diversity as indicated by the Shannon index (Supplementary Table 2). Beta-diversity (inter-sample diversity) is shown in a non-metric multidimensional scaling based on Bray-Curtis distance analysis of 16S rRNA gene data is shown in Figure 5. Permutation tests for homogeneity of multivariate dispersions showed no effect for the interaction between diet x buffer x feed additive (p = 0.217) nor feed additive (p = 0.609). While collected feed and liquid reactor samples were clearly separated in different clusters, the matrix type was significant when tested using permanova (p = 0.001), whereas buffer dilution was determined to have a tendance.
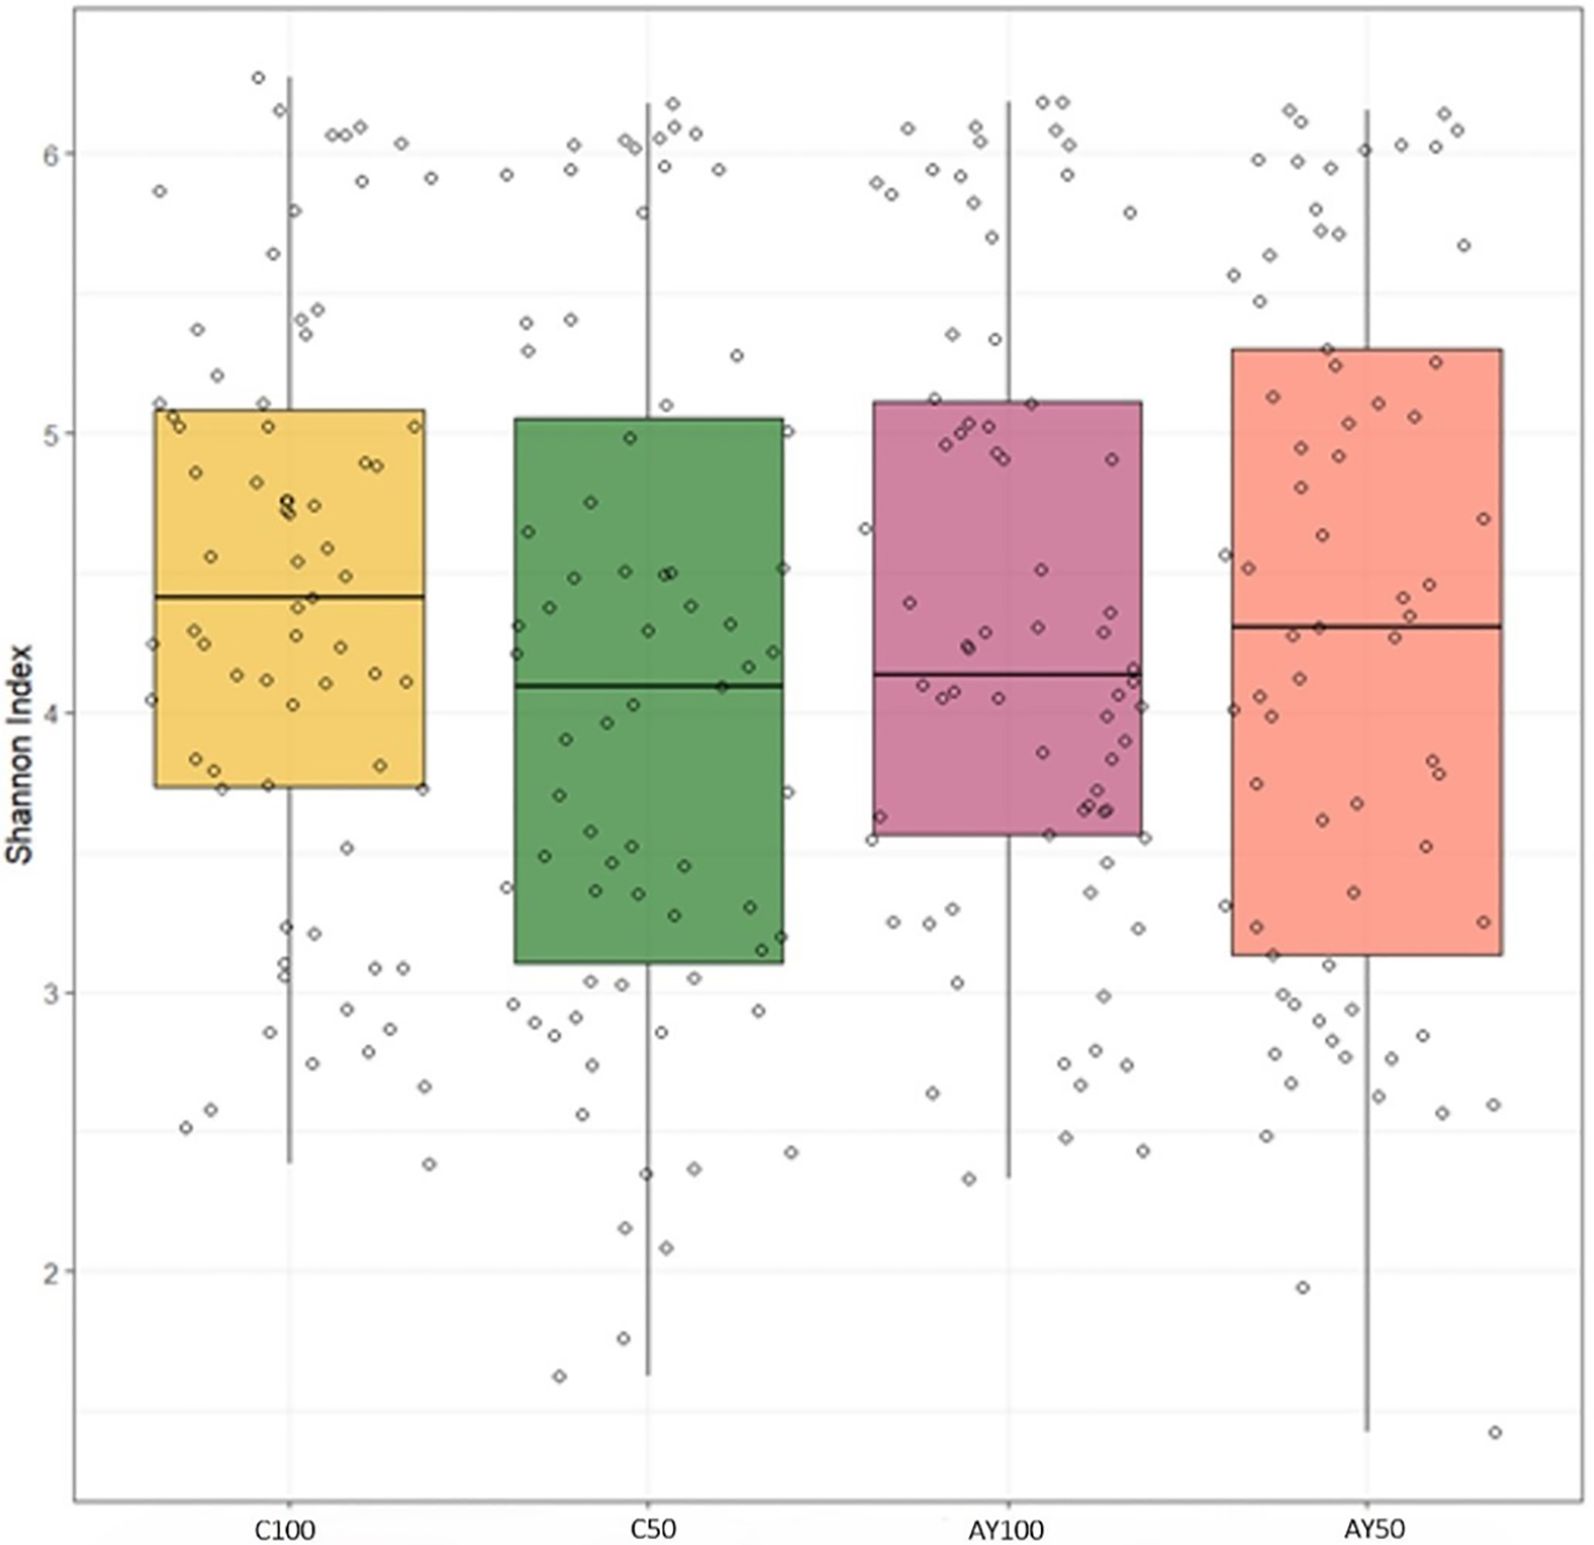
Figure 4. Boxplot of variation in Shannon index between diet, buffer and feed additive treatments. AY, autolyzed yeast; C, control; 50, 50% diluted buffer; 100, standard McDougall buffer.
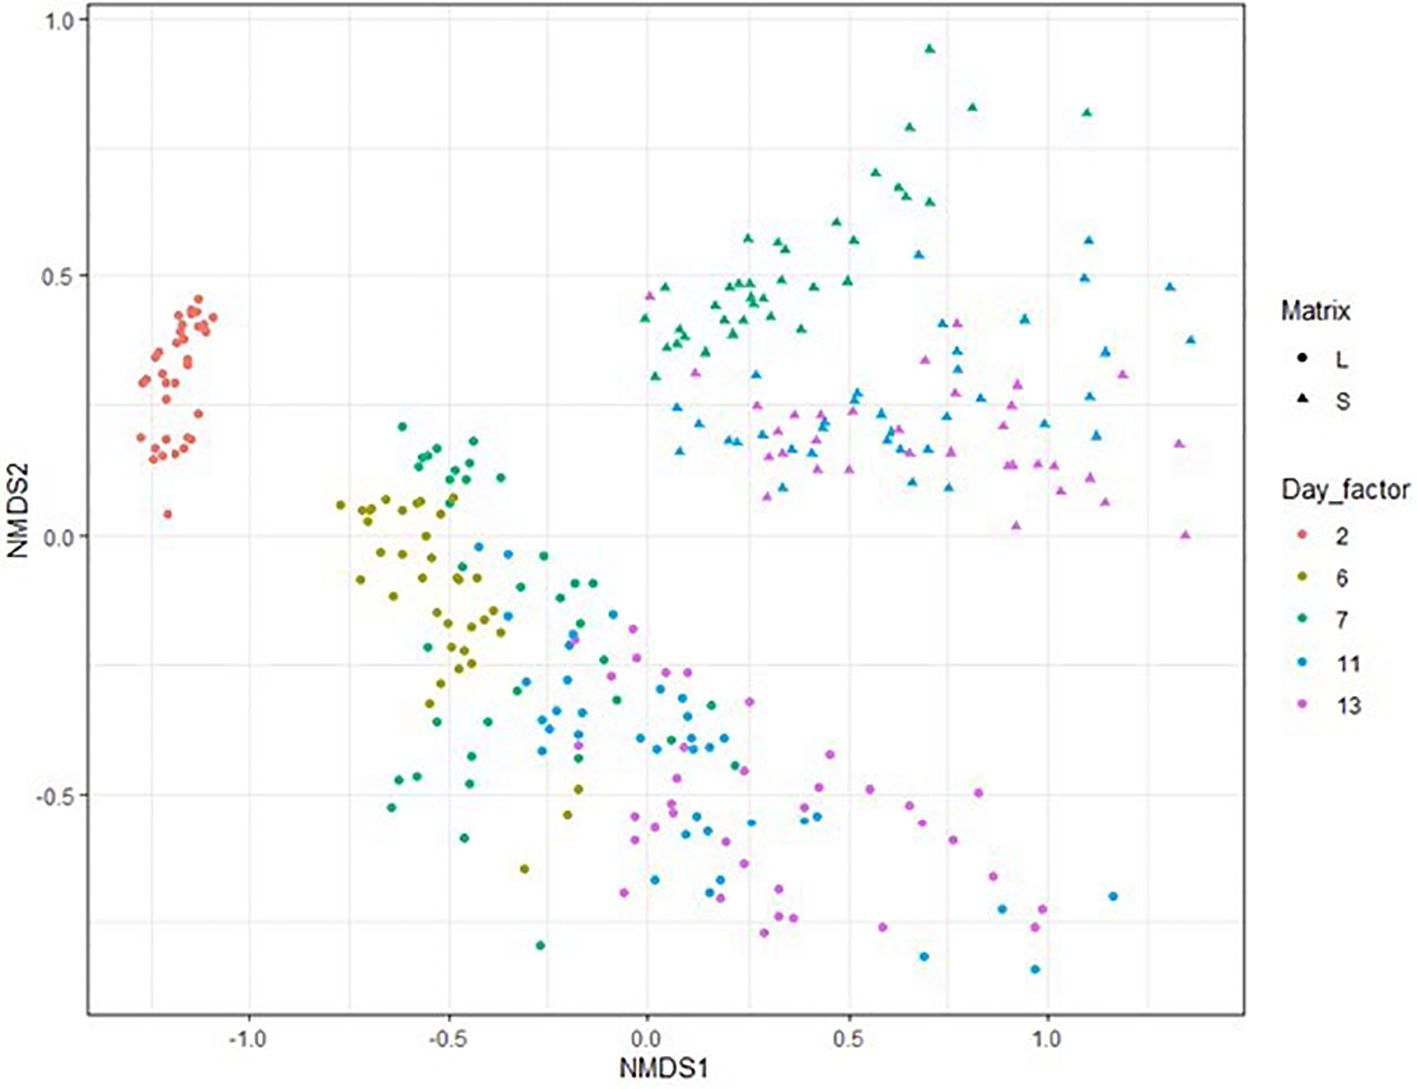
Figure 5. Bray-Curtis ordination of experimental day and matrix. Permutation tests values (diet x buffer x feed additive; p = 0.217), feed additive (p = 0.609), and matrix (p = 0.28) but positive effect of day (p = 0.001), diet (p = 0.001), and buffer (p = 0.033). Circles represent liquid reactor samples whereas triangles represent solid reactor samples. Day_factor is experimental day starting on day 2 (24h after start) and going until the last morning of the sampling phase (d13). Dietary change occurred on the morning of d5, therefore no 48h solid samples were available on d6, as well as day 2 (24h).
3.7 Microbial taxonomic variation
Analysis of the relative abundance of 16S sequences classified for taxonomy showed no significant effect of the buffer dilution or AY supplementation when data from the liquid and solid fractions were pooled together and analyzed across all time points (Figure 6). However, for Actinobacteria and Proteobacteria there was a buffer x time interaction (p = 0.03 and 0.01, respectively), and an effect of timepoint for Firmicutes and Synergistetes (p = 0.05 and 0.02, respectively). Phyla Bacteroidetes showed a significant effect of AY supplementation x matrix interaction (p < 0.0001), therefore, a separate analysis was conducted for the liquid and solid sequences separate. However, when the liquid and solid sequences were analyzed separately, the interaction effect was lost and only an impact of timepoint for the liquid fraction was seen (p < 0.0001). Therefore, statistical analyses were not completed for the family or genera level taxonomy.

Figure 6. Relative abundance of the family level taxonomy across treatments pooled for both liquid fraction and the collected feed fraction of extracted DNA. AY, autolyzed yeast; C, control; 50, 50% diluted buffer; 100, standard McDougall buffer.
4 Discussion
There is a growing demand for alternative research models to reduce or replace the use of animals in feed and feed additive testing. One such model is the rumen simulation technique (RUSITEC), which is well-established for longer-term (12–22 days) observations of ruminal fermentation, providing fermentation data comparable to in vivo studies (Martínez et al., 2010), unlike batch-culture methods. Key components of the RUSITEC model include the continuous supply of artificial saliva, daily feed additions, and the constant outflow of gas and liquid into secondary compartments, all within an anaerobic environment. However, variability within RUSITEC systems, including differences in heating methods (water bath vs. heating element), agitation style (vertical vs. circular), agitation speed, buffer composition, flow rate, and the combination or separation of solid and liquid reactor contents present challenges for comparing and reproducing experiments. Since no gold standard in vitro model exists, understanding how these variations influence data outcomes is critical for comparisons across systems.
To address this, we used a previously published in vitro subacute ruminal acidosis model (SARA) (Mickdam et al., 2016) to evaluate how changes in the reactor’s agitation style influence microbial fermentation and community composition.
4.1 Assessing a modified SARA model in vitro
In vitro SARA models often involve the use of a diluted buffer in combination with highly fermentable diets to induce a low ruminal pH similar to that which is seen in animals SARA, a common state of rumen instability and reduced pH (Mickdam et al., 2016). Previous studies have created the in vitro SARA model by using either buffer dilution (Guo et al., 2022a, b), or various combinations of diet and buffer (Mickdam et al., 2016; Orton et al., 2020), but the independent effects of buffer and diet have not been well described. In the current study, analysis was done to isolate the individual effects of buffer dilution and diet change to isolate their individual influence on the SARA model. Using adapted reactors, ruminal pH was measured continuously, compared to the single time points used in most studies (Mickdam et al., 2016; Orton et al., 2020; Wetzels et al., 2018). Results from the current study showed that pH was lower in the diluted buffer reactors after d6, confirming the impact of buffer solution. However, unlike previous studies, rumen pH did not reach SARA thresholds of 5.8 or ≥ 180 minutes a day (Plaizier et al., 2008) suggesting that buffer flow rate, not just dilution or diet, played a pivotal role. Specifically, the current study used a buffer flow rate which provided a 60% change-over within a 24-h period, whereas in the Mickdam et al. (2016) model, buffer flow was much lower at 36 - 40%. When comparing to other studies which used similar buffer flow rates to the current experiment, buffer compositions were significantly reduced and may not reflect in vivo conditions accurately (Guo et al., 2022b).
4.2 Linking pH to microbial stability and fermentation
Rumen pH is a critical abiotic factor influencing rumen microbial stability, particularly inhibiting pH-sensitive cellulolytic bacteria (Neubauer et al., 2018) resulting in reduced fiber digestion. As such, understanding how feed additives mitigate the adverse effects of low pH is imperative to understanding their potential role in maintaining ruminal stability during critical production periods, such as lactation. The current study showed an interaction between diet and buffer dilution affecting pH, supporting previous findings that both components are necessary to effectively induce a SARA challenge in vitro (Mickdam et al., 2016; Orton et al., 2020). However, despite this interaction, microbial diversity and taxonomic abundance remained unchanged, likely due to the failure to achieve true SARA conditions, caused by elevated buffer flow rates, and as well the period of adaptation prior to microbial sampling. Although this limitation prevented a full assessment of microbial responses under SARA conditions, it highlights the importance of incorporating an adaptation phase into in vitro models. This approach allows microbial populations to stabilize following dietary or environmental changes, which mirrors stabilization patterns seen in vivo, despite a lack of host effects (Petri et al., 2019; Weimer et al., 2010).
While pH is the gold standard to determining SARA in cattle (Humer et al., 2018; Holtshausen et al., 2013), there are other early indicators of ruminal upset that can be assessed in animals where rumen pH cannot be directly measured. These include reduced digestibility resulting in increased hindgut fermentation, lowered fecal pH, and increased fecal SCFA. Although these downstream effects are not measurable in vitro, rumen fermentation can be more closely monitored to better understand fermentation dynamics. In this study, DMD remained stable during the adaptation phase (d1 – d5), but immediately increased following dietary switch followed by a slow decline. Buffer dilution did not significantly impact fermentation parameters during the sampling phase, indicating that for DMD, dietary composition had a stronger influence than buffer dilution. This is supported by other studies showing strong effects of dietary composition and feed additives on DMD in vitro irrespective of buffer composition (Righi et al., 2017; O’Brien et al., 2013).
Although DMD remained unchanged, composition of SCFA did shift with dietary change. Propionate as a percent of the molar concentration, decreased over time, and both total SCFA and acetate concentrations were impacted by between buffer dilution and sampling day. Reactors with 100% buffer showed an upwards trend in acetate concentrations, whereas those with 50% buffer declined with dietary switch, particularly in reactors receiving AY, which was also reflected in the increasing A:P ratio. While Mickdam et al. (2016) observed decreased SCFA and a lower A:P ration in the SARA model, their conclusions were based on a single time point and lacked within-reactor baselines. In contrast, Orton et al. (2020) found no difference in SCFA over the comparable time period, emphasizing variability in results within the literature, and underlining the need for standardized in vitro protocols.
Decreases in microbial protein in reactor liquid were seen after the diet change, but not in collected feed. Additionally, there was no change in 16S rRNA gene copies for bacteria in the liquid and in the collected feed. However, the abundance of protozoa in the reactor liquid was affected by a 3-way interaction among buffer dilution, diet and AY supplementation. This aligns with Mickdam et al. (2016), who also found reduced protozoa in reactors with SARA inducing buffer compared to those with normal buffer. While previous studies have shown that protozoa typically have low survival rates in vitro, the numbers tend to decrease within 24h and then remain stable for the remainder of the experiment (Teather and Sauer, 1988). This suggests that declines in microbial protein may be more closely tied to protozoal loss than bacterial shifts. This is supported by the observed stability in microbial richness (Shannon), and the beta-diversity analysis which confirmed consistent clustering between both liquid and feed samples from the reactor and is in alignment with previous research (Boguhn et al., 2006).
4.3 Impact of autolyzed yeast on in vitro fermentation
The second objective of this experiment was to assess AY supplementation on fermentation under SARA conditions. As SARA is associated with a dysbiosis of the ruminal microbiota, using an in vitro SARA model offers a controlled and repeatable model for testing feed additives and their mode of action without the need to induce SARA in cattle (Mickdam et al., 2016). Saccharomyces cerevisiae is a commonly used feed additive in ruminant diets and has been shown to improve rumen pH, volatile fatty acid (VFA) profile, and nutrient digestibility in vivo (Neubauer et al., 2018; Knollinger et al., 2022). Additionally, AY may also enhance fiber digestion and the growth of rumen bacteria (Callaway and Martin, 1997; Neubauer et al., 2018), but these benefits have not been confirmed in vitro, where animal variation in eating, rumination, buffer capacity and absorptive capacity can greatly impact rumen fermentation.
While no impacts were seen on DMD with the supplementation of AY, there was still a trend towards a decrease in pH after dietary change. Particularly, relative proportions of acetate were lower in 50% buffer dilution, suggesting that the supplementation of AY can keep up fiber digestion by fiber associated bacteria under conditions of low buffering capacity. This aligns with previous research showing that yeast products can reduce oxidative stress, thereby protecting both microbes as well as supporting digestion through provision of nutrients and vitamins (Shurson, 2018). Despite minimal changes in the overall microbial community, clear differences in metabolism were seen supporting positive impacts of AY on the rumen stability under variable conditions.
5 Conclusions
This research demonstrates the value of adapting the RUSITEC model for generating precise and reproducible data without the challenges of animal variation or inducing illnesses such as SARA. Such modifications enable improved testing of nutritional interventions and feed additives. Our results also confirm that both diet change and buffer dilution are required for impacting the pH in an in vitro model; however buffer flow rates are an important aspect when considering buffer composition. Although in vitro studies cannot fully replicate the complex rumen ecosystem due to biological variation from tissue absorption and individual animal behavior, they provide important insights into microbial dynamics, as seen in this study where microbial diversity can show stability yet functional shifts in microbial activity indicate important potential implications in vivo. Overall, this study also supports the use of autolyzed yeast products in dairy diets, as a strategy to stabilize the rumen environment while feeding highly digestible diets. Future studies should incorporate metabolomics and bacterial function through proteomics while using RUSITEC models to better understand how feed additives impact bacterial metabolic pathways.
Data availability statement
The original contributions presented in the study are publicly available. This data can be found here: NCBI BioProject, accession PRJNA1199526.
Author contributions
RP: Conceptualization, Formal Analysis, Methodology, Supervision, Validation, Visualization, Writing – original draft, Writing – review & editing. BA: Conceptualization, Investigation, Methodology, Supervision, Writing – original draft, Writing – review & editing. LK: Conceptualization, Methodology, Resources, Validation, Writing – original draft, Writing – review & editing. CG: Methodology, Validation, Writing – original draft, Writing – review & editing. JK: Conceptualization, Data curation, Formal Analysis, Funding acquisition, Investigation, Methodology, Project administration, Resources, Supervision, Validation, Visualization, Writing – original draft, Writing – review & editing.
Funding
The author(s) declare financial support was received for the research and/or publication of this article. The authors declare that financial support for the project and publication was provided by dsm-firmenich.
Acknowledgments
The authors wish to acknowledge the support of those who assisted in experimental set-up and sampling including Iris Schantl, Christian Stoiber, Thomas Marchard, Annamaria Boczonadi.
Conflict of interest
Authors BA, CG, and JCK are employed by dsm-firmenich, Animal Nutrition & Health, a company that among other things manufactures and commercializes feed additives, as the one evaluated in this article. BA, CG, and JCK are employed as Scientists; they are not directly responsible for any sales and marketing activities.
The remaining authors declare that the research was conducted in the absence of any commercial or financial relationships that could be construed as a potential conflict of interest.
Generative AI statement
The author(s) declare that no Generative AI was used in the creation of this manuscript.
Any alternative text (alt text) provided alongside figures in this article has been generated by Frontiers with the support of artificial intelligence and reasonable efforts have been made to ensure accuracy, including review by the authors wherever possible. If you identify any issues, please contact us.
Publisher’s note
All claims expressed in this article are solely those of the authors and do not necessarily represent those of their affiliated organizations, or those of the publisher, the editors and the reviewers. Any product that may be evaluated in this article, or claim that may be made by its manufacturer, is not guaranteed or endorsed by the publisher.
Supplementary material
The Supplementary Material for this article can be found online at: https://www.frontiersin.org/articles/10.3389/fanim.2025.1620969/full#supplementary-material
References
Boguhn J., Kluth H., and Rodehutscord M. (2006). Effect of total mixed ration composition on amino acid profiles of different fractions of ruminal microbes in vitro. J. dairy Sci. 89, 1592–1603. doi: 10.3168/jds.S0022-0302(06)72226-3
Callaway E. S. and Martin S. A. (1997). Effects of a Saccharomyces cerevisiae culture on ruminal bacteria that utilize lactate and digest cellulose. J. dairy Sci. 80, 2035–2044. doi: 10.3168/jds.s0022-0302(97)76148-4
Cantalapiedra-Hijar G., Yáñez-Ruiz D. R., Newbold C. J., and Molina-Alcaide E. (2011). The effect of the feed-to-buffer ratio on bacterial diversity and ruminal fermentation in single-flow continuous-culture fermenters. J. Dairy Sci. 94, 1374–1384. doi: 10.3168/jds.2010-3260
Caporaso J. G., Kuczynski J., Stombaugh J., Bittinger K., Bushman F. D., Costello E. K., et al. (2010). QIIME allows analysis of high-throughput community sequencing data. Nat. Methods 7, 335–336. doi: 10.1038/nmeth.f.303
Carrez M. C. (1909). Annales de chimie analytique. (Paris, France: Syndicat central des chimistes et essayistes de France) Vol. 14. 187–189.
Chao A. (1984). Nonparametric estimation of the number of classes in a population. Scandinavian J. Stat. 11, 265–270. doi: 10.1080/1048525031000089266
Clifford R. J., Milillo M., Prestwood J., Quintero R., Zurawski D. V., Kwak Y. I., et al. (2012). Detection of bacterial 16S rRNA and identification of four clinically important bacteria by real-time PCR. PloS One 7, e48558. doi: 10.1371/journal.pone.0048558
Czerkawski J. W. and Breckenridge G. (1977). Design and development of a long-term rumen simulation technique (Rusitec). Br. J. Nutr. 38, 371–384. doi: 10.1079/bjn19770102
Dias A. L. G., Freitas J. A., Micai B., Azevedo R. A., Greco L. F., and Santos J. E. P. (2018). Effects of supplementing yeast culture to diets differing in starch content on performance and feeding behavior of dairy cows. J. Dairy Sci. 101, 186–200. doi: 10.3168/jds.2017-13240
Guo Y., Xiao L., Jin L., Yan S., Niu D., and Yang W. (2022a). Effect of commercial slow-release urea product on in vitro rumen fermentation and ruminal microbial community using RUSITEC technique. J. Anim. Sci. Biotechnol. 13, 56. doi: 10.1186/s40104-022-00700-8
Guo T., Guo T., Guo L., Li F., Li F., and Ma Z. (2022b). Rumen bacteria abundance and fermentation profile during subacute ruminal acidosis and its modulation by Aspergillus oryzae culture in RUSITEC system. Fermentation 8, 329. doi: 10.3390/fermentation8070329
Guo J., Zhang Z., Guan L. L., Yoon I., Plaizier J. c., and Khafipour E. (2024). Postbiotics from Saccharomyces cerevisiae fermentation stabilize microbiota in rumen liquid digesta during grain-based subacute ruminal acidosis (SARA) in lactating dairy cows. J. Anim. Sci. Biotechnol. 15 (1). doi: 10.1186/s40104-024-01056-x
Holtshausen L., Schwartzkopf-Genswein K. S., and Beauchemin K. A. (2013). Ruminal pH profile and feeding behaviour of feedlot cattle transitioning from a high-forage to a high-concentrate diet. Can. J. Anim. Sci. 93, 529–533. doi: 10.4141/cjas2013-073
Humer E., Petri R. M., Aschenbach J. R., Bradford B. J., Penner G. B., Tafaj M., et al. (2018). Invited review: Practical feeding management recommendations to mitigate the risk of subacute ruminal acidosis in dairy cattle. J. dairy Sci. 101, 872–888. doi: 10.3168/jds.2017-13191
Knollinger S. E., Poczynek M., Miller B., Mueller I., de Almeida R., Murphy M. R., et al. (2022). Effects of autolyzed yeast supplementation in a high-starch diet on rumen health, apparent digestibility, and production variables of lactating Holstein cows. Animals 12, 2445. doi: 10.3390/ani12182445
Lozupone C. A. and Knight R. (2008). Species divergence and the measurement of microbial diversity. FEMS Microbiol. Rev. 32, 557–578. doi: 10.1111/j.1574-6976.2008.00111.x
Martínez M. E., Ranilla M. J., Tejido M. L., Ramos S., and Carro M. D. (2010). Comparison of fermentation of diets of variable composition and microbial populations in the rumen of sheep and Rusitec fermenters. I. Digestibility, fermentation parameters, and microbial growth. J. dairy Sci. 93, 3684–3698. doi: 10.3168/jds.2009-2933
McMurdie P. J. and Holmes S. (2013). phyloseq: an R package for reproducible interactive analysis and graphics of microbiome census data. PloS One 8, e61217. doi: 10.1371/journal.pone.0061217
Mickdam E., Khiaosa-Ard R., Metzler-Zebeli B. U., Klevenhusen F., Chizzola R., and Zebeli Q. (2016). Rumen microbial abundance and fermentation profile during severe subacute ruminal acidosis and ist modulation by plant derived alkaloids in vitro. Anaerobe 39, 4–13. doi: 10.1016/j.anaerobe.2016.02.002
Navas-Molina J. A., Peralta-Sánchez J. M., González A., McMurdie P. J., Vázquez-Baeza Y., Xu Z., et al. (2013). “Advancing our understanding of the human microbiome using QIIME,” in Methods in enzymolog, vol. 531. (Academic Press), 371–444. doi: 10.1016/b978-0-12-407863-5.00019-8
Neubauer V., Petri R., Humer E., Kröger I., Mann E., Reisinger N., et al. (2018). High-grain diets supplemented with phytogenic compounds or autolyzed yeast modulate ruminal bacterial community and fermentation in dry cows. J. dairy Sci. 101, 2335–2349. doi: 10.3168/jds.2017-13565
O’Brien M., Navarro-Villa A., Purcell P. J., Boland T. M., and O’kiely P. (2013). Reducing in vitro rumen methanogenesis for two contrasting diets using a series of inclusion rates of different additives. Anim. Production Sci. 54, 141–157. doi: 10.1071/AN12204
Orton T., Rohn K., Breves G., and Brede M. (2020). Alterations in fermentation parameters during and after induction of a subacute rumen acidosis in the rumen simulation technique. J. Anim. Physiol. Anim. Nutr. 104, 1678–1689. doi: 10.1111/jpn.13412
Petri R. M., Mickdam E., Klevenhusen F., Beyer B., and Zebeli Q. (2019). Effects of the supplementation of plant-based formulations on microbial fermentation and predicted metabolic function in vitro. Anaerobe 57, 19–27. doi: 10.1016/j.anaerobe.2019.03.001
Plaizier J. C., Krause D. O., Gozho G. N., and McBride B. W. (2008). Subacute ruminal acidosis in dairy cows: The physiological causes, incidence and consequences. Vet. J. 176 (1), 21–31. doi: 10.1016/j.tvjl.2007.12.016
Quast C., Pruesse E., Yilmaz P., Gerken J., Schweer T., Yarza P., et al. (2012). The SILVA ribosomal RNA gene database project: improved data processing and web-based tools. Nucleic Acids Res. 41, D590–D596. doi: 10.1093/nar/gks1219
Righi F., Simoni M., Foskolos A., Beretti V., Sabbioni A., and Quarantelli A. (2017). In vitro ruminal dry matter and neutral detergent fibre digestibility of common feedstuffs as affected by the addition of essential oils and their active compounds. J. Anim. Feed Sci. 26, 204–212. doi: 10.22358/jafs/76754/2017
Shannon C. E. (1948). A mathematical theory of communication. Bell Syst. Techn. J. 27 (4), 623–656. doi: 10.1002/j.1538-7305.1948.tb00917.x
Shurson G. C. (2018). Yeast and yeast derivatives in feed additives and ingredients: Sources, characteristics, animal responses, and quantification methods. Anim. feed Sci. Technol. 235, 60–76. doi: 10.1016/j.anifeedsci.2017.11.010
Sundberg C., Al-Soud W. A., Larsson M., Alm E., Yekta S. S., Svensson B. H., et al. (2013). 454 pyrosequencing analyses of bacterial and archaeal richness in 21 full-scale biogas digesters. FEMS Microbiol. Ecol. 85, 612–626. doi: 10.1111/1574-6941.12148
Sylvester J. T., Karnati S. K., Yu Z., Morrison M., and Firkins J. L. (2004). Development of an assay to quantify rumen ciliate protozoal biomass in cows using real-time PCR. J. Nutr. 134, 3378–3384. doi: 10.1093/jn/134.12.3378
Teather R. M. and Sauer F. D. (1988). A naturally compartmented rumen simulation system for the continuous culture of rumen bacteria and protozoa. J. Dairy Sci. 71, 666–673. doi: 10.3168/jds.S0022-0302(88)79605-8
Villanueva R. A. M. and Chen Z. J. (2019). ggplot2: elegant graphics for data analysis (Springer International Publishing).
Vinyard J. R. and Faciola A. P. (2022). Unraveling the pros and cons of various in vitro methodologies for ruminant nutrition: a review. Trans. Anim. Sci. 6, txac130. doi: 10.1093/tas/txac130
Weimer P. J., Stevenson D. M., Mantovani H. C., and Man S. L. C. (2010). Host specificity of the ruminal bacterial community in the dairy cow following near-total exchange of ruminal contents. J. dairy Sci. 93, 5902–5912. doi: 10.3168/jds.2010-3500
Wetzels S. U., Eger M., Burmester M., Kreienbrock L., Abdulmawjood A., Pinior B., et al. (2018). The application of rumen simulation technique (RUSITEC) for studying dynamics of the bacterial community and metabolome in rumen fluid and the effects of a challenge with Clostridium perfringens. PLoS One 13, e0192256. doi: 10.1371/journal.pone.0192256
Keywords: in vitro, RUSITEC, SARA, feed additive, yeast, diversity, fermentation
Citation: Petri RM, Antlinger B, Khol LJ, Gruber C and Kesselring JC (2025) Optimization of RUSITEC model adaptations for in vitro simulation of subacute ruminal acidosis and evaluation of Saccharomyces cerevisiae supplementation on microbial fermentation and stability. Front. Anim. Sci. 6:1620969. doi: 10.3389/fanim.2025.1620969
Received: 30 April 2025; Accepted: 29 July 2025;
Published: 01 September 2025.
Edited by:
Michael D. Flythe, United States Department of Agriculture, United StatesReviewed by:
Eduardo Marostegan Paula, Colorado State University, United StatesMuhammadin Hamid, University of North Sumatra, Indonesia
Copyright © 2025 Petri, Antlinger, Khol, Gruber and Kesselring. This is an open-access article distributed under the terms of the Creative Commons Attribution License (CC BY). The use, distribution or reproduction in other forums is permitted, provided the original author(s) and the copyright owner(s) are credited and that the original publication in this journal is cited, in accordance with accepted academic practice. No use, distribution or reproduction is permitted which does not comply with these terms.
*Correspondence: Jutta Cordula Kesselring, anV0dGEua2Vzc2VscmluZ0Bkc20tZmlybWVuaWNoLmNvbQ==