 Chiara Punturiero
 Andrea Delledonne
 Carlotta Ferrari
 Alessandro Bagnato
 Maria Giuseppina Strillacci
- Department of Veterinary Medicine and Animal Science, Università degli Studi di Milano, Lodi, Italy
Introduction: This study evaluated the genetic architecture of resilience indicators in Holstein cows managed in a herd equipped with automatic milking systems (AMS) from 2017 to 2024.
Methods: Four resilience indicators were calculated based on deviations in daily milk yield: log-transformed variance (LnVar), autocorrelation of residuals (rauto), weighted frequency of perturbations (wfPert), and accumulated milk losses due to perturbations (dPert). Polynomial quantile regression models were applied to 594,481 daily records from 966 cows, with data filtered for completeness and lactation duration. Genome-wide association studies (GWAS) were performed using selective genotyping coupled with DNA pooling statistics.
Results: Descriptive statistics revealed that LnVar increased with parity, indicating greater production variability in older cows, while rauto remained stable, suggesting a consistent ability of cows to recover from production perturbations. Both dPert and wfPert increased across lactations, reflecting greater cumulative losses and perturbation frequencies. Genes related to immune response, energy metabolism, and tissue integrity were identified.
Discussion: These findings suggest a multifactorial complex genetic nature of resilience and disclose the involvement of several genes that can explain both the physiology related to production and response to stressors.
1 Introduction
Over the past few years, the introduction of advanced monitoring systems in dairy farms such as automatic milking systems (AMS), have significantly enhanced data collection capabilities. The adoption of AMS provides continuous and high-resolution data. This system enables an unprecedented ability to monitor fluctuations in milk yield and to detect health-related disturbances. Such systems offer valuable insight into resilience, particularly by facilitating the longitudinal monitoring required to capture production responses to environmental stressors and management interventions (Niloofar et al., 2021).
Resilience in dairy cows is a critical aspect, especially in the face of environmental disruptions such as calving, infection by various pathogens, extreme weather (e.g. heat waves), or fluctuations in feed availability and management practice (Hansen et al., 2012; Aradotlu Parameshwarappa et al., 2019). Maintaining high milk yield is essential for the profitability of dairy farms, but health issues can lead to substantial losses in milk production and its quality (Liang et al., 2017). These losses often appear as disruptions in the lactation curve (Hertl et al., 2014; Ben Abdelkrim et al., 2021), due to reduced feed intake, immune system activation (Daniel et al., 2016) and intramammary infections affecting the udder’s functionality (Heikkilä et al., 2018). Resilient cows are minimally affected by these disturbances and are able to recover quickly, resulting in reduced labor requirements, lower treatment costs, and decreased milk yield losses compared to their less resilient counterparts (Colditz and Hine, 2016; Berghof et al., 2019b). In order to quantify general resilience, two primary indicators have been recently proposed: the natural log-transformed variance of deviations from an expected lactation curve (LnVar) and the lag-1 autocorrelation of yield deviations (rauto). These indicators are based on the hypothesis that cows with stable production (low LnVar) and quick recovery from disturbances (low rauto) exhibit greater resilience (Scheffer et al., 2018; Poppe et al., 2020). Lower LnVar values indicate more stable production and higher resilience to disturbances (Scheffer et al., 2018). Differently, the parameter rauto assesses recovery times from disturbances by measuring the autocorrelation of yield deviations over time. A lower rauto value signifies a faster return to baseline performance following disturbances, indicating quicker recovery (Poppe et al., 2020; Wang et al., 2022a). In addition to these established indicators, more recent published research has introduced novel metrics for resilience assessment, daily perturbations (dPert) and weighted frequency of perturbations (wfPert) (Chen et al., 2023). These metrics propose a more dynamic and real-time evaluation of resilience by capturing the frequency and impact of deviations in daily milk yield.
Similar approaches have been applied to dairy cattle using daily step counts and to other livestock species, including pigs, chickens, and lambs, using longitudinal records of feed intake and body weight (BW) (Berghof et al., 2019a; Nguyen-Ba et al., 2020; Ben Abdelkrim et al., 2021; Garcia-Baccino et al., 2021; Poppe et al., 2022).
Despite these advances, the integration of genomic information to uncover the genetic basis of resilience is still in its infancy and remains an open topic that requires further investigation. Studies have shown that LnVar has the highest heritability among resilience indicators, ranging from 0.13 to 0.21 depending on the lactation stage (Poppe et al., 2021a; Chen et al., 2023). It is also significantly genetically correlated with health, longevity, fertility, and metabolic traits, highlighting its potential value for breeding more resilient cows. In contrast, rauto exhibits low heritability, ranging from 0.02 to 0.08, suggesting that while it provides some insight into recovery times, it may be less effective for selection purposes. Similarly, the heritability values of wfPert and dPert are low, spanning from 0.01 to 0.06 across different parities (Chen et al., 2023).
Genome-wide association studies (GWAS) have revealed differences in the genetic architecture of resilience indicators derived from milk yield variability in North American Holstein cattle (Chen et al., 2024). Relevant genomic regions and biological pathways, particularly those related to intestinal homeostasis, were identified and Mendelian Randomization (MR) analyses indicated an unfavorable causal association between daily milk yield (DMY) and LnVar, suggesting caution in its use for breeding resilient cattle (Chen et al., 2024). Additionally, herd management significantly affects resilience indicators, as variations across herd-years highlight the impact of practices like feed management on environmental disturbances (Chen et al., 2024).
Based on this concept, the aims of the present study were: i) to calculate the resilience indicators described above for cows farmed in a single dairy herd with a large amount of longitudinal data available from an AMS; and ii) to perform a GWAS based on a selective genotyping (Darvasi and Soller, 1992) using the selective DNA pooling statistics methodology to identify linkage between QTLs and SNP markers (Darvasi and Soller, 1994).
2 Materials and methods
2.1 Ethics statement
No animal care committee approval was necessary for the purposes of this study, as all genotypes and data were available from the pre-existing database of the GENORIP project, funded by the Lombardy Region
2.2 Data editing
In this study, we used data collected from nine AMS units between January 2017 and August 2024 on a farm in the Lombardy region (Italy). The dataset consisted of 594,481 daily observations from 966 individual cows, 113 of which had three completed lactations. To ensure the use of high-quality data, we conducted rigorous preprocessing. The first step involved thorough data editing, focusing on filtering out records with missing values or instances where daily milk production was recorded as zero. Next, we removed from the analysis the production of the first 10 Days in Milk (DIM). Then the data analysis was stratified by parity while only those from 1 to 3 were retained. Lactations were filtered by selecting only those that started before the 30th DIM in our database and had at least 250 daily recordings (i.e. DIM); we considered for the study the conventional lactation at 305 DIM. Table 1 provides a detailed summary of the number of observations at the start of the analysis and the remaining counts after each data filtering step, alongside the corresponding relative distribution of cows analyzed. After the application of all filtering criteria, the final dataset included 627 cows in first parity, 320 in second parity, and 136 in third parity. This progression ensures a robust dataset with representative samples across the different parity orders for subsequent analyses.
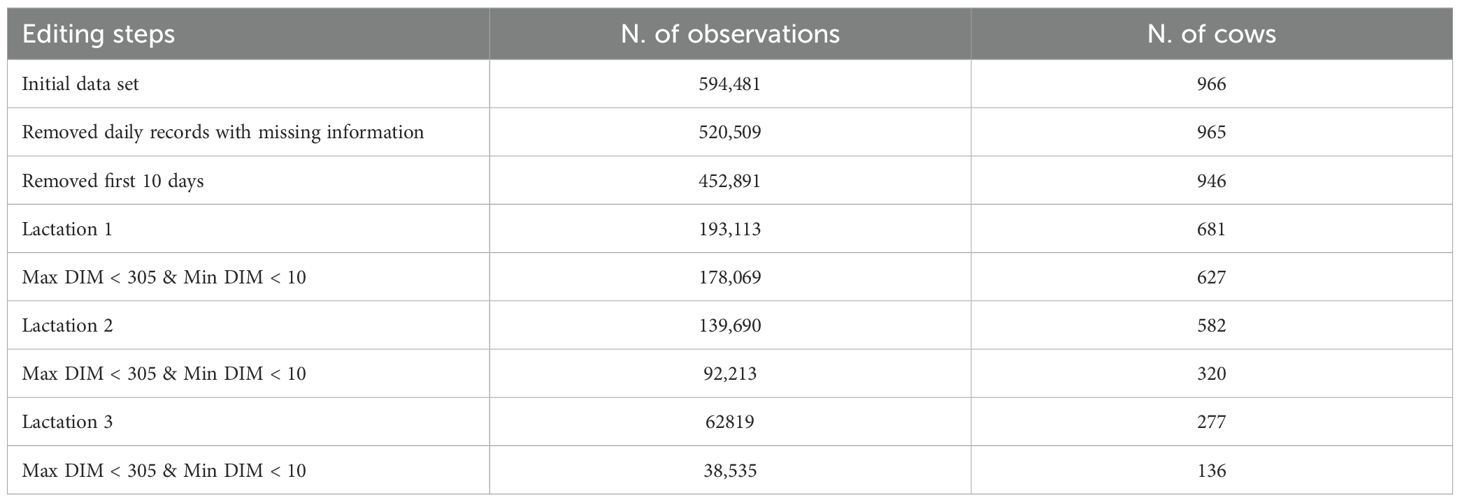
Table 1. Workflow adopted before computing the resilience indicators.
2.3 Expected lactation curve
For each cow and each parity order, we applied a fourth-degree polynomial quantile regression using the ‘quantreg’ package in R and the poly function to generate orthogonal polynomial terms (Koenker et al., 2018; Poppe et al., 2020). This approach allowed us to capture nuanced variations in milk production. For each cow and parity, a polynomial quantile regression curve with the 70th percentile (τ = 0.7) was fitted using daily milk production data and days in milk (DIM), capturing the expected milk yield under normal conditions
where: yi is the predicted daily milk production for day DIMi; β0, β1, β2, β3, β4 are the intercept and the first to fourth order coefficients of the polynomial regression describing the relationship between DIMn and yi; ei is the error term.
The choice of the 70th percentile in the quantile regression was guided by its ability to provide a balanced estimate of the expected milk yield under normal physiological conditions. This quantile reflects production levels that are less influenced by short-term fluctuations or extreme negative deviations, making it particularly suitable for evaluating how well cows sustain higher yields in the face of potential disturbances. This approach has been supported in previous studies (Poppe et al., 2020) which employed the 70th percentile for similar purposes in resilience assessment. Then we calculated the daily yield deviations (residuals) as follows:
where Resi represents the deviation between the observed and expected milk yield on day DIMi, as derived from model (1)
2.4 Resilience indicators calculation
Four resilience indicators were then calculated starting from the daily yield deviations residuals, Resi, all of which are based on the cited studies (Poppe et al., 2020; Adriaens et al., 2021; Chen et al., 2023):
i. Natural log-transformed variance (LnVar): obtained as the natural logarithm of the variance of all Resi:
where n represents the total number of observations, x denotes the ith observation, spanning from the first to the last available DIM, and represents the average of the i observations.
LnVar provides a comprehensive measure of milk production stability within each lactation.
ii. Autocorrelation of Residuals (rauto): is calculated as the autocorrelation of residuals over consecutive days:
where n represents the total number of observations, x denotes the ith observation, spanning from the first to the last available DIM, represents the average of the i observations, and s represents the standard deviation of the I observations.
This indicator helps identify patterns of persistence or volatility in milk production dynamics over time.
iii. Weighted occurrence frequency of yield perturbations (wfPert): this indicator quantifies the occurrence of perturbations. Only sequences of at least four consecutive days with negative deviations from expected values in milk production were considered. Each sequence was required to include at least one day in which total daily milk pro-duction fell below 80% of the estimated unperturbed lactation curve. The duration of each sequence was weighted (1/4 per day) to assess its overall impact on milk production efficiency (Adriaens et al., 2021; Chen et al., 2023):
where lp is the length of the perturbation and n is the total number of perturbation events. At the end the indicator was normalized to a ratio per 100 DIM, dividing it by the number of DIM and multiplied by 100.
iv. Accumulated milk losses of yield perturbations (dPert): it stands for the total milk losses associated with perturbation and was calculated as the differences between expected productions and actual ones, in percentage (Adriaens et al., 2021; Chen et al., 2023).
where n is the total number of perturbation events, lp is the length of each perturbation (DIM); yexp and yobs are the estimated and observed daily milk yield, respectively. Finally, the indicator was normalized to a ratio per 100 DIM, dividing it by the number of DIM and multiplied by 100.
The Pearson correlations between pairs of indicators were assessed both within and across lactations. Within each lactation, correlations were calculated between the four resilience indicators (LnVar, rauto, dPert, wfPert), grouped by parity order. Additionally, to evaluate consistency across lactations, correlations were computed between the same indicators for cows with complete records across all three lactations.
2.5 Heritability of resilience indicators
Genetic parameters were estimated using the following animal model:
where y is the vector of phenotypic observations for each resilience indicator, β is the vector of fixed effects including age at calving (in months), month of calving (January to December), and year of calving (2017–2024), u is the vector of random additive genetic effects assumed to follow a distribution u∼N(0, Aσ2u) where A is the pedigree-based relationship matrix, and e is the vector of residual errors e∼N(0,Iσ2e).
Heritability was estimated using AIREMLF90 software (Misztal et al., 2018) based on the animal model described above. Estimates were obtained separately for parity order 1 and 2, not for parity order 3 because of the small sample size. The fixed effects include: age at calving expressed in months (from month 22 to 36 for parity 1 and 33 to 49 for parity 2), the month of calving (January to December), the year of calving (from 2017 to 2024). The relationship matrix was calculated using the available genealogical information. All cows included in the study were genotyped using the GGP 100K SNP chip, and the pedigrees were all previously verified by ANAFIBJ (Associazione Nazionale Allevatori della Razza Frisona, Bruna e Jersey Italiana; National Association of Breeders of the Friesian, Brown and Jersey Italian Breed). This validation step based on genomic information ensured the accuracy and consistency of the genealogical data provided for all the animals included in the study, reducing possible bias in estimating variance components due to incorrect genealogical recording. The pedigree information for each individual, included all available generations of ancestors and was employed to build the relationship matrix. The overall pedigree file included a total of 3158 animals, including animals with phenotypes and individuals non-phenotyped. The pedigree file was used to build the additive relationship matrix A implemented in the animal model.
2.6 Genome-wide association studies
To investigate the genetic basis of resilience in dairy cows, we conducted a genome-wide association study (GWAS) using a selective genotyping approach (Darvasi and Soller, 1992), an efficient strategy that involves genotyping only individuals with extreme phenotypes to enhance the detection of SNPs associated with the trait (Darvasi and Soller, 1992). This methodology is particularly efficient in detecting QTL, as a considerable amount of genetic information resides in individuals with extreme phenotypes (Xing and Xing, 2009; Lipkin et al., 2016).
Cows were selected based on the 10% most extreme values (highest and lowest) for each indicator: the most resilient (RE) and least resilient (NRE) cows. Since each indicator captures different aspects of lactation curve perturbations, animals ranked in the top or bottom 10% for one indicator are not necessarily the same as those in another (Medugorac and Soller, 2001). All genotypes (mapped according to the ARS-UCD1.2 bovine genome assembly) were already available for both selected RE and NRE cows. To simulate the selective DNA pooling strategy (Darvasi and Soller, 1994) using individual genotype data, each RE and NRE group was randomly divided into two biological replicates (RE1/RE2 and NRE1/NRE2) with comparable sample sizes. For each replicate, allele frequencies at each SNP marker were calculated using the ‘genotype statistics by marker’ function of Golden Helix’s SNP & Variation Suite (SVS v8.9, Golden Helix Inc., Bozeman, MT, USA). The GWAS was conducted only for resilience indicators with heritability greater than 0.05, both in our dataset and consistently reported in the literature (Poppe et al., 2020; Chen et al., 2023). This dual criterion ensured a focus on traits with a strong biological and genetic basis, making them more reliable for downstream genomic analysis. The analysis was further restricted to the first and second lactations, which included the largest number of animals (627 and 320 cows, respectively), to ensure robust estimation of both phenotypic indicators and genetic parameters.
The GWAS analyses were conducted by comparing the allele frequency of each SNP (for one of the possible alleles) between resilient (RE1 and RE2) and non-resilient (NRE1 and NRE2) cows using an in-house R script (R version 4.0.5). Monomorphic markers, which do not provide useful information, were excluded from the analysis. Additionally, SNPs showing a high degree of variability between replicates (i.e., the top 5% of the absolute value of allele differences between RE1 vs RE2 and NRE1 vs NRE2) were also removed to reduce potential false positives calls.
After the filtering process, the following numbers of SNPs were retained, out of the original 89,764 autosomal markers, for the analysis: i) LnVar1: 63,862 SNPs; ii) LnVar2: 60,513 SNPs; iii) rauto1: 69,347 SNPs; iv) rauto2: 65,066 SNPs; v) dPert2: 67,124 SNPs.
This filtered dataset ensures high-quality genetic markers are available for robust downstream analyses.
According to (Darvasi and Soller, 1994) a single-marker association test was applied, calculating a Z-test for each marker to assess the association between the A allele frequency difference and resilience status. The Z-test was defined as follows:
where Dtest is the difference in the A allele frequencies between the resilient and non-resilient groups, and Dnull is the difference within groups (i.e., between the two biological replicates within RE or NRE groups).
The association results were visualized using a Manhattan plot, generated with the qqman R package (Turner, 2018). After the analysis, the False Discovery Rate (FDR) and Bonferroni correction thresholds were used for determining the statistically significant SNPs.
2.7 Gene annotation
All SNPs over the 5% FDR threshold were annotated, and the SNP’s rsID code (Reference SNP cluster ID) of each of the Illumina SNP markers has been obtained. The Variant Effect Predictor (VEP) tool of the Ensembl database allowed to annotate the significant SNPs through the rsID codes according to the Bos taurus genome assembly ARS-UCD1.2 (Annotation Release: 106). Candidate genes were identified as: i) if a significant SNP was annotated within a gene, this latter was considered as a candidate gene; ii) for intergenic SNPs, the candidate gene was the one mapping closest, either upstream or downstream, within a maximum distance of 500 kb.
QTL associated with each indicator were identified using the QTLdb’s ‘Search by associated gene’ option available within the Cattle Quantitative Trait Locus (QTL) Database of Animal QTLdb (https://www.animalgenome.org/cgi-bin/QTLdb/BT/index).
3 Results and discussion
3.1 Modeling lactation curves
The modeling of lactation curves using polynomial quantile regression allowed for the estimation of the expected daily milk production. This approach, as detailed in Poppe et al (Poppe et al., 2020), captures the variability in milk production across different days in milk (DIM) and provides a robust basis for calculating deviations from expected milk yield and consequently the resilience indicators. The graphs in Figure 1 illustrate the lactation performance of two cows: one classified as more resilient (Figure 1a) and the other as less resilient (Figure 1b).
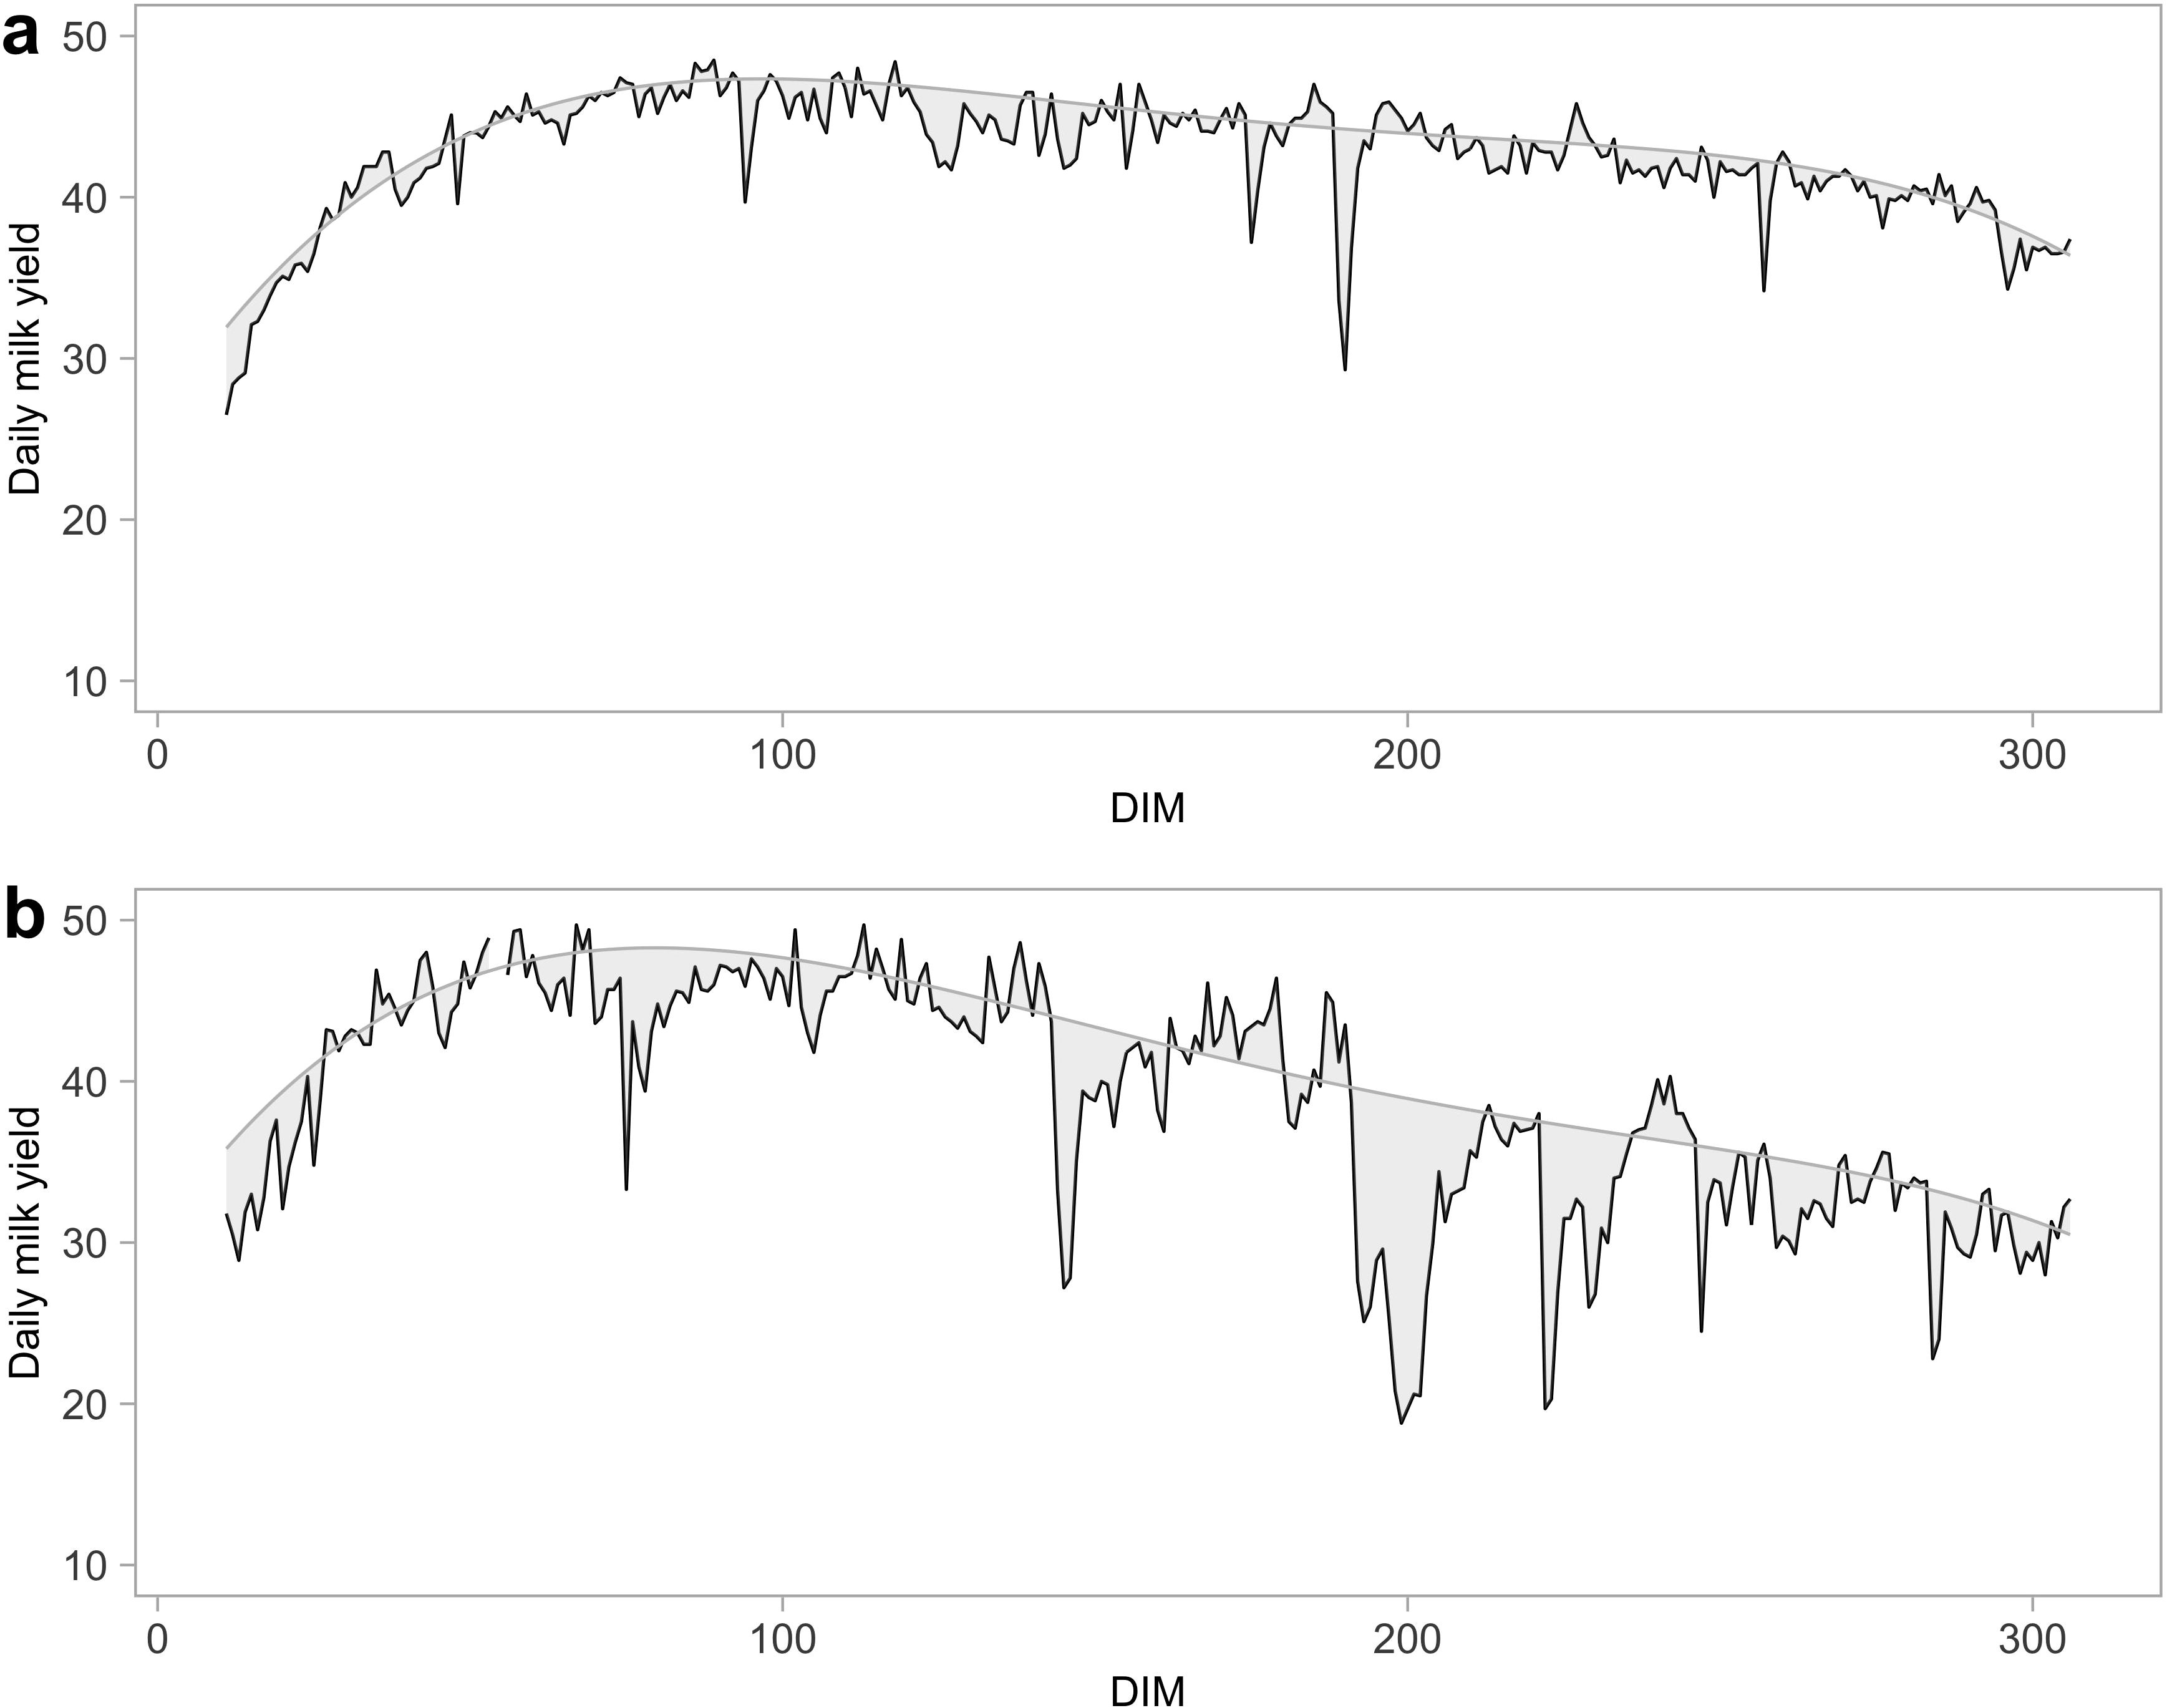
Figure 1. In this figure two lactation curves are reported as examples of how resilience is captured and how two different cows are considered resilient (a) and non-resilient (b). The represented lactations belong to cows in their first order of parity.
The first visible difference between the curves is the fluctuations of the daily milk yield. In Figure 1a, with LnVar value 1.06, the cow shows a relatively stable milk production over time: the milk yield remains consistent, with minor day-to-day variability, assuming the cow’s strong ability to cope with stressors. In contrast, the cow in Figure 1b has a value of LnVar equal to 2.98 and reveals more significant fluctuations in daily milk yield and a sharper decline in production. The pattern of milk yield by DIM respect to the expected lactation curve suggests that the resilient cow is more capable to maintain high levels of productivity along the lactation. The less resilient cow, on the other hand, exhibits greater variability in daily milk production, which is hypothesized to reflect a reduced capacity to recover from stressors. Periods of stress are marked by sharp declines in production, followed by slower recoveries, which can be interpreted as a diminished ability to maintain production efficiency over time.
3.2 Descriptive statistics of the derived resilience indicators
Table 2 shows the descriptive statistics for the calculated resilience indicators across different lactations. When compared to recent studies, LnVar across parity orders are similar to the results of (Chen et al., 2023) (average from 1.39 to 1.83 and SD from 0.57 and 0.62), while they are different when compared to (Poppe et al., 2021a) (average from 4.40 to 4.99 and SD from 0.66 and 0.79). The observed increase in LnVar through the parity orders is consistent with findings from the mentioned studies, showing that milk yield variability tends to rise proportionally with aging. Possibly, this is due to physiological changes that occur with aging, such as changes in mammary gland function or in metabolic regulation. Additionally, it is possible that prolonged exposure to environmental stressors, including variation in management or in environmental conditions over time, may contribute to the increase of the variability (Friggens and Badsberg, 2007; Wathes et al., 2007).
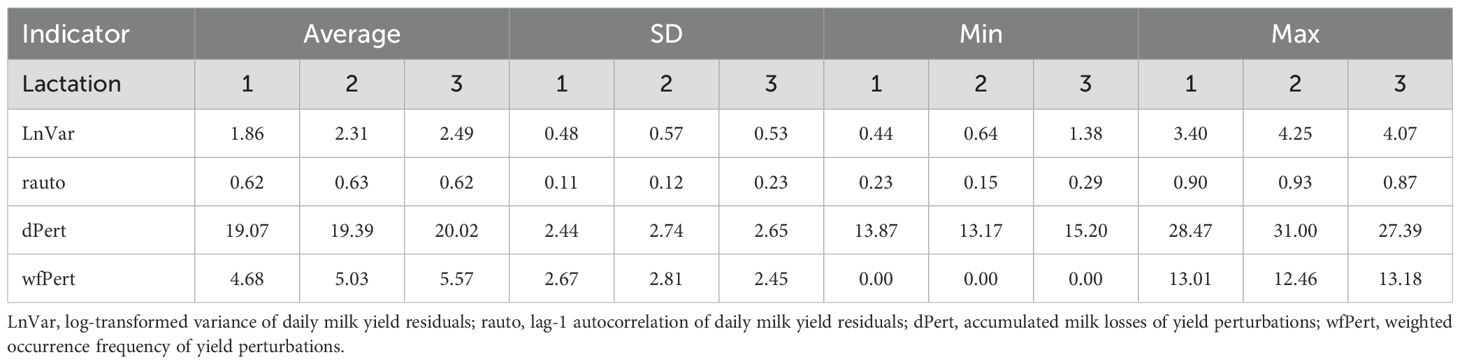
Table 2. Descriptive statistics of the resilience indicators.
The rauto values indicate a consistent pattern of autocorrelation through parities. In our study, the mean rauto values were 0.62, 0.63, and 0.62 for the first, second, and third parity, respectively. In comparison, Chen et al (Chen et al., 2023). reported mean rauto values of 0.37, 0.43, and 0.44 for these parities, while Poppe et al (Poppe et al., 2021a). observed values of 0.55, 0.56, and 0.55. This stability suggests that the persistence in milk production patterns stays relatively constant over different parity orders. This somehow contrasts with the increasing variability observed in LnVar, highlighting that while overall variability in milk yield increases with parity, the persistence of production patterns (as measured by autocorrelation) may remain stable. This difference underscores the complexity of lactation dynamics, where variability and persistence can be influenced by different factors and may not always align.
The upward trend in dPert across lactations suggests that milk production losses due to perturbations accumulate more significantly as cows’ parity increases. In our study, the average dPert ranged from 19.1 to 20.2, with a standard deviation (SD) ranging from 2.44 to 2.74 across lactations. These values are higher than those reported by Chen et al (Chen et al., 2023), who found averages between 15.62 and 17.43 for the same parities. This discrepancy may be explained by the generally higher milk production in multiparous cows, where any deviation from expected yield results in proportionally greater losses. Consequently, higher yields in older cows are likely to contribute to more substantial accumulated milk losses during perturbation periods. The wfPert values show a relatively consistent frequency of perturbations across parties, with only slight variations seen in the third one. In our study, there were 24 cows in the first lactation without any perturbations (3.8%), 10 in the second lactation (2.8%), and 4 in the third lactation (2.9%).
The wfPert showed an average of 4.68 ± 2.67 s.d. in the first lactation, compared to 5.03 ± 2.81 in the second lactation and 5.57 ± 2.45 in the third lactation. Although the average for the third lactation is a bit higher compared to the first and second lactations, the differences are not large. In Chen et al (Chen et al., 2023). the results are slightly bigger: from the first to the third parity order, averages and standard deviations are 5.43 ± 1.75, 5.85 ± 1.91 and 6.11 ± 1.94, respectively.
The correlation analysis of resilience indicators within lactation and across lactations provides valuable insights into the relationships between the various measures of milk production stability and perturbations. The results of the correlation matrix are visualized in Figure 2.
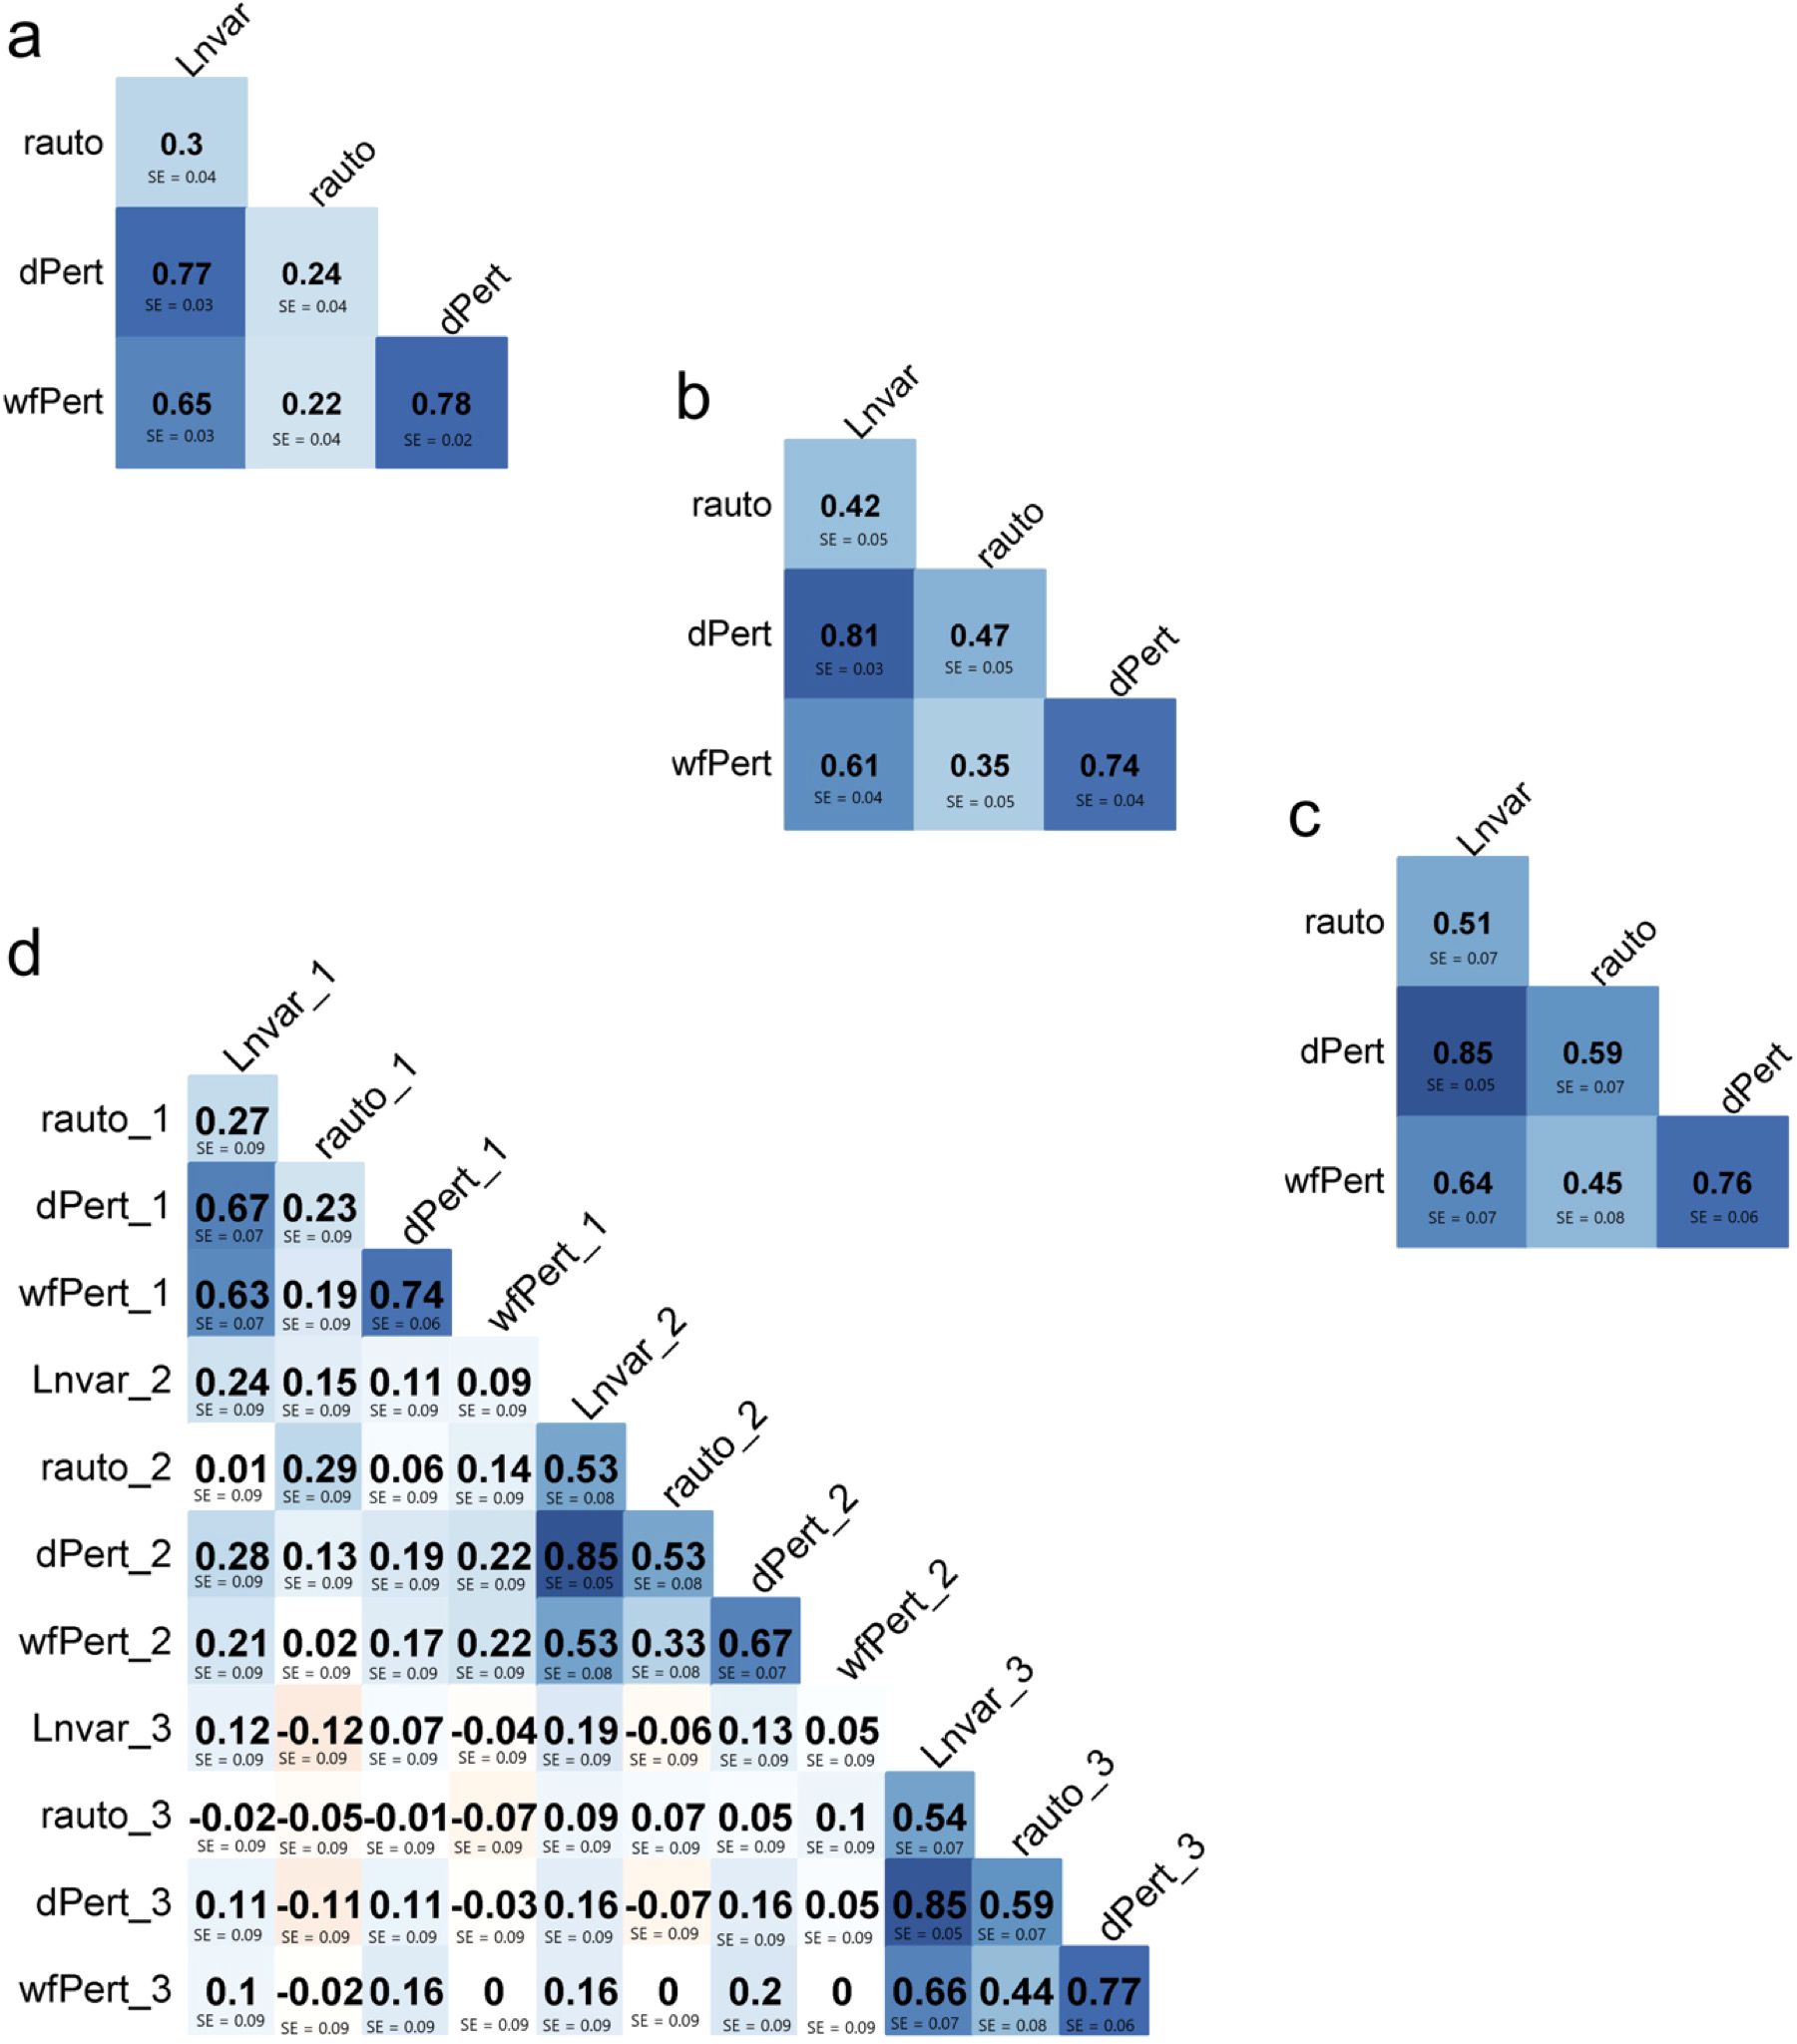
Figure 2. Correlation between resilience indicators within lactation one, two and three [respectively, (a–c)] and across lactation (d).
In the first lactation (Figure 2a), the pairwise correlations between the indicators are all positive and range from moderate to high, varying from 0.22 (between rauto and wfPert) to 0.78 (between wfPert and dPert). This pattern is expected, as all indicators are derived from the same residuals obtained through the quantile regression model and are specifically designed to capture different aspects of resilience. The strongest correlation, observed between dPert and wfPert, reflects the similarity in their definitions—both quantify production losses due to perturbations, albeit from different perspectives.
Moreover, it makes biological sense that a cow with more frequent production losses exhibits a greater total loss. Strong correlations are also observed between LnVar – dPert and LnVar – wfPert. This suggests that cows with higher variability in milk production (LnVar) also experience more frequent and severe production losses. In contrast, the lowest correlations involved rauto, which measures the persistence of deviations. Interestingly, in lactations 2 and 3 (Figures 2b, c), the correlations between rauto and the other indicators became stronger, while the remaining pairwise correlations remained relatively stable. As shown in Figures 2a–c, correlations within lactations tended to strengthen across parities. However, this pattern is not evident in Figure 2d, where correlations between indicators across lactations are generally low and tend to weaken. As cows age, they do not exhibit consistent resilience patterns across parities, suggesting that their responses to perturbations evolve over time. Furthermore, Figure 2d confirms that strong correlations between indicators are primarily observed within the same lactation. Calculating these resilience indicators within a single farm has the potential to help farmers better understand the productive life of cows at the end of their lactation. The indicators can also be used to measure the ongoing production and behavior of cows, so that attention can be paid to those animals that show different behavioral patterns. Productive animals are known to be less resilient, depending on how we measure the resilience indicators. Since some resilience indicators are constructed such that higher values reflect greater instability or poorer recovery, they are often positively genetically correlated with milk yield. In this context, higher values of these indicators correspond to lower resilience and higher milk production (Poppe et al., 2021b). This is an explicit trade-off between resilience and production. However, accurate measures of cow life events that may be available to help calculate fertility and reproductive traits, together with treatment records kept by farmers, could help to assess a better definition of resilience. In addition, AMS can provide more than just daily milk yield, but longitudinal traits such as feeding behavior and milk contents, which can be used to improve understanding of the physiological responses of lactating cows throughout their lactation. This was not the aim of this study.
3.3 Variance components and heritability
The results of the heritability calculations for the traits are shown in Table 3 and briefly discussed below. However, an important premise must be made before the discussion. As the heritability estimates shown here were obtained in only one herd, they may not fully capture the existing population additive genetic variability, even if the sires used in this farm are selected by the owner himself from all available bulls on the market, i.e. from different AI companies, countries and genetic programs, and as such they are a representative sample of the population. Furthermore, since our goal was not to estimate heritability per se or to introduce it into breeding programs, heritability values were retained for comments and to select the resilience indicator to be the subject of the GWAS, also based on the fact that they confirmed already published values, as hereinbelow commented.
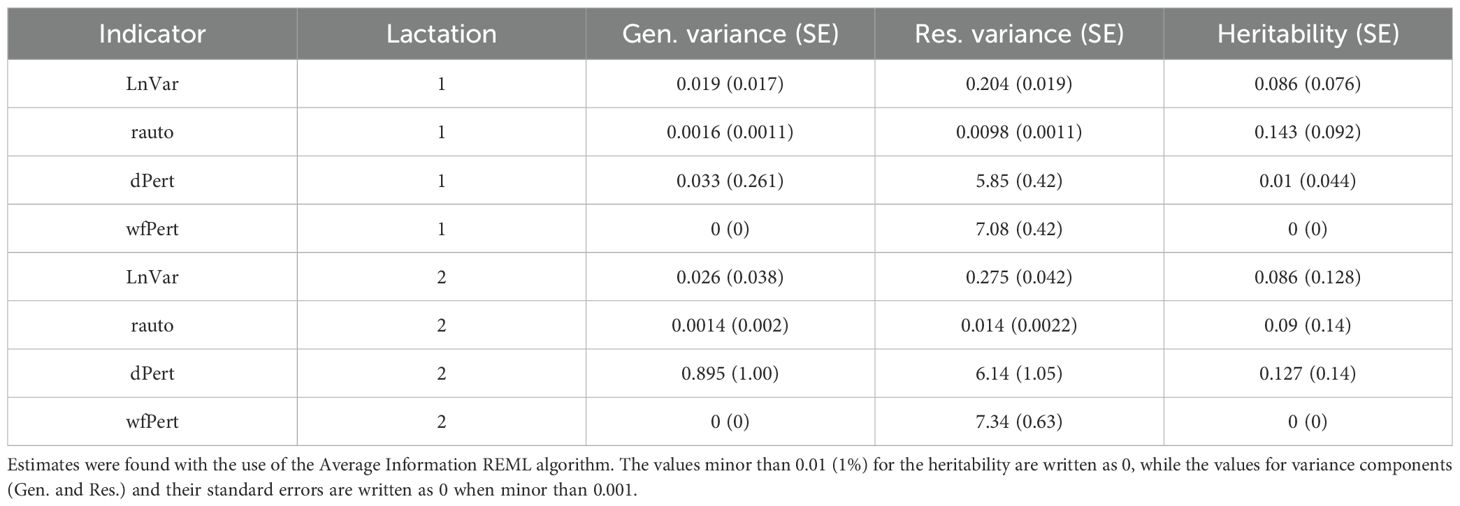
Table 3. Genetic (Gen.) and residual (Res.) variance components and heritability (h2) for each indicator within lactations 1 and 2.
The heritabilities of LnVar in the first and second lactation are both 0.086, which is considerably lower than previous results where 0.13 and 0.15 were estimated for the first lactation and 0.18 and 0.20 for the second lactation (Poppe et al., 2021a; Chen et al., 2023). As shown here and in a previous study, heritability exhibits small variations across parities but does not follow a specific trend, suggesting that the heritability of LnVar may be considered stable throughout a cow’s life (Poppe et al., 2021b). For rauto, the estimated values are 0.14 and 0.09 for lactations 1 and 2. These results are slightly higher than those reported previously, ranging from 0.08 for the first lactation to 0.07 for the second one (Poppe et al., 2021a). Our results are also higher than those in another study, where estimates range from 0.04 for the first lactation to 0.02 for the second lactation (Chen et al., 2023). Only one study has estimated the heritability of the resilience indicators dPert and wfPert (Chen et al., 2023). The results we obtained are compared by placing in curly brackets the corresponding values from that study. The heritability of dPert ranges from 0.01 (0.03) in the first lactation to 0.13 (0.06) in the second lactation. Regarding wfPert, the estimated heritabilities obtained here were zero, while another study reported values of 0.04 and 0.02 for the first and second lactation, respectively (Chen et al., 2023).
3.4 Genome wide association study
As hereinbefore described, GWAS were performed using the selective genotyping approach coupled to the statistics of DNA pooling to investigate the genetic basis of resilience in the population only for those indicators that have shown heritability. The descriptive statistics shown in Supplementary Table S1 refer to the full RE and NRE groups prior to replicate creation.
For the animals selected for the GWAS (top 10% most resilient - RES and bottom 10% least resilient - NRES) the average gEBVs for milk yield and SCC of the cows were plotted in Supplementary Figure S1. The figure includes only the resilience indicators selected for GWAS analysis (i.e., LnVar, rauto, and dPert). Interestingly, the analysis revealed that RES animals consistently exhibited lower gEBV values for milk yield and higher value for SCC across the three resilience indicators (Supplementary Figure S1). This trend was particularly evident for LnVar-based indicators. The results here obtained are in agreement with the findings of (Chen et al., 2024) that showed an unfavorable causal association between daily milk yield (DMY) and LnVar. Results of each GWAS are graphically shown in the Manhattan plots of Figures 3A–E and reported in Table 4.
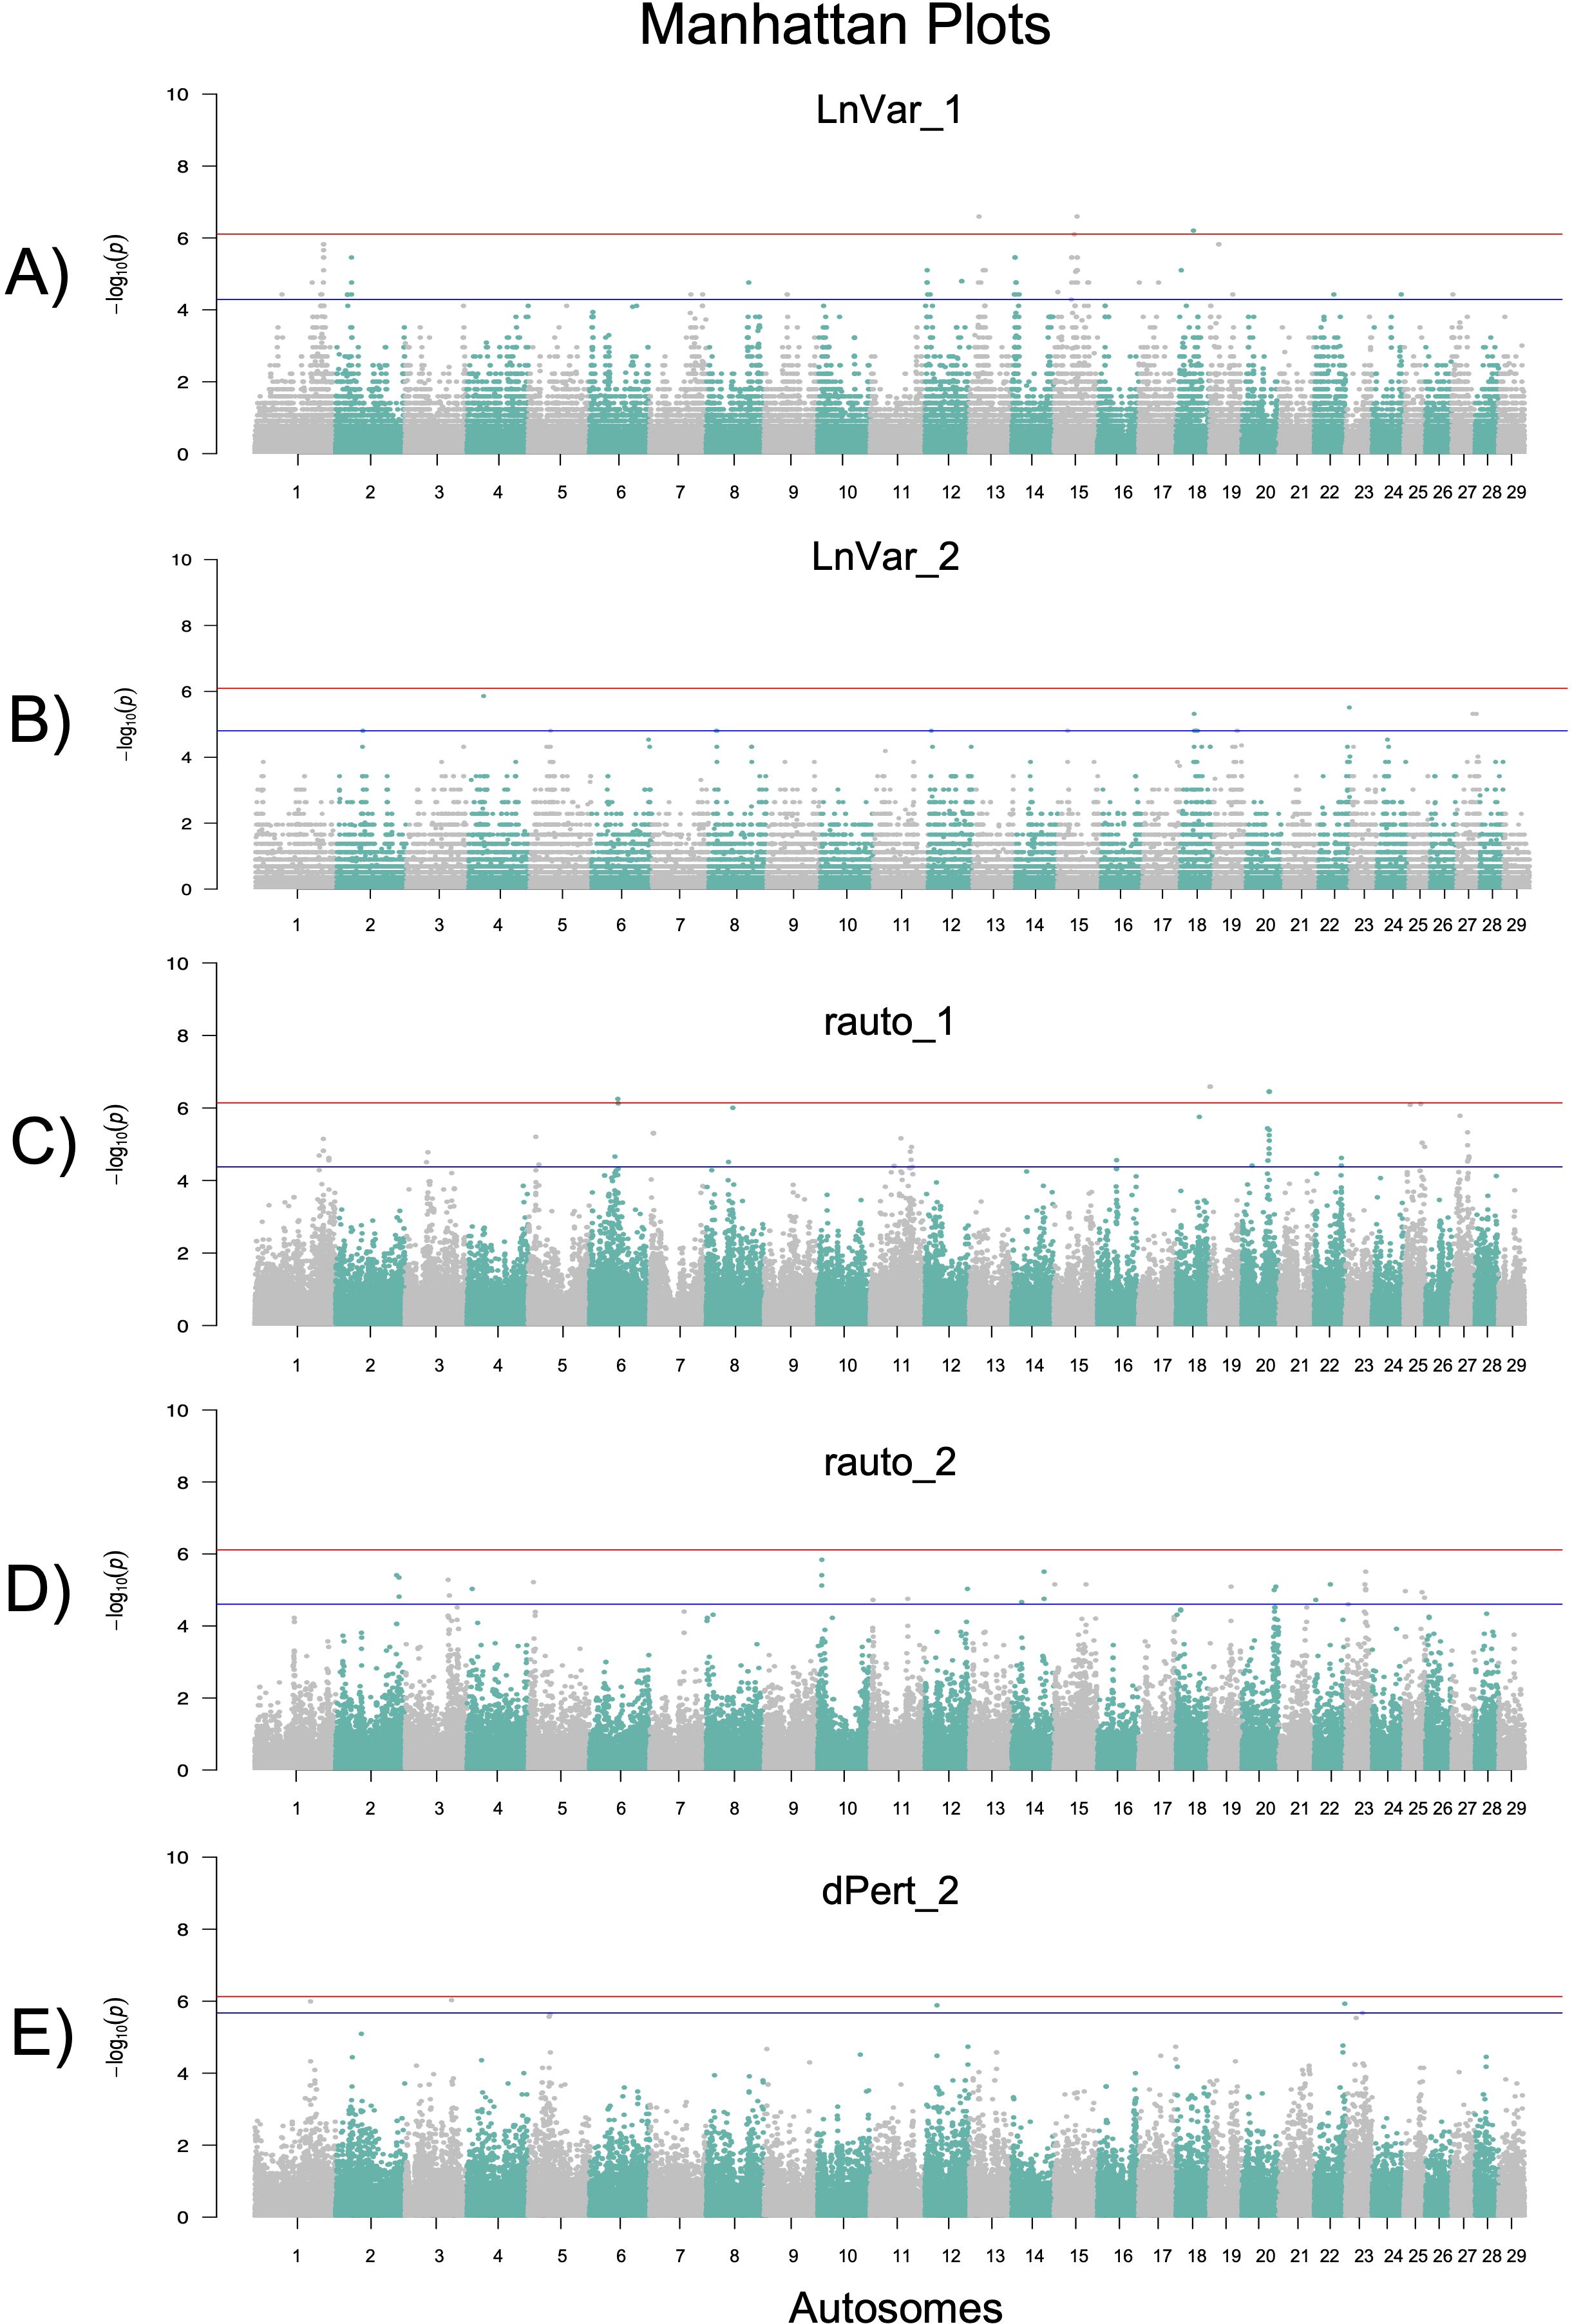
Figure 3. Manhattan plots of the GWAS results for the resilience indicators showing hereditability: LnVar – first (A) and second Lactation (B); rauto – first (C) and second Lactation (D); dPert – second Lactation. The lines represent the False Discovery Rate (blue) and Bonferroni (red) thresholds, respectively, set at 5% genome-wide.
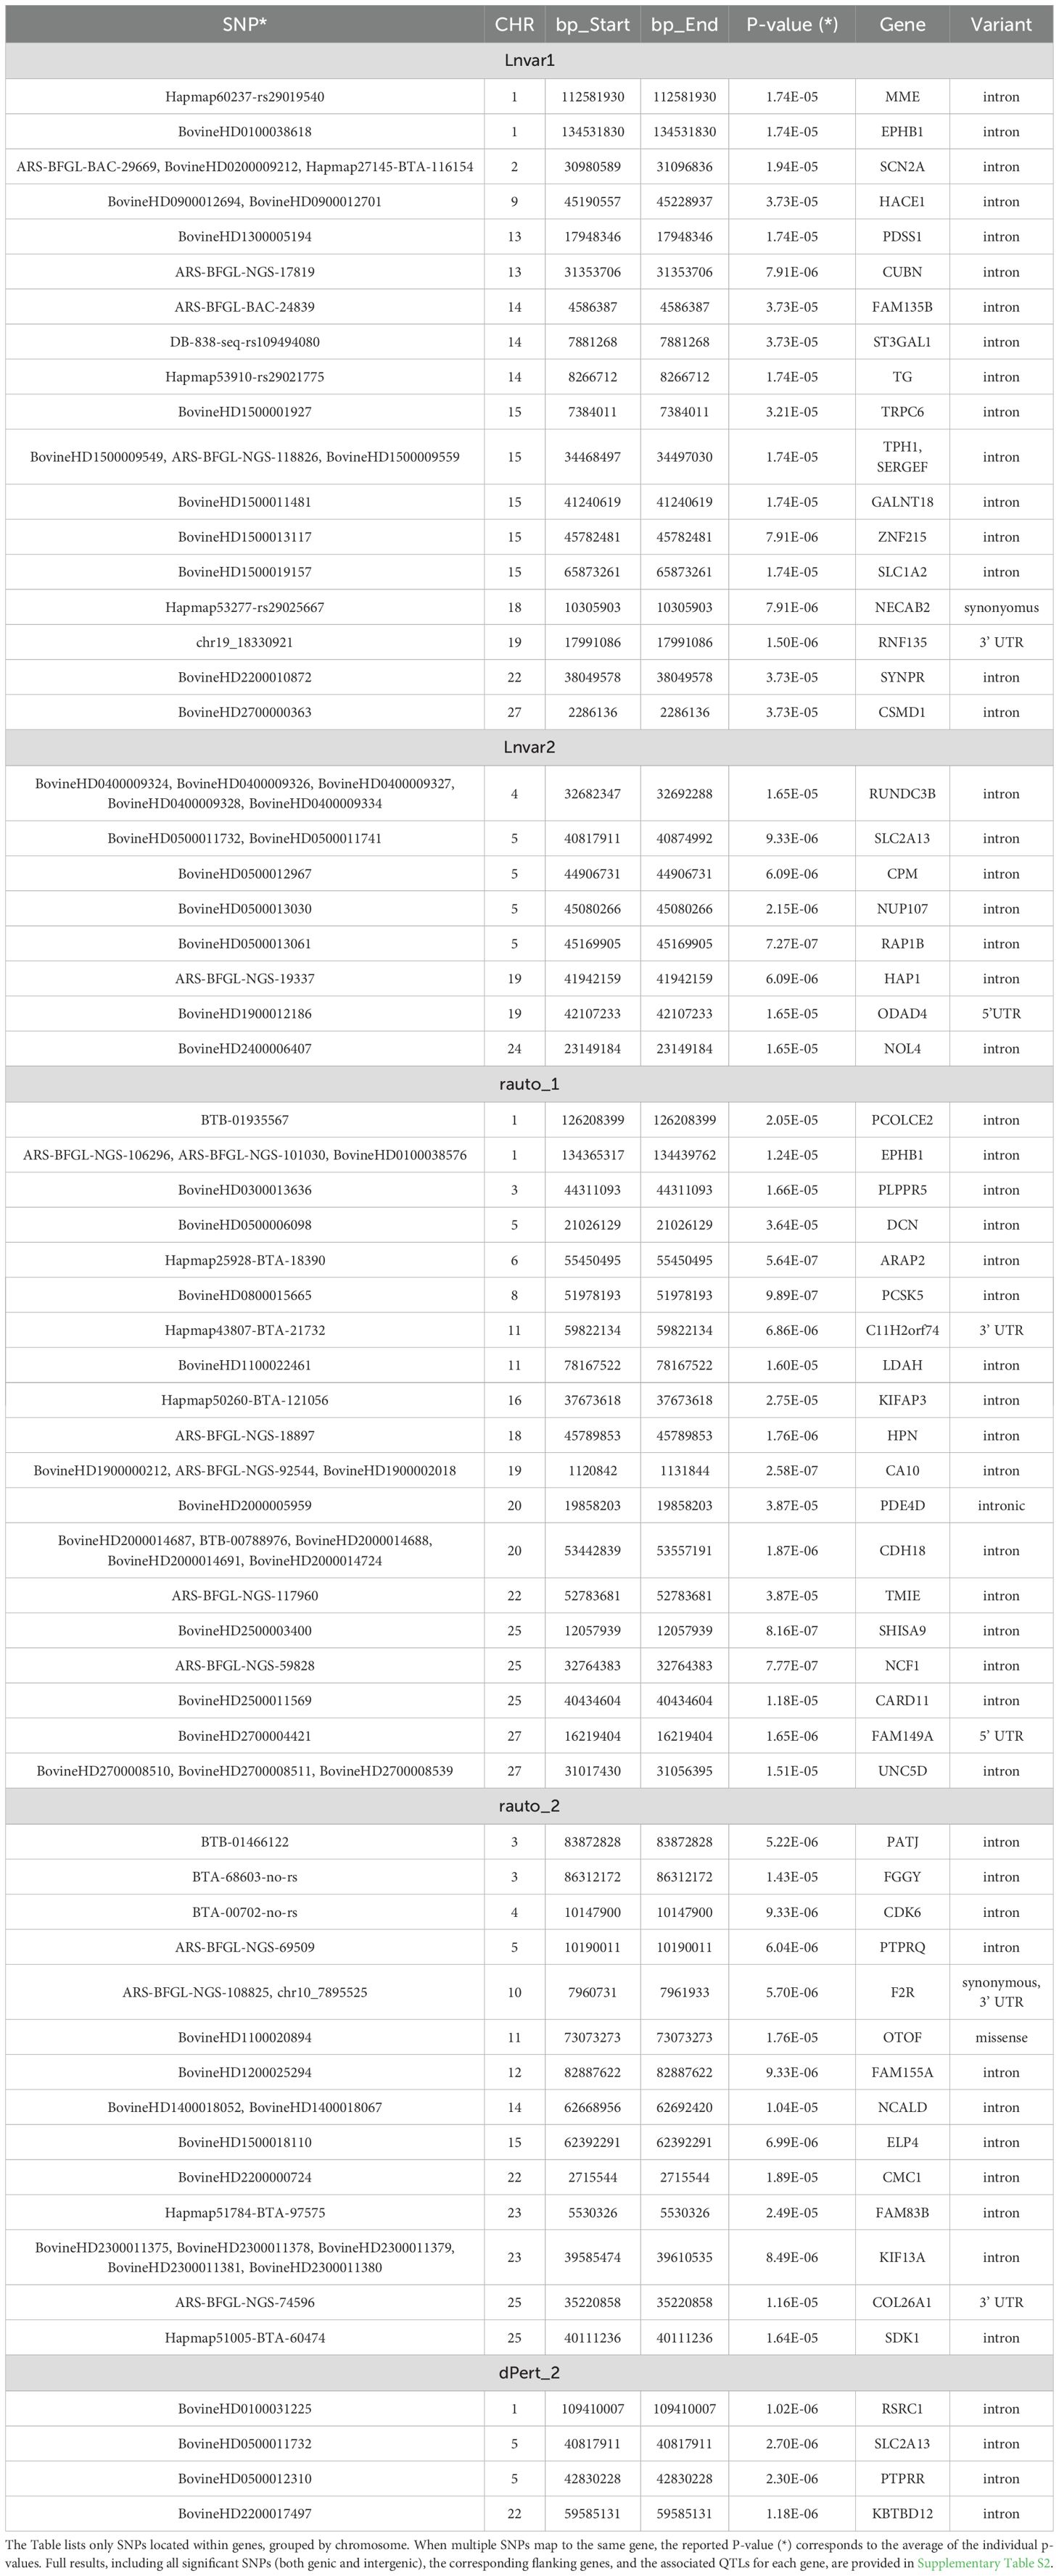
Table 4. Results of the GWAS analysis.
A total of 66, 22, 60, 33, and 8 significant SNPs were identified above the 5% FDR threshold (blue line) for LnVar1, LnVar2, rauto1, rauto2, and dPert2, respectively (Supplementary Table S2). These SNPs were located in intronic (n = 79), intergenic (n = 99), 5’UTR (n = 2), 3’UTR (n = 4), and intragenic regions (n = 2; one missense and one synonymous). Based on the location of these SNPs, a total of 124 candidate genes were identified for functional interpretation. Out of these, the Animal Genome Cattle Database linked 40 genes to six main “QTL Terms – Trait_class” categories, comprising 77 unique “QTL Trait_Name” entries (Supplementary Table S2). As shown in Supplementary Figure S2, milk-related traits were more frequently associated with LnVar1 than with LnVar2. QTL terms associated with LnVar2 were predominantly linked to milk-related traits (87.0%), whereas for LnVar1, only 30.8% were related to milk production. The remaining QTLs associated with LnVar1 were distributed among other categories, including exterior traits (26.2%), reproduction (16.9%), production traits (16.9%), meat and carcass traits (6.2%), and others. This discrepancy may reflect physiological and genetic differences in milk production dynamics between first and second parity. The genetic correlations between milk yield in the first and second lactations have been estimated at approximately rg = 0.82, indicating a strong but not perfect relationship between the two (Dong and Van Vleck, 1989). This suggests that while a common genetic component influences both lactations, specific factors unique to each parity also contributes to milk production dynamics. The potential roles of some of candidate genes in resilience are then herein below discussed by resilience indicator.
3.4.1 LnVar
For LnVar1, on BTA 1 a total of 9 significant SNPs were above the FDR threshold (Figure 3a). Among them, rs110792885 is located in intron position of the EPHB1 gene (EPH Receptor B1), one of the Eph (erythropoietin-producing hepatocellular carcinoma) receptors representing one of the largest known family of receptor tyrosine kinases in mammals: there is evidence the Eph receptors and ephrin ligands may mediate immune cell activation and the immune cell trafficking required for optimal functioning of immune system (Darling and Lamb, 2019). Given that Eph receptors are involved in various normal cellular processes during development and play a crucial role in maintaining adult tissue homeostasis, their role in both non-infectious and infectious diseases is well established. As a result, the pathways in which they operate may indirectly impact stress responses and resilience traits. The EPHB1 gene was also associated with udder traits (udder suspension and teat score) in Angus cattle (Devani et al., 2020). On BTA 2, three above FDR threshold SNP are in intron sequences of SCN2A and SCN3A genes, but none of their functions that may be related to resilience has been reported to date. The SNP rs110164494, is located in the intron of the PDSS1 gene on BTA 13. PDSS1 encodes the enzyme decaprenyl diphosphate synthase subunit 1, which is involved in the synthesis of coenzyme Q (ubiquinone), a key component of mitochondrial electron transport and cellular energy production. The association of PDSS1 with female fertility traits has been highlighted in previous studies, such as Mohammadi et al (Mohammadi et al., 2020), who identified it in a GWAS focused on Iranian Holstein cattle. This study found that PDSS1 could play a role in female fertility through pathways linked to cellular energy metabolism, which is crucial for reproductive performance and resilience during energy-intensive periods like lactation.
On BTA14 at about 6 Mbp, two intergenic markers (rs110769987 and rs42211697) were found to be significantly associated with LnVar1 and were located closely to KHDRBS3. This gene has previously been associated with milk production traits in both Chinese Holstein and crossbred populations (Jiang et al., 2010; da Cruz et al., 2020).
The ST3GAL1 gene was also found to be associated with milk traits, including milk yield, milk fat yield, and milk fat percentage (Wickramasinghe et al., 2011). Thyroglobulin gene (TG), identified as candidate gene on BTA14 (rs29021775), is a key glycoprotein involved in the synthesis of thyroid hormones. TG plays an important role in different physiological processes including regulating the metabolism, adipocyte growth, differentiation and homeostasis of fat depots (Dubey et al., 2014). Given its function TG can be easily linked to resilience. In fact, studies in rat and livestock have demonstrated that thyroid function, influenced by TG, is critical for coping with temperature extremes, supporting its role in resilience to environmental stressors (Sejian et al., 2018; Rial-Pensado et al., 2022).
At about 82 Kbp from rs41629530 on BTA 15 is located the GRAMD1B gene, part of the GRAM (glucosyltransferases, Rab-like GTPase activators and myotubularin) domain- containing gene group, involved in maintaining cholesterol homeostasis, apoptosis and cancer (Yang et al., 2011). In livestock, GRAMD1B was already associated with feed efficiency, production and reproduction traits in cattle (Kunej et al., 2024). SERGEF at positions about 34 Mbp (identified as candidate gene by rs110010916 and rs109595542) has been linked to pig adaptation to high-altitude conditions, suggesting potential resilience to environmental stressors that may indirectly influence lactation stability (Dong et al., 2014).
The significant rs110249272 maps in the 3’UTR region of the RNF135 gene (Ring Finger Protein 135) involved in the activation of the NF-κB signaling pathway, which is essential for immune responses, inflammation regulation, and cell survival (Kiser et al., 2018). In cattle, activation of this pathway helps increase resilience to infections like Mycobacterium avium paratuberculosis (Map), the pathogen causing Johne’s disease. The activation of NF-κB by these proteins boosts the cattle’s resilience by ensuring the survival of immune cells, especially monocytes, which are key to fighting infection. This ability to withstand and adapt to immune challenges contributes to overall health and disease resistance (Calderón-Chagoya et al., 2023).
For LnVar2, the major part of candidate genes seems to be involved both in functional and productive traits (as reported in Supplementary Table S3, QTL). In addition, on BTA 4, all the significant SNPs mapped in the intronic position of RUNDC3B gene, that is considered a backfat gene (Yang et al., 2011). As of now, the RUNDC3B gene has not been directly associated with backfat thickness in Holstein cattle. However, it is well known, that backfat genes have role in body composition, energy reserves, and overall productivity (Schmidtmann et al., 2024). We may speculate that genes influencing fat deposition (backfat genes) might relate to resilience indirectly, as fat reserves can buffer energy deficits during stress, thereby supporting resilience. The gene Rap1b, identified as a candidate by the SNP rs133340933, belongs to the Ras superfamily, a group of proteins involved in regulating B-cell development, homing, and T-cell-dependent humoral immunity (Chu et al., 2008). It is well known, that adaptive immune response, characterized by its specificity and memory, plays a critical role in maintaining long-term resilience against pathogens (Alotiby, 2024). Two significant SNPs were annotated in intronic positions of SLC2A13, one of the glucoses transporters, resulted associated with milk, protein and fat yields in Buffaloes species (Du et al., 2019). Even the gene NOL4 seem to be involved in milk traits according with was reported in different cattle breeds (Bekele et al., 2023).
3.4.2 rauto
Regarding rauto1, the QTL region at about 134 Mbp and defined by three significant SNPs (in intronic position of the EPHB1 gene) overlaps the one identified for LnVa1. Based on its functions (as described in the LnVar1 GWAS results), we hypothesize that for rauto (reflecting stability and recovery after perturbation) EPHB1 could regulate pathways that maintain homeostasis under stress by guaranteeing robust intercellular signaling. Instead, for LnVar1 (which measures variability, where lower variability suggests more robust responses to environmental or physiological stress) EPHB1 might reduce variability by ensuring consistent signaling pathways, supporting immune responses across diverse environmental challenges, and thereby contributing to more consistent physiological outcomes.
On BTA 1, a second significant region is defined by three SNPs, all mapping close to the POFUT2 gene (max distance 59 Kbp). This gene has been associated both with female fertility in Nordic dairy cattle (Mesbah-Uddin et al., 2022) and with body conformation traits in Holstein (Wang et al., 2022b).
On BTA 3, the genetic variant rs133042560 is located in the intronic position of DCN gene, that encodes for decorin, a small leucine-rich proteoglycan involved in connective tissue structure. Decorin binds collagen fibrils and regulates collagen assembly, influencing fibril uniformity (Khatib, 2005). This function is essential for tissue integrity and may impact resilience, particularly in response to metabolic and physical changes during early lactation. DCN is maternally expressed in placental tissue in mice, highlighting its potential role in tissue development and adaptation, which could be relevant for bovine resilience during the first lactation (Mizuno et al., 2002).
On BTA 11, two significant SNPs are located near the IL1B gene. The IL1B gene, as a member of the interleukin-1 (IL-1) family, plays a crucial role in inflammation and immune responses (Moghaddam et al., 2019). Its expression is upregulated in milk somatic cells as part of the immune response during udder infections (Lee et al., 2006). Additionally, increased expression of IL1B has been reported in response to infectious agents, such as Mycoplasma bovis and Klebsiella pneumoniae (Bannerman et al., 2004; Kauf et al., 2007). The IL1B gene is also associated with bovine respiratory disease susceptibility (Tizioto et al., 2015), a key trait impacting animal health and productivity (Neupane et al., 2018).
The rs135712530 is an intronic variant of the LDAH gene. LDAH has been associated with hoof and leg disorders (Wu et al., 2016), suggesting a potential role in health traits. Hoof and leg issues are critical in livestock, affecting both productivity and welfare, indicating the relevance of this locus for improving resilience and health in cattle. It may influence rauto1 by modulating the stability of physiological responses under stress.
On BTA 20, the SNP rs109908751, located in the intergenic region near the PDE4D may be associated with resilience. The expression of PDE4D has been detected in mammary glands, indicating its potential involvement in milk production. In fact, previous studies have suggested a possible role of PDE4 in the regulation of mammary gland function and lactation (Dostaler-Touchette et al., 2009). This function may be related with rauto1, as PDE4D could influence the consistency and stability of physiological responses during early lactation. In fact, the PDE4D gene is part of the PDE4 family, involved in regulating cAMP signaling pathways, which are critical for cell desensitization, signal compartmentalization, and cross-talk between cellular signals. By maintaining cAMP homeostasis, PDE4D plays a key role in regulating various physiological processes (Dostaler-Touchette et al., 2009). The regulation of cAMP signaling by PDE4D could also contribute to the stability of immune responses and metabolic adaptations, both critical for resilience in dairy cattle during the early lactation period.
Another SNP, rs42070678, is located in an intronic region of NCF1 on BTA 25. This gene encodes a cytosolic subunit of neutrophil NADPH oxidase, which plays a critical role in the production of reactive oxygen species (ROS). ROS are key mediators in host defense and the regulation of inflammation (Kennedy and DeLeo, 2009). Although this gene has not been directly associated with a known QTL, the role of NCF1 in modulating ROS production suggests it may be involved in the immune responses and inflammatory control, both of which are crucial for maintaining resilience during the early lactation period. Also, the CARD11 gene in which rs109938921 maps, is involved in immune signaling, being crucial in the activation of T-cells and the differentiation of peripheral B-cells (Stepensky et al., 2013). In dairy cattle, CARD11 has been linked to feed efficiency (FE), with studies showing its involvement in residual feed intake (RFI) in Danish Holstein cattle. CARD11 was downregulated in animals with high RFI compared to those with low RFI, suggesting its role in regulating energy balance and metabolic efficiency (Salleh et al., 2017). CARD11 may then influence resilience to metabolic and immune stress during early lactation.
On BTA 20, a genomic region at approximately 53.4 Kbp is defined by 9 significant SNPs, including 5 intronic variants and 4 intergenic ones (Table 3). This region harbors the CDH18 gene, which belongs to the canonical cadherin (CDH) gene family. The cadherin family is composed of a series of cell adhesion molecules that play a dominant role in tissue morphogenesis and regulate adhesion interactions. Some studies have shown that the CDH18 gene locus resulted strongly associated with milk and fat yields in dairy cattle (Laodim et al., 2017).
Finally, three significant SNPs (rs133164649, rs42130478, and rs109905892) are all located in the intron position of the UNC5D (BTA 27). UNC5D is implicated in the development and maintenance of udder structure and conformation (Cole et al., 2011), which are crucial for efficient milk production and the animal’s ability to cope with physiological stress during lactation. Rauto1 may reflect how well an animal’s udder structure and other related traits maintain stability during early lactation.
The genes associated with rauto2 are involved in various traits, as described by the examples reported below. On BTA 3, two significant SNPs were located in the intronic regions of the PATJ and FGGY genes. These genes have been reported to be associated with fertility and reproduction traits, as well as body structure and finishing precocity, respectively. CDK6 gene can be considered a candidate gene involved in body traits (Liu et al., 2011; Silva et al., 2019). PTPRQ on BTA 5, as identified by (Robakowska-Hyżorek et al., 2016), may influence meat production traits in beef cattle, possibly through the regulation of MRF (myogenic regulatory factors) gene expression. Two closed SNPs on BTA 10 lie in the coding sequence (synonymous and 3’UTR) of the F2R gene, proposed as novel and promising candidates for regulation of hypoxic adaptation in the heart by Wang et al (Wang et al., 2021), a study that compared the hypoxic adaptation of the yak (Bos grunniens) against different cattle species.
On BTA 14, rs110970186 and rs43430961 are annotated in intronic position of the NCALD (Neurocalcin Delta) gene that was associated with the Bovine Respiratory Disease (Kiser et al., 2017). On BTA 25, rs42073064, located in the 3’UTR region of COL26A1, which encodes collagen type XXVI, was identified as one of the differentially expressed genes potentially involved in host resistance against ticks (Mantilla Valdivieso et al., 2022). KRT14, located 193 bp from the rs43727762 SNP, plays a role in mammary epithelial cell lineage changes, which are essential for the proper development of the mammary epithelium during the cow’s life and, consequently, for milk production (Finot et al., 2019). The same authors described also the role of KRT14 (together with other cell line) in the development of the bovine mammary gland at puberty (Finot et al., 2018).
Finally, we found five significant SNPs mapping in the intronic position of KIF13A. This gene belongs to the kinesin superfamily, a large group of motor proteins involved in intracellular transport and recycling endosome dynamics. These functions are crucial for maintaining cellular homeostasis and responding to environmental stressors, particularly when KIF13A interacts with other proteins such as Rab GTPases (Thankachan and Setty, 2022). The interaction between these two classes of proteins could be a key mechanism in stress adaptation and recovery. Therefore, we may speculate that this represents an indirect link with rauto, which measures autoregulation—the ability of a system to autonomously regulate itself without external intervention.
3.4.3 dPert
Eight above FDR threshold SNPs sparse along the chromosomes were associate with dPert2. One of these SNPs was already associated with LnVar2 (rs133894374 annotated in intronic position of SLC2A13). As reported here and by Chen et al (Chen et al., 2023), LnVar2 and dPert2 were highly correlated (0.85, Figure 2d). This strong association is expected, as both metrics reflect an animal’s ability to maintain stable performance despite challenges.
The PTPRR gene harbors the intronic rs43440584. The protein encoded by PTPRR is a member of the protein tyrosine phosphatase (PTP) family and appears to be involved in mammary gland involution, possibly contributing to the remodeling of udder tissue for subsequent parturitions. Researchers reported that weaning (in mice) increased PTP activity in the mammary gland (Tolleson et al., 2017). PTPRR gene has also been associated with various mammary traits in different cattle breeds (Tolleson et al., 2017; Sinha et al., 2023).
The rs43219764 and rs132905517 are intronic SNPs of RSRC1 and KBTBD12 genes, that were associated with reproduction traits and with milking temperament in Holstein cattle, respectively (Chen et al., 2020; Grigoletto et al., 2020). Opposite genetic correlation between immune response traits (the most ones related to resilience) and fertility traits are reported by Konig and May (König and May, 2019). In their review, the gestation length resulted positively and negatively correlated with antibody- and cell-mediated immune response, respectively (+0.17; -0.17). The same opposite correlation values were found also for other fertility traits including calving ease, maternal calving ease, and daughter fertility (König and May, 2019). The potential link between milk temperament and resilience in milk production suggests that also behavioral traits might indirectly influence the physiological stability of lactating cows. However, some evidences are contrasting: i) Stepancheva et al., 2024, investigating how milking temperament affects milk productivity, found that Buffalos with higher milking behavior scores (4 or 5, more reactive cows) had the quite higher LS means for TDMY; ii) Marçal-Pedroza et al., 2023 reported that calm and intermediate cows produced more milk and a shorter milking time and a greater average milk flow; iii) Antanaitis et al., 2021, observed a negative genetic correlation between the temperament of cows and milk yield; instead, temperament was positively correlated with SCS.
4 Conclusions
This study offers a high-resolution analysis of resilience indicators in Holstein cows, leveraging daily milk yield data from automatic milking systems collected under standardized management and environmental conditions. The four indicators assessed (LnVar, rauto, dPert, and wfPert) captured different resilience dimensions. LnVar showed the most robust biological and genetic signals, particularly in the second parity. Rauto showed moderate heritability and improved biological coherence with age, while dPert and wfPert, despite lower heritabilities, provided valuable insights into the dynamics of short-term production perturbations.
Genome-wide association studies identified a complex genetic basis for resilience, involving immune function, metabolic regulation, and tissue integrity. Candidate genes such as EPHB1, IL1B, PDSS1, GRAMD1B, and DCN were associated with processes including inflammation, energy homeostasis, and extracellular matrix remodeling. The EPHB1 and SLC2A13 genes were linked to multiple indicators or parities, suggesting shared regulatory mechanisms, while others appeared only in later parities, pointing to age-related physiological adaptations. Several genes have also been previously associated with production traits, supporting potential pleiotropy and the importance of considering resilience in breeding decisions.
Working within a single, large and well-monitored herd minimized environmental variability, allowing clearer detection of individual differences and genetic signals. This approach delivers practical value to farmers by supporting herd management decisions, especially for low-resilience cows, and informing breeding strategies that prioritize resilient phenotypes. Future studies across diverse herds and environments, enriched with health records and external stressor data (e.g., disease, heat), may improve and validate these findings and further disentangle intrinsic resilience from environmental effects.
Data availability statement
The original contributions presented in the study are included in the article/Supplementary Material, further inquiries can be directed to the corresponding author/s.
Ethics statement
All the procedures were approved by the Animal Welfare Body of the Università degli Studi di Milano (OPBA) and by the Italian Minister of Health (protocol number OPBA_68_2023). The study was conducted in accordance with the local legislation and institutional requirements.
Author contributions
CP: Formal analysis, Writing – original draft, Writing – review & editing. AD: Formal analysis, Writing – original draft, Writing – review & editing. CF: Data curation, Writing – original draft, Writing – review & editing. AB: Conceptualization, Funding acquisition, Supervision, Writing – review & editing. MS: Formal analysis, Supervision, Writing – original draft, Writing – review & editing.
Funding
The author(s) declare that financial support was received for the research and/or publication of this article. This study was carried out within the Agritech National Research Center and received funding from the European Union Next-GenerationEU (PIANO NAZIONALE DI RIPRESA E RESILIENZA (PNRR) -MISSIONE 4 COMPONENTE 2, INVESTIMENTO 1.4 -D.D. 1032 17/06/2022, CN00000022). This manuscript reflects only the authors’ views and opinions, neither the European Union nor the European Commission can be considered responsible for them.
Acknowledgments
The authors gratefully acknowledge the farmer.
Conflict of interest
The authors declare that the research was conducted in the absence of any commercial or financial relationships that could be construed as a potential conflict of interest.
Generative AI statement
The author(s) declare that Generative AI was used in the creation of this manuscript. Generative AI was used solely to improve the English language and grammar of the text. No content was generated or interpreted by AI.
Publisher’s note
All claims expressed in this article are solely those of the authors and do not necessarily represent those of their affiliated organizations, or those of the publisher, the editors and the reviewers. Any product that may be evaluated in this article, or claim that may be made by its manufacturer, is not guaranteed or endorsed by the publisher.
Supplementary material
The Supplementary Material for this article can be found online at: https://www.frontiersin.org/articles/10.3389/fanim.2025.1627086/full#supplementary-material
References
Adriaens I., van den Brulle I., D’Anvers L., Statham J. M. E., Geerinckx K., de Vliegher S., et al. (2021). Milk losses and dynamics during perturbations in dairy cows differ with parity and lactation stage. J. Dairy Sci. 104, 405–418. doi: 10.3168/jds.2020-19195
Alotiby A. (2024). Immunology of stress: A review article. J. Clin. Med. 13. doi: 10.3390/jcm13216394
Antanaitis R., Juozaitienė V., Jonike V., Čukauskas V., Urbšienė D., Urbšys A., et al. (2021). Relationship between temperament and stage of lactation, productivity and milk composition of dairy cows. Anim. (Basel) 11. doi: 10.3390/ani11071840
Aradotlu Parameshwarappa M., Veerasamy S., Veettiparambil Pandarathil R., Sira Tulasiramu S., Madiajagan B., Govindan K., et al. (2019). Resilient capacity of cattle to environmental challenges – An updated review. J. Anim. Behav. Biometeorology 7, 104–118. doi: 10.31893/2318-1265jabb.v7n3p104-118
Bannerman D. D., Paape M. J., Hare W. R., and Hope J. C. (2004). Characterization of the bovine innate immune response to intramammary infection with Klebsiella pneumoniae. J. Dairy Sci. 87, 2420–2432. doi: 10.3168/jds.S0022-0302(04)73365-2
Bekele R., Taye M., Abebe G., and Meseret S. (2023). Genomic regions and candidate genes associated with milk production traits in Holstein and its crossbred cattle: A review. Int. J. Genomics 2023. doi: 10.1155/2023/8497453
Ben Abdelkrim A., Puillet L., Gomes P., and Martin O. (2021). Lactation curve model with explicit representation of perturbations as a phenotyping tool for dairy livestock precision farming. Animal 15, 100074. doi: 10.1016/j.animal.2020.100074
Berghof T. V. L., Bovenhuis H., and Mulder H. A. (2019a). Body weight deviations as indicator for resilience in layer chickens. Front. Genet. 10. doi: 10.3389/fgene.2019.01216
Berghof T. V. L., Poppe M., and Mulder H. A. (2019b). Opportunities to improve resilience in animal breeding programs. Front. Genet. 9, 692. doi: 10.3389/fgene.2018.00692
Calderón-Chagoya R., Vega-Murillo V. E., García-Ruiz A., Ríos-Utrera Á., Martínez-Velázquez G., and Montaño-Bermúdez M. (2023). Genome and chromosome wide association studies for growth traits in Simmental and Simbrah cattle. Anim. Biosci. 36, 19–28. doi: 10.5713/ab.21.0517
Chen S.-Y., Boerman J. P., Gloria L. S., Pedrosa V. B., Doucette J., and Brito L. F. (2023). Genomic-based genetic parameters for resilience across lactations in North American Holstein cattle based on variability in daily milk yield records. J. Dairy Sci. 106, 4133–4146. doi: 10.3168/jds.2022-22754
Chen S.-Y., Gloria L. S., Pedrosa V. B., Doucette J., Boerman J. P., and Brito L. F. (2024). Unraveling the genomic background of resilience based on variability in milk yield and milk production levels in North American Holstein cattle through genome-wide association study and Mendelian randomization analyses. J. Dairy Sci. 107, 1035–1053. doi: 10.3168/jds.2023-23650
Chen S.-Y., Oliveira H. R., Schenkel F. S., Pedrosa V. B., Melka M. G., and Brito L. F. (2020). Using imputed whole-genome sequence variants to uncover candidate mutations and genes affecting milking speed and temperament in Holstein cattle. J. Dairy Sci. 103, 10383–10398. doi: 10.3168/jds.2020-18897
Chu H., Awasthi A., White G. C., Chrzanowska-Wodnicka M., and Malarkannan S. (2008). Rap1b regulates B cell development, homing, and T cell-dependent humoral immunity. J. Immunol. 181, 3373–3383. doi: 10.4049/jimmunol.181.5.3373
Colditz I. G. and Hine B. C. (2016). Resilience in farm animals: biology, management, breeding and implications for animal welfare. Anim. Prod Sci. 56, 1961. doi: 10.1071/AN15297
Cole J. B., Wiggans G. R., Ma L., Sonstegard T. S., Lawlor T. J., Crooker B. A., et al. (2011). Genome-wide association analysis of thirty one production, health, reproduction and body conformation traits in contemporary US Holstein cows. BMC Genomics 12, 1–17. doi: 10.1186/1471-2164-12-408
da Cruz A. S., Silva D. C., Minasi L. B., de Farias Teixeira L. K., Rodrigues F. M., da Silva C. C., et al. (2020). Single-nucleotide polymorphism variations associated with specific genes putatively identified enhanced genetic predisposition for 305-day milk yield in the girolando crossbreed. Front. Genet. 11. doi: 10.3389/fgene.2020.573344
Daniel J. B., Friggens N. C., Chapoutot P., van Laar H., and Sauvant D. (2016). Milk yield and milk composition responses to change in predicted net energy and metabolizable protein: a meta-analysis. Animal 10, 1975–1985. doi: 10.1017/S1751731116001245
Darling T. K. and Lamb T. J. (2019). Emerging roles for eph receptors and ephrin ligands in immunity. Front. Immunol. 10. doi: 10.3389/fimmu.2019.01473
Darvasi A. and Soller M. (1992). Selective genotyping for determination of linkage between a marker locus and a quantitative trait locus. Theor. Appl. Genet. 85, 353–359. doi: 10.1007/BF00222881
Darvasi A. and Soller M. (1994). Selective DNA pooling for determination of linkage between a molecular marker and a quantitative trait locus. Genetics 138, 1365–1373. doi: 10.1093/genetics/138.4.1365
Devani K., Plastow G., Orsel K., and Valente T. S. (2020). Genome-wide association study for mammary structure in Canadian Angus cows. PloS One 15, e0237818. doi: 10.1371/journal.pone.0237818
Dong M. C. and Van Vleck L. D. (1989). Correlations among first and second lactation milk yield and calving interval. J. Dairy Sci. 72, 1933–1936. doi: 10.3168/jds.S0022-0302(89)79313-9
Dong K., Yao N., Pu Y., He X., Zhao Q., Luan Y., et al. (2014). Genomic scan reveals loci under altitude adaptation in tibetan and dahe pigs. PloS One 9, e110520. doi: 10.1371/journal.pone.0110520
Dostaler-Touchette V., Bédard F., Guillemette C., Pothier F., Chouinard P. Y., and Richard F. J. (2009). Cyclic adenosine monophosphate (cAMP)-specific phosphodiesterase is functional in bovine mammary gland. J. Dairy Sci. 92, 3757–3765. doi: 10.3168/jds.2009-2065
Du C., Deng T., Zhou Y., Ye T., Zhou Z., Zhang S., et al. (2019). Systematic analyses for candidate genes of milk production traits in water buffalo (Bubalus Bubalis). Anim. Genet. 50, 207–216. doi: 10.1111/age.12739
Dubey P. K., Goyal S., Yadav A. K., Sahoo B. R., Kumari N., Mishra S. K., et al. (2014). Genetic diversity analysis of the thyroglobulin gene promoter in buffalo and other bovines. Livest Sci. 167, 65–72. doi: 10.1016/j.livsci.2014.06.007
Finot L., Chanat E., and Dessauge F. (2018). Molecular signature of the putative stem/progenitor cells committed to the development of the bovine mammary gland at puberty. Sci. Rep. 8, 16194. doi: 10.1038/s41598-018-34691-2
Finot L., Chanat E., and Dessauge F. (2019). Mammary epithelial cell lineage changes during cow’s life. J. Mammary Gland Biol. Neoplasia 24, 185–197. doi: 10.1007/s10911-019-09427-1
Friggens N. C. and Badsberg J. H. (2007). The effect of breed and parity on curves of body condition during lactation estimated using a non-linear function. animal 1, 565–574. doi: 10.1017/S1751731107691861
Garcia-Baccino C. A., Marie-Etancelin C., Tortereau F., Marcon D., Weisbecker J.-L., and Legarra A. (2021). Detection of unrecorded environmental challenges in high-frequency recorded traits, and genetic determinism of resilience to challenge, with an application on feed intake in lambs. Genet. Sel Evol. 53, 4. doi: 10.1186/s12711-020-00595-x
Grigoletto L., Santana M. H. A., Bressan F. F., Eler J. P., Nogueira M. F. G., Kadarmideen H. N., et al. (2020). Genetic parameters and genome-wide association studies for anti-müllerian hormone levels and antral follicle populations measured after estrus synchronization in nellore cattle. Anim. (Basel) 10. doi: 10.3390/ani10071185
Hansen J., Sato M., and Ruedy R. (2012). Perception of climate change. Proc. Natl. Acad. Sci. U.S.A. 109, E2415–E2423. doi: 10.1073/pnas.1205276109
Heikkilä A.-M., Liski E., Pyörälä S., and Taponen S. (2018). Pathogen-specific production losses in bovine mastitis. J. Dairy Sci. 101, 9493–9504. doi: 10.3168/jds.2018-14824
Hertl J. A., Schukken Y. H., Welcome F. L., Tauer L. W., and Gröhn Y. T. (2014). Pathogen-specific effects on milk yield in repeated clinical mastitis episodes in Holstein dairy cows. J. Dairy Sci. 97, 1465–1480. doi: 10.3168/jds.2013-7266
Jiang L., Liu J., Sun D., Ma P., Ding X., Yu Y., et al. (2010). Genome wide association studies for milk production traits in Chinese Holstein population. PloS One 5, e13661. doi: 10.1371/journal.pone.0013661
Kauf A. C. W., Rosenbusch R. F., Paape M. J., and Bannerman D. D. (2007). Innate immune response to intramammary Mycoplasma bovis infection. J. Dairy Sci. 90, 3336–3348. doi: 10.3168/jds.2007-0058
Kennedy A. D. and DeLeo F. R. (2009). Neutrophil apoptosis and the resolution of infection. Immunol. Res. 43, 25–61. doi: 10.1007/s12026-008-8049-6
Khatib H. (2005). The COPG2, DCN, and SDHD genes are biallelically expressed in cattle. Mamm Genome 16, 545–552. doi: 10.1007/s00335-005-0029-8
Kiser J. N., Lawrence T. E., Neupane M., Seabury C. M., Taylor J. F., Womack J. E., et al. (2017). Rapid Communication: Subclinical bovine respiratory disease - loci and pathogens associated with lung lesions in feedlot cattle. J. Anim. Sci. 95, 2726–2731. doi: 10.2527/jas.2017.1548
Kiser J. N., Neupane M., White S. N., and Neibergs H. L. (2018). Identification of genes associated with susceptibility to Mycobacterium avium ssp. paratuberculosis (Map) tissue infection in Holstein cattle using gene set enrichment analysis-SNP. Mamm. Genome 29, 539–549. doi: 10.1007/s00335-017-9725-4
Koenker R., Portnoy S., Ng P. T., Zeileis A., Grosjean P., and Ripley B. D. (2018). Package ‘quantreg.’ (Vienna, Austria: R Project for Statistical Computing). Available online at: https://cran.rproject.org/web/packages/quantreg/quantreg.pdf.
König S. and May K. (2019). Invited review: Phenotyping strategies and quantitative-genetic background of resistance, tolerance and resilience associated traits in dairy cattle. animal 13, 897–908. doi: 10.1017/S1751731118003208
Kunej T., Šimon M., Luštrek B., Horvat S., and Potočnik K. (2024). Examining genotype-phenotype associations of GRAM domain proteins using GWAS, PheWAS and literature review in cattle, human, pig, mouse and chicken. Sci. Rep. 14, 28889. doi: 10.1038/s41598-024-80117-7
Laodim T., Elzo M. A., Koonawootrittriron S., Suwanasopee T., and Jattawa D. (2017). Identification of SNP markers associated with milk and fat yields in multibreed dairy cattle using two genetic group structures. Livest Sci. 206, 95–104. doi: 10.1016/j.livsci.2017.10.015
Lee J.-W., Bannerman D. D., Paape M. J., Huang M.-K., and Zhao X. (2006). Characterization of cytokine expression in milk somatic cells during intramammary infections with Escherichia coli or Staphylococcus aureus by real-time PCR. Vet. Res. 37, 219–229. doi: 10.1051/vetres:2005051
Liang D., Arnold L. M., Stowe C. J., Harmon R. J., and Bewley J. M. (2017). Estimating US dairy clinical disease costs with a stochastic simulation model. J. Dairy Sci. 100, 1472–1486. doi: 10.3168/jds.2016-11565
Lipkin E., Strillacci M. G., Eitam H., Yishay M., Schiavini F., Soller M., et al. (2016). The use of Kosher phenotyping for mapping QTL affecting susceptibility to Bovine respiratory disease. PloS One 11. doi: 10.1371/journal.pone.0153423
Liu Y. F., Zan L. S., Cui W. T., Xin Y. P., Jiao Y., and Li K. (2011). Molecular cloning, characterization and association analysis of the promoter region of the bovine CDK6 gene. Genet. Mol. Res. 10, 1777–1786. doi: 10.4238/vol10-3gmr1466
Mantilla Valdivieso E. F., Ross E. M., Raza A., Naseem M. N., Kamran M., Hayes B. J., et al. (2022). Transcriptional changes in the peripheral blood leukocytes from Brangus cattle before and after tick challenge with Rhipicephalus australis. BMC Genomics 23, 454. doi: 10.1186/s12864-022-08686-3
Marçal-Pedroza M. G., Campos M. M., Martins M. F., Silva M. V. B., Da Paranhos Costa M. J. R., Negrão J. A., et al. (2023). Is the temperament of crossbred dairy cows related to milk cortisol and oxytocin concentrations, milk yield, and quality? PloS One 18, e0286466. doi: 10.1371/journal.pone.0286466
Medugorac I. and Soller M. (2001). Selective genotyping with a main trait and a correlated trait. J. Anim. Breed Genet. 118, 285–295. doi: 10.1046/j.1439-0388.2001.00308.x
Mesbah-Uddin M., Guldbrandtsen B., Capitan A., Lund M. S., Boichard D., and Sahana G. (2022). Genome-wide association study with imputed whole-genome sequence variants including large deletions for female fertility in 3 Nordic dairy cattle breeds. J. Dairy Sci. 105, 1298–1313. doi: 10.3168/jds.2021-20655
Misztal I., Tsuruta S., Lourenco D., Aguilar I., Legarra A., and Vitezica Z. (2018). Manual for BLUPF90 family of programs (Athens, USA: University of Georgia).
Mizuno Y., Sotomaru Y., Katsuzawa Y., Kono T., Meguro M., Oshimura M., et al. (2002). Asb4, Ata3, and Dcn are novel imprinted genes identified by high-throughput screening using RIKEN cDNA microarray. Biochem. Biophys. Res. Commun. 290, 1499–1505. doi: 10.1006/bbrc.2002.6370
Moghaddam S. H. H., Moridi M., and Mirhoseini S. Z. (2019). IL1B gene expression and association with SCS in Guilan native and Holstein cow populations and their reciprocal crosses. J. Appl. Biol. Sci. 13, 150–153.
Mohammadi A., Alijani S., Rafat S. A., and Abdollahi-Arpanahi R. (2020). Genome-wide association study and pathway analysis for female fertility traits in Iranian holstein cattle. Ann. Anim. Sci. 20, 825–851. doi: 10.2478/aoas-2020-0031
Neupane M., Kiser J. N., and Neibergs H. L. (2018). Gene set enrichment analysis of SNP data in dairy and beef cattle with bovine respiratory disease. Anim. Genet. 49, 527–538. doi: 10.1111/age.12718
Nguyen-Ba H., Taghipoor M., and van Milgen J. (2020). Modelling the feed intake response of growing pigs to diets contaminated with mycotoxins. Animal 14, s303–s312. doi: 10.1017/S175173112000083X
Niloofar P., Francis D. P., Lazarova-Molnar S., Vulpe A., Vochin M.-C., Suciu G., et al. (2021). Data-driven decision support in livestock farming for improved animal health, welfare and greenhouse gas emissions: Overview and challenges. Comput. Electron Agric. 190, 106406. doi: 10.1016/j.compag.2021.106406
Poppe M., Bonekamp G., van Pelt M. L., and Mulder H. A. (2021a). Genetic analysis of resilience indicators based on milk yield records in different lactations and at different lactation stages. J. Dairy Sci. 104, 1967–1981. doi: 10.3168/jds.2020-19245
Poppe M., Mulder H. A., van Pelt M. L., Mullaart E., Hogeveen H., and Veerkamp R. F. (2022). Development of resilience indicator traits based on daily step count data for dairy cattle breeding. Genet. Selection Evol. 54, 21. doi: 10.1186/s12711-022-00713-x
Poppe M., Mulder H. A., and Veerkamp R. F. (2021b). Validation of resilience indicators by estimating genetic correlations among daughter groups and with yield responses to a heat wave and disturbances at herd level. J. Dairy Sci. 104, 8094–8106. doi: 10.3168/jds.2020-19817
Poppe M., Veerkamp R. F., van Pelt M. L., and Mulder H. A. (2020). Exploration of variance, autocorrelation, and skewness of deviations from lactation curves as resilience indicators for breeding. J. Dairy Sci. 1667–1684. doi: 10.3168/jds.2019-17290
Rial-Pensado E., Rivas-Limeres V., Grijota-Martínez C., Rodríguez-Díaz A., Capelli V., Barca-Mayo O., et al. (2022). Temperature modulates systemic and central actions of thyroid hormones on BAT thermogenesis. Front. Physiol. 13. doi: 10.3389/fphys.2022.1017381
Robakowska-Hyżorek D., Starzyński R. R., Żelazowska B., Oprządek J., Sadkowski T., and Zwierzchowski L. (2016). Effects of polymorphism in the bovine PTPRQ gene on the expression of MYF6 and MYF5 genes in skeletal muscle and on meat production traits in beef bulls. Czech J. Anim. Sci. 61, 232–242. doi: 10.17221/118/2014-CJAS
Salleh M. S., Mazzoni G., Höglund J. K., Olijhoek D. W., Lund P., Løvendahl P., et al. (2017). RNA-Seq transcriptomics and pathway analyses reveal potential regulatory genes and molecular mechanisms in high- and low-residual feed intake in Nordic dairy cattle. BMC Genomics 18, 258. doi: 10.1186/s12864-017-3622-9
Scheffer M., Bolhuis J. E., Borsboom D., Buchman T. G., Gijzel S. M. W., Goulson D., et al. (2018). Quantifying resilience of humans and other animals. Proc. Natl. Acad. Sci. U.S.A. 115, 11883–11890. doi: 10.1073/pnas.1810630115
Schmidtmann C., Mugambe J., Blaj I., Harms C., and Thaller G. (2024). Genetic investigations on backfat thickness and body condition score in German Holstein cattle. J. Anim. Breed. Genet. 141, 602–613. doi: 10.1111/jbg.12867
Sejian V., Bhatta R., Gaughan J. B., Dunshea F. R., and Lacetera N. (2018). Review: Adaptation of animals to heat stress. Animal 12, s431–s444. doi: 10.1017/S1751731118001945
Silva R. P., Berton M. P., Grigoletto L., Carvalho F. E., Silva R. M. O., Peripolli E., et al. (2019). Genomic regions and enrichment analyses associated with carcass composition indicator traits in Nellore cattle. J. Anim. Breed. Genet. 136, 118–133. doi: 10.1111/jbg.12373
Sinha R., Sinha B., Kumari R., M R V., Sharma N., Verma A., et al. (2023). Association of udder type traits with single nucleotide polymorphisms in Sahiwal (Bos indicus) and Karan Fries (Bos taurus \times Bos indicus) cattle. Anim. Biotechnol. 34, 2745–2756. doi: 10.1080/10495398.2022.2114083
Stepancheva T., Marinov I., and Gergovska Z. (2024). Milking temperament and its association with test-day milk yield in Bulgarian murrah buffaloes. Anim. (Basel) 14. doi: 10.3390/ani14070987
Stepensky P., Keller B., Buchta M., Kienzler A.-K., Elpeleg O., Somech R., et al. (2013). Deficiency of caspase recruitment domain family, member 11 (CARD11), causes profound combined immunodeficiency in human subjects. J. Allergy Clin. Immunol. 131, 477–85.e1. doi: 10.1016/j.jaci.2012.11.050
Thankachan J. M. and Setty S. R. G. (2022). KIF13A-A key regulator of recycling endosome dynamics. Front. Cell Dev. Biol. 10. doi: 10.3389/fcell.2022.877532
Tizioto P. C., Kim J., Seabury C. M., Schnabel R. D., Gershwin L. J., Van Eenennaam A. L., et al. (2015). Immunological response to single pathogen challenge with agents of the bovine respiratory disease complex: an RNA-sequence analysis of the bronchial lymph node transcriptome. PloS One 10, e0131459. doi: 10.1371/journal.pone.0131459
Tolleson M. W., Gill C. A., Herring A. D., Riggs P. K., Sawyer J. E., Sanders J. O., et al. (2017). Association of udder traits with single nucleotide polymorphisms in crossbred Bos indicus-Bos taurus cows. J. Anim. Sci. 95, 2399–2407. doi: 10.2527/jas.2017.1475
Turner S. (2018). qqman: an R package for visualizing GWAS results using Q-Q and manhattan plots. J. Open Source Software. doi: 10.21105/joss.00731
Wang A., Brito L. F., Zhang H., Shi R., Zhu L., Liu D., et al. (2022a). Exploring milk loss and variability during environmental perturbations across lactation stages as resilience indicators in Holstein cattle. Front. Genet. 13. doi: 10.3389/fgene.2022.1031557
Wang P., Li X., Zhu Y., Wei J., Zhang C., Kong Q., et al. (2022b). Genome-wide association analysis of milk production, somatic cell score, and body conformation traits in Holstein cows. Front. Vet. Sci. 9, 932034. doi: 10.3389/fvets.2022.932034
Wang H., Zhong J., Wang J., Chai Z., Zhang C., Xin J., et al. (2021). Whole-transcriptome analysis of yak and cattle heart tissues reveals regulatory pathways associated with high-altitude adaptation. Front. Genet. 12. doi: 10.3389/fgene.2021.579800
Wathes D. C., Cheng Z., Bourne N., Taylor V. J., Coffey M. P., and Brotherstone S. (2007). Differences between primiparous and multiparous dairy cows in the inter-relationships between metabolic traits, milk yield and body condition score in the periparturient period. Domest Anim. Endocrinol. 33, 203–225. doi: 10.1016/j.domaniend.2006.05.004
Wickramasinghe S., Hua S., Rincon G., Islas-Trejo A., German J. B., Lebrilla C. B., et al. (2011). Transcriptome profiling of bovine milk oligosaccharide metabolism genes using RNA-sequencing. PloS One 6, e18895. doi: 10.1371/journal.pone.0018895
Wu X., Guldbrandtsen B., Lund M. S., and Sahana G. (2016). Association analysis for feet and legs disorders with whole-genome sequence variants in 3 dairy cattle breeds. J. Dairy Sci. 99, 7221–7231. doi: 10.3168/jds.2015-10705
Xing C. and Xing G. (2009). Power of selective genotyping in genome-wide association studies of quantitative traits. BMC Proc. 3, S23. doi: 10.1186/1753-6561-3-S7-S23
Keywords: resilience, Holstein, milk yield, GWAS, QTL
Citation: Punturiero C, Delledonne A, Ferrari C, Bagnato A and Strillacci MG (2025) Mapping genomic regions affecting resilience traits in a large dairy farm of Holstein cows. Front. Anim. Sci. 6:1627086. doi: 10.3389/fanim.2025.1627086
Received: 12 May 2025; Accepted: 14 July 2025;
Published: 11 August 2025.
Edited by:
Juliana Petrini, Clinica do Leite Ltda, BrazilReviewed by:
Evans Kiptoo Cheruiyot, The University of Queensland, AustraliaHailiang Zhang, China Agricultural University, China
Copyright © 2025 Punturiero, Delledonne, Ferrari, Bagnato and Strillacci. This is an open-access article distributed under the terms of the Creative Commons Attribution License (CC BY). The use, distribution or reproduction in other forums is permitted, provided the original author(s) and the copyright owner(s) are credited and that the original publication in this journal is cited, in accordance with accepted academic practice. No use, distribution or reproduction is permitted which does not comply with these terms.
*Correspondence: Alessandro Bagnato, YWxlc3NhbmRyby5iYWduYXRvQHVuaW1pLml0
†These authors have contributed equally to this work