Abstract
Fatty acid composition is a key determinant of beef quality, influencing traits such as flavor, tenderness, and nutritional value. Understanding the genetic regulation of fatty acid composition in beef cattle may inform strategies to improve these attributes through selective breeding. The objective of this study was to explore genomic regions associated with fatty acid composition. Genome-wide association analysis revealed several candidate genes, including HELB, PLAG1, FASN, and LZTS2, which are involved in cell growth and division and may influence lipid accumulation in adipose tissue. Gene network analysis corroborated genome-wide association study (GWAS) findings and further identified additional genes with small effects that were not detected by single-trait GWAS. This approach revealed numerous genes involved in fatty acid uptake and intracellular lipid transport, providing deeper insight into the complex genetic architecture underlying beef fatty acid composition.
Introduction
Fat composition plays a crucial role in determining the quality and nutritional value of beef. While taste and affordability remain important, consumers are increasingly considering the nutritional content of their food (Flowers et al., 2018). Fat content and fatty acid composition of beef directly impact both palatability and healthfulness. Marbling, the visible streaking of fat within muscle tissue, enhances the flavor, juiciness, and tenderness of the meat, significantly impacting consumer enjoyment and market demand (Emerson et al., 2013; Hunt et al., 2014). Beyond the sensory appeal, beef fat contains essential fatty acids that play a vital role in human health. Linoleic acid, eicosapentaenoic acid (EPA), and docosahexaenoic acid (DHA) are crucial nutrients that the body cannot synthesize, making dietary sources like beef important (Enser et al., 1998; Daley et al., 2010). While some consumers limit beef consumption due to its fat content, it is important to recognize the presence of health-beneficial fats, particularly mono- and polyunsaturated fatty acids, which have been shown to reduce the risk of cardiovascular disease (Daley et al., 2010; Sacks et al., 2017; Ludwig et al., 2018).
Traditional selection for fat content and fatty acid composition in beef is challenging because these traits are difficult and costly to measure and can be assessed only post-mortem. Genomic selection offers an effective alternative, by leveraging genomic data, to provide a faster, more accurate and cost-effective approach to genetic improvement. Genome-wide association studies (GWAS) have been instrumental in pinpointing genetic markers for various economically important traits. However, GWAS often lack the power to detect genes with small effects due to the stringent statistical corrections required to minimize false positives. This limitation is particularly problematic for highly polygenic traits, such as fat content and fatty acid composition, which are influenced by numerous genes with minor contributions. An innovative approach to address this challenge is gene network analysis, which integrates GWAS data from related traits to relax statistical stringency and enhance the detection of small-effect loci. By leveraging biological pathways and co-expression patterns, gene network analysis provides a more comprehensive understanding of the genetic architecture underlying fat deposition in beef cattle.
The objectives of this study were to 1) use genome-wide association to identify genes with large effect on fatty acid composition, and 2) use gene network analysis to detect genes with smaller contributions to fat content and the fatty acid profile of beef.
Materials and methods
Animals and management
The research protocol was approved by the University of Florida Institutional Animal Care and Use Committee number 201003744. The variables and data collection procedures are described in Rodriguez et al, 2023, Rodriguez et al, 2024). This study used a total of 1,051 commercial Brangus steers from the Seminole Tribe of Florida, Inc. born in 2014 and 2015 and finished at a commercial feedlot (Quincey Cattle Company, Chiefland, FL). Cattle were implanted with Revalor XS (Merck & Co., Inc., Kenilworth, NJ) and fed at a contract feeder where they were provided with a standard feedlot diet consisting of corn, protein, vitamins, and minerals until they reached a subcutaneous fat thickness over the ribeye of approximately 1.27 cm. Lot at feedlot (N = 26) and ranch of origin (N = 23) were recorded for each animal. The concentrate diet had on average, 89.7% of DM, 14.4% of CP, 1.5 Mcal/kg DM of NEm, and 1.1 Mcal/kg DM of NEg. As cattle achieved appropriate degrees of back fat thickness based on visual appraisal, they were transported to a commercial packing plant (FPL Food LLC., Augusta, Georgia) one day prior to harvested at approximately 2 years of age in 2016 and 2017.
Carcass and meat quality evaluation
Cattle were harvested under USDA-FSIS inspection. Hot carcass weight (HCW) was recorded immediately following harvest. Carcasses were separated between the 12th and 13th rib at 48 hours postmortem per industry standard. Marbling score, 12th rib fat thickness (RFT; cm), and ribeye area (REA; cm2) were evaluated for each animal according to USDA standards. Following carcass evaluation, one exposed 2.54 cm-thick ribeye steak was removed from the longissimus thoracis of each carcass posterior to the 12th rib. The steaks were kept on ice and transferred to the University of Florida Meat Processing Center (Gainesville, Florida). Steaks were then trimmed of external fat and connective tissue. A thin shaving across the entire surface of the steak was removed from each sample and frozen at -20°C for subsequent fatty acid and DNA extraction. Steaks were placed in heat shrink vacuum pack bags (B2570; Cryovac, Duncan, SC), and vacuum sealed with a Multivac C500 (Multivac Inc., Kansas City, MO). Steaks were then aged for 14 days at 4°C and placed in a freezer at –20°C for storage.
Warner–Bratzler Shear Force
Warner–Bratzler Shear Force (WBSF) was evaluated as described in Rodriguez et al. (2023). Briefly, steaks were allowed to thaw at 4°C for 24 h prior to cooking on open hearth grills (Hamilton Beach Brand, Washington, NC) to an internal temperature of 71°C. The steaks were flipped once when the internal temperature reached 35°C. Internal temperature was monitored by placing a copper-constantan thermocouple thermometer (Omega Engineering Inc., Stanford, CT) in the geometric center of the steak. Slice shear force was measured by making a cut on the lateral end of the muscle, ~1 cm from the end, across the width, to square off the end of the muscle. A second cut, parallel and 5 cm from the first cut, was made across the width, using a sample size box. The 5 cm-long section was placed in a slice box with the muscle fiber angle aligned to two 45° slots and centered so that the slice was cut from the center of the section. The lid of the box was closed and a knife with two parallel blades spaced 1 cm apart was inserted to cut a 1-cm-thick and 5-cm-long slice, parallel to the muscle fibers. The force required to shear through the steak slice was measured using an Instron Universal Testing Machine (Instron Corporation, Canton, MA) with a 1.17-mm-thick slice shear head and a crosshead speed of 500 mm/min. The steak slice was placed in the machine within 2 min of the steak being taken off the grill, oriented so that the blade sheared perpendicular to the muscle fibers down the center of the 5 cm slice. The recorded Slice Shear Force (SSF) was then converted to WBSF values for analysis using the following formula:
Fatty acid extraction and gas chromatography analysis
The portion of the sample used for fatty acid extraction was immersed in liquid nitrogen and ground to a fine powder using a mortar and pestle. Fatty acid extraction was performed at the W. M. Keck Metabolomics Research Laboratory, Iowa State University (Ames, IA) as described in Flowers et al. (2018) and Rodriguez et al, 2023, Rodriguez et al, 2024). Briefly, about 200 mg of finely ground steak sample was dissolved in 1 mL of 2:1 Chloroform-Methanol mixture. The extracted fats were trans-esterified with 25% Sodium Methoxide in methanol. The resulting Fatty Acid Methyl Esters (FAME) were extracted into hexane. For detection, 1 µl of sample was injected into Agilent 7890A GC-FID instrument, a Gas Chromatograph equipped with a flame ionization detector for separation and quantification of the FAME. The analysis was performed on Agilent CP-Wax 52CB column (15m, 0.32mm, 0.5µm). The oven temperature program was as follows: Initial temperature of 100°C, increased to 170°C with a ramp of 2°C/min, then to 180°C with a ramp of 0.5°C/min, finally to a temperature of 250°C with a ramp of 1°C/min, and held for 3 minutes. The inlet temperature was 250°C and the detector temperature was 220°C. Helium was used as the carrier gas and Supelco 37 FAME mix (Catalog # CRM47885 SUPELCO) was used to generate the calibration curve for identification and quantification of FAME. Twenty-seven individual fatty acids were detected. Total FAME was calculated as the sum of all FAME. Fatty acid percentages were calculated according to the FAO guidelines for converting units (Version 1.0). Briefly, g of FAME per 100 g of total FAME were multiplied by their corresponding Sheppard Factors to get individual g of fatty acid per 100 g of total FAME. These individual fatty acids were summed together, then the individual fatty acids were divided by the sum and multiplied by 100 to calculate the percentages of the individual fatty acid (or g of fatty acid per 100 g total fatty acid). Saturated, monounsaturated, polyunsaturated, omega-6, and omega-3 fatty acid percentages (SFA%, MUFA%, PUFA%, ω6%, and ω3%, respectively) were calculated as the sum of their respective individual components. Additionally, ω6:ω3 was calculated as the ratio of ω6% to ω3%.
Genotyping
Genomic DNA was extracted from the steak shavings using the QIAamp DNA Mini DNA kit (Qiagen, Valencia, CA, United States) following the protocol: DNA purification from tissues in the QIAamp DNA mini and Blood mini Handbook. The extracted DNA was then genotyped with the Bovine GeneSeek Genome Profiler F-250 array (Neogen Corp. – GeneSeek, Lincoln, NE, United States) identifying 221,115 autosomal genetic markers for 1,051 individuals. Markers with a minor allele frequency less than 0.01 or call rate less than 0.90 were excluded, as well as individuals with a call rate less than 0.90, leaving 129,347 single nucleotide polymorphism (SNP) markers and 1,041 samples for genomic analysis.
Genome-wide association analysis
A contemporary group of lot nested within ranch was used to control for year of birth and harvest, possible population structure, and any environmental variation between lots or ranches. Ranches and lots with less than 7 individuals and contemporary groups that account for less than 15% of each of their corresponding lot and ranch were removed from analysis, leaving 961 individuals for further analysis.
Average information restricted maximum likelihood (AIREML) variance components were estimated by single-trait genomic best linear unbiased prediction (GBLUP) from single-trait animal linear mixed models using the airemlf90 package of the BLUPF90 program from Ignacy Misztal and collaborators, University of Georgia (Misztal et al. 2024). The single-trait animal mixed models used in this study included the direct additive genetic variance and residual as random effects and the contemporary group as a class effect in the model:
where y is a vector or matrix of phenotypic records for the single-trait or two-trait models respectively, X is an incidence matrix linking phenotypic records to fixed effects, b is a vector of fixed effects, Z is an incidence matrix linking phenotypic records to additive genetic effects, e is a vector of random residuals with distribution , is the residual variance, I is an identity matrix, u is a vector of random animal additive genetic effects with distribution , is the additive genetic variance, and G is the genomic relationship matrix constructed based on (VanRaden, 2008), assuming allele frequencies from the population in this study:
where Z is a centered incidence matrix of genotype covariates (0, 1, 2), and is a scaling parameter where pi is the frequency of the reference allele of SNP i. Therefore, the single-trait model covariance matrix of u and e is V1:
P-values for each SNP were calculated for each phenotype and used to select genes for the gene networks via an association weight matrix (AWM) approach (Reverter and Fortes, 2013).
Gene network analysis
The AWM approach was used to construct gene networks based on the GWAS results. The gene network for marbling used marbling as the key phenotype and HCW, RFT, REA, WBSF, total FAME, SFA%, MUFA%, PUFA%, ω6%, ω3%, and ω6:ω3 as secondary phenotypes. The gene networks for saturated, monounsaturated, and polyunsaturated fat used all 27 individual fatty acids with palmitic acid, oleic acid, and linoleic acid as the key phenotypes, respectively.
The 129,347 SNP were mapped to all genes within 3 kb of their position, and each gene was assigned the lowest p-value from its corresponding markers for each phenotype. Gene selection for the gene network analysis was conducted in three steps based on raw p-values:
-
Genes associated with the key phenotype (P< 0.001) were selected.
-
The average number of phenotypes associated with these genes at P< 0.001 was calculated.
-
Genes meeting the P< 0.001 for the key phenotype, along with genes associated with an above-average number of other phenotypes, were retained for gene network analysis.
The gene network was then generated using the ClueGO (Bindea et al., 2009) and CluePedia (Bindea et al., 2013) plug-ins for Cytoscape (Shannon et al., 2003). Gene ontology (GO) information (Consortium et al., 2000) for Bos taurus was precompiled and GO term enrichment and functional grouping were performed using P< 0.05 and kappa coefficient > 0.3 as threshold values. Additionally, only GO terms that contained at least three genes from the AWM analysis and represented at least 4% of the total genes identified in the AWM analysis were considered enriched in the network.
Results and discussion
Genetic architecture of fat content in beef cattle
Summary statistics, variance components, and heritability for recorded traits were reported and discussed in Rodriguez et al (2023), Rodriguez et al, 2024). Briefly, recorded traits were: 27 fatty acid percentages, marbling, HCW, RFT, REA, WBSF, total FAME, SFA%, MUFA%, PUFA%, ω6%, ω3%, and ω6:ω3. Means, standard deviation, and heritability for recorded traits are given in Table 1. The complete GWAS results for all 39 traits are provided in Supplementary Tables 1–3 as -log10 of p-values. Additionally, Manhattan plots illustrating GWAS results for SFA, MUFA, and PUFA are presented in Figures 1–3, respectively. GWAS identified 201 SNP significantly associated with palmitic acid—the predominant saturated fatty acid in beef—at P< 0.001. For oleic acid, the most abundant monounsaturated fatty acid, 252 significant SNP were detected, while 128 SNP were associated with linoleic acid, the major polyunsaturated fatty acid, at the same significance threshold. The GWAS for SFA, MUFA, and PUFA identified 55, 24, and 2 SNP, respectively, associated at a false discovery rate (FDR) of 20%, corresponding to significance thresholds of P< 0.00008 for SFA, P< 0.00004 for MUFA, and P< 0.000005 for PUFA (-log10 of 4.1, 4.4, and 5.3 respectively). The GWAS for marbling identified 134 SNP associated at P< 0.001; however, no SNP reached significance at FDR of 20% (P< 0.000005; -log10 of 5.3). Lists with detailed information on significant quantitative trait loci (QTL) for SFA, MUFA, and PUFA are given in Tables 2–4, respectively.
Table 1
| Trait | M ± Σ | h2 |
|---|---|---|
| Marbling | 436 ± 84 | 0.53 |
| Hot Carcass Weight (kg) | 373 ± 36 | 0.34 |
| Rib Fat Thickness (cm) | 1.56 ± 0.60 | 0.35 |
| Ribeye Area (cm2) | 83.2 ± 9.5 | 0.36 |
| Warner-Bratzler Shear Force (kg) | 5.10 ± 0.96 | 0.35 |
| Total Fatty Acid Methyl Ester (mg/g of tissue) | 10.6 ± 10.7 | 0.11 |
| Percent Saturated Fat | 47.5 ± 3.1 | 0.58 |
| Percent Monounsaturated Fat | 46.4 ± 3.5 | 0.59 |
| Percent Polyunsaturated Fat | 6.12 ± 2.0 | 0.29 |
| Percent Omega-6 Fatty Acids | 5.2 ± 1.6 | 0.29 |
| Percent Omega-3 Fatty Acids | 0.84 ± 0.43 | 0.22 |
| Ratio of Omega-6 to Omega-3 | 6.94 ± 2.3 | 0.04 |
Means (μ), standard deviation (σ), and SNP-based heritability (h2) for recorded traits.
Figure 1

Manhattan plot for saturated fatty acid percentage. The Manhattan plot illustrates single nucleotide polymorphisms (SNP) p-values for trait analysis across all 29 autosomal chromosomes. The x-axis lists chromosome numbers, and the y-axis shows the negative log of the p-values, indicating the level of significance. Peaks suggest associations with the trait under study.
Figure 2
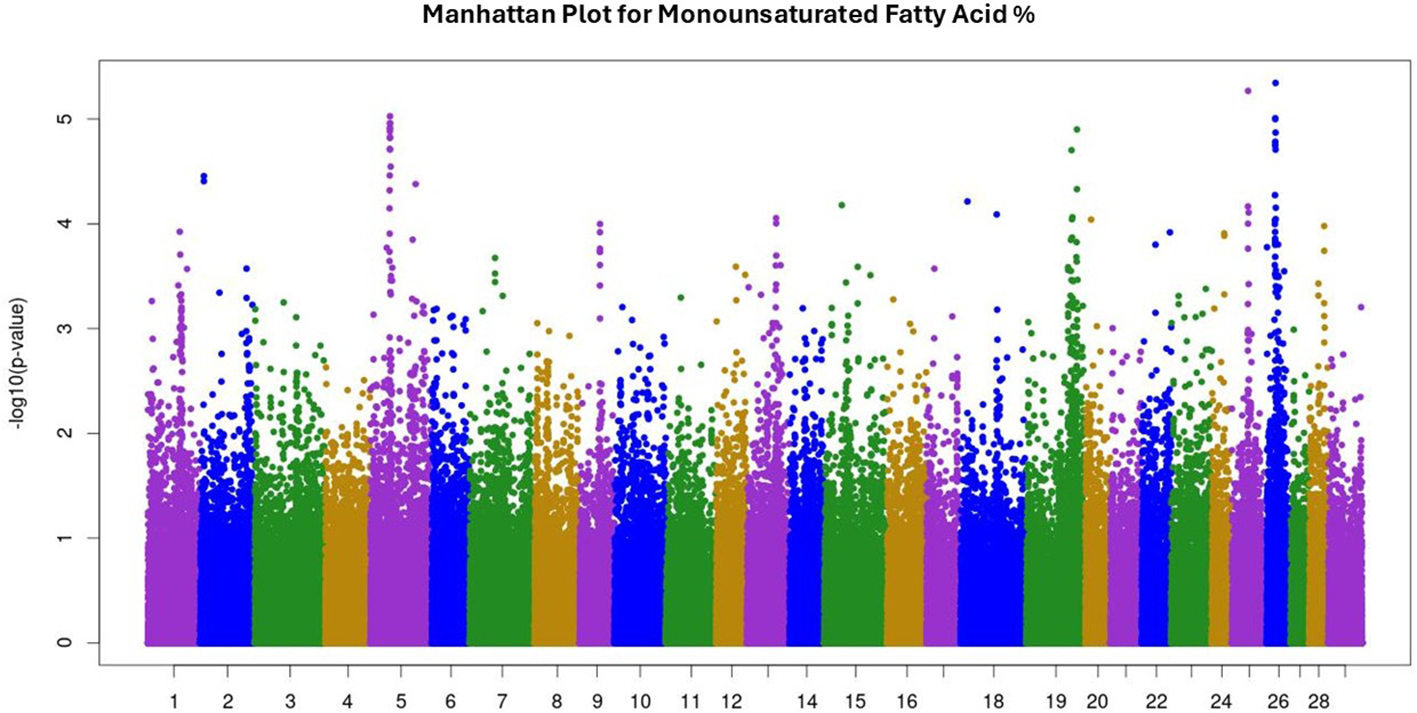
Manhattan plot for monounsaturated fatty acid percentage. The Manhattan plot illustrates single nucleotide polymorphisms (SNP) p-values for trait analysis across all 29 autosomal chromosomes. The x-axis lists chromosome numbers, and the y-axis shows the negative log of the p-values, indicating the level of significance. Peaks suggest associations with the trait under study.
Figure 3

Manhattan plot for polyunsaturated fatty acid percentage. The Manhattan plot illustrates single nucleotide polymorphisms (SNP) p-values for trait analysis across all 29 autosomal chromosomes. The x-axis lists chromosome numbers, and the y-axis shows the negative log of the p-values, indicating the level of significance. Peaks suggest associations with the trait under study.
Table 2
| BTA | Pos | Genes |
|---|---|---|
| 3 | 6,569,577 | CCDC190 |
| 5 | 47,422,717 - 47,594,939 | GRIP1, HELB, ENSBTAG00000053419, IRAK3 |
| 5 | 48,950,539 | TBC1D30 |
| 5 | 49,420,210 - 49,613,116 | XPOT, C5H12orf56, C5H12orf66, SRGAP1 |
| 5 | 47,422,717 - 49,613,116 | GRIP1, HELB, ENSBTAG00000053419, IRAK3, TMBIM4, LLPH, HMGA2, MSRB3, LEMD3, WIF1, ENSBTAG00000042928, TBC1D30, ENSBTAG00000000237, GNS, RASSF3, TBK1, XPOT, C5H12orf56, C5H12orf66, SRGAP1 |
| 6 | 18,442,786 | |
| 14 | 22,921,127 - 26,855,837 | XKR4, TMEM68, TGS1, LYN, RPS20, ENSBTAG00000045097, ENSBTAG00000028889, MOS, PLAG1, CHCHD7, SDR16C5, SDR16C6, PENK, BPNT2, FAM110B, ENSBTAG00000051748, UBXN2B, CYP7A1, SDCBP, NSMAF, TOX, CA8, RAB2A, CHD7, CLVS1 |
| 19 | 50,173,293 - 50,785,330 | ENSBTAG00000050312, ENSBTAG00000053776, ENSBTAG00000050500, ENSBTAG00000039765, ENSBTAG00000048385, ENSBTAG00000040323, ENSBTAG00000050141, SECTM1A, SECTM1, ENSBTAG00000024934, ENSBTAG00000052537, ENSBTAG00000053090, ENSBTAG00000050786, CD7, CSNK1D, SLC16A3, CCDC57, FASN |
| 22 | 42,679,365 | |
| 25 | 22,123,355 | |
| 26 | 20,681,400 - 21,843,401 | COX15, CUTC, ABCC2, DNMBP, ENSBTAG00000045082, ENSBTAG00000044887, CPN1, ENSBTAG00000023939, ENSBTAG00000055268, ENSBTAG00000033021, ERLIN1, CHUK, CWF19L1, SNORA12, BLOC1S2, PKD2L1, ENSBTAG00000027715, SCD, ENSBTAG00000053902, WNT8B, SEC31B, NDUFB8, HIF1AN, PAX2, ENSBTAG00000045130, SLF2, SEMA4G, MRPL43, TWNK, LZTS2, ENSBTAG00000039834, ENSBTAG00000016928 |
Chromosome and positions of significant QTL for SFA, alongside genes within 3kb of QTL.
Table 3
| BTA | Pos | Genes |
|---|---|---|
| 2 | 6,650,620 | ANKAR |
| 5 | 47,422,717 - 47,594,939 | GRIP1, HELB, ENSBTAG00000053419, IRAK3 |
| 5 | 49,420,210 | XPOT, C5H12orf56 |
| 19 | 50,173,293 | |
| 19 | 53,819,468 | PGS1 |
| 25 | 22,123,355 | |
| 26 | 21,017,211 - 21,239,645 | ENSBTAG00000023939, ENSBTAG00000055268, ENSBTAG00000033021, ERLIN1, CHUK, CWF19L1, SNORA12, BLOC1S2, PKD2L1, ENSBTAG00000027715 |
Chromosome and positions of significant QTL for MUFA, alongside genes within 3kb.
Table 4
| BTA | Pos | Genes |
|---|---|---|
| 2 | 6,650,620 | ANKAR |
| 5 | 64,515,337 | GAS2L3 |
Chromosome and positions of significant QTL for PUFA, alongside genes within 3kb.
Key candidate genes
Genome wide association for SFA and MUFA revealed overlapping QTL on Bos taurus autosomes (BTA) 5 and 19. In addition, GWAS for SFA identified two distinct QTL on BTA 14 and 26. These regions harbor several candidate genes, including HELB, PLAG1, FASN, and LZTS2. On BTA 5, HELB encodes DNA Helicase B, an ATPase that catalyzes the unwinding of DNA for transcription and replication. A mutation in this gene could affect cell division and growth which could alter fatty acid composition through the size and quantity of adipose cells in muscle. Mutations in HELB could also impact its protein’s affinity for specific genes impacting gene regulation and expression. On BTA 19, several significant markers were located within the FASN gene, which encodes fatty acid synthase, a key enzyme in de novo lipogenesis. Fatty acid synthase is a known catalyst of the C16:0 FA Palmitate and has been associated with FA composition in cattle (Bartoň et al., 2016; Zhu et al., 2017). The QTL identified on BTA 14 for SFA includes PLAG1, a gene encoding a zinc finger transcription factor involved in the regulation of genes related to cell proliferation. PLAG1 has been previously associated with growth traits such as height and weight in beef cattle (Nishimura et al., 2012; Fortes et al., 2013). The QTL on BTA 26 associated with SFA includes LZTS2, a leucine zipper tumor suppressor gene, which regulates transcription and cell cycle. Its potential influence on fatty acid composition may occur through mechanisms similar to those proposed for HELB and PLAG1.
Gene networks & their functional roles
A less stringent p-value threshold is recommended for AWM and gene network analysis to allow the integration of potentially important regulators across multiple traits. Although many SNP with small effect sizes do not reach genome-wide significance, a key advantage of the AWM methodology lies in its ability to capture such variants. Consequently, gene network analysis of genetically correlated traits can uncover the contributions of functionally interconnected genes that may underlie complex phenotypes (Fortes et al., 2010; Mateescu et al., 2017).
The GWAS for marbling identified 134 SNP associated at P< 0.001, with 89 genes located within 3 kb of these SNP. Additionally, 183 genes were significantly associated (P< 0.001) with at least two phenotypes included in the gene network analysis for marbling (Marbling, HCW, RFT, REA, WBSF, total FAME, SFA%, MUFA%, PUFA%, ω6%, ω3%, and ω6:ω3). This resulted in a total of 260 genes associated with marbling through the AWM approach. Of these 260 genes, 35 were significantly associated with one or more of the 15 GO terms in the gene network. The gene network for marbling (Figure 4) contained 15 significant GO terms in 9 GO term groups: 1) detection of chemical stimulus involved in sensory perception of taste, 2) regulation of protein targeting to mitochondrion, 3) Schwann cell differentiation, 4) site of polarized growth, 5) ubiquitin binding, 6) apical junction assembly, 7) extracellular matrix component, 8) spindle, and 9) actin-based cell projection. Significant genes and GO terms in the GO term groups for marbling are given in Table 5.
Figure 4
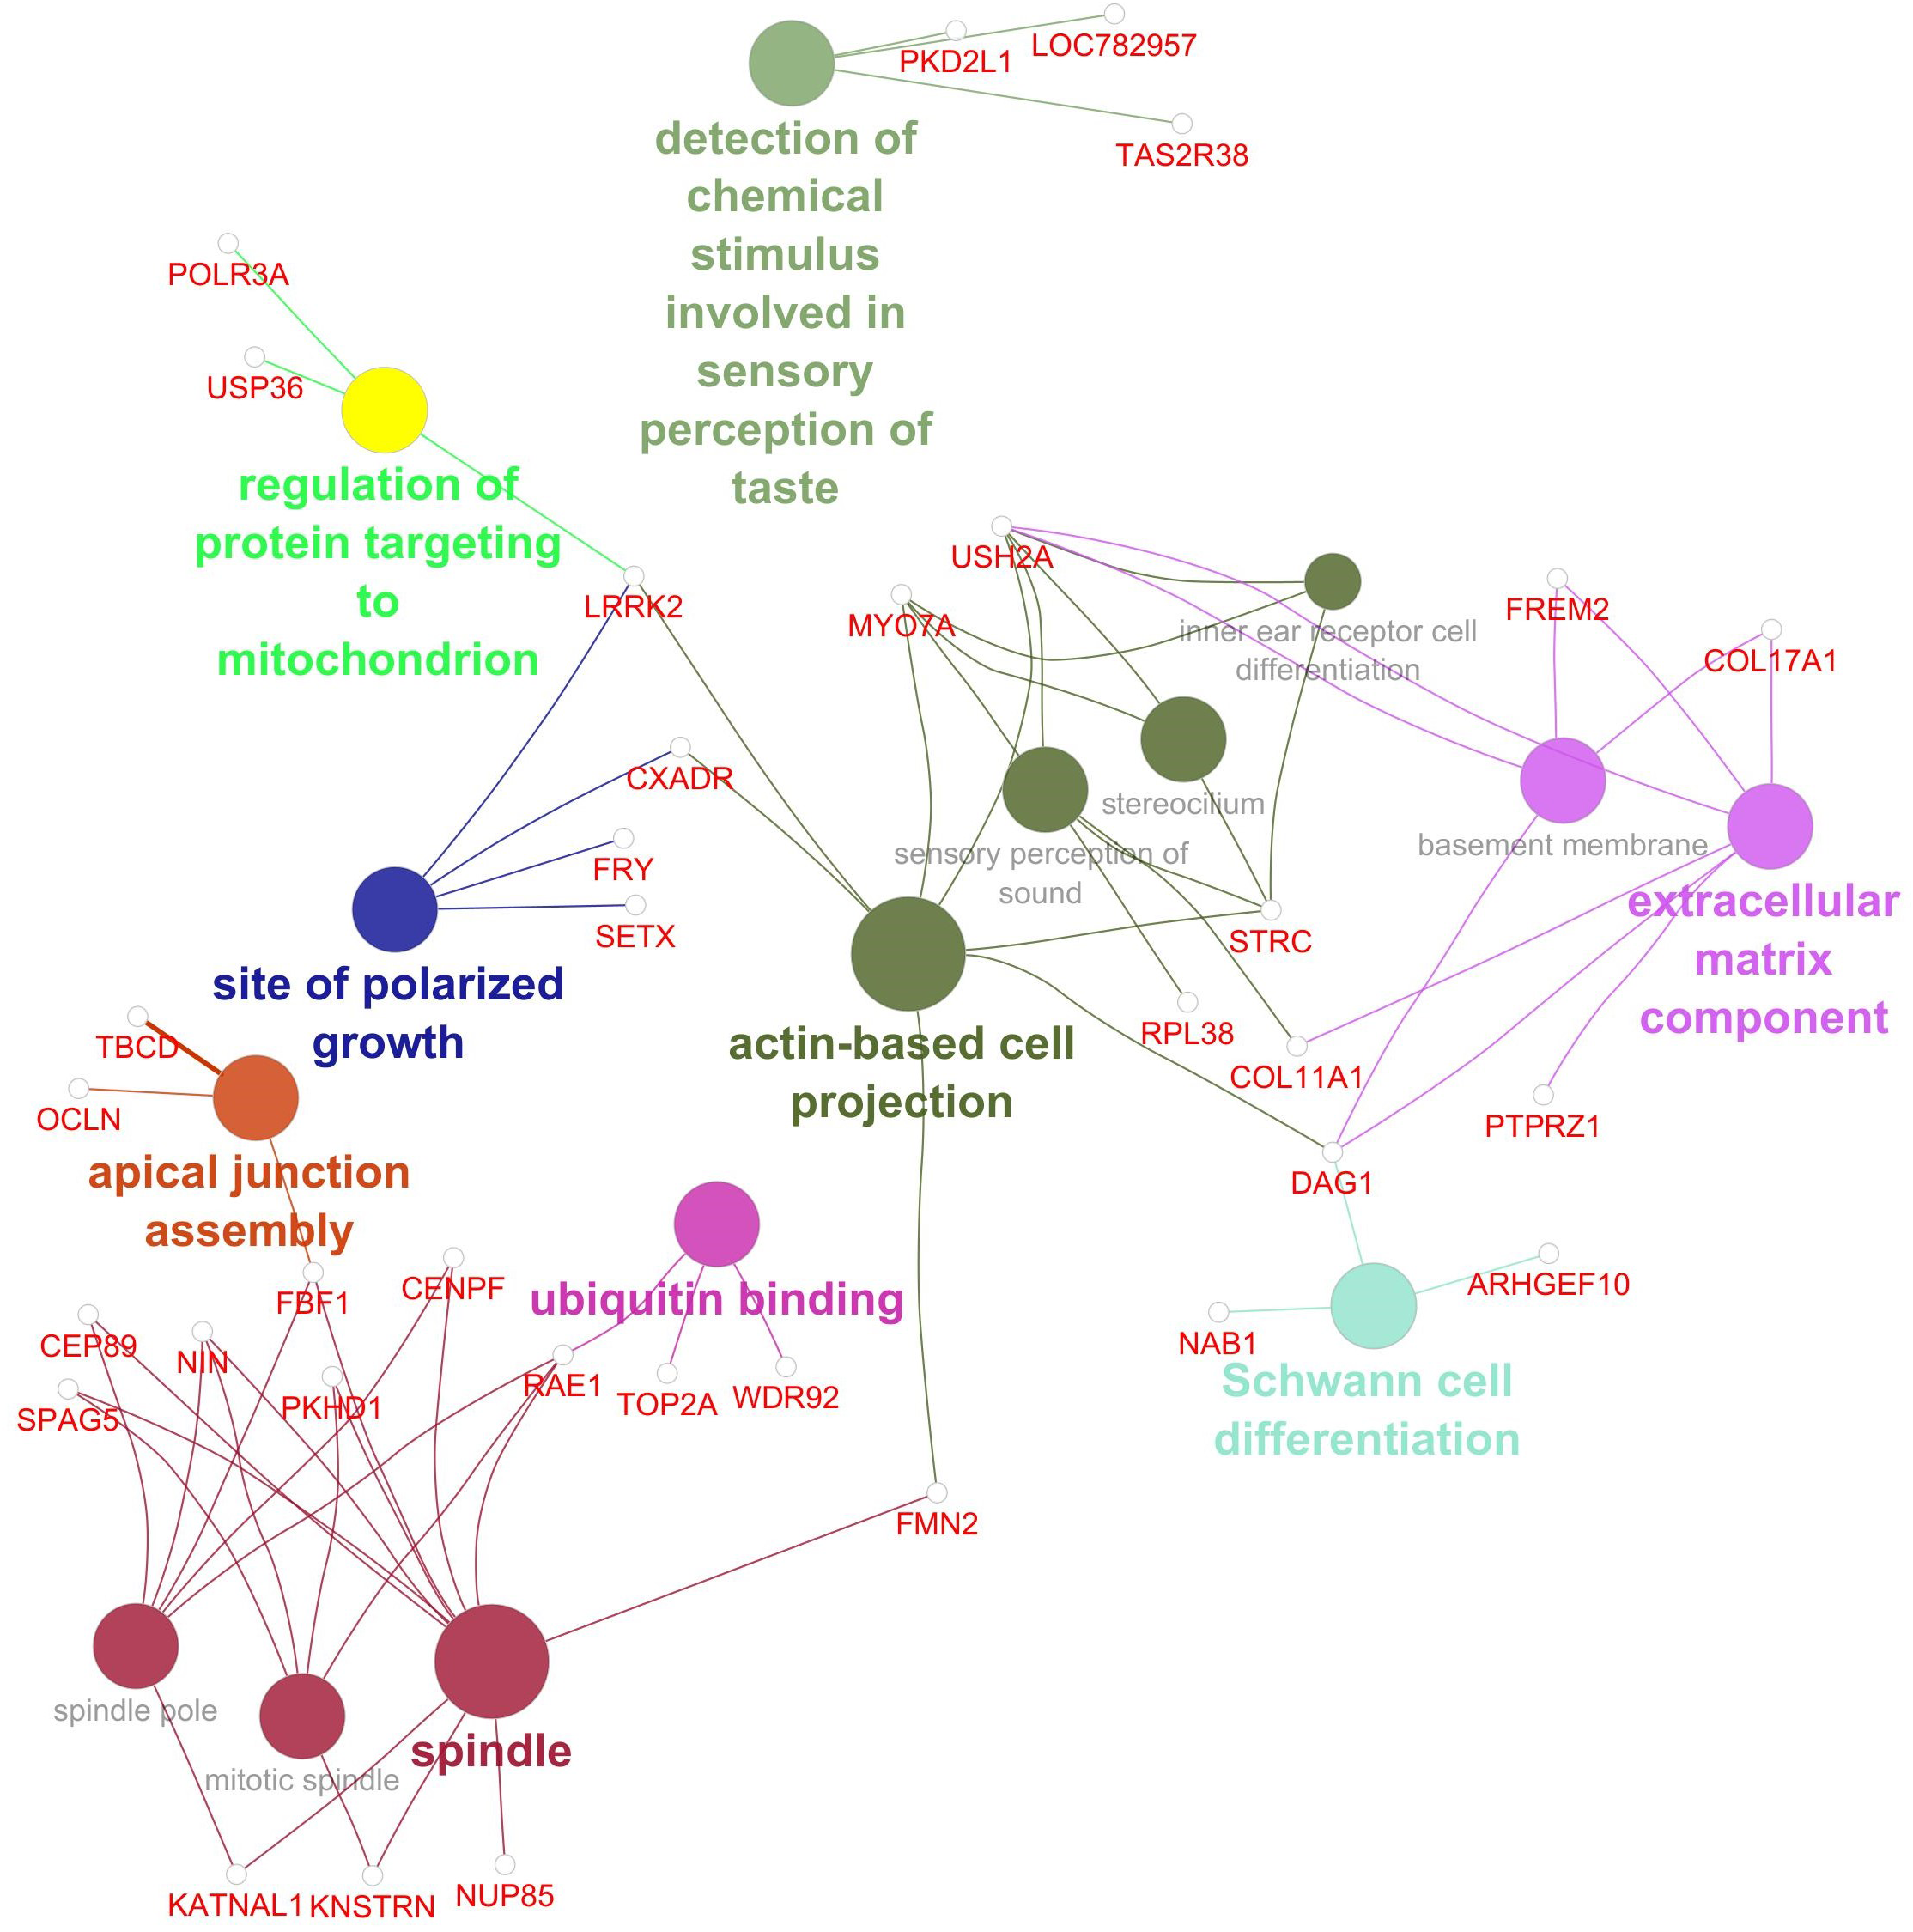
Gene network for Marbling. Network diagram illustrating various biological processes and activities with linked nodes representing genes and gene functions. Different colors and paths highlight relationships between processes, suggesting complex interactions.
Table 5
| Group | GO term | Genes |
|---|---|---|
| detection of chemical stimulus involved in sensory perception of taste | detection of chemical stimulus involved in sensory perception of taste | LOC782957, PKD2L1, TAS2R38 |
| regulation of protein targeting to mitochondrion | regulation of protein targeting to mitochondrion | LRRK2, POLR3A, USP36 |
| Schwann cell differentiation | Schwann cell differentiation | ARHGEF10, DAG1, NAB1 |
| site of polarized growth | site of polarized growth | CXADR, FRY, LRRK2, SETX |
| ubiquitin binding | ubiquitin binding | RAE1, TOP2A, WDR92 |
| apical junction assembly | apical junction assembly | FBF1, OCLN, TBCD |
| extracellular matrix component | extracellular matrix component | COL11A1, COL17A1, DAG1, FREM2, PTPRZ1, USH2A |
| basement membrane | COL17A1, DAG1, FREM2, USH2A | |
| spindle | spindle | CENPF, CEP89, FBF1, FMN2, KATNAL1, KNSTRN, NIN, NUP85, PKHD1, RAE1, SPAG5 |
| spindle pole | CENPF, CEP89, FBF1, KATNAL1, NIN, RAE1 | |
| mitotic spindle | KNSTRN, NIN, PKHD1, RAE1, SPAG5 | |
| actin-based cell projection | stereocilium | MYO7A, STRC, USH2A |
| actin-based cell projection | CXADR, DAG1, FMN2, LRRK2, MYO7A, STRC, USH2A | |
| sensory perception of sound | COL11A1, MYO7A, RPL38, STRC, USH2A | |
| inner ear receptor cell differentiation | MYO7A, STRC, USH2A |
GO terms of significant genes for marbling gene network.
Although GWAS was unable to identify any significant QTL for marbling at FDR = 0.2, gene network analysis identified 35 genes significantly associated with marbling and meat quality, reflecting its enhanced power to detect genes with small effects. Three of these genes were related to perception of taste, suggesting that cattle’s sensory response to feed may influence dietary preferences, intake, and consequently, fat deposition. Gene network analysis also identified 3 significant genes involved in ubiquitin binding. Previous studies have found that ubiquitination can affect postmortem protein degradation and meat quality (Zhao et al., 2025). Although not directly related to marbling, this finding may reflect the inclusion of meat quality traits such as tenderness in the analysis. These results highlight the power of gene network analysis to identify functionally relevant genes across correlated traits and emphasize the importance of trait selection in network construction.
A total of 136, 158, and 80 genes were located within 3 kb of the 201, 252, and 128 significant SNPs identified for palmitic, oleic, and linoleic acids, respectively. Using the association weight matrix (AWM) approach, 354 genes were associated with palmitic acid, 363 with oleic acid, and 315 with linoleic acid, including 264 genes significantly associated (P< 0.001) with at least three fatty acids. From these, 80, 90, and 72 genes were retained in the gene networks constructed for palmitic, oleic, and linoleic acids, respectively.
The gene network for palmitic acid (Figure 5) revealed functional enrichment in 37 GO terms, highlighting diverse biological processes and molecular functions. These included pathways related to RNA processing and energy metabolism (e.g., ATP-dependent RNA helicase activity), lipid uptake (scavenger receptor activity), cytoskeletal dynamics (microtubule organization), and cellular trafficking (coated vesicles). Additional enrichment was observed in processes linked to mitochondrial function, amino acid metabolism, and extracellular matrix composition. Several GO terms pointed to roles in cell structure and signaling, including cilium organization and photoreceptor cell maintenance, suggesting a broad spectrum of cellular functions influencing saturated fatty acid composition. Significant genes, GO terms, and GO term groups for SFA are given in Table 6.
Figure 5
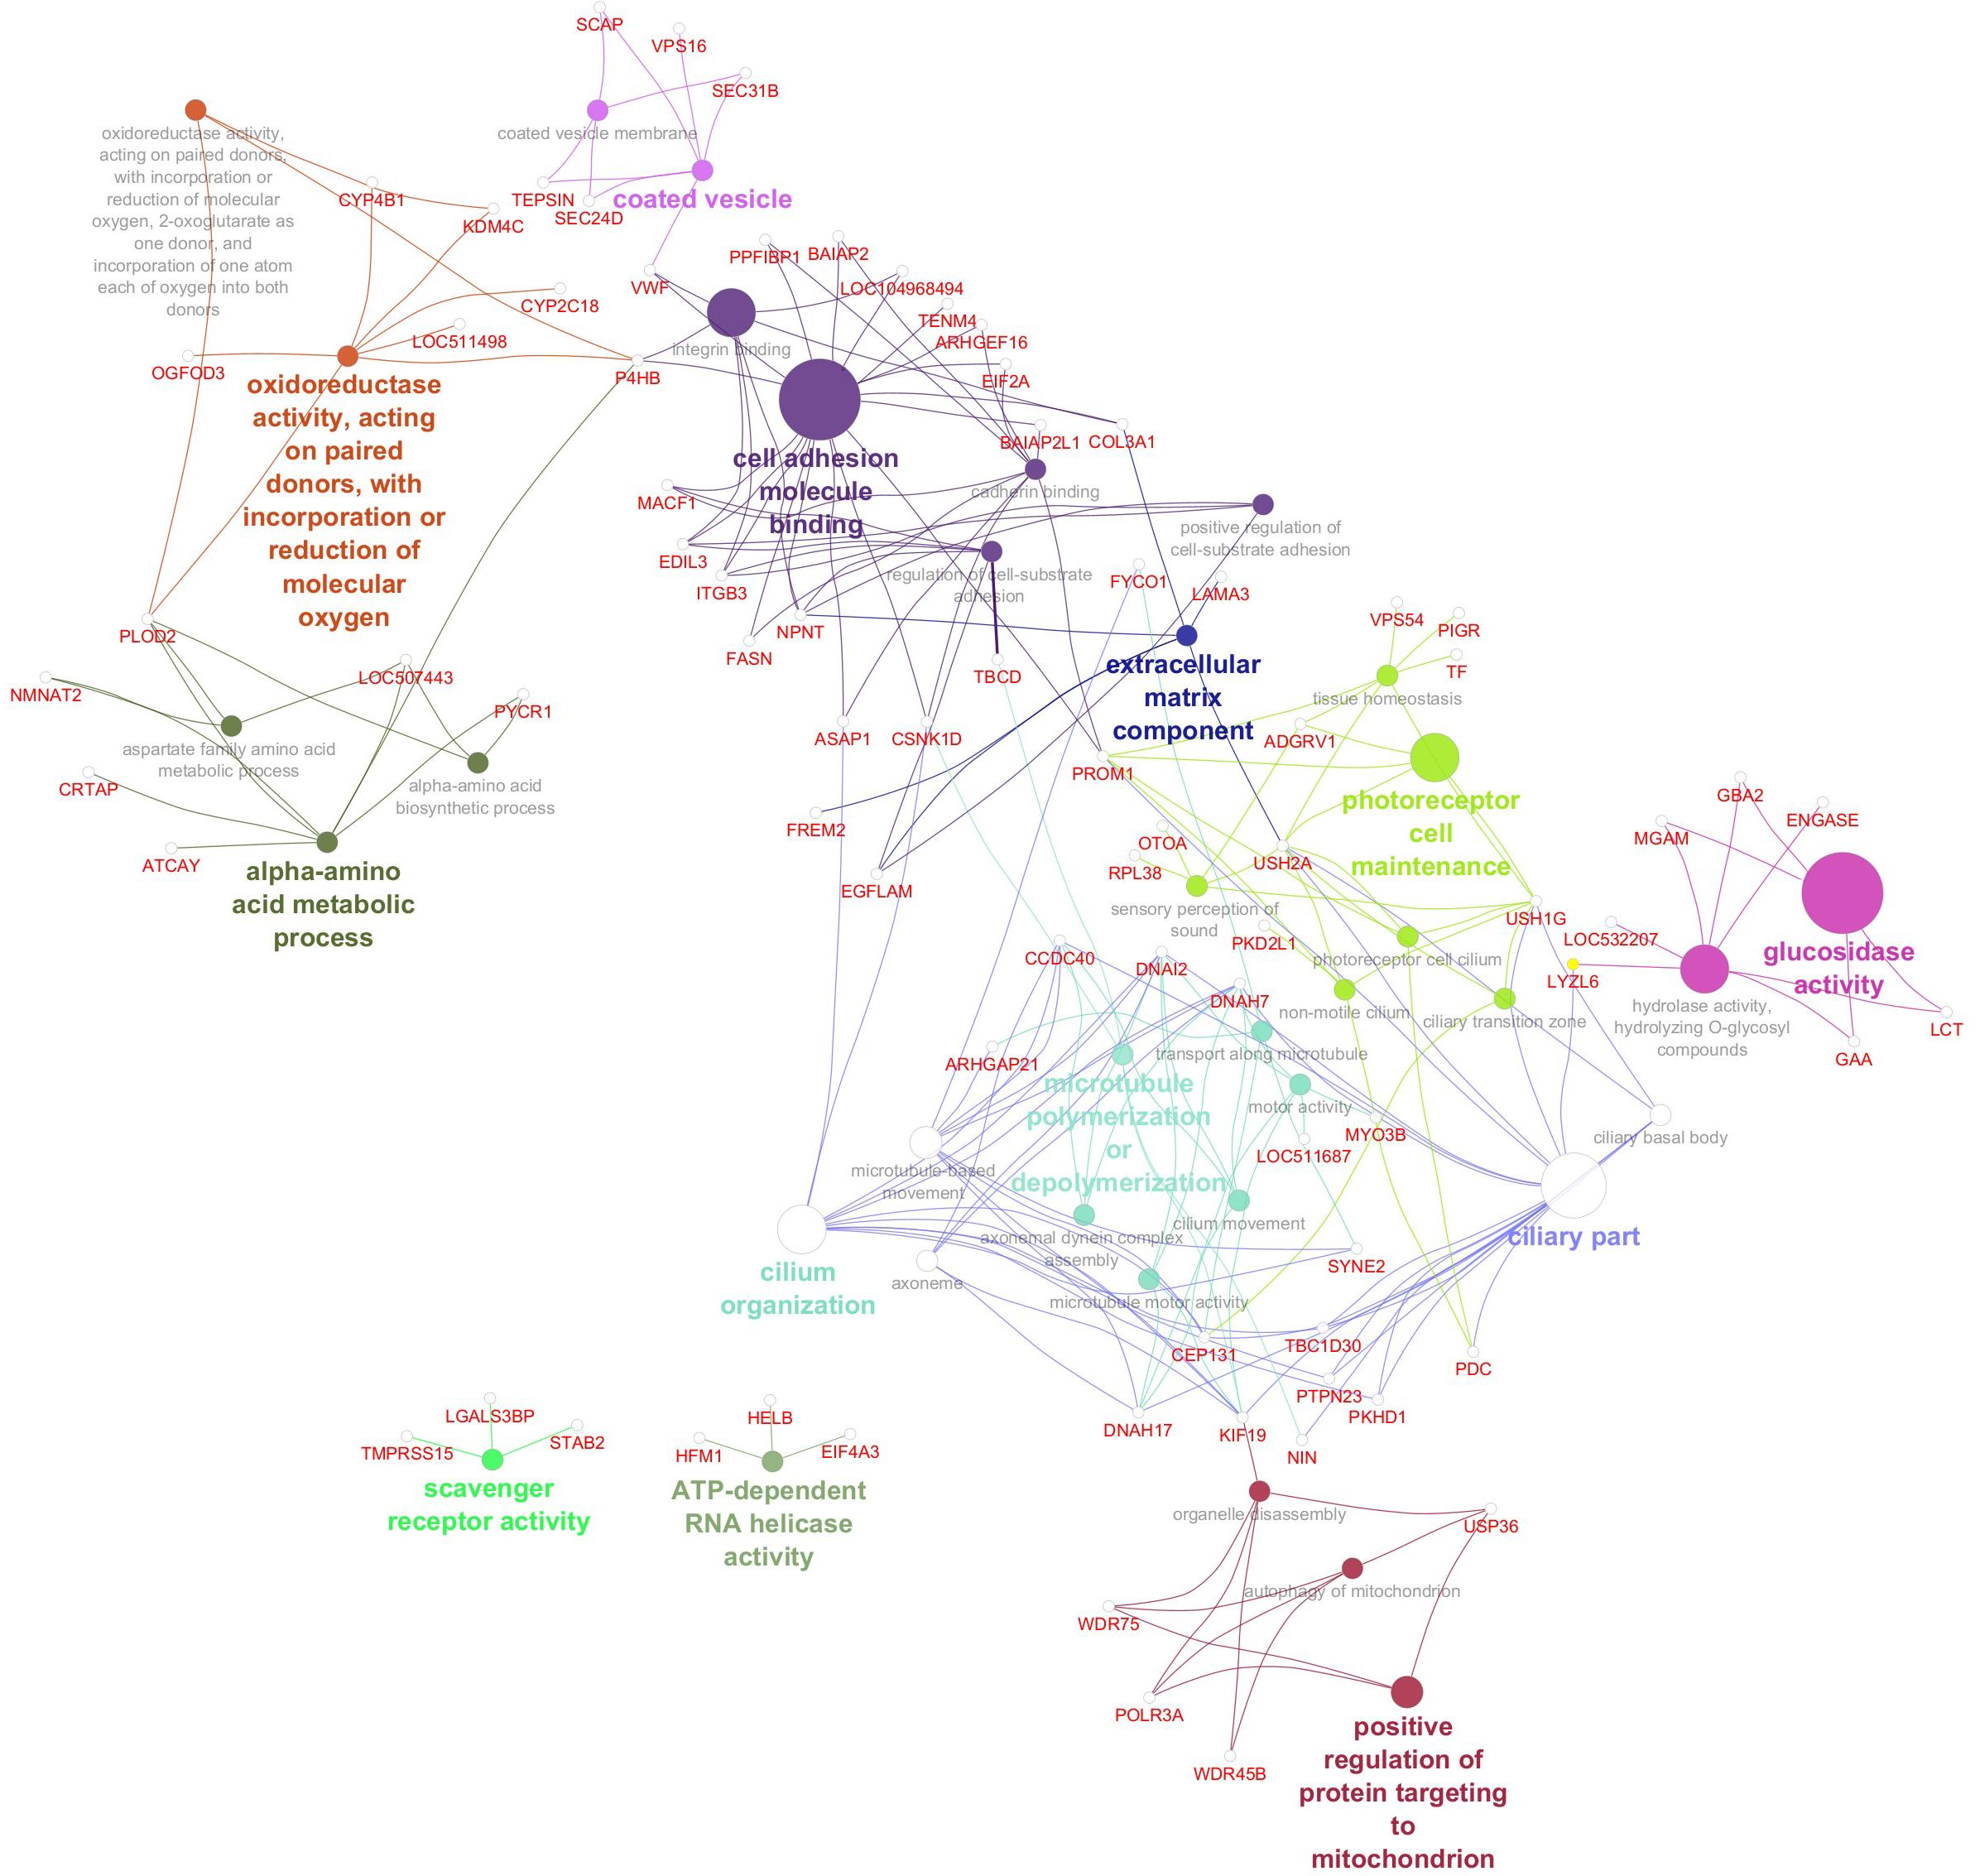
Gene network for saturated fatty acid percentage. Network diagram illustrating various biological processes and activities with linked nodes representing genes and gene functions. Different colors and paths highlight relationships between processes, suggesting complex interactions.
Table 6
| Group | GO term | Genes |
|---|---|---|
| ATP-dependent RNA helicase activity | ATP-dependent RNA helicase activity | EIF4A3, HELB, HFM1 |
| scavenger receptor activity | scavenger receptor activity | LGALS3BP, STAB2, TMPRSS15 |
| microtubule polymerization or depolymerization | microtubule polymerization or depolymerization | CSNK1D, KIF19, NIN, TBCD |
| extracellular matrix component | extracellular matrix component | COL3A1, EGFLAM, FREM2, LAMA3, NPNT, USH2A |
| glucosidase activity | hydrolase activity, hydrolyzing O-glycosyl compounds | ENGASE, GAA, GBA2, LCT, LOC532207, LYZL6, MGAM |
| glucosidase activity | GAA, GBA2, LCT, MGAM | |
| oxidoreductase activity, acting on paired donors, with incorporation or reduction of molecular oxygen | oxidoreductase activity, acting on paired donors, with incorporation or reduction of molecular oxygen | CYP2C18, CYP4B1, KDM4C, LOC511498, OGFOD3, P4HB, PLOD2 |
| oxidoreductase activity, acting on paired donors, with incorporation or reduction of molecular oxygen, 2-oxoglutarate as one donor, and incorporation of one atom each of oxygen into both donors | KDM4C, P4HB, PLOD2 | |
| coated vesicle | coated vesicle | SCAP, SEC24D, SEC31B, TEPSIN, VPS16, VWF |
| coated vesicle membrane | SCAP, SEC24D, SEC31B, TEPSIN | |
| positive regulation of protein targeting to mitochondrion | organelle disassembly | KIF19, POLR3A, USP36, WDR45B, WDR75 |
| autophagy of mitochondrion | POLR3A, USP36, WDR45B, WDR75 | |
| positive regulation of protein targeting to mitochondrion | POLR3A, USP36, WDR75 | |
| alpha-amino acid metabolic process | alpha-amino acid metabolic process | ATCAY, CRTAP, LOC507443, NMNAT2, P4HB, PLOD2, PYCR1 |
| aspartate family amino acid metabolic process | LOC507443, NMNAT2, PLOD2 | |
| alpha-amino acid biosynthetic process | LOC507443, PLOD2, PYCR1 | |
| ciliary part | microtubule-based movement | ARHGAP21, CCDC40, CEP131, DNAH17, DNAH7, DNAI2, FYCO1, KIF19, SYNE2 |
| ciliary part | CCDC40, CEP131, DNAH17, DNAH7, DNAI2, KIF19, LYZL6, NIN, PDC, PKHD1, PROM1, PTPN23, TBC1D30, USH1G, USH2A | |
| cilium organization | ASAP1, CCDC40, CEP131, CSNK1D, DNAH7, DNAI2, KIF19, PKHD1, PTPN23, SYNE2, TBC1D30 | |
| axoneme | CCDC40, DNAH17, DNAH7, DNAI2, KIF19 | |
| ciliary basal body | PKHD1, PTPN23, TBC1D30, USH1G, USH2A | |
| cell adhesion molecule binding | cell adhesion molecule binding | ARHGEF16, ASAP1, BAIAP2, BAIAP2L1, COL3A1, CSNK1D, EDIL3, EIF2A, FASN, ITGB3, LOC104968494, MACF1, NPNT, P4HB, PPFIBP1, PROM1, TENM4, VWF |
| regulation of cell-substrate adhesion | EDIL3, EGFLAM, ITGB3, MACF1, NPNT, TBCD | |
| integrin binding | COL3A1, EDIL3, ITGB3, LOC104968494, NPNT, P4HB, VWF | |
| positive regulation of cell-substrate adhesion | EDIL3, EGFLAM, ITGB3, NPNT | |
| cadherin binding | ARHGEF16, ASAP1, BAIAP2, BAIAP2L1, CSNK1D, EIF2A, FASN, MACF1, PPFIBP1, PROM1 | |
| tissue homeostasis | ADGRV1, PIGR, PROM1, TF, USH1G, USH2A, VPS54 | |
| ciliary part | CCDC40, CEP131, DNAH17, DNAH7, DNAI2, KIF19, LYZL6, NIN, PDC, PKHD1, PROM1, PTPN23, TBC1D30, USH1G, USH2A | |
| photoreceptor cell maintenance | photoreceptor cell maintenance | ADGRV1, PROM1, USH1G, USH2A |
| non-motile cilium | PDC, PKD2L1, PROM1, USH1G, USH2A | |
| ciliary transition zone | CEP131, USH1G, USH2A | |
| sensory perception of sound | ADGRV1, OTOA, RPL38, USH1G, USH2A | |
| photoreceptor cell cilium | PDC, PROM1, USH1G, USH2A | |
| ciliary basal body | PKHD1, PTPN23, TBC1D30, USH1G, USH2A | |
| cilium organization | microtubule-based movement | ARHGAP21, CCDC40, CEP131, DNAH17, DNAH7, DNAI2, FYCO1, KIF19, SYNE2 |
| cilium movement | CCDC40, DNAH17, DNAH7, DNAI2 | |
| ciliary part | CCDC40, CEP131, DNAH17, DNAH7, DNAI2, KIF19, LYZL6, NIN, PDC, PKHD1, PROM1, PTPN23, TBC1D30, USH1G, USH2A | |
| cilium organization | ASAP1, CCDC40, CEP131, CSNK1D, DNAH7, DNAI2, KIF19, PKHD1, PTPN23, SYNE2, TBC1D30 | |
| transport along microtubule | ARHGAP21, CEP131, FYCO1, SYNE2 | |
| axoneme | CCDC40, DNAH17, DNAH7, DNAI2, KIF19 | |
| axonemal dynein complex assembly | CCDC40, DNAH7, DNAI2 | |
| motor activity | DNAH17, DNAH7, DNAI2, KIF19, LOC511687, MYO3B | |
| microtubule motor activity | DNAH17, DNAH7, DNAI2, KIF19 |
GO terms of significant genes for SFA gene network.
The gene network associated with oleic acid (Figure 6) revealed enrichment for 41 significant GO terms, underscoring the multifaceted regulation of monounsaturated fatty acid metabolism. These included pathways involved in intracellular transport (e.g., vacuolar and vesicle-mediated processes), signal transduction (e.g., Ras signaling and negative regulation of the canonical Wnt pathway), and epigenetic regulation (e.g., methylated histone binding and acetyltransferase activity). Functions related to amino acid biosynthesis, RNA helicase activity, and scavenger receptor activity further reflect the metabolic complexity underpinning oleic acid variability. Several GO terms implicated cytoskeletal remodeling (e.g., lamellipodium assembly and microtubule dynamics) and sensory biology, such as taste perception and retinal homeostasis, suggesting broader physiological connections beyond lipid metabolism. Significant genes, GO terms, and GO term groups for MUFA are given in Table 7.
Figure 6
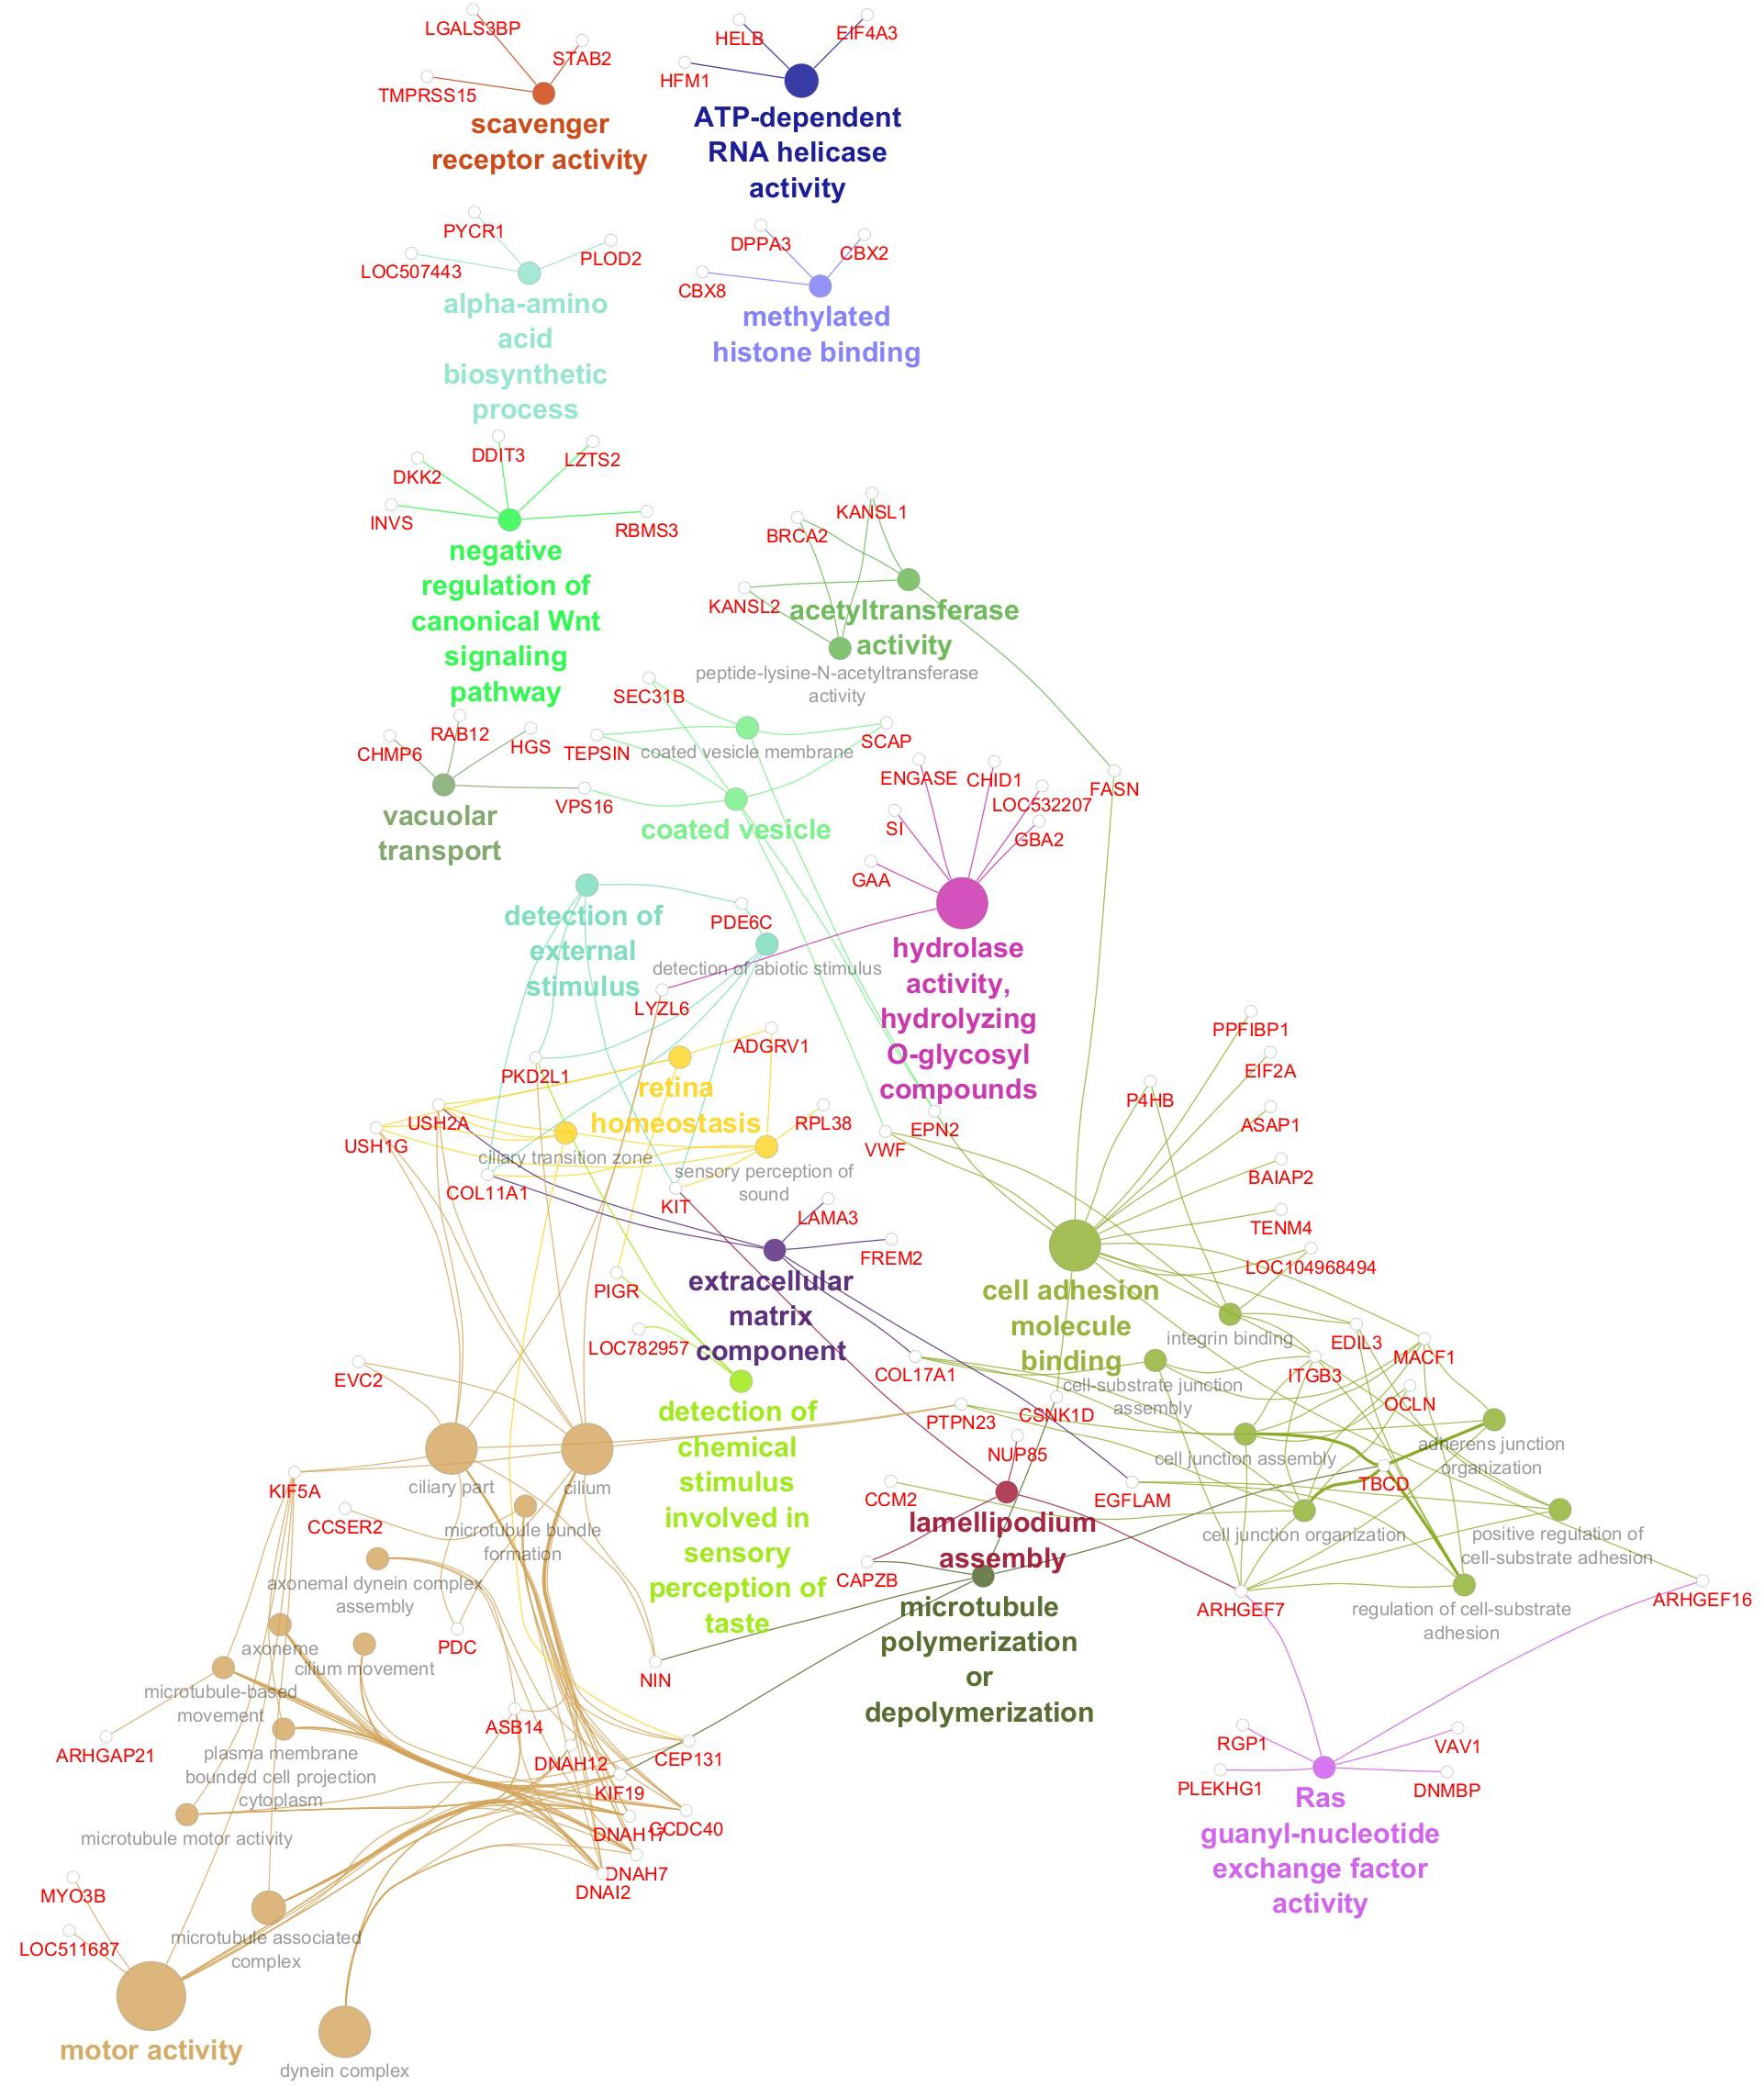
Gene network for monounsaturated fatty acid percentage. Network diagram illustrating various biological processes and activities with linked nodes representing genes and gene functions. Different colors and paths highlight relationships between processes, suggesting complex interactions.
Table 7
| Group | GO term | Genes |
|---|---|---|
| vacuolar transport | vacuolar transport | CHMP6, HGS, RAB12, VPS16 |
| negative regulation of canonical Wnt signaling pathway | negative regulation of canonical Wnt signaling pathway | DDIT3, DKK2, INVS, LZTS2, RBMS3 |
| alpha-amino acid biosynthetic process | alpha-amino acid biosynthetic process | LOC507443, PLOD2, PYCR1 |
| ATP-dependent RNA helicase activity | ATP-dependent RNA helicase activity | EIF4A3, HELB, HFM1 |
| hydrolase activity, hydrolyzing O-glycosyl compounds | hydrolase activity, hydrolyzing O-glycosyl compounds | CHID1, ENGASE, GAA, GBA2, LOC532207, LYZL6, SI |
| scavenger receptor activity | scavenger receptor activity | LGALS3BP, STAB2, TMPRSS15 |
| Ras guanyl-nucleotide exchange factor activity | Ras guanyl-nucleotide exchange factor activity | ARHGEF16, ARHGEF7, DNMBP, PLEKHG1, RGP1, VAV1 |
| lamellipodium assembly | lamellipodium assembly | ARHGEF7, CAPZB, KIT, NUP85 |
| microtubule polymerization or depolymerization | microtubule polymerization or depolymerization | CAPZB, CSNK1D, KIF19, NIN, TBCD |
| methylated histone binding | methylated histone binding | CBX2, CBX8, DPPA3 |
| extracellular matrix component | extracellular matrix component | COL11A1, COL17A1, EGFLAM, FREM2, LAMA3, USH2A |
| detection of chemical stimulus involved in sensory perception of taste | detection of chemical stimulus involved in sensory perception of taste | LOC782957, PIGR, PKD2L1 |
| detection of external stimulus | detection of external stimulus | COL11A1, KIT, PDE6C, PKD2L1 |
| detection of abiotic stimulus | COL11A1, KIT, PDE6C, PKD2L1 | |
| acetyltransferase activity | acetyltransferase activity | BRCA2, FASN, KANSL1, KANSL2 |
| peptide-lysine-N-acetyltransferase activity | BRCA2, KANSL1, KANSL2 | |
| coated vesicle | coated vesicle | EPN2, SCAP, SEC31B, TEPSIN, VPS16, VWF |
| coated vesicle membrane | EPN2, SCAP, SEC31B, TEPSIN | |
| retina homeostasis | retina homeostasis | ADGRV1, PIGR, USH1G, USH2A |
| ciliary transition zone | CEP131, USH1G, USH2A | |
| sensory perception of sound | ADGRV1, COL11A1, KIT, RPL38, USH1G, USH2A | |
| cell adhesion molecule binding | cell junction organization | ARHGEF7, CCM2, COL17A1, ITGB3, MACF1, OCLN, PTPN23, TBCD |
| cell adhesion molecule binding | ARHGEF16, ASAP1, BAIAP2, CSNK1D, EDIL3, EIF2A, EPN2, FASN, ITGB3, LOC104968494, MACF1, P4HB, PPFIBP1, TENM4, VWF | |
| regulation of cell-substrate adhesion | ARHGEF7, EDIL3, EGFLAM, ITGB3, MACF1, TBCD | |
| integrin binding | EDIL3, ITGB3, LOC104968494, P4HB, VWF | |
| positive regulation of cell-substrate adhesion | ARHGEF7, EDIL3, EGFLAM, ITGB3 | |
| cell junction assembly | ARHGEF7, COL17A1, ITGB3, MACF1, OCLN, TBCD | |
| cell-substrate junction assembly | ARHGEF7, COL17A1, ITGB3, MACF1 | |
| adherens junction organization | ARHGEF7, MACF1, PTPN23, TBCD | |
| motor activity | microtubule-based movement | ARHGAP21, CCDC40, CEP131, DNAH17, DNAH7, DNAI2, KIF19, KIF5A |
| cilium | ASB14, CCDC40, CEP131, DNAH12, DNAH17, DNAH7, DNAI2, EVC2, KIF19, KIF5A, LYZL6, NIN, PDC, PKD2L1, PTPN23, USH1G, USH2A | |
| cilium movement | CCDC40, DNAH17, DNAH7, DNAI2 | |
| ciliary part | CCDC40, CEP131, DNAH17, DNAH7, DNAI2, EVC2, KIF19, KIF5A, LYZL6, NIN, PDC, PTPN23, USH1G, USH2A | |
| microtubule bundle formation | CCDC40, CCSER2, DNAH7, DNAI2 | |
| microtubule associated complex | ASB14, DNAH12, DNAH17, DNAH7, DNAI2, KIF19, KIF5A | |
| plasma membrane bounded cell projection cytoplasm | CCDC40, DNAH17, DNAH7, DNAI2, KIF19, KIF5A | |
| axoneme | CCDC40, DNAH17, DNAH7, DNAI2, KIF19 | |
| dynein complex | ASB14, DNAH12, DNAH17, DNAH7, DNAI2 | |
| axonemal dynein complex assembly | CCDC40, DNAH7, DNAI2 | |
| motor activity | ASB14, DNAH12, DNAH17, DNAH7, DNAI2, KIF19, KIF5A, LOC511687, MYO3B | |
| microtubule motor activity | DNAH17, DNAH7, DNAI2, KIF19, KIF5A |
GO terms of significant genes for MUFA gene network.
The gene network associated with linoleic acid (Figure 7) included 30 significantly enriched GO terms, reflecting diverse molecular functions and cellular processes potentially influencing polyunsaturated fatty acid composition. Key pathways included amino acid biosynthesis, mRNA metabolic regulation, and ATP-dependent RNA helicase activity—indicating active transcriptional and translational control. Enrichment in scavenger receptor and hydrolase activity points to roles in lipid uptake and metabolism. Additional functional categories involved cytoskeletal organization (e.g., microtubule dynamics, myosin binding, and centriole components), membrane trafficking (e.g., coated vesicle membrane), and protein turnover (e.g., ubiquitin binding). Interestingly, GO terms related to neuromuscular coordination, retinal function, and ciliary structures suggest potential cross-talk between lipid metabolism and broader physiological systems. Significant genes, GO terms, and GO term groups for PUFA are given in Table 8.
Figure 7
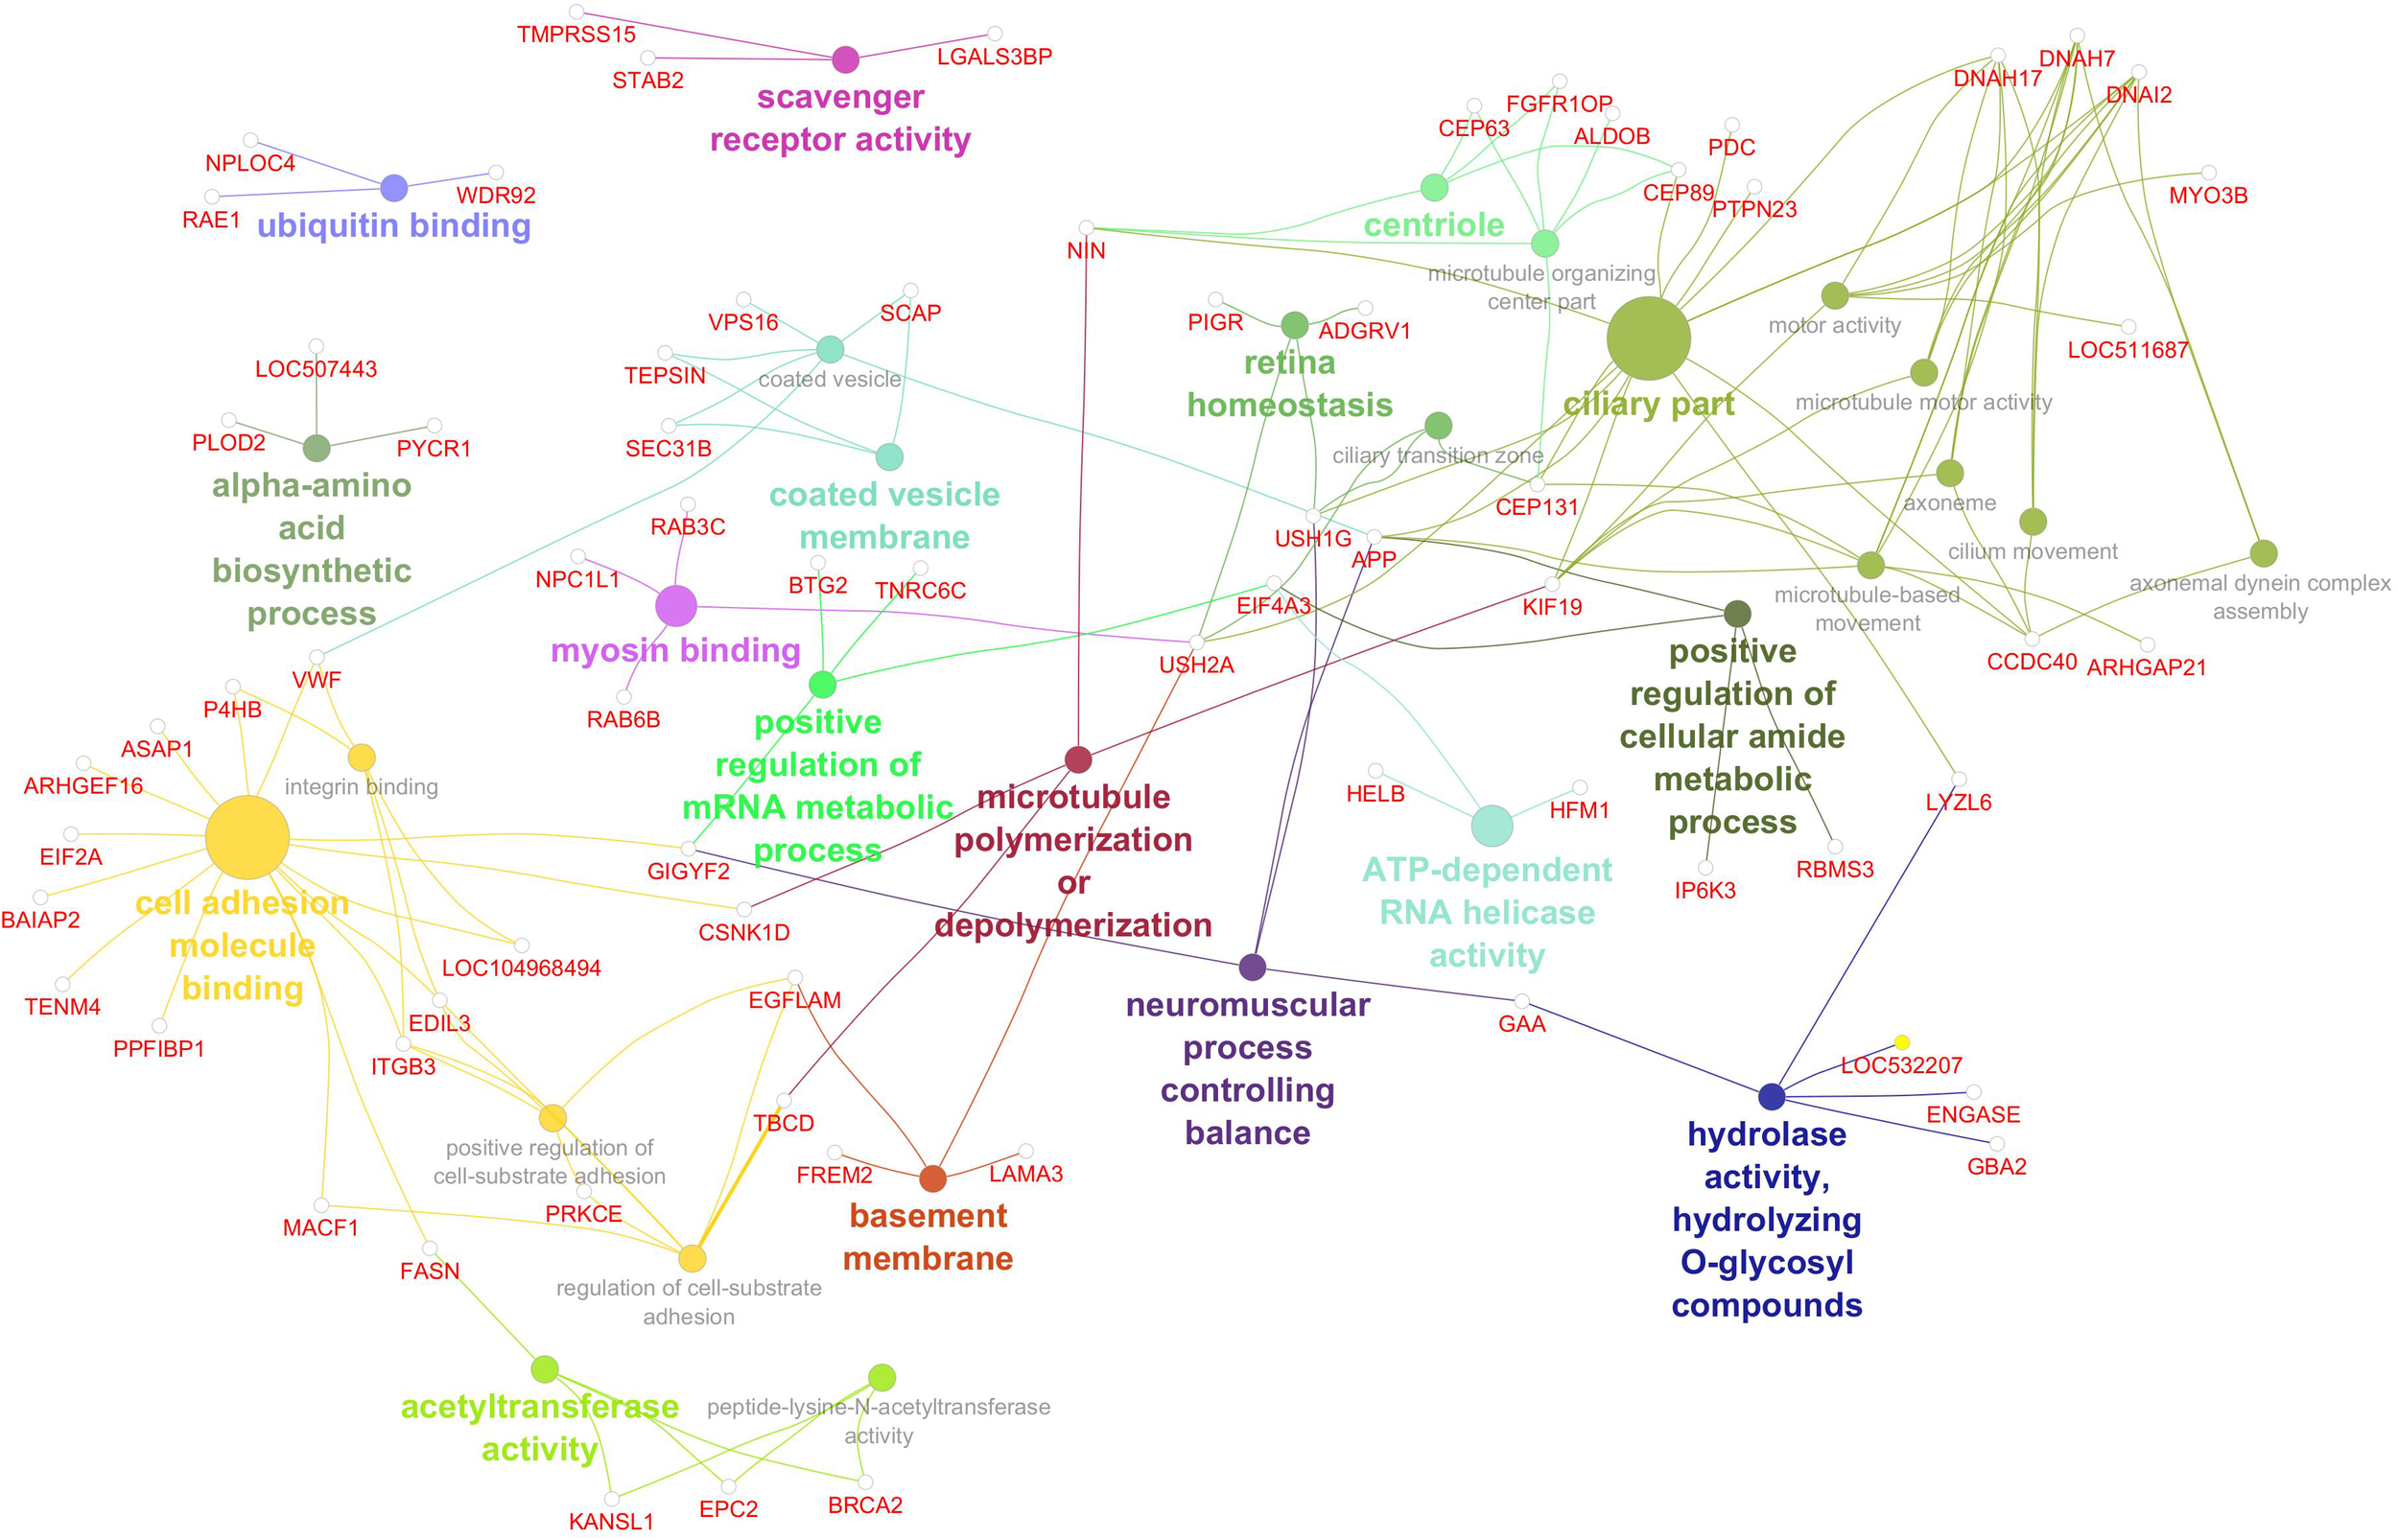
Gene network for polyunsaturated fatty acid percentage. Network diagram illustrating various biological processes and activities with linked nodes representing genes and gene functions. Different colors and paths highlight relationships between processes, suggesting complex interactions.
Table 8
| Group | GO term | Genes |
|---|---|---|
| alpha-amino acid biosynthetic process | alpha-amino acid biosynthetic process | LOC507443, PLOD2, PYCR1 |
| positive regulation of mRNA metabolic process | positive regulation of mRNA metabolic process | BTG2, EIF4A3, GIGYF2, TNRC6C |
| ATP-dependent RNA helicase activity | ATP-dependent RNA helicase activity | EIF4A3, HELB, HFM1 |
| hydrolase activity, hydrolyzing O-glycosyl compounds | hydrolase activity, hydrolyzing O-glycosyl compounds | ENGASE, GAA, GBA2, LOC532207, LYZL6 |
| scavenger receptor activity | scavenger receptor activity | LGALS3BP, STAB2, TMPRSS15 |
| basement membrane | basement membrane | EGFLAM, FREM2, LAMA3, USH2A |
| myosin binding | myosin binding | NPC1L1, RAB3C, RAB6B, USH2A |
| microtubule polymerization or depolymerization | microtubule polymerization or depolymerization | CSNK1D, KIF19, NIN, TBCD |
| positive regulation of cellular amide metabolic process | positive regulation of cellular amide metabolic process | APP, EIF4A3, IP6K3, RBMS3 |
| ubiquitin binding | ubiquitin binding | NPLOC4, RAE1, WDR92 |
| neuromuscular process controlling balance | neuromuscular process controlling balance | APP, GAA, GIGYF2, USH1G |
| acetyltransferase activity | acetyltransferase activity | BRCA2, EPC2, FASN, KANSL1 |
| peptide-lysine-N-acetyltransferase activity | BRCA2, EPC2, KANSL1 | |
| coated vesicle membrane | coated vesicle | APP, SCAP, SEC31B, TEPSIN, VPS16, VWF |
| coated vesicle membrane | SCAP, SEC31B, TEPSIN | |
| retina homeostasis | retina homeostasis | ADGRV1, PIGR, USH1G, USH2A |
| ciliary transition zone | CEP131, USH1G, USH2A | |
| centriole | microtubule organizing center part | ALDOB, CEP131, CEP63, CEP89, FGFR1OP, NIN |
| centriole | CEP63, CEP89, FGFR1OP, NIN | |
| cell adhesion molecule binding | cell adhesion molecule binding | ARHGEF16, ASAP1, BAIAP2, CSNK1D, EDIL3, EIF2A, FASN, GIGYF2, ITGB3, LOC104968494, MACF1, P4HB, PPFIBP1, TENM4, VWF |
| regulation of cell-substrate adhesion | EDIL3, EGFLAM, ITGB3, MACF1, PRKCE, TBCD | |
| integrin binding | EDIL3, ITGB3, LOC104968494, P4HB, VWF | |
| positive regulation of cell-substrate adhesion | EDIL3, EGFLAM, ITGB3, PRKCE | |
| ciliary part | microtubule-based movement | APP, ARHGAP21, CCDC40, CEP131, DNAH17, DNAH7, DNAI2, KIF19 |
| cilium movement | CCDC40, DNAH17, DNAH7, DNAI2 | |
| ciliary part | APP, CCDC40, CEP131, CEP89, DNAH17, DNAH7, DNAI2, KIF19, LYZL6, NIN, PDC, PTPN23, USH1G, USH2A | |
| axoneme | CCDC40, DNAH17, DNAH7, DNAI2, KIF19 | |
| axonemal dynein complex assembly | CCDC40, DNAH7, DNAI2 | |
| motor activity | DNAH17, DNAH7, DNAI2, KIF19, LOC511687, MYO3B | |
| microtubule motor activity | DNAH17, DNAH7, DNAI2, KIF19 |
GO terms of significant genes for PUFA gene network.
The gene networks constructed for palmitic (SFA), oleic (MUFA), and linoleic acid (PUFA) consistently identified HELB and FASN as significant genes, aligning with GWAS findings for SFA and MUFA. Across all three networks, GO terms were significantly enriched: 1) scavenger receptor activity, 2) alpha-amino acid biosynthetic process, 3) ciliary transition zone, and 4) axoneme. Class B scavenger receptors play a key role in the uptake and transport of fatty acids from the bloodstream into cells by acting as fatty acid transporters. Although the alpha-amino acid biosynthetic process does not directly produce fatty acids, deaminated amino acids can feed into the fatty acid synthesis pathway. Notably, several genes contributing to this GO term are involved in adipose development, including PLOD2, which has been associated with fat mass in humans (Van den Langenbergh et al., 2024). Several genes related to the ciliary transition zone and the axoneme – the core structure of cilia – were also found to be significant across all three fatty acid gene networks. Emerging evidence suggests that cilia in adipose tissue may regulate the fate of adipocyte progenitor cells, and reduced cilia length in adipose tissue has been associated with obesity in humans (Wu et al., 2023). Furthermore, several genes related to microtubule motor activity, microtubule-based movement, and microtubule polymerization and depolymerization were significantly associated with all three fatty acid gene networks. These processes are critical for intracellular lipid trafficking, including the movement of lipid droplets, underscoring the cytoskeletal contributions to fatty acid metabolism.
Although GO term information was compiled specifically for the Bos taurus species so that GO terms would be relevant to the species, it is important to note that genes have multiple functions and pathways therefore GO terms found to be associated with the traits of interest may not be directly related but simply have genes in common. It is also important to note that fatty acid composition of meat is a highly complex trait and there may be genes and pathways that are relevant although their relevance may not be obvious or well understood yet.
GO term enrichment was performed using annotations specific to the Bos taurus genome to make it relevant for this species. However, genes often have pleiotropic functions and may participate in multiple biological pathways, which can lead to the inclusion of terms that appear tangential. Additionally, given the complex and polygenic nature of fatty acid composition, it is possible that genes and pathways not traditionally associated with lipid metabolism may still play meaningful roles.
Conclusions
Single-trait genome-wide association identified several genomic regions influencing fatty acid composition in beef. Among the key candidates, FASN plays a direct role in fatty acid biosynthesis, whereas HELB, PLAG1, and LZTS2 are likely to exert regulatory effects through their involvement in cell cycle control and growth-related pathways. In adipose tissue, these regulatory functions may influence lipid accumulation and marbling. Gene network analysis not only corroborated GWAS findings but also uncovered additional genes with smaller effects that did not surpass genome-wide significance threshold. Notably, this approach revealed numerous genes involved in fatty acid uptake and intracellular lipid transport, further highlighting the multifactorial and interconnected biological processes governing beef fatty acid composition.
Statements
Data availability statement
The original contributions presented in the study are included in the article/Supplementary Material. Further inquiries can be directed to the corresponding author.
Ethics statement
The animal studies were approved by University of Florida Institutional Animal Care and Use Committee number 201003744. The studies were conducted in accordance with the local legislation and institutional requirements. Written informed consent was obtained from the owners for the participation of their animals in this study.
Author contributions
ER: Data curation, Formal analysis, Investigation, Methodology, Supervision, Visualization, Writing – original draft, Writing – review & editing. JL-G: Writing – review & editing. CC: Resources, Writing – review & editing. RM: Conceptualization, Funding acquisition, Resources, Supervision, Writing – review & editing.
Funding
The author(s) declare that financial support was received for the research and/or publication of this article. This research was supported by UF Agricultural Experimental Station (FLA-ANS-005548).
Acknowledgments
Authors thank the owners and staff of the Seminole Tribe of Florida for their participation in this study.
Conflict of interest
The authors declare that the research was conducted in the absence of any commercial or financial relationships that could be construed as a potential conflict of interest.
The author(s) declared that they were an editorial board member of Frontiers, at the time of submission. This had no impact on the peer review process and the final decision.
Generative AI statement
The author(s) declare that no Generative AI was used in the creation of this manuscript.
Publisher’s note
All claims expressed in this article are solely those of the authors and do not necessarily represent those of their affiliated organizations, or those of the publisher, the editors and the reviewers. Any product that may be evaluated in this article, or claim that may be made by its manufacturer, is not guaranteed or endorsed by the publisher.
Supplementary material
The Supplementary Material for this article can be found online at: https://www.frontiersin.org/articles/10.3389/fanim.2025.1641988/full#supplementary-material
References
1
Bartoň L. Bureš D. Kott T. Řehák D. (2016). Associations of polymorphisms in bovine DGAT1, FABP4, FASN, and PPARGC1A genes with intramuscular fat content and the fatty acid composition of muscle and subcutaneous fat in Fleckvieh bulls. Meat Sci.114, 18–23. doi: 10.1016/j.meatsci.2015.12.004
2
Bindea G. Galon J. Mlecnik B. (2013). CluePedia Cytoscape plugin: pathway insights using integrated experimental and in silico data. Bioinf.29, 661. doi: 10.1093/bioinformatics/btt019
3
Bindea G. Mlecnik B. Hackl H. Charoentong P. Tosolini M. Kirilovsky A. et al . (2009). ClueGO: a Cytoscape plug-in to decipher functionally grouped gene ontology and pathway annotation networks. Bioinformatics25, 1091. doi: 10.1093/bioinformatics/btp101
4
Consortium T. G. O. Ashburner M. Ball C. A. Blake J. A. Botstein D. Butler H. et al . (2000). Gene Ontology: tool for the unification of biology. Nat. Genet.25, 25. doi: 10.1038/75556
5
Daley C. A. Abbott A. Doyle P. S. Nader G. A. Larson S. (2010). A review of fatty acid profiles and antioxidant content in grass-fed and grain-fed beef. Nutr. J.9, 10. doi: 10.1186/1475-2891-9-10
6
Emerson M. R. Woerner D. R. Belk K. E. Tatum J. D. (2013). Effectiveness of USDA instrument-based marbling measurements for categorizing beef carcasses according to differences in longissimus muscle sensory attributes1. J. Anim. Sci.91, 1024–1034. doi: 10.2527/jas.2012-5514
7
Enser M. Hallett K. G. Hewett B. Fursey G. A. J. Wood J. D. Harrington G. (1998). Fatty acid content and composition of UK beef and lamb muscle in relation to production system and implications for human nutrition. Meat Sci.49, 329–341. doi: 10.1016/S0309-1740(97)00144-7
8
Flowers S. Hamblen H. Leal-Gutiérrez J. D. Elzo M. A. Johnson D. D. Mateescu R. G. (2018). Fatty acid profile, mineral content, and palatability of beef from a multibreed Angus–Brahman population1. J. Anim. Sci.96, 4264–4275. doi: 10.1093/jas/sky300
9
Fortes M. R. S. Kemper K. Sasazaki S. Reverter A. Pryce J. E. Barendse W. et al . (2013). Evidence for pleiotropism and recent selection in the PLAG1 region in Australian Beef cattle. Anim. Genet.44, 636–647. doi: 10.1111/age.12075
10
Fortes M. R. S. Reverter A. Zhang Y. Collis E. Nagaraj S. H. Jonsson N. N. et al . (2010). Association weight matrix for the genetic dissection of puberty in beef cattle. Proc. Natl. Acad. Sci. United States America107, 13642. doi: 10.1073/pnas.1002044107
11
Hunt M. R. Garmyn A. J. O’Quinn T. G. Corbin C. H. Legako J. F. Rathmann R. J. et al . (2014). Consumer assessment of beef palatability from four beef muscles from USDA Choice and Select graded carcasses. Meat Sci.98, 1–8. doi: 10.1016/j.meatsci.2014.04.004
12
Ludwig D. S. Willett W. C. Volek J. S. Neuhouser M. L. (2018). Dietary fat: From foe to friend? Science362, 764–770. doi: 10.1126/science.aau2096
13
Mateescu R. G. Garrick D. J. Reecy J. M. (2017). Network analysis reveals putative genes affecting meat quality in angus cattle. Front. Genet.8. doi: 10.3389/fgene.2017.00171
14
Misztal I. Tsuruta S. Lourenco D. A. L. Aguilar I. Legarra A. Vitezica Z. (2014). Manual for BLUPF90 family of programs.
15
Nishimura S. Watanabe T. Mizoshita K. Tatsuda K. Fujita T. Watanabe N. et al . (2012). Genome-wide association study identified three major QTL for carcass weight including the PLAG1-CHCHD7 QTN for stature in Japanese Black cattle. BMC Genet.13, 1–11. doi: 10.1186/1471-2156-13-40
16
Reverter A. Fortes M. R. S. (2013). BREEDING AND GENETICS SYMPOSIUM: Building single nucleotide polymorphism-derived gene regulatory networks: Towards functional genomewide association studies1,2. J. Anim. Sci.91, 530–536. doi: 10.2527/jas.2012-5780
17
Rodriguez E. E. Hamblen H. Flowers S. Leal J. D. Carr C. Scheffler T. et al . (2023). Carcass and meat quality traits in Brangus steers. Transl. Anim. Sci.7, txad021. doi: 10.1093/tas/txad021
18
Rodriguez E. E. Hamblen H. Leal-Gutierrez J. D. Carr C. Scheffler T. Scheffler J. M. et al . (2024). Exploring the impact of fatty acid composition on carcass and meat quality in Bos taurus indicus influenced cattle. J. Anim. Sci., skae306. doi: 10.1093/jas/skae306
19
Sacks F. M. Lichtenstein A. H. Wu J. H. Y. Appel L. J. Creager M. A. Kris-Etherton P. M. et al . (2017). Dietary fats and cardiovascular disease: A presidential advisory from the american heart association. Circulation136, e1–e23. doi: 10.1161/CIR.0000000000000510
20
Shannon P. Markiel A. Ozier O. Baliga N. S. Wang J. T. Ramage D. et al . (2003). Cytoscape: A software environment for integrated models of biomolecular interaction networks. Genome Res.13, 2498. doi: 10.1101/gr.1239303
21
Van den Langenbergh J. Bastiaansen-Jenniskens Y. M. van Osch G. J. V. M. Runhaar J. Bierma-Zeinstra S. M. A. Soballe K. et al . (2024). PLOD2 gene expression in infrapatellar fat pad is correlated with fat mass in obese patients with end-stage knee osteoarthritis. Osteoarthr Cartil Open. doi: 10.1016/j.ocarto.2024.100469
22
VanRaden P. M. (2008). Efficient methods to compute genomic predictions. J. Dairy Sci.91, 4414–4423. doi: 10.3168/jds.2007-0980
23
Wu Y. Zhou J. Yang Y. (2023). Peripheral and central control of obesity by primary cilia. J. Genet. Genomics50, 295–304. doi: 10.1016/j.jgg.2022.12.006
24
Zhao X. Wu S. Ren C. Bai Y. Hou C. Li X. et al . (2025). Revealing the mechanism of protein degradation in postmortem meat: the role of phosphorylation and ubiquitination. Foods14, 184. doi: 10.3390/foods14020184
25
Zhu B. Niu H. Zhang W. Wang Z. Liang Y. Guan L. et al . (2017). Genome wide association study and genomic prediction for fatty acid composition in Chinese Simmental beef cattle using high density SNP array. BMC Genomics18, 464. doi: 10.1186/s12864-017-3847-7
Summary
Keywords
healthfulness, linoleic acid, oleic acid, omega-3, omega-6, palmitic acid
Citation
Rodriguez EE, Leal-Gutierrez JD, Carr C and Mateescu RG (2025) Gene network analysis of fat composition in beef of Bos taurus indicus influenced cattle. Front. Anim. Sci. 6:1641988. doi: 10.3389/fanim.2025.1641988
Received
05 June 2025
Accepted
18 July 2025
Published
15 August 2025
Volume
6 - 2025
Edited by
Tiago do Prado Paim, Goiano Federal Institute (IFGOIANO), Brazil
Reviewed by
Jennifer Thomson, Montana State University, United States
Ahmed Nomir, Head of Anatomy and Embryology Department, Egypt
Updates
Copyright
© 2025 Rodriguez, Leal-Gutierrez, Carr and Mateescu.
This is an open-access article distributed under the terms of the Creative Commons Attribution License (CC BY). The use, distribution or reproduction in other forums is permitted, provided the original author(s) and the copyright owner(s) are credited and that the original publication in this journal is cited, in accordance with accepted academic practice. No use, distribution or reproduction is permitted which does not comply with these terms.
*Correspondence: Eduardo Emilio Rodriguez, edy5@ufl.edu
Disclaimer
All claims expressed in this article are solely those of the authors and do not necessarily represent those of their affiliated organizations, or those of the publisher, the editors and the reviewers. Any product that may be evaluated in this article or claim that may be made by its manufacturer is not guaranteed or endorsed by the publisher.