 Simona Mattioli1*
 Laura Menchetti2
 Elisa Angelucci1Alice Cartoni Mancinelli1
 Alessandro Dal Bosco1Laura Madeo3Francesca Di Federico1Luigia Bosa1
 Livia Moscati3
 Cesare Castellini1
- 1Department of Agricultural, Environmental and Food Science, University of Perugia, Perugia, Italy
- 2School of Biosciences and Veterinary Medicine, University of Camerino, Matelica, Macerata, Italy
- 3Experimental Zooprophylactic Institute of Umbria and Marche, Perugia, Italy
Introduction: Estimation of chicken adaptability to an extensive rearing system (ERS) is a complex issue. Many aspects should be considered: natural and/or welfare-based behaviors, kinetic and foraging attitude, resistance to environmental changes (i.e., thermotolerance), and resistance to disease. However, it is necessary to find a rapid and straightforward way to define the degree of adaptation of a chicken genotype in a commercial farm context. With this purpose, the objective of the present research was to develop an index of adaptability constituted by few and simple traits.
Material and method: Two hundred chickens of four different slow-growing genotypes (SGs; 25 chickens x 2 replicates x genotype) were reared outdoors: Red JA57 (RJ), Naked Neck (NN), Lohmann Dual meat-type (LD), and an Italian crossbreed (Robusta Maculata x Sassò, CB). Behavioral observations were recorded 2 times/week on outdoor pens from 36 to 81 days, whereas plumage condition, hock burns, footpad dermatitis, blood parameters, proximate composition, and technological traits of breast and drumstick meat were recorded at slaughter age (81 days) from 15/chickens per genotype. On-farm productive performance was recorded weekly. The nearly 200 variables collected were classified into four pillars (i.e., behaviors, body conditions, meat quality, in vivo health) and reduced to nine main variables by using discriminant analysis (DA) and principal component analysis (PCA). The index score was calculated as the sum of the variables weighted by the loading obtained in the final PCA. Finally, the Cronbach’s alpha test was used to measure the internal consistency and reliability of the index.
Results: The present investigation demonstrated that measuring only nine traits (breast malondialdehyde, breast yield and live weight, allo-grooming, resting and running behaviors, n-6 polyunsaturated fatty acids [PUFA], saturated fatty acids [SFA] of drumstick, blood PUFA, Heterophile/Lymphocyte ratio) of different pillars could be an efficient, rapid, and economical strategy to assess the adaptability of chicken genotypes to ERS.
Conclusion: The final classification showed that CB and LD genotypes had the worst indices, whereas NN and RJ showed the best ones. However, it is necessary to verify the reliability of the present approach in different rearing conditions and with other genetic strains.
1 Introduction
Recent studies and reviews have shown that many aspects should be considered for estimating chickens’ adaptability to an extensive rearing system (ERS). These aspects specifically include natural and/or welfare-based behavior, kinetic activity and foraging attitude, and resistance to environmental changes (i.e., thermotolerance) and disease (Castellini et al., 2002; Dal Bosco et al., 2021; Failla et al., 2021; Guarino Amato and Castellini, 2022; Jacobs et al., 2023; Bist et al., 2024; Chen et al., 2025), also considering productive performance and meat quality (Dal Bosco et al., 2021; Mattioli et al., 2022). Indeed, chicken adaptability to ERS is affected by many factors: (i) nutrition (protein content, energy requirements, antioxidant compounds); (ii) housing and management (indoor/outdoor space availability, slaughter age, growth rate, grazing status, environmental enrichment); (iii) healthcare; (iv) animal welfare.
Several European member states have provided simple ways to define chicken genotypes adapted to ERS. Many of them based the choice on daily weight gain (DWG, Tallentire et al., 2016); however, recent studies (Mancinelli et al., 2020; Cartoni Mancinelli et al., 2021) demonstrated that although DWG is an important trait, it is not the only factor that should be considered in determining adaptability to ERS. In particular, genotype has an intrinsic role independent of DWG. In addition, other EU countries have identified females as more adapted to ERS (Perić et al., 2018) because they show a lower growth rate than males; others have listed adapted/not adapted chicken genotypes based on ad-hoc tests (i.e. kinetic attitude; Failla et al., 2021). This latter approach requires time and funds and is not viable in the long term, as breeding companies change genetic lines over time.
Thus, it is necessary to find a rapid and straightforward way to define the degree of adaptation of a chicken genotype. With this purpose, the objective of the present research was to develop an index of adaptability constituted by a few simple traits that can also be analyzed in a commercial farm context. In this regard, the index developed has also been tested using data acquired in a commercial farm.
2 Materials and methods
2.1 Animals and structures
The experiment was carried out during the late spring season of 2020 on one commercial farm affiliated with the University of Perugia (Italy) for the project. Chickens were reared according to EU Regulation 834/07, EU Regulation 889/2008, and the Italian directives (European Parliament and Council of the European Union, 2013) on animal welfare for experimental and other scientific purposes. The experimental protocol was positively evaluated and approved by the Ethical Committee of the Istituto Zooprofilattico dell’Umbria e delle Marche (ID number: 62705 of 07/15/2020).
A total of 200 chickens belonging to four different slow-growing genotypes (SGs; 25 chickens x 2 replicates x genotype), widely diffused in Europe for meat production, were used. In particular, the genotypes were Red JA57 (RJ), Naked Neck (NN), Lohmann Dual meat-type (LD), and an Italian crossbreed (Robusta Maculata x Sassò, CB). The birds were provided by three commercial breeding companies: RJ by Aviagen (Cocconato, AT, Italy), NN by Hubbard (Le Foeil-Quintin, France), and LD by Lohmann Breeders (Avizoo Lohmann, Italy); CB was directly developed by the Department of Agricultural, Environmental and Food Science of the University of Perugia (Italy).
Two replications of each chicken strain were reared in different outdoor pens, which were also equipped with a shelter. The indoor (0.10 m2/bird) and outdoor (4 m2/bird) densities were specified according to organic regulations (EC Regulation No. 834/2007 and 889/2008). From 1 to 15 d, birds were housed in an environmentally controlled poultry house with a temperature range of 30–32°C (with the presence of heat lamps) and relative humidity of 65-70%; subsequently, the lamps were removed and the temperature was maintained at approximately 20-22°C with the same relative humidity. At 36 d, the chickens were provided with free access to the outdoor space. The mean outdoor temperature and humidity were 19 ± 7°C and 50.1 ± 12.5%, respectively. As required, the pasture was never treated with pesticides or herbicides.
The animals were fed ad libitum with the same diet (starter feed for 1–21 d, grower feed from 22 d to slaughter; Table 1); the diets were formulated to satisfy the requirements recommended by the breeding companies. Water was always available, and the birds were kept in shelters only during the night to protect them from predators. Once a week, 15 chickens per replicate from all genotypes were weighed to evaluate the daily weight gain (DWG, g/d/chicken). Mortality was recorded daily.
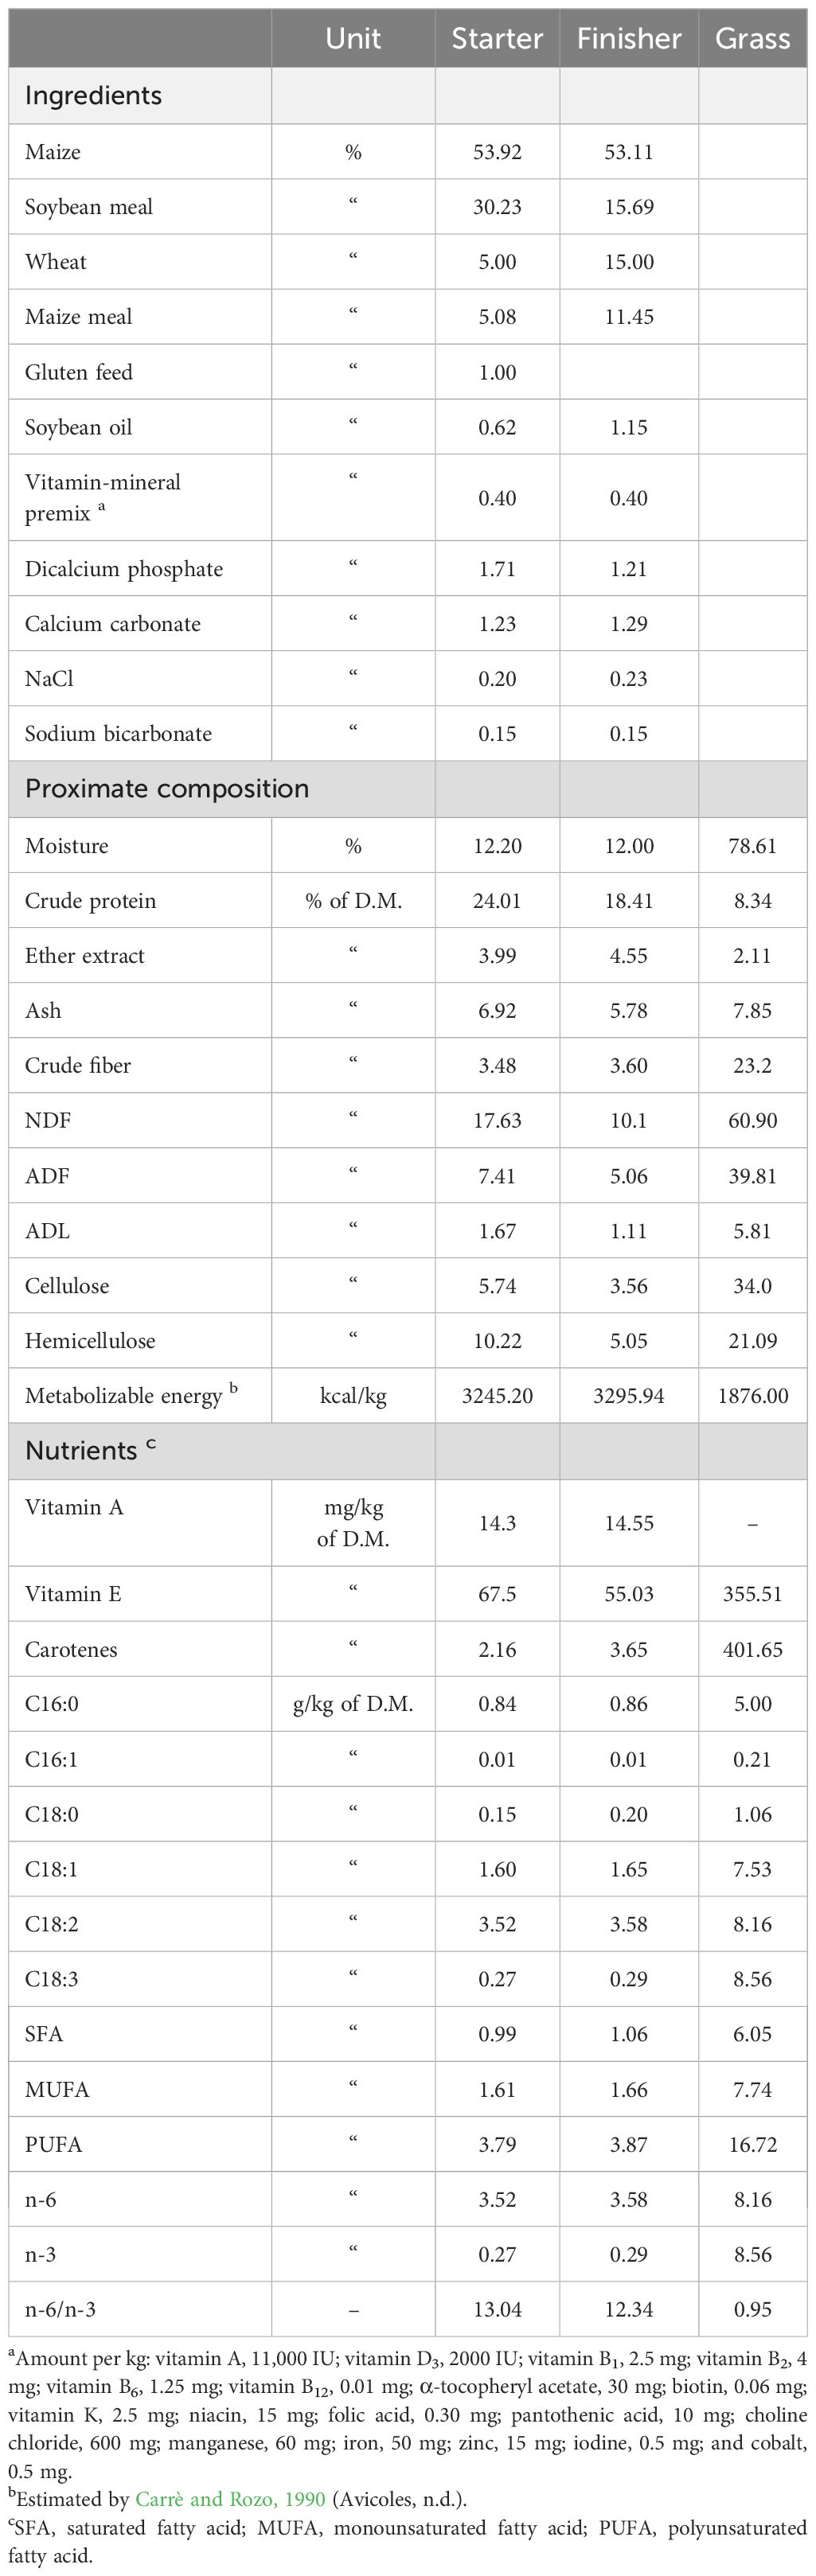
Table 1. Dietary ingredients, proximate composition, energy value and nutrients of feed and grass.
2.2 Behavior observations
Behavioral observations were performed in all pens using a computerized system (Noldus Technology, Wageningen, Netherlands) comprising two different software programs, Media Recorder and Observer XT, to record and analyze the videos. All the pens were inspected to identify the best position for the camera and the best time of day for video recording. As the birds were allowed access to the outdoor area at 36 d, video acquisition started at 42 d. The period from 36 to 42 d was considered an adaptation period for the birds to the outdoor area.
Two videos/week of 2 hours (h) length (9.00–11.00 AM) were recorded in each pen. Two expert observers analyzed all the videos in poultry behavior using the reported ethogram (Table 2). Each video was analyzed by two expert observers in poultry behavior using a 10 min scan interval (6 scans per hour; 12 scans per video) and the reported ethogram (Table 2), following the method of Cartoni Mancinelli et al. (2023).
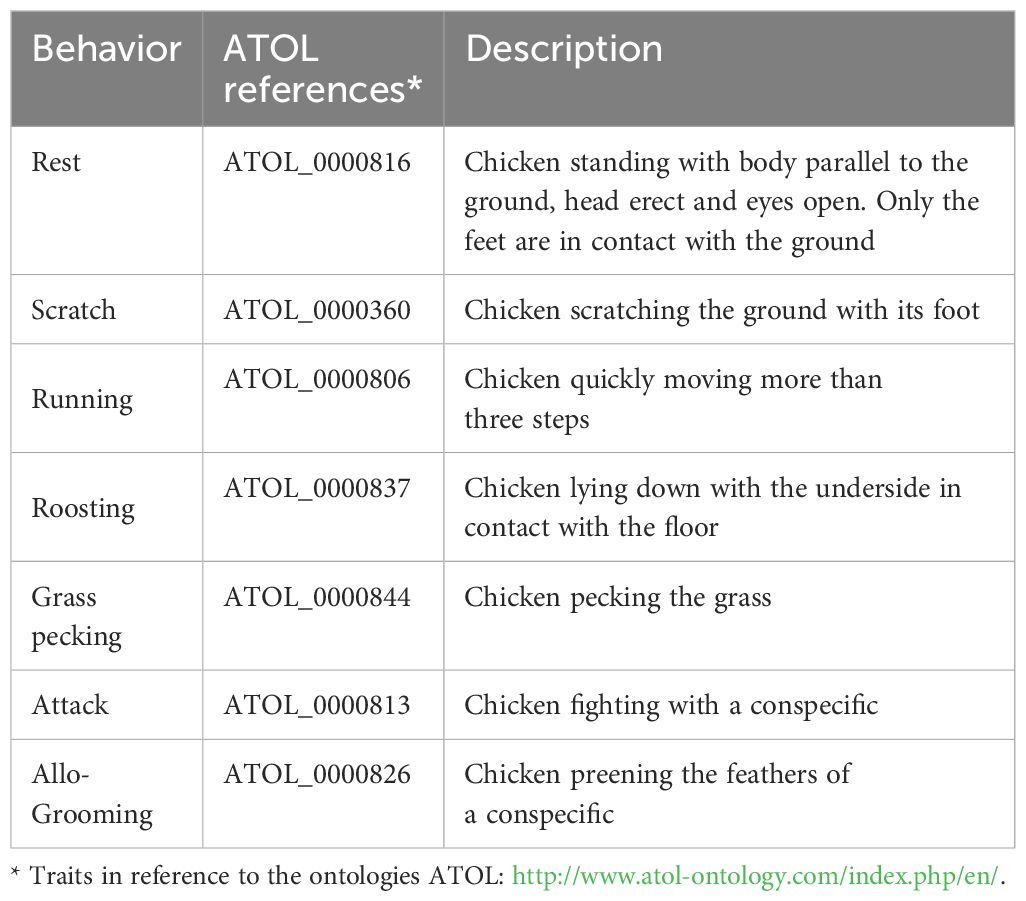
Table 2. Ethogram of observation, definition, and reference in ATOL ontology of the measured traits.
2.3 Plumage condition, hock burns, and footpad dermatitis
At 81 d, 15 animals/genotype were subjected to plumage evaluation. The observation focused on five parts of the body: neck, breast, back, wings, and tail. According to the Tauson method (Tauson, 1984), a range of scores between 0 (no feathering) and 4 (intact and perfect plumage) was used. The presence of sternal hock burn and footpad dermatitis was also assessed using a scale from 0 to 2, where 0 indicated absence, 1 indicated light lesions, and 2 indicated deep lesions (Berg, 1998).
2.4 Blood collection and carcass traits
At 81 d, 15 chickens/genotype (total n=60) were randomly selected and slaughtered in a commercial slaughterhouse after feed withdrawal. The animals were electrically stunned (110 V; 350 Hz) before being killed. A 2 mL blood sample was collected in heparinized tubes for plasma extraction to assess in vivo oxidative status, while another 2 mL blood sample was collected in plain tubes for serum extraction to determine fatty acid and immunity traits.
After collection, the blood samples were immediately sent to the laboratory of the Department of Agricultural, Food and Environmental Science, University of Perugia, where the plasma tubes were centrifuged at 1,500 × g for 10 min at +4°C, and the serum tubes were left to separate for 2 h at room temperature. Finally, the plasma and serum samples were frozen at −80°C until analysis.
After bleeding, the carcasses were placed in hot water (56.5°C for 1 min), then plucked and eviscerated (non-edible viscera: intestines, proventriculus, gall bladder, spleen, esophagus, and full crop), and stored for 24 h at 4°C to obtain the cold carcass. The head and feet yield (% cold carcass weight including head, neck, and feet relative to live weight), carcass weight, and yield (% cold carcass without head, neck, and feet relative to live weight), as well as the breast and drumstick weights, were calculated. The breast and drumstick were sampled and stored at −20°C for 1 week. The drumstick meat was entirely removed from the bone.
2.5 In vivo oxidative status
The extent of plasma lipid peroxidation was evaluated using the method detailed in Mattioli et al. (2019). A spectrophotometer (set at 532 nm; Shimadzu Corporation UV-2550, Kyoto, Japan) measured the absorbance of thiobarbituric acid reactive substances (TBARS), and a tetraethoxypropane calibration curve in sodium acetate buffer (pH=3.5) was used. The results were expressed as nmol of malondialdehyde (MDA)/mL of plasma.
The detection of protein carbonyl groups followed the method of Dalle-Donne et al. (2003), using 2,4-dinitrofenilhidrazina (DNPH) as the reagent. The serum was diluted 1:40 with phosphate-buffered saline (PBS) before analysis. Carbonyl content was determined from the absorbance at 366 nm using a molar absorption coefficient of 22,000 M-1/cm, with the same spectrophotometer previously described. The results were expressed as nmol/mg of protein. Protein was quantified using Coomassie Brilliant Blue R-250 staining solution (Bio-Rad Laboratories, Inc., Milan, Italy), following the Bradford method (1976).
The tocols (α-tocopherol and its isoforms γ and δ, and α and γ-tocotrienol) and retinol levels were measured according to Schüep and Rettenmaier (1994). Briefly, 0.2 mL of plasma was mixed with 1 mL of water and 4 mL of an ethanol solution of 0.06% butylated hydroxytoluene (BHT). The mixture was saponified with water/potassium hydroxide (KOH, 60%) at 70°C for 30 min and extracted with hexane/ethyl acetate (9/1, v/v). After centrifugation, 2 mL of the supernatant was transferred into a glass tube, dried under N2, and re-suspended in 200 μL of acetonitrile. The pellet was re-extracted twice using the same method. A 50 μL volume of filtrate was then injected into the HPLC/FD system (pump model Perkin Elmer Series 200, equipped with an autosampler system, model AS 950-10, Jasco, Tokyo, Japan) on a Sinergy Hydro-RP column (4 µm, 4.6 × 100 mm; Phenomenex, Bologna, Italy) with a flow rate of 2 mL/min.
All tocopherols and tocotrienols were identified using an FD detector (model Jasco FP-1525; excitation and emission wavelengths of 295 and 328 nm, respectively) and quantified using external calibration curves prepared with increasing amounts of pure standard solutions (Sigma-Aldrich, Bornem, Belgium) in ethanol. The tocols sum was used for statistical analysis.
Retinol was analyzed using the same HPLC system with a UV-VIS spectrophotometer detector (Jasco UV2075 Plus) set at λ 325 nm. Retinol was identified and quantified by comparison with a pure commercial standard in chloroform (Sigma-Aldrich, Steinheim, Germany; Extrasynthese, Genay, France).
Reactive oxygen molecules (ROMs) in plasma were evaluated using a commercial kit (Diacron, Grosseto, Italy) following the manufacturer’s protocol and expressed as mmol H2O2.
The biological antioxidant potential (BAP) was measured with a commercial kit (Diacron, Grosseto, Italy), which evaluated the ability of the plasma to counteract the oxidative action of a hypochlorous acid (HClO) solution. BAP levels for each sample were expressed as μmol of neutralized HClO.
2.6 Proximate composition and technological traits of breast and drumstick meat
The moisture, ash, and total nitrogen content of the meat were assessed using AOAC methods (AOAC, 1995–N. 950.46B, 920.153, and 928.08, respectively). Total protein was calculated using the Kjeldahl method with a 6.25 conversion factor. Total lipids were extracted in duplicate from 5 g of each homogenized sample and calculated gravimetrically (Folch et al., 1957).
The ultimate pH (24 h) was measured with a Knick digital pH meter (Broadly Corp., Santa Ana, CA, USA) after homogenization of 1 g of raw muscle for 30 s in 10 mL of 5 M iodoacetate (Korkeala et al., 1986).
The water-holding capacity (WHC) was estimated by placing 1 g of whole muscle on tissue paper inside a tube and centrifuging for 4 min at 1,500 × g. The water remaining after centrifugation was quantified by drying the samples at 70°C overnight. WHC was calculated as follows: (weight after centrifugation − weight after drying)/initial weight × 100.
At 24 h post-mortem, the color values (L*-lightness, a*-red index, b*-yellow index) of the cut surface of fillets were measured using a tristimulus analyzer (Minolta Chroma meter CR-200, Osaka, Japan), following the CIELab color system (Robertson, 1977).
2.7 Oxidative status and fatty acid profile of meat
The oxidative parameters and fatty acid profile of meat were analyzed in duplicate. The α-, γ-, and δ-tocopherol, α- and γ-tocotrienol, and retinol content of the meat were quantified using the HPLC system described above, according to Hewavitharana et al. (2004). Five mL of distilled water and 4 mL of ethanol were added to 2 g of sample and vortexed for 10 s. After mixing, 4 mL of hexane containing BHT (200 mg/L) was added, and the mixture was carefully shaken and centrifuged at 8,000 × g for 10 min. An aliquot of the supernatant (3 mL) was dried under a stream of nitrogen and dissolved in 200 μL of acetonitrile; 50 μL was then injected into the HPLC as previously described.
Lipid oxidation was evaluated using a spectrophotometer set at 532 nm (Shimadzu Corporation UV-2550, Kyoto, Japan), which measured the absorbance of TBARS and a 1,1,3,3-tetraethoxypropane calibration curve (Ke et al., 1977). Oxidation products were quantified as malondialdehyde equivalents (μg MDA/g).
Carbonyl derivatives of proteins were detected according to the method of Mattioli et al. (2018). Briefly, the pellets from trichloroacetic acid (TCA) extracts were mixed with 1 mL of 10 mM DNPH in 2 M HCl. Samples were incubated for 1 h at room temperature and then centrifuged at 13,000 × g for 5 min. Supernatants were discarded, and the pellets were washed three times with 1 mL of ethanol–ethylacetate (1:1, v/v) to remove unreacted DNPH. The pellets were then dissolved in 1.5 mL of 6 M guanidine-HCl and centrifuged again to pellet insoluble particles. The carbonyl content of the resulting supernatants was evaluated spectrophotometrically at 370 nm using a molar extinction coefficient of 22000 1/M*cm; values were expressed as nmol of carbonyl/mg of protein in the guanidine chloride solution. Protein concentrations were measured using the Bradford method with Coomassie Brilliant Blue G-250 (Bradford, 1976), using bovine serum albumin as the standard. The same TCA extract was also used to evaluate thiol groups based on the 5,5’-dithio-bis-2-nitrobenzoic acid assay, with an extinction coefficient of 13,600 1/M*cm and expressed as µmoL SH – group per g.
Total lipids were extracted from 10 g of each homogenized sample, according to Folch et al. (1957), and esterified according to Christie (1982). One mL of each solution containing fatty acid esters was transferred into vials for gas chromatographic analysis. The separation of fatty acid methyl esters (FAME) was performed using a Varian gas chromatograph (CP-3800) equipped with a flame ionization detector (FID) and an Agilent capillary column (100 m x 0.25 mm, CPS Analitica, Milan, Italy) coated with a DB-Wax stationary phase (film thickness of 0.25 µm). Injector and detector temperatures were set at 270°C and 300°C, respectively. The carrier gas was helium at a flow rate of 0.6 mL/min. The oven temperature was programmed as follows: from 40°C (1 min hold) to 163°C (10 min hold) at 2°C/min ramp, to 180°C (7 min hold) at 1.5°C/min, to 187°C (2 min hold) at 2°C/min, and to 230°C (25 min hold) at 3°C/min.
Methyl esters of individual fatty acids were identified by comparing their retention times with those of a commercially available FAME standard mixture (FAME Mix Supelco 2560, Sigma-Aldrich, Germany). C21:0 methyl ester (CAS number 2363-71-5; Merck H5149, Germany), eluted under the same conditions as the samples, was used as an internal standard (1 mg/100 µL of added solution). The area of each peak was used to calculate the fatty acid proportion. For the quantitative analysis (mg/100g of meat), the calculation method reported by Vahmani et al. (2017) was applied.
Total saturated fatty acids (SFA), total monounsaturated fatty acids (MUFA), total polyunsaturated fatty acids (PUFA), total n-6 and n-3 fatty acids, as well as the n-6/n-3 ratio, were also calculated. The healthy fatty acid index (HFI) was also calculated according to Bosco et al. (2022) applying the following equation: HFI = ((mg/100 g of MUFA × 2) + (mg/100 g of n-6 × 4) + (mg/100 g of n-3 × 8) + (mg/100 g n-3/mg/100 g n-6))/((mg/100 g of SFA) + (mg/100 g of MUFA × 0.5) + (mg/100 g of n-6 × 0.25) + (mg/100 g of n-3 × 0.125) + (mg/100 g n-6/mg/100 g n-3)).
2.8 Statistical analysis
Statistical analyses were performed using SPSS Statistics version 23 (IBM, SPSS Inc., Chicago, IL, USA; Figure 1). The nearly 200 variables collected were classified into four main pillars (i.e., behaviors, body conditions, meat quality, in vivo health) and reduced to 121 (Supplementary Table S1) based on ease of assessment and use, cost-effectiveness, and scientific soundness. Furthermore, to avoid multicollinearity, the variables were first selected using correlation and pooled within-groups correlation matrices by eliminating those with a coefficient ≥ │0.8│ (Garson, 2012a; Frizzarin et al., 2023). In the “behavior” pillar, variables with a mean occurrence< 1 were not included (i.e., rare behaviors), in order to obtain a relatively small number of variables (n=35; Table 3).
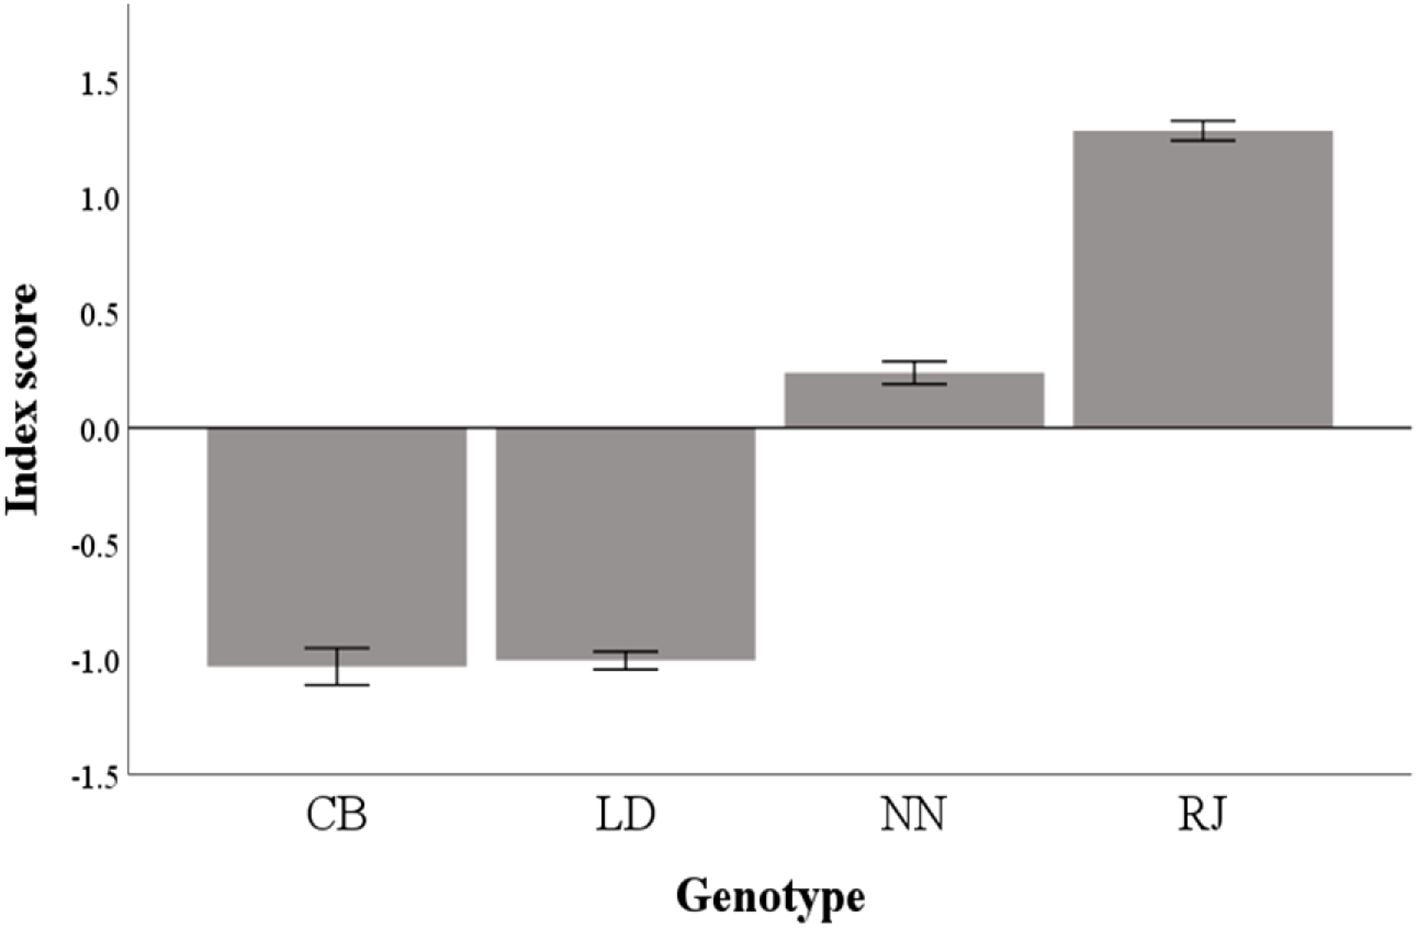
Figure 1. Statistical approach for variables selections.
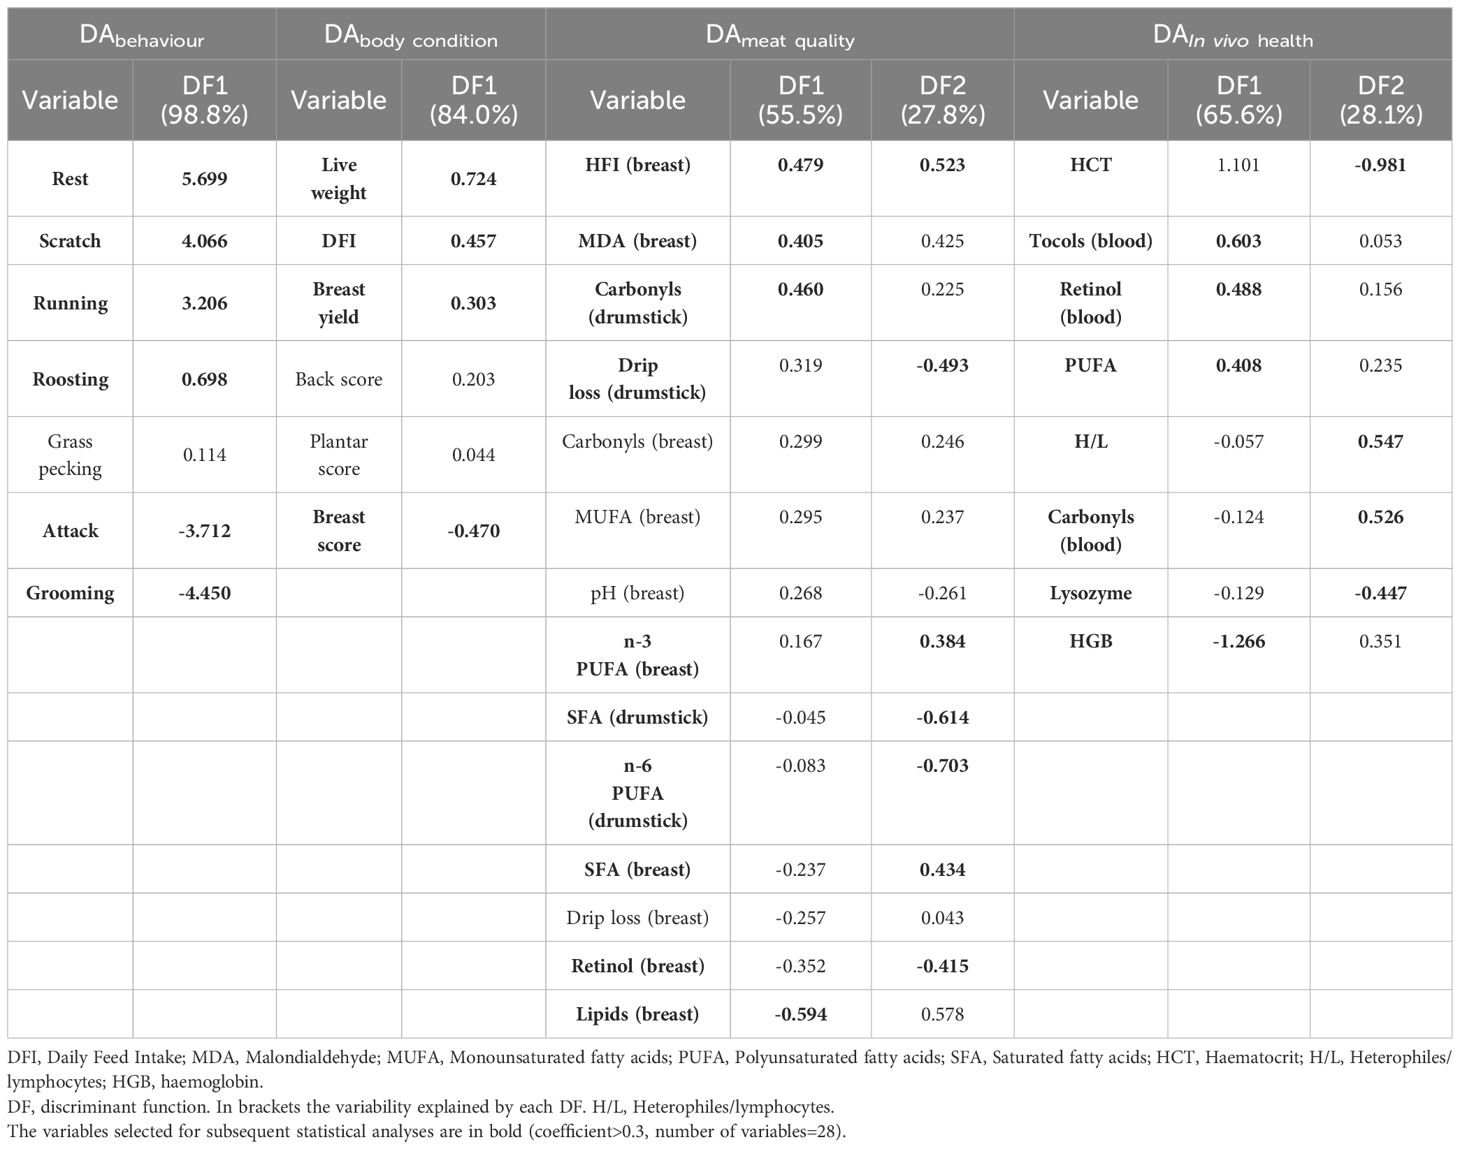
Table 3. Standardized canonical discriminant function coefficients of the variables selected by stepwise discriminant analysis (DA) for each pillar (number of variables included = 35).
Then, the variables were subjected to
(i) discriminant analysis (DA) to select the variables for each pillar characterizing the four genotypes,
(ii) principal component analysis (PCA) to create a composite index including all the pillars,
(iii) Cronbach’s alpha to refine the index and assess its internal consistency and reliability.
Thus, each pillar was initially subjected to DA with the stepwise method, using an F value of 0.02 as the criterion for entering variables. The DA produced the most parsimonious linear combinations of indicators describing among-genotype differences for each pillar (discriminant function; DF). The standardized DF coefficients express the relative discrimination power of each variable. The performance of the final DFs was estimated by a prediction matrix table, which calculated the probability for each sample to be accurately classified in the correct genotype through the DF (Garson, 2012b; Agradi et al., 2023).
For each pillar, the variables to be included were selected based on their contribution to discrimination. In particular, for each DA, only the DFs explaining at least 90% of the variance among genotypes were considered: DF1 for the “behavior” and “body condition” pillars; DF1 and DF2 for the “meat quality” and “in vivo health” pillars. Within these DFs, only the variables with coefficients >0.3 were chosen (Pituch and Stevens, 2016). At this step, the number of variables included was 27.
Subsequently, the pool of variables selected by these DFs was processed using the principal component analysis (PCA) procedure to create a unidimensional measure representing the four pillars (Menchetti et al., 2019; Cartoni Mancinelli et al., 2021). The first principal component (PC) extracted by PCA was considered as an index of the adaptive response of animals, as it condenses the consistent information of the original measurements into a single variable. The selected variables were then standardized (to a mean of zero and a standard deviation of one) and included in a correlation matrix. Variables that were highly (r>│0.8│) or poorly (r<│0.3│) correlated were excluded to optimize the PCA performance (Statistics, 1986; Vyas and Kumaranayake, 2006). Subsequently, these variables were submitted to several rounds of PCA to eliminate those with low loadings. Variables sharing less than 10% of their variance with the PC (i.e., loading ≥0.32) were removed. Through an iterative process, PCAs were repeated until all factors met these criteria (Vyas and Kumaranayake, 2006; Statistics, 2011; Pituch and Stevens, 2016; Abunab et al., 2017). The cumulative variance explained by the final PCA—reflecting the total proportion of variation captured by the selected principal components—is reported in the Results to illustrate how effectively the reduced dimension represents the original dataset.
The final list of variables was refined and validated using Cronbach’s α. The function “Cronbach’s Alpha if Item Deleted” (i.e., the change in Cronbach’s α that would occur if a particular item were deleted) was used for further variable selection. In particular, a variable was removed when its elimination increased the Cronbach’s α value and improved the reliability of the index (Ortolani et al., 2021; Field, 2024). Through an iterative process, PCAs were repeated until the included variables ensured the best reliability. The Cronbach’s α value (α >0.7 indicating good reliability; Field, 2009; Menchetti et al., 2018; Pérez-gálvez et al., 2020) of the final PC was used to test the internal consistency reliability of the index.
The index score was calculated as the sum of the variables weighted by the loading obtained by the PCA:
Where,
I=score of the index
Xi = value of the ith variable
Wi =weight (i.e., loading) of the ith variable
3 Results
The DWG values (data not shown) for the genotypes were 33.64 ± 0.75 g/d in RJ, 29.69 ± 0.66 g/d in NN, 21.56 ± 0.86 g/d in LD, and 25.23 ± 1.40 g/d in CB. No differences in mortality rate were recorded (mortality ranged from 5-6% in all genotypes).
3.1 Discriminant analysis: selection of the variables characterizing the genotype for each pillar
After checking for multicollinearity, the following eight variables with mean occurrence > 1 were included in the DA for the “behavior” pillar (DAbehaviour): Walking, Resting, Scratching, Running, Roosting, Grass pecking, Attacking, and Grooming. The stepwise procedure selected six variables, and the first DF explained 98.8% of the variance between genotypes (Table 3). The DAbehaviour allowed 100% of the animals to be correctly classified (Figure 2A).
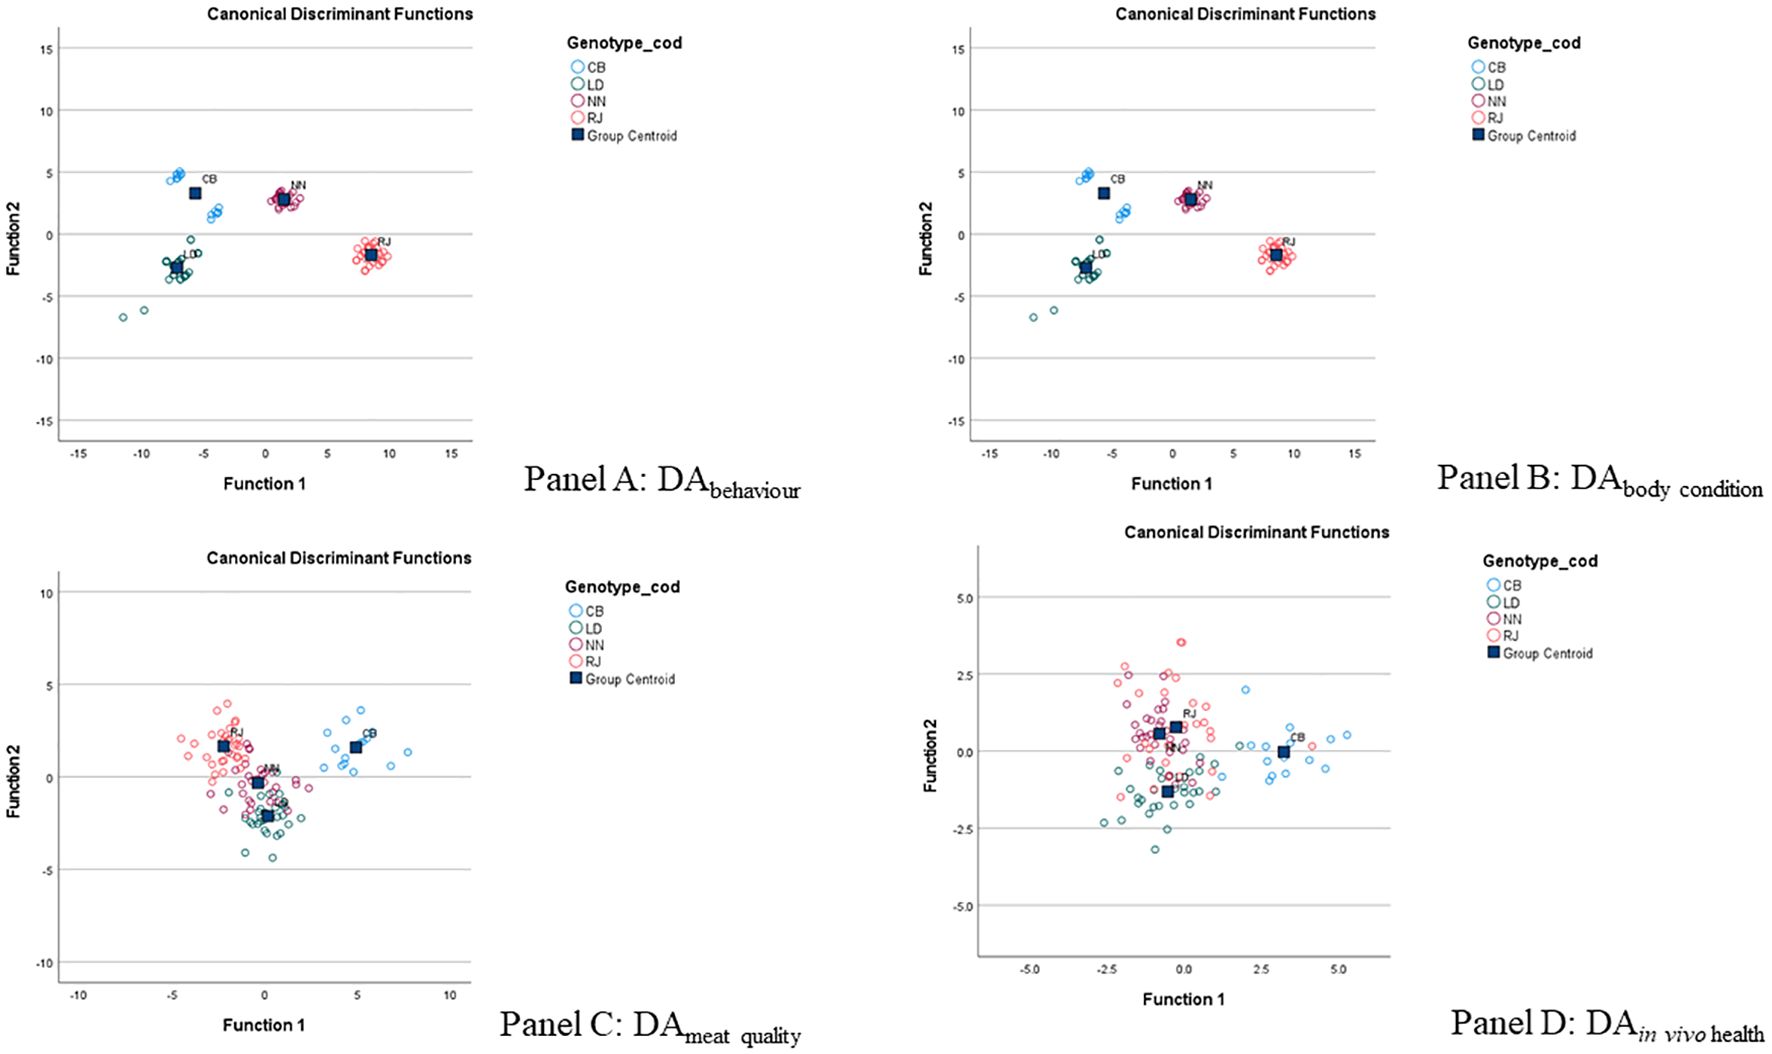
Figure 2. Discriminant analysis (DA): selection of the variables characterizing the genotype for each pillar. (A) DAbehavior; (B) DAbody condition; (C) DAmeat quality; (D) DAin vivo health. CB: Italian crossbreed (Robusta Maculate x Sassò); LD: Lohmann dual; NN: Naked neck; RJ: red JA57.
Among the 15 variables entered for the “body conditions” pillar (DAbody condition), six were selected by the stepwise procedure (Table 3). The first DF extracted explained 84.0% of the variance and correctly classified 100% of the cases (Figure 2B). Among these six variables, live weight, DFI, breast yield, and breast score had a loading greater than 0.3.
Thirty-eight variables were entered into the DAmeat quality, and 14 were finally selected (Table 3). The DAmeat quality correctly classified 97.1% of animals. However, to achieve at least 80% (i.e., 83.3%) of the explained variability (Figure 2C), only the first two DFs were considered. Within these two DFs, the variables having a coefficient > 0.3 were breast HFI, drumstick carbonyls, drumstick drip loss, breast MDA, breast n-3 PUFA, drumstick SFA, drumstick n-6 PUFA, breast SFA, breast retinol and breast lipids (Table 3).
Similarly, the DAIn vivohealth produced two DFs explaining at least 80% of the variance (i.e., 93.7%; Table 3). Among the 12 variables included in the DAIn vivo health, eight were selected, all with a loading greater than 0.3. This DA allowed 77% of samples to be correctly classified (Figure 2D).
Overall, a total of 34 variables were selected, and 26 variables were included in the PCA.
3.2 Principal component and reliability analyses: creation of a composite index and its validation and refinement
According to the correlations and loadings from the PCA, ten variables were selected for the creation of the index (Table 4). Cronbach’s alpha value for this composite index was 0.780. However, the reliability analysis indicated that the trait “Running” did not contribute significantly to the index and was eliminated. Thus, a final PCA was conducted, including the nine variables listed in Table 4, while Supplementary Table S3 presents the descriptive statistics for the nine selected variables across the four genotypes. This PCA explained 38.6% of the variance, demonstrating good internal reliability (Cronbach’s alpha = 0.783).
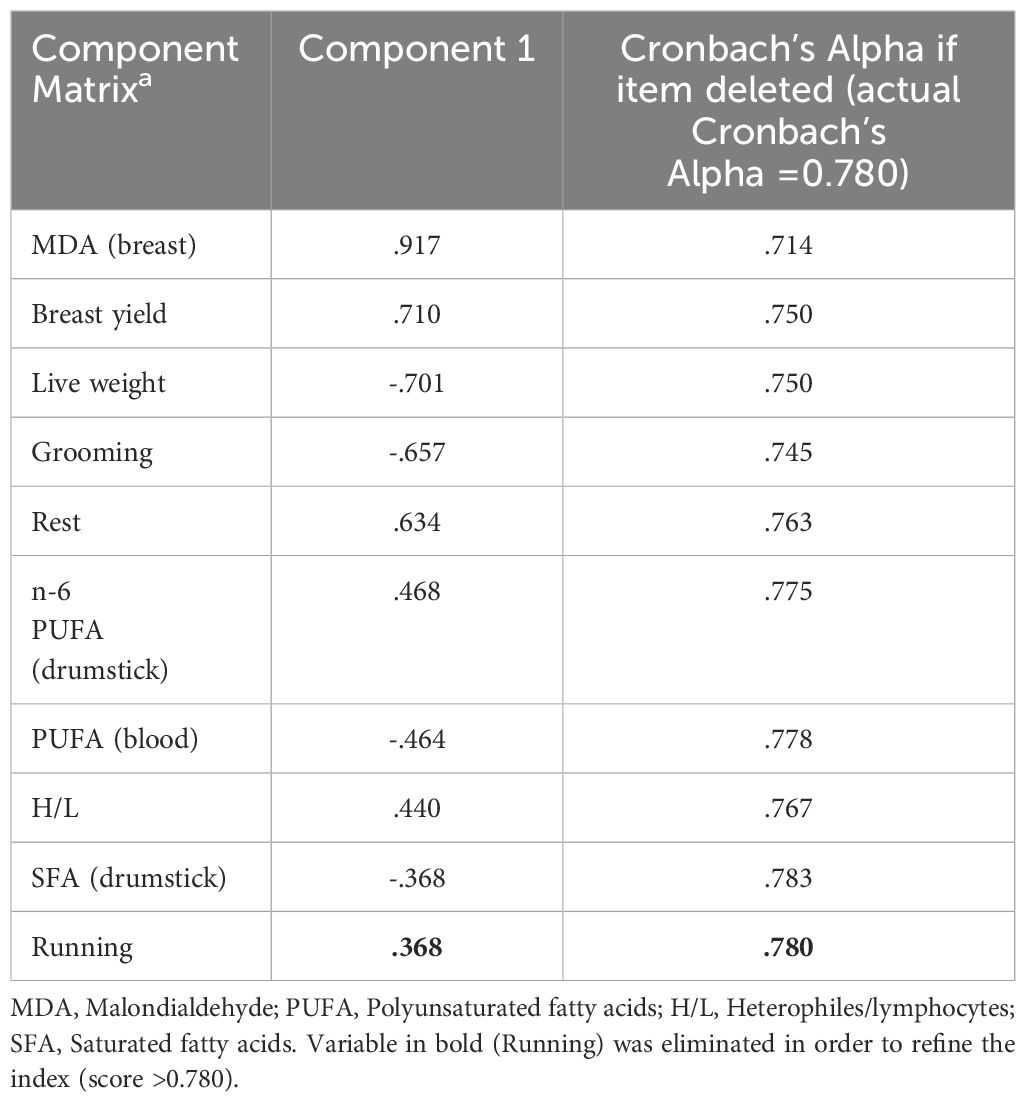
Table 4. Variables resulted by refining and validation using Cronbach’s α test (final number of variables =9).
3.3 Index scores and differences among genotypes
Figure 3 and Supplementary Table S4 report the final classification based on the estimated indices obtained for the different genotypes. In detail, CB and LD genotypes showed the worst indices, whereas NN and RJ showed the best ones.
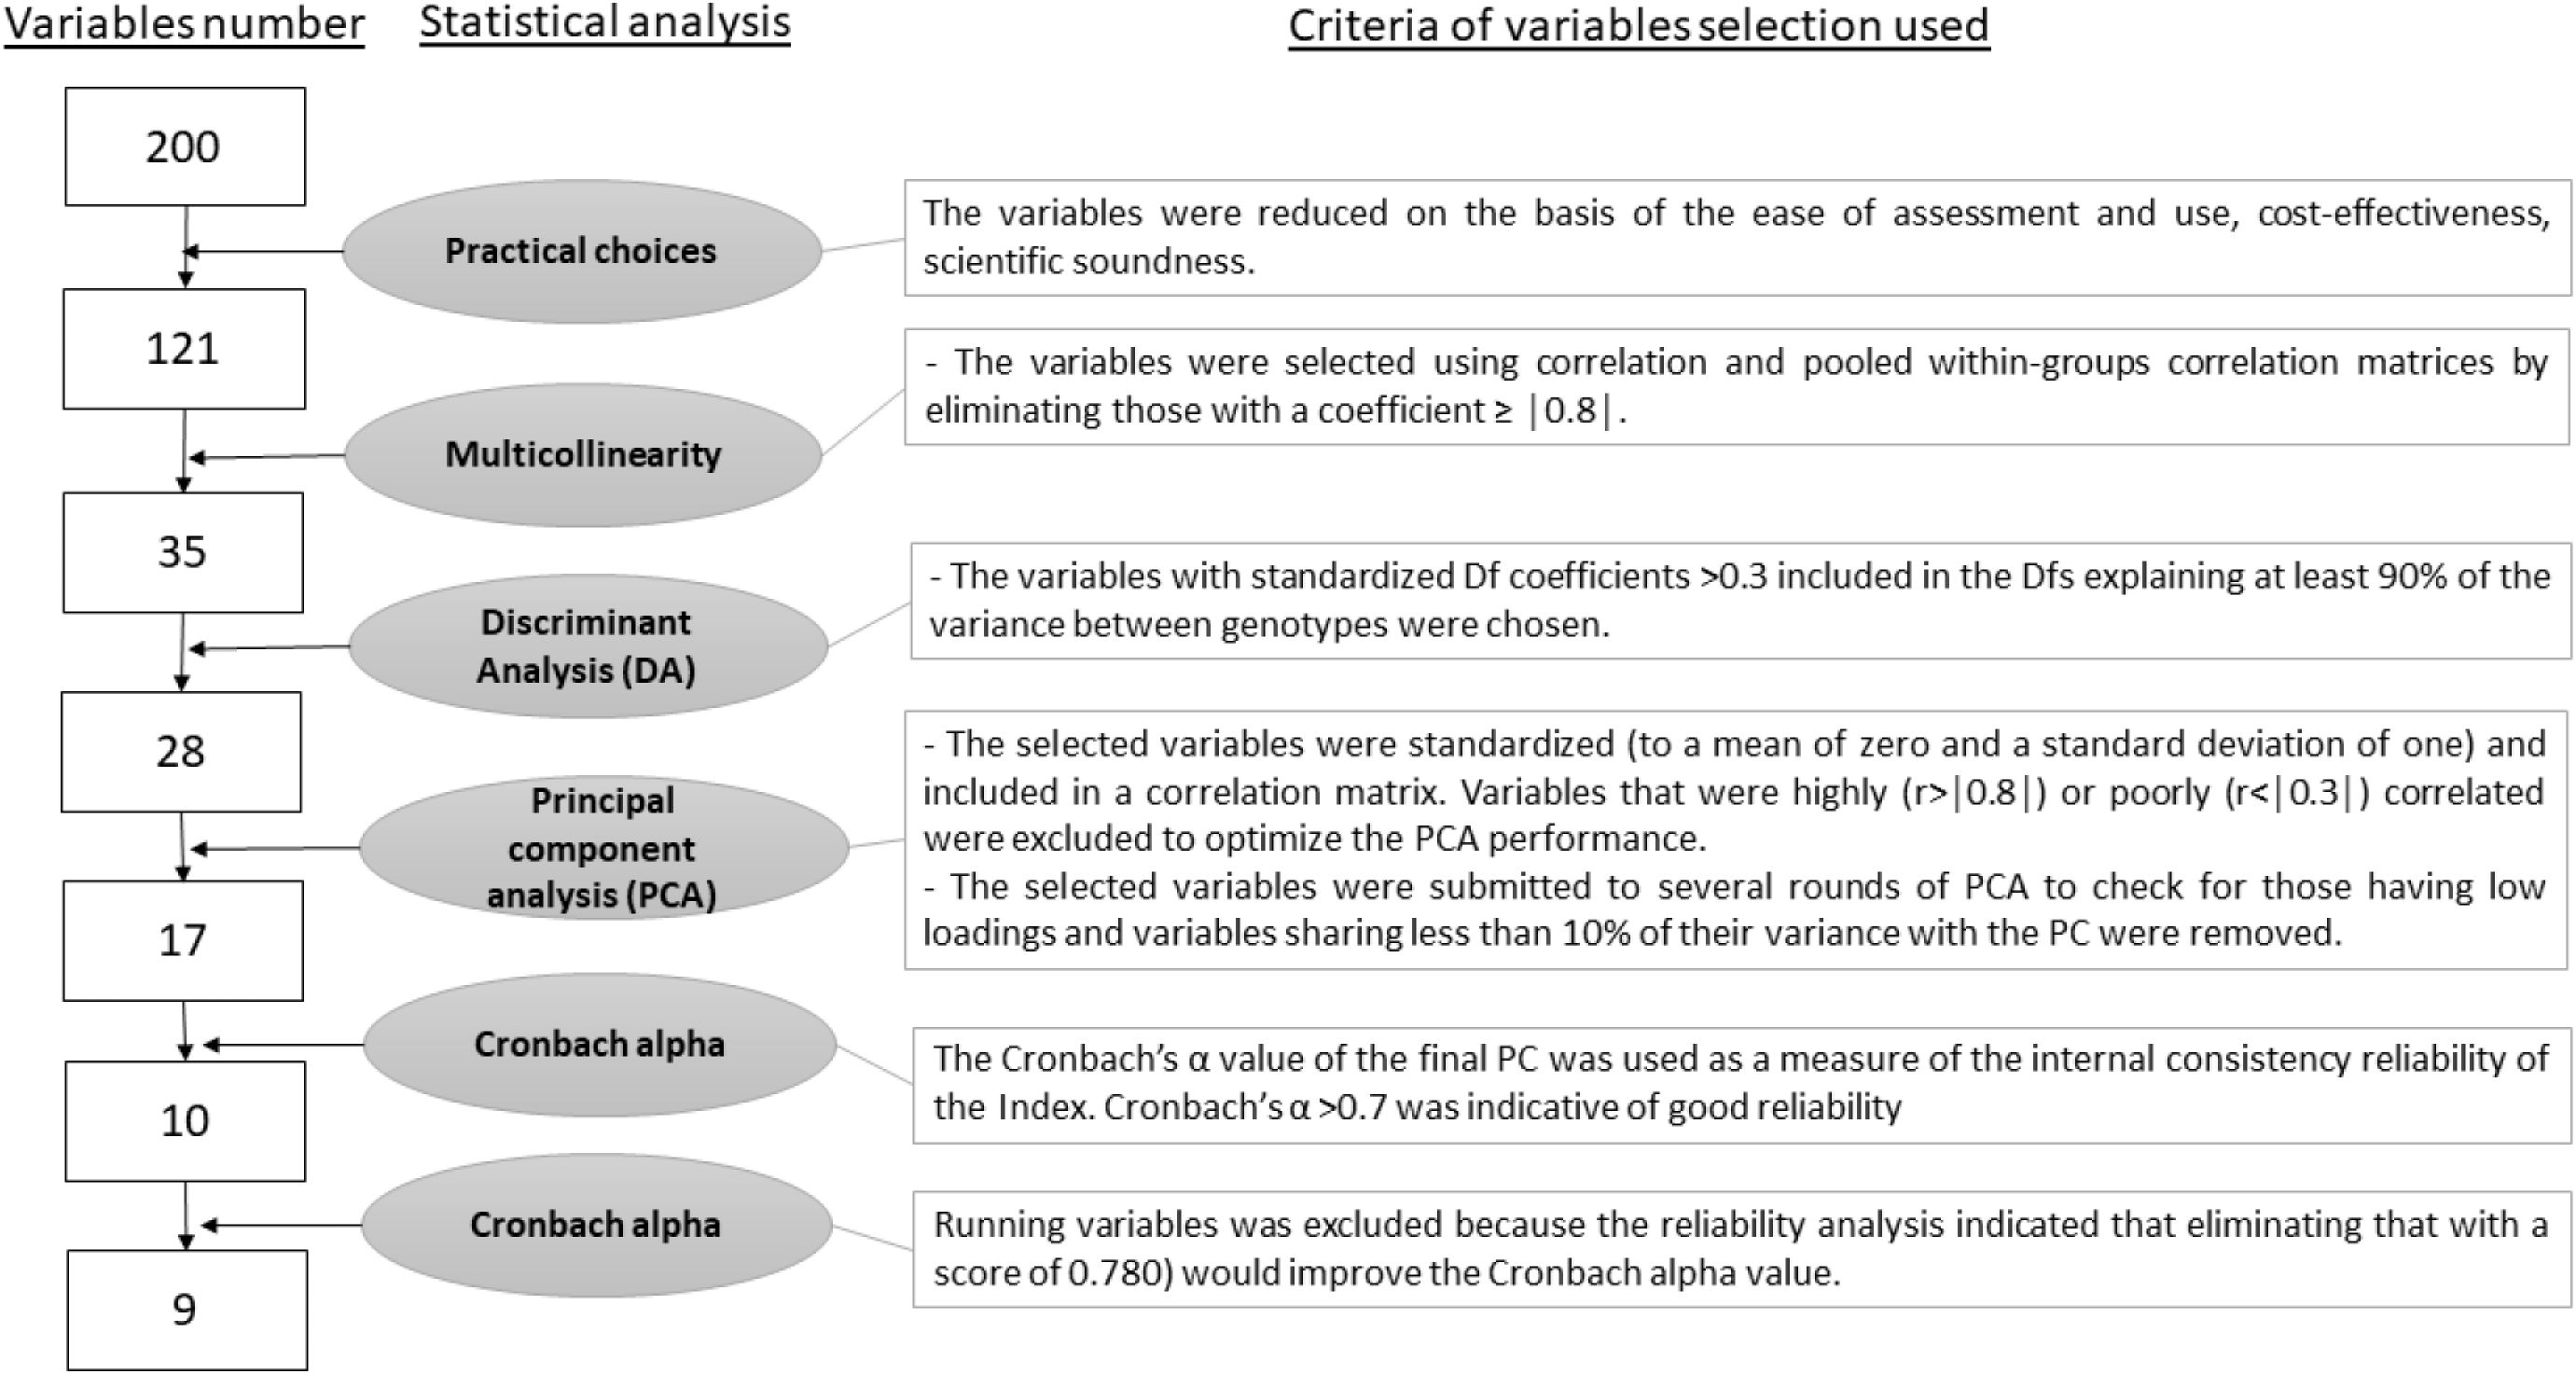
Figure 3. Index scores and differences among genotypes. CB, Italian crossbreed (Robusta Maculata x Sassò); LD, Lohmann dual; NN, Naked neck; RJ, Red JA57.
4 Discussion
The body of literature reports many simplistic and partial methods to estimate the adaptability of chickens to the ERS (Mancinelli et al., 2020; Cartoni Mancinelli et al., 2021; Failla et al., 2021; Bonnefous et al., 2022). The only complete indices are estimated in wild avian species, designed to measure specialization to ecological habitats (i.e., foraging ecology, habitat, and breeding characteristics; Morelli et al., 2019) or to evaluate ecological resilience to different environmental changes (climate change, urbanization, etc.; McCloy et al., 2022). In any case, no existing index takes into account all the key pillars that characterize a rearing system—namely, animal behaviors, health status, productive performance, meat quality, and oxidative status. The present research represents an attempt to find a rapid and straightforward way to define the degree of adaptation of a chicken genotype to ERS.
The allocation of groups presented in PCA (Figure 2) clearly shows the differences between chicken genotypes in terms of behaviors, body condition, and meat quality. Conversely, in vivo health traits exhibited the weakest differentiation among genotypes. This finding is not surprising, considering that blood condition is influenced by numerous exogenous factors, including stress due to pre-slaughter handling, environmental changes, feeding, and fasting (Nwaigwe et al., 2020; Okasha, 2021).
However, in the final PCA matrix, the nine selected variables were as follows: two behavioral variables (Panel A; grooming and resting), two body condition variables (Panel B; breast yield and live weight), three meat quality variables (Panel C; MDA in breast, n-6 PUFA in drumstick, and SFA in drumstick), and two in vivo health variables (Panel D; H/L ratio and PUFA in blood). The distribution of variables demonstrated that all the parameters analyzed are essential for evaluating chicken adaptability to ERS.
In our previous investigation (Mattioli et al., 2021), we found that the kinetic behavior of different slow-growing chicken genotypes was negatively correlated with productive performance, and a significant association was observed between kinetic behavior and the oxidative status of blood (positively correlated) and meat (negatively correlated). Similarly, Castellini et al. (2016) and Mancinelli et al. (2017) confirmed a negative correlation between adaptation to ERS and DWG in slow-, medium-, and fast-growing chickens. However, when the correlation was evaluated within the same subgroup (slow, medium, or fast-growing), the relationship between DWG and adaptation to ERS was not significant. The conclusion was that a DWG lower than<40 g/d is a prerequisite for chicken adaptation, but birds with similar weight gains can show wide variations in adaptability (Cartoni Mancinelli et al., 2021)All these results suggest that the assessment of chicken adaptability to ERS requires a multifactorial approach that simultaneously considers behavior, performance, feather condition, body lesions, meat quality, and health/immune status. Therefore, the selection of representative and effective variables that make this assessment easy to characterize is fundamental. In the present research, we reduced the number of variables from approximately 200 to 9 while maintaining the representativeness of the four main pillars.
The index shown in Figure 3 and Supplementary Table S4 indicated that lighter chickens (i.e., CB and LD) had low adaptability to the ERS, whereas the best index was exhibited by RJ. Because the loadings of different variables suggested varying levels of influence, the index was mainly affected by the oxidative status of meat (MDA of breast, Table 4), followed by productive performance (breast yield and live weight, Table 4 and Supplementary Table S3), whereas minor loadings were recorded for health status (blood in vivo evaluation). The elevated scores of these variables indicate that the combination of these traits plays a key role in distinguishing between genotypes and is crucial for characterizing chicken adaptability to the ERS.
CB showed very kinetic behaviors and a very low growth rate compared to commercial strains (Mancinelli et al., 2023; Menchetti et al., 2024). Although crossbreeding between a local breed and a more productive chicken strain is a widespread strategy used to increase growth performance and obtain more resistant animals (Sungkhapreecha et al., 2022), while also maintaining a certain degree of biodiversity, in our study, the CB showed excessively low productive parameters, resulting in the grouping of this genotype on the negative side of the graph (Figure 2, Panel B, and Figure 3). Similarly, LD demonstrated poor adaptive behavior and did not finalize its kinetic activity in terms of feed acquisition (Cartoni Mancinelli et al., 2023), productive performance, or meat quality (Bonnefous et al., 2022, 2023a), consistent with its welfare-related behaviors (Meuser et al., 2021).
Kinetic behaviors, especially if not well finalized in pasture intake, negatively affect the oxidative status of chickens (Guarino Amato and Castellini, 2022; Bonnefous et al., 2023b, 2023a). Indeed, more active animals show worse in vivo oxidative balance (Mattioli et al., 2017) due to the generation of reactive oxygen species (ROS) induced by movement, which may affect meat oxidative parameters (Siekmann et al., 2018). However, when this oxidative thrust is well balanced by the ingestion of antioxidant molecules (i.e., vitamin E, carotenes, vitamin C, polyphenols; Mattioli et al., 2024) through pasture, optimal meat quality can be obtained. Hence, a good balance between movement and oxidative thrust is desirable, and chicken genotypes able to maintain this balance should be preferred (Dal Bosco et al., 2021).
Based on these considerations, the best index was recorded in RJ chickens, which may be considered a medium-growing genotype, as it showed a DWG of approximately 34 g/d and medium locomotor activity (Failla et al., 2021; Mattioli et al., 2024) associated to a relatively balanced oxidative status (Mattioli et al., 2022, 2024, 2025). In agreement with Sarmiento-García et al. (2021), our findings showed that medium-growing genotypes presented better characteristics in terms of productive performance, health status, and product quality. RJ could be considered a good compromise in terms of welfare, health status, performance, and product quality, which also underlines the genotype’s commercial value.
NN genotypes, although similar to RJ in behavior and health status, showed lower productive performance (DWG 29.69 ± 0.66 vs 33.64 ± 0.75 g/d, respectively, in NN and RJ; Mattioli et al., 2024) and higher lipid and protein oxidation than RJ.
Taking into consideration the multifactor approach used for index development, it can be concluded that both NN and RJ had good adaptability indices, suggesting that either may be classified as ERS-adapted genotypes.
However, it is important to acknowledge some limitations of our index. The proposed index derives from an iterative process carried out on the present dataset; consequently, under other outdoor conditions (e.g., different temperatures, grass cover, environmental enrichment, and seasons) and in the presence of genotypes with very different average daily weight gains and behaviors (i.e., fast-growing strains with DWG > 60 g/d or very slow-growing ones with DWG< 30 g/d), the index might be better characterized by different parameters. It is therefore essential to undertake both internal and external validation. Moreover, the number of variables included in the index could be further reduced, although doing so would compromise the representativeness of certain pillars.
Therefore, beyond the selection of specific variables, the strength of this study resides in its methodological approach, which strikes a deliberate balance between multidimensionality and practical feasibility in creating evaluation tools for the livestock sector.
5 Conclusions
In ERS, the choice of a suitable genotype is a key factor for the success of farming activity, which entails good performance, safeguarding of animal welfare and health status, and meeting consumer expectations for optimal meat quality. From a commercial viewpoint, the present paper underlines that it is possible to estimate adaptability to ERS using a few traits. This investigation demonstrated that testing nine parameters across different pillars (i.e., behavior, body condition, meat quality, and in vivo health) could be an efficient, rapid, and economical strategy—provided that the index is validated under large-scale conditions.
It should be noted that under other outdoor conditions (e.g., different temperatures, grass cover, outdoor enrichment, and seasons) and in the presence of genotypes with very different DWG and behaviors, the index could require further validation and different parameters should also be tested.
Data availability statement
The raw data supporting the conclusions of this article will be made available by the authors, without undue reservation.
Ethics statement
The animal study was approved by Istituto Zooprofilattico dell’Umbria e delle Marche (ID number: 62705 of 07/15/2020). The study was conducted in accordance with the local legislation and institutional requirements.
Author contributions
SM: Conceptualization, Software, Writing – original draft, Investigation, Supervision, Data curation, Methodology, Validation, Visualization. LMe: Methodology, Validation, Data curation, Software, Writing – original draft. EA: Writing – review & editing, Investigation, Methodology, Formal Analysis, Data curation. AC: Investigation, Writing – review & editing, Conceptualization, Data curation, Methodology. AD: Resources, Supervision, Investigation, Conceptualization, Writing – review & editing. LMa: Formal Analysis, Data curation, Methodology, Writing – review & editing. FF: Data curation, Methodology, Investigation, Formal Analysis, Writing – review & editing. LB: Writing – review & editing, Methodology, Formal Analysis, Investigation. LMo: Writing – review & editing, Methodology, Formal Analysis, Data curation. CC: Validation, Conceptualization, Funding acquisition, Methodology, Supervision, Investigation, Resources, Project administration, Software, Data curation, Writing – original draft, Visualization.
Funding
The author(s) declare financial support was received for the research and/or publication of this article. The project has received funding from the European Union’s Horizon 2020 research and innovation programme under grant agreement N˚816172. The funders had no role in study design, data collection and analysis, decision to publish, or preparation of the manuscript.
Acknowledgments
Authors wish to thank Mr. Giovanni Migni and Ms. Cinzia Boldrini for his contribute in animal handling and ungraduated students of Perugia University for their interest in following the present experimentation. Authors wish to thank breeders’ companies (Aviagen, Hubbard and Lohmann) to provide animals for experimentation and PPILOW project partners for the positive opinion. Special thanks to Delanagrace Clark for proofreading the English grammar.
Conflict of interest
The authors declare that the research was conducted in the absence of any commercial or financial relationships that could be construed as a potential conflict of interest.
Generative AI statement
The author(s) declare that no Generative AI was used in the creation of this manuscript.
Publisher’s note
All claims expressed in this article are solely those of the authors and do not necessarily represent those of their affiliated organizations, or those of the publisher, the editors and the reviewers. Any product that may be evaluated in this article, or claim that may be made by its manufacturer, is not guaranteed or endorsed by the publisher.
Supplementary material
The Supplementary Material for this article can be found online at: https://www.frontiersin.org/articles/10.3389/fanim.2025.1648573/full#supplementary-material
References
Abunab H., Dator W. L., and Hawamdeh S. (2017). Effect of olive leaf extract on glucose levels in diabetes-induced rats: A systematic review and meta-analysis. J. Diabetes. 9, 947–957. doi: 10.1111/1753-0407.12508
Agradi S., González-Cabrera M., Argüello A., Hernández-Castellano L. E., Castro N., Menchetti L., et al. (2023). Colostrum quality in different goat breeds reared in northern Italy. Animals 13, 3146. doi: 10.3390/ani13193146
AOAC (1995). “Official methods of analysis 16th Ed,” in Association of official analytical chemists (Sci. Educ, Washington DC, USA).
Berg C. (1998). Foot-pad dermatitis in broilers and Turkeys – prevalence, risk factors and prevention. PhD thesis. Uppsala: Swedish University of Agricultural Sciences, 1–42.
Bist R. B., Bist K., Poudel S., Subedi D., Yang X., Paneru B., et al. (2024). Sustainable poultry farming practices: A critical review of current strategies and future prospects. Poult. Sci. 103 (12), 104295. doi: 10.1016/j.psj.2024.104295
Bonnefous C., Calandreau L., Le Bihan-Duval E., Ferreira V. H. B., Barbin A., Collin A., et al. (2023a). Behavioural indicators of range use in four broiler strains. Appl. Anim. Behav. Sci. 260, 105870. doi: 10.1016/j.applanim.2023.105870
Bonnefous C., Collin A., Guilloteau L. A., Germain K., Ravon L., Bordeau T., et al. (2023b). Performance, meat quality and blood parameters in four strains of organic broilers differ according to range use. Sci. Rep. 14, 30854. doi: 10.1038/s41598-024-81672-9
Bonnefous C., Collin A., Guilloteau L. A., Guesdon V., Filliat C., Réhault-Godbert S., et al. (2022). Welfare issues and potential solutions for laying hens in free range and organic production systems: A review based on literature and interviews. Front. Vet. Sci. 9. doi: 10.3389/fvets.2022.952922
Bosco A. D., Mancinelli A. C., Vaudo G., Cavallo M., Castellini C., and Mattioli S. (2022). Indexing of fatty acids in poultry meat for its characterization in healthy human nutrition : A comprehensive application of the scientific literature and new proposals. Nutrients 14, 3110. doi: 10.3390/nu14153110
Bradford M. M. (1976). A rapid and sensitive method for the quantitation of microgram quantities of protein utilizing the principle of protein-dye binding. Anal. Biochem. doi: 10.1016/0003-2697(76)90527-3
Carré B. and Rozo E. (1990). La prédiction de la valeur énergétique des matières premières destinées à l’aviculture. Productions Animales 3, 163–169.
Cartoni Mancinelli A., Mattioli S., Menchetti L., Dal Bosco A., Ciarelli C., Amato M. G., et al. (2021). The assessment of a multifactorial score for the adaptability evaluation of six poultry genotypes to the organic system. Animals 11, 2992. doi: 10.3390/ani11102992
Cartoni Mancinelli A., Trocino A., Menchetti L., Chiattelli D., Ciarelli C., and Castellini C. (2023). New approaches to selecting a scan-sampling method for chicken behavioral observations and their practical implications. Sci. Rep. 13, 17177. doi: 10.1038/s41598-023-44126-2
Castellini C., Dal Bosco A., Mugnai C., and Bernardini M. (2002). Performance and behaviour of chickens with different growing rate reared according to the organic system. Ital. J. Anim. Sci. 1, 290–300. doi: 10.4081/ijas.2002.291
Castellini C., Mugnai C., Moscati L., Mattioli S., Amato M. G., Mancinelli A. C., et al. (2016). Adaptation to organic rearing system of eight different chicken genotypes: Behaviour, welfare and performance. Ital. J. Anim. Sci. 15, 37–46. doi: 10.1080/1828051X.2015.1131893
Chen Y., Liu Y., Zhao C., Ma J., and Guo J. (2025). Antibiotic resistance gene pollution in poultry farming environments and approaches for mitigation: A system review. Poult. Sci. 104 (3), 104858. doi: 10.1016/j.psj.2025.104858
Christie W. W. (1982). A simple procedure for rapid transmethylation of glycerolipids and cholesteryl esters. J. Lipid Res. 23, 1072–1075. doi: 10.1016/S0022-2275(20)38081-0
Dal Bosco A., Mattioli S., Cartoni Mancinelli A., Cotozzolo E., and Castellini C. (2021). Extensive rearing systems in poultry production: The right chicken for the right farming system. A review of twenty years of scientific research in Perugia University, Italy. Animals 11, 1281. doi: 10.3390/ani11051281
Dalle-Donne I., Rossi R., Giustarini D., Milzani A., and Colombo R. (2003). Protein carbonyl groups as biomarkers of oxidative stress. Clin. Chim. Acta 329, 23–38. doi: 10.1016/S0009-8981(03)00003-2
Failla S., Buttazzoni L., Zilio D. M., Contò M., Renzi G., Castellini C., et al. (2021). An index to measure the activity attitude of broilers in extensive system. Poult. Sci. 100, 101279. doi: 10.1016/j.psj.2021.101279
Field A. (2009). Multilevel linear models. Discov. Stat. Using SPSS. Vol 896. (London, UK: SAGE Publications Limited).
Field A. (2024). Discovering statistics using IBM SPSS statistics (Los Angeles, California: Sage publications limited).
Folch J., Lees M., and Sloane Stanley G. H. (1957). A simple method for the isolation and purification of total lipides from animal tissues. J. Biol. Chem. 226, 497–509. doi: 10.3989/scimar.2005.69n187
Frizzarin M., Visentin G., Ferragina A., Hayes E., Bevilacqua A., Dhariyal B., et al. (2023). Classification of cow diet based on milk Mid Infrared Spectra: A data analysis competition at the “International Workshop on Spectroscopy and Chemometrics 2022. Chemom. Intell. Lab. Syst. 234, 104755. doi: 10.1016/j.chemolab.2023.104755
Garson G. D. (2012a). Discriminant function analysis Vol. 554 (Asheboro, NC Stat. Assoc. Publ), 555.
Garson G. D. (2012b). Testing statistical assumptions. Blue B. Ser. (Asheboro, NC Stat. Assoc. Publ), 1–54.
Guarino Amato M. and Castellini C. (2022). Adaptability challenges for organic broiler chickens: a commentary. Animals 12, 1354. doi: 10.3390/ani12111354
Hewavitharana A. K., Lanari M. C., and Becu C. (2004). Simultaneous determination of Vitamin E homologs in chicken meat by liquid chromatography with fluorescence detection. J. Chromatogr. A. 1025, 313–317. doi: 10.1016/j.chroma.2003.10.052
Jacobs L., Blatchford R. A., De Jong I. C., Erasmus M. A., Levengood M., Newberry R. C., et al. (2023). Enhancing their quality of life: environmental enrichment for poultry. Poult. Sci. 102, 102233. doi: 10.1016/j.psj.2022.102233
Ke P. J., Ackman R. G., Linke B. A., and Nash D. M. (1977). Differential lipid oxidation in various parts of frozen mackerel. Int. J. Food Sci. Technol. 12, 37–47. doi: 10.1111/j.1365-2621.1977.tb00083.x
Korkeala H., Mäki-Petäys O., Alanko T., and Sorvettula O. (1986). Determination of pH in meat. Meat Sci. 18, 121–132. doi: 10.1016/0309-1740(86)90088-4
Mancinelli A. C., Amato M. G., Zillio D. M., Dal Bosco A., Mattioli S., and Castellini C. (2017). Chicken adaptability in alternative systems adaptive response of chicken strains to the organic and free range rearing systems. J. Dairy Vet. Sci. 4. doi: 10.19080/JDVS.2017.04.555644
Mancinelli A. C., Mattioli S., Bosco A. D., Aliberti A., Amato M. G., and Castellini C. (2020). Performance, behavior, and welfare status of six different organically reared poultry genotypes. Animals. 10, 550. doi: 10.3390/ani10040550
Mancinelli A. C., Menchetti L., Birolo M., Bittante G., Chiattelli D., and Castellini C. (2023). Crossbreeding to improve local chicken breeds: Predicting growth performance of the crosses using the Gompertz model and estimated heterosis. Poult. Sci. 102, 102783. doi: 10.1016/j.psj.2023.102783
Mattioli S., Angelucci E., Castellini C., Mancinelli A. C., Chenggang W., Di Federico F., et al. (2024). Effect of genotype and outdoor enrichment on productive performance and meat quality of slow growing chickens. Poult. Sci. 103, 104131. doi: 10.1016/j.psj.2024.104131
Mattioli S., Angelucci E., Madeo L., Bonnefous C., Mancinelli A. C., Ciarelli C., et al. (2025). Kinetic activity in slow-growing chickens: effect on antioxidant content, fatty acids profile, lipid oxidation and metabolism of blood and thigh muscles. Animal 19 (7), 101569. doi: 10.1016/j.animal.2025.101569
Mattioli S., Cartoni Mancinelli A., Menchetti L., Dal Bosco A., Madeo L., Guarino Amato M., et al. (2021). How the kinetic behavior of organic chickens affects productive performance and blood and meat oxidative status: a study of six poultry genotypes. Poult. Sci. 100, 101297. doi: 10.1016/j.psj.2021.101297
Mattioli S., Dal Bosco A., Duarte J. M. M., D’Amato R., Castellini C., Beone G. M., et al. (2019). Use of Selenium-enriched olive leaves in the feed of growing rabbits: Effect on oxidative status, mineral profile and Selenium speciation of Longissimus dorsi meat. J. Trace Elem. Med. Biol. 51, 98–105. doi: 10.1016/j.jtemb.2018.10.004
Mattioli S., MaChado Duarte J. M., Castellini C., D’Amato R., Regni L., Proietti P., et al. (2018). Use of olive leaves (whether or not fortified with sodium selenate) in rabbit feeding: Effect on performance, carcass and meat characteristics, and estimated indexes of fatty acid metabolism. Meat Sci. 143, 230–236. doi: 10.1016/j.meatsci.2018.05.010
Mattioli S., Mancinelli A. C., Dal Bosco A., Ciarelli C., Amato M. G., Angelucci E., et al. (2022). Intake of nutrients (polyunsaturated fatty acids, tocols, and carotenes) and storage efficiency in different slow-growing chickens genotypes reared in extensive systems. PloS One 17, e0275527. doi: 10.1371/journal.pone.0275527
Mattioli S., Ruggeri S., Sebastiani B., Brecchia G., Dal Bosco A., Cartoni Mancinelli A., et al. (2017). Performance and egg quality of laying hens fed flaxseed: Highlights on n-3 fatty acids, cholesterol, lignans and isoflavones. Animal 11, 705–712. doi: 10.1017/S175173111600207X
McCloy M. W. D., Andringa R. K., and Grace J. K. (2022). Resilience of avian communities to urbanization and climate change: an integrative review. Front. Conserv. Sci. 3. doi: 10.3389/fcosc.2022.918873
Menchetti L., Birolo M., Mugnai C., Mancinelli A. C., Xiccato G., Trocino A., et al. (2024). Effect of genotype and nutritional and environmental challenges on growth curve dynamics of broiler chickens. Poult. Sci. 103, 104095. doi: 10.1016/j.psj.2024.104095
Menchetti L., Calipari S., Guelfi G., Catanzaro A., and Diverio S. (2018). My dog is not my cat: Owner perception of the personalities of dogs and cats living in the same household. Animals 8, 80. doi: 10.3390/ani8060080
Menchetti L., Righi C., Guelfi G., Enas C., Moscati L., Mancini S., et al. (2019). Multi-Operator Qualitative Behavioural Assessment for dogs entering the shelter. Appl. Anim. Behav. Sci. 213, 107–116. doi: 10.1016/j.applanim.2019.02.008
Meuser V., Weinhold L., Hillemacher S., and Tiemann I. (2021). Welfare-related behaviors in chickens: Characterization of fear and exploration in local and commercial chicken strains. Animals 11, 679. doi: 10.3390/ani11030679
Morelli F., Benedetti Y., Møller A. P., and Fuller R. A. (2019). Measuring avian specialization. Ecol. Evol. 9, 8378–8386. doi: 10.1002/ece3.5419
Nwaigwe C. U., Ihedioha J. I., Shoyinka S. V., and Nwaigwe C. O. (2020). Evaluation of the hematological and clinical biochemical markers of stress in broiler chickens. Vet. World 13, 2294. doi: 10.14202/vetworld.2020.2294-2300
Okasha H. M. (2021). Some factors affecting blood parameters of broiler chickens. Ann. Agric. Sci. Moshtohor 59, 425–434. doi: 10.21608/assjm.2021.186380
Ortolani F., Scilimati N., Gialletti R., Menchetti L., and Nannarone S. (2021). Development and preliminary validation of a pain scale for ophthalmic pain in horses: The Equine Ophthalmic Pain Scale (EOPS). Vet. J. 278, 105774. doi: 10.1016/j.tvjl.2021.105774
Pérez-gálvez A., Viera I., and Roca M. (2020). Carotenoids and chlorophylls as antioxidants. Antioxidants 9, 1–39. doi: 10.3390/antiox9060505
Perić L., Strugar V., Bogosavljević-Bošković S., and Đukić-Stojčić M. (2018). Effect of genotype and sex on carcass characteristics of chickens raised in extensive system. Biotechnol. Anim. Husb. 34, 405–417. doi: 10.2298/BAH1804405P
Pituch K. A. and Stevens J. P. (2016). Applied multivariate statistics for the social sciences: Analyses with SAS and IBM’s SPSS. (Routledge). doi: 10.1017/CBO9781107415324.004
Robertson A. R. (1977). The CIE 1976 color-difference formulae. Color Res. Appl. 2, 7–11. doi: 10.1002/j.1520-6378.1977.tb00104.x
Sarmiento-García A., Revilla I., Abecia J.-A., and Palacios C. (2021). Performance evaluation of two slow-medium growing chicken strains maintained under organic production system during different seasons. Animals 11, 1090. doi: 10.3390/ani11041090
Schüep W. and Rettenmaier R. (1994). Analysis of vitamin E homologs in plasma and tissue: High-performance liquid chromatography. Methods Enzymol. 234, 294–302. doi: 10.1016/0076-6879(94)34096-X
Siekmann L., Meier-Dinkel L., Janisch S., Altmann B., Kaltwasser C., Sürie C., et al. (2018). Carcass quality, meat quality and sensory properties of the dual-purpose chicken Lohmann Dual. Foods 7, 156. doi: 10.3390/foods7100156
Statistics A. B. O. (1986). Socio-economic indexes for areas. Aust. Bur. Stat. Available online at: http://www.abs.gov.au/.
Statistics A. B. O. (2011). Socio-economic indexes for areas (SEIFA). Canberra Aust. Bur. Stat, 1–39.
Sungkhapreecha P., Chankitisakul V., Duangjinda M., and Boonkum W. (2022). Combining abilities, heterosis, growth performance, and carcass characteristics in a diallel cross from black-bone chickens and Thai native chickens. Animals 12, 1602. doi: 10.3390/ani12131602
Tallentire C. W., Leinonen I., and Kyriazakis I. (2016). Breeding for efficiency in the broiler chicken: a review. Agron. Sustain. Dev. 36, 1–16. doi: 10.1007/s13593-016-0398-2
Tauson R. (1984). Plumage condition in SCWL laying hens kept in conventional cages of different designs. Acta Agric. Scand. 34, 221–230. doi: 10.1080/00015128409435391
Vahmani P., Rolland D. C., McAllister T. A., Block H. C., Proctor S. D., Guan L. L., et al. (2017). Effects of feeding steers extruded flaxseed on its own before hay or mixed with hay on animal performance, carcass quality, and meat and hamburger fatty acid composition. Meat Sci. 131, 9–17. doi: 10.1016/j.meatsci.2017.04.008
Keywords: adaptability, index, oxidation, slow growing genotypes, welfare
Citation: Mattioli S, Menchetti L, Angelucci E, Cartoni Mancinelli A, Dal Bosco A, Madeo L, Di Federico F, Bosa L, Moscati L and Castellini C (2025) An index for the estimation of chicken adaptability to free-range farming systems of different slow-growing genotypes. Front. Anim. Sci. 6:1648573. doi: 10.3389/fanim.2025.1648573
Received: 17 June 2025; Accepted: 21 July 2025;
Published: 14 August 2025.
Edited by:
Vishwajit S. Chowdhury, Kyushu University, JapanReviewed by:
Hatem Eltahan, Agricultural Research Center, EgyptMohammad Bahry, University of Guelph, Canada
Copyright © 2025 Mattioli, Menchetti, Angelucci, Cartoni Mancinelli, Dal Bosco, Madeo, Di Federico, Bosa, Moscati and Castellini. This is an open-access article distributed under the terms of the Creative Commons Attribution License (CC BY). The use, distribution or reproduction in other forums is permitted, provided the original author(s) and the copyright owner(s) are credited and that the original publication in this journal is cited, in accordance with accepted academic practice. No use, distribution or reproduction is permitted which does not comply with these terms.
*Correspondence: Simona Mattioli, c21vbmEubWF0dGlvbGlAdW5pcGcuaXQ=