 Ran Wang1
 Wanlu Ren
 Luling Li
 Yi Su
Yi Su Jianwen Wang
- 1College of Animal Science, Xinjiang Agricultural University, Urumqi, China
- 2Xinjiang Key Laboratory of Equine Breeding and Exercise Physiology, Urumqi, China
The Kazakh horse is one of the important horse breeds in China. The distribution of its adipose tissue and the characteristics of lipid metabolism play a crucial role in the horse’s fat utilization efficiency, meat quality, and energy storage. This study employed tissue sectioning, LC-MS/MS, and related methodologies to characterize variations in cellular morphology, fatty acid profiles, and lipid metabolite composition across neck adipose tissue (NAT), abdominal adipose tissue (AAT), and mesenteric adipose tissue (MAT) in Kazakh horses. Adipocyte area and diameter were largest in MAT, while Adipocyte number was highest in NAT. Notably, horse adipose tissue demonstrated a high abundance of unsaturated fatty acids, particularly oleic acid and linoleic acid. Among these, saturated fatty acids and polyunsaturated fatty acids were higher in MAT, while monounsaturated fatty acids were higher in NAT. Lipidomic profiling identified 170, 44, and 109 differentially abundant lipid species (DALs) in the NAT-MAT, AAT-MAT, and NAT-AAT comparisons, respectively. With triglycerides (TG), phosphatidylcholine (PC), and phosphatidylethanolamine (PE) being particularly prominent. KEGG results show that Glycerophospholipid metabolism, Glycerolipid metabolism, Linoleic acid metabolism, and alpha-Linolenic acid metabolism are the main pathways involved in adipose metabolism. These findings delineate regional disparities in adipose cellular morphology, fatty acid profiles, and lipid metabolite composition in the Kazakh horse, offering mechanistic insights to inform strategies for lipid regulation and tissue-specific fat management.
1 Introduction
The Kazakh horse, recognized as an excellent breed in China, has garnered significant attention due to its remarkable meat and milk production capabilities, early maturity, tolerance to roughage, and strong adaptability to diverse environments (Wubulikasimu et al., 2025). As research on equine genetic resources advances, the diverse functions and importance of fat within the horse’s body are becoming increasingly evident. Adipose tissue, an economically significant trait, is closely linked to the production efficiency and meat quality of animals used for food production. The deposition of fat directly impacts the quality of meat and the overall production efficiency.
Horse fat is a valuable dietary product, rich in unsaturated fatty acids (Petrov et al., 2020). The total content of n-3 polyunsaturated fatty acids (PUFAs) in muscle fat ranges from 1.17% to 18.9%, while the content in subcutaneous fat of the back ranges from 1.52% to 27.9% (Belaunzaran et al., 2017). n-3 PUFAs can prevent atherosclerotic cardiovascular diseases, with potential mechanisms including effects on plasma triglyceride (TG) levels, lipoprotein size, inflammation, and vascular function (Liu et al., 2022). Therefore, horse fat offers significant health benefits for humans.
Adipose tissue primarily comprises adipocytes, which function as both energy reservoirs and metabolically active endocrine units involved in systemic energy homeostasis and metabolic modulation (Scherer, 2006). In mammals, energy is stored as triglycerides within adipocytes, which also mobilize free fatty acids to meet energetic demands (Vishvanath and Gupta, 2019). These cells actively undergo proliferation and differentiation, contributing to adipose accumulation across various depots (Audano et al., 2022; Luo et al., 2023). Anatomically, adipose tissue is categorized into subcutaneous adipose tissue (SAT), abdominal adipose tissue (AAT), visceral adipose tissue (VAT), and intramuscular adipose tissue (Du et al., 2022). As a structurally and functionally heterogeneous organ, adipose tissue exhibits site-specific variations at the cellular, molecular, physiological, and functional levels (Mottillo and Steinberg, 2020). SAT, situated beneath the dermis, serves as the principal lipid reservoir and contributes to thermoregulation and lipid metabolism (Ibrahim, 2010). It also displays distinct features in adipogenesis, insulin responsiveness, and adipokine secretion (Lee et al., 2013; Qiang et al., 2016). VAT, in contrast, is crucial in maintaining glucose and lipid equilibrium by storing surplus energy and releasing regulatory hormones, cytokines, and chemokines that influence appetite, nutrient storage, and catabolic processes (Lu et al., 2025; Nawrocki and Scherer, 2004). VAT-derived adipocytes demonstrate enhanced capacities for lipid synthesis and breakdown relative to their SAT counterparts (Wajchenberg, 2000). In livestock, excessive AAT accumulation is regarded as a detrimental economic trait (Jiang et al., 2017). Given these anatomical and metabolic distinctions, it is hypothesized that site-specific adipose tissues exert differential regulatory effects on lipid metabolism.
Although previous studies have provided preliminary insights into the heterogeneity of adipose tissue in livestock, there has been no research specifically examining the lipid metabolic characteristics of adipose tissue in different regions of the Kazakh horse. Therefore, we conducted a comparative analysis of the neck adipose tissue (NAT, subcutaneous fat), abdominal adipose tissue (AAT, abdominal fat), and mesenteric adipose tissue (MAT, visceral fat) in Kazakh horses. This study focused on the morphology of adipocytes, fatty acid profiles, and lipid metabolite distribution across the three regions. Our findings provide foundational data for a comprehensive understanding of the heterogeneity of adipose tissue in Kazakh horses and its regulatory pathways, offering scientific evidence for future strategies aimed at targeted fat deposition regulation and improving fat utilization efficiency in horses.
2 Materials and methods
2.1 Sample collection
Six 3.5-year-old Kazakh stallions (375–400 kg) originating from Changji, Xinjiang, China, maintained under uniform grazing conditions, were utilized for this study. Throughout the rearing period, unrestricted access to feed and water was provided. Prior to slaughter, the animals underwent a 24-hour fasting period and a 2-hour water withdrawal. Within 30 minutes postmortem, 20 g samples of NAT, AAT, and MAT were excised. Portions were sectioned into 1 cm × 1 cm × 0.5 cm blocks and fixed in 4% paraformaldehyde for histological processing, while the remaining tissue was preserved in liquid nitrogen for subsequent fatty acid and lipidomic profiling.
2.2 Histomorphological analysis
Adipose tissues preserved in 4% paraformaldehyde underwent standard dehydration, clearing, and paraffin embedding procedures. Sections were dewaxed and stained using hematoxylin and eosin. Optical microscopy was employed to visualize tissue morphology, and images were acquired accordingly. For each sample, five non-overlapping fields were analyzed. Adipocyte diameter and area were quantified using Image-Pro Plus 6.0 software (Media Cybernetics Corporation, Rockville, MD, USA), and cell counts within the defined regions were recorded.
2.3 Extraction and analysis of fatty acid
Fatty acid profiling was performed via LC-MS/MS. Lipid content was extracted using an isopropanol–acetonitrile mixture (1:1, v/v), with 1 g of fat isolated per sample and quantified gravimetrically following Folch’s protocol (Folch et al., 1957). Fatty acid methyl esters were derived from total lipid through acid-catalyzed transesterification according to Christie’s method (Christie, 1982) and subsequently quantified by liquid chromatography. Chromatographic separation was conducted on a Waters ACQUITY UPLC BEH C18 column using 0.1% formic acid in acetonitrile/water (1:1, v/v) as solvent A and isopropanol/acetonitrile (1:1, v/v) as solvent B, at a flow rate of 0.30 mL/min.
2.4 Extraction and analysis of lipid metabolites
A 100 mg aliquot of sample was weighed and homogenized under liquid nitrogen, followed by lipid metabolite extraction based on the protocol outlined by Matyash (Matyash et al., 2008). The resulting lipid extract was preserved at −20°C and subsequently subjected to LC-MS/MS analysis. Chromatographic separation was conducted using a Thermo Accucore C30 column. The mobile phase A consisted of acetonitrile/water (6:4) with 10 mM ammonium acetate and 0.1% formic acid, while mobile phase B was acetonitrile/isopropanol (1:9) containing the same additives. The system operated at a flow rate of 0.35 mL/min and a column temperature of 40°C. Detection employed electrospray ionization in both positive and negative ion modes, with instrumental parameters set as follows: capillary temperature at 320 °C, sheath gas at 40 psi, auxiliary gas at 7 L/min, spray voltage at 3.5 kV, and mass scanning over an m/z range of 100–1500.
Raw spectral data were processed and annotated through database comparison to achieve both qualitative and quantitative lipid profiling, followed by stringent quality control procedures. Differential lipid metabolites were identified using an OPLS-DA model based on VIP scores, fold change (FC), and corresponding t-test p values. Metabolites satisfying the criteria VIP > 1, P < 0.05, and FC ≥ 2 or FC ≤ 0.5 were considered statistically significant. KEGG pathway enrichment analysis of significant lipids was conducted using MetaboAnalyst to elucidate metabolic pathways with substantial impact on lipid metabolism.
2.5 Statistical analysis
Statistical analyses of adipose tissue morphology and fatty acid profiles were conducted using SPSS 27.0 via one-way ANOVA. Group-wise differences were assessed through LSD post hoc testing, with results reported as mean ± standard error (Mean ± SE). Visualization of adipose tissue morphology was performed in GraphPad Prism. Statistical significance was defined at P< 0.05, and high significance at P < 0.01.
3 Results
3.1 Morphological differences of adipose tissues across different regions
Adipose tissues from three anatomical sites of the Kazakh horse were subjected to paraffin embedding and HE staining. Representative microscopic images of adipocytes were presented in Figures 1A–C. Quantitative analysis revealed that the adipocyte area (Figure 1D) and diameter (Figure 1E) in the MAT were significantly larger than those in both the NAT and AAT. Furthermore, the adipocyte area (Figure 1D) and diameter (Figure 1E) in the AAT were significantly larger than in the NAT (P < 0.01). In fields of the same size, the number of adipocytes in both the AAT and MAT was significantly lower than in the NAT (P < 0.01) (Figure 1F), with MAT showing a significantly smaller number compared to AAT (P < 0.01) (Figure 1F).
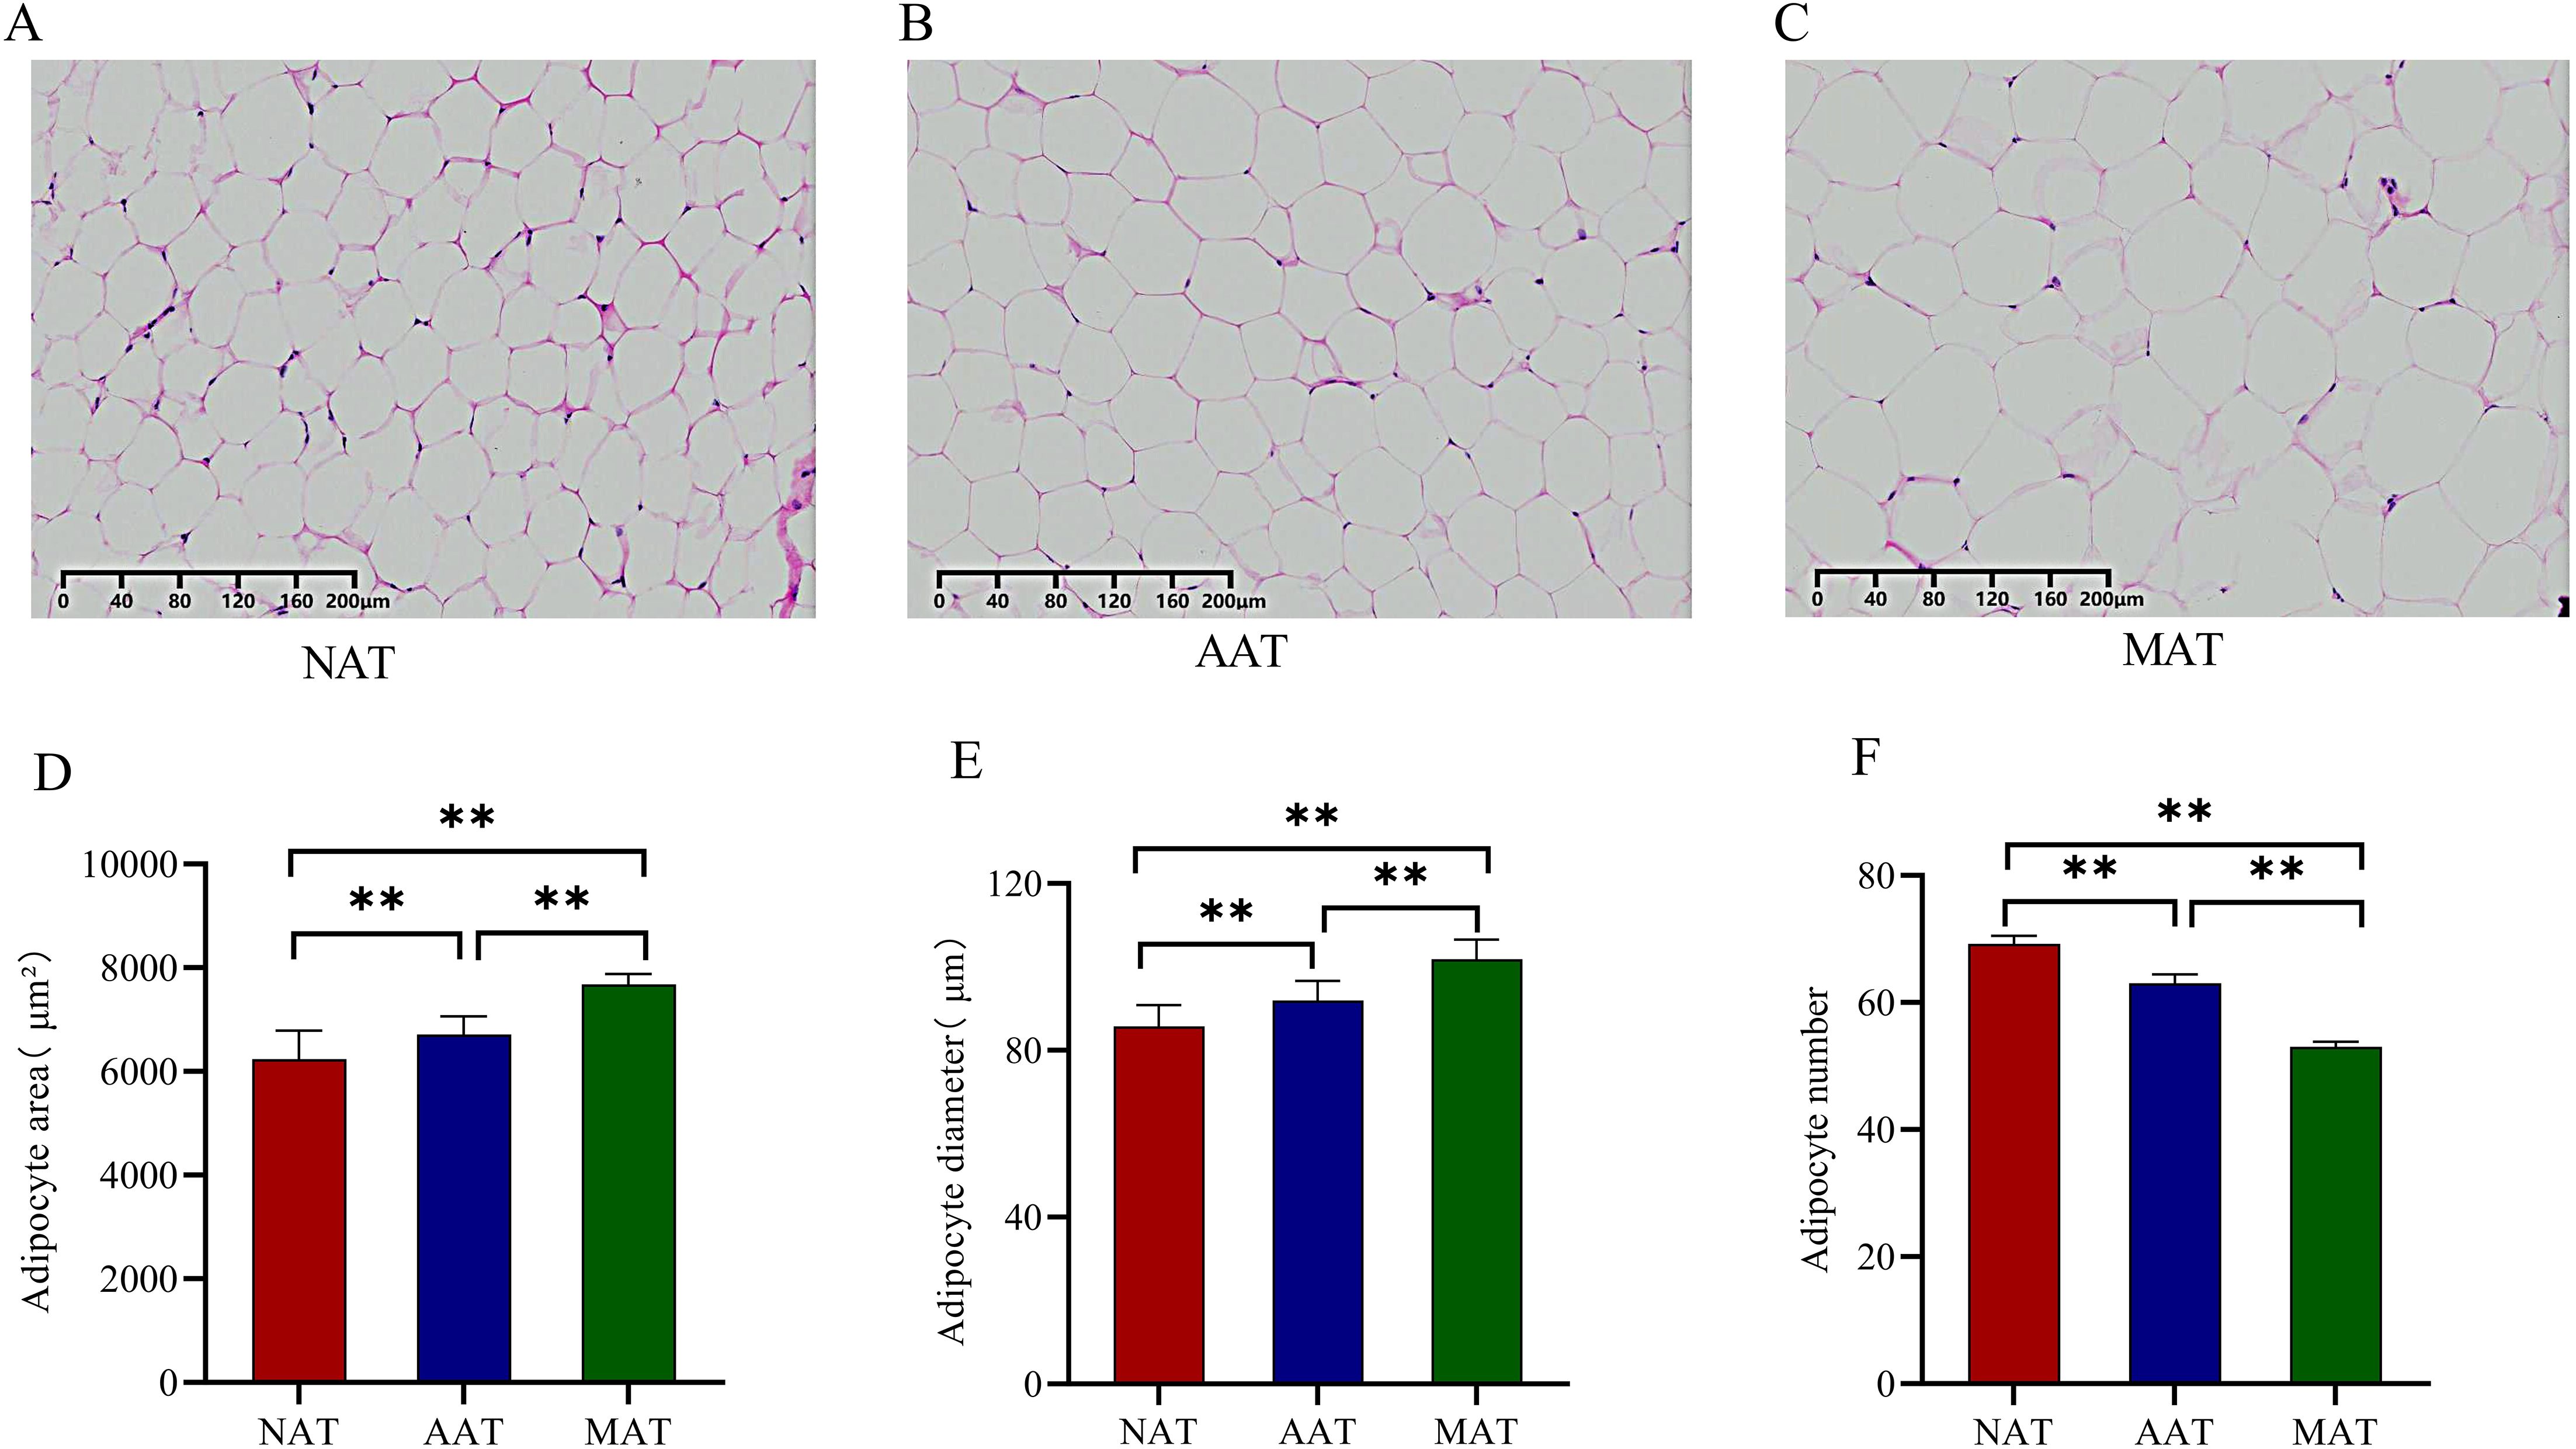
Figure 1. Analysis of adipocyte morphology in adipose tissue across different regions. (A) NAT cell morphology. (B) AAT cell morphology. (C) MAT cell morphology. (D) Comparison of adipocyte area. (E) Comparison of adipocyte diameter. (F) Comparison of adipocyte count. ** represents P < 0.01.
3.2 Analysis of fatty acid content and composition
A total of 29 fatty acids were identified in the NAT, AAT, and MAT of Kazakh horses (Table 1), comprising 15 saturated fatty acids (SFA), 7 monounsaturated fatty acids (MUFA), and 7 PUFA. The predominant constituents included oleic acid (C18:1), hexadecanoic acid (C16:0), linoleic acid (C18:2(n-6)), tetradecanoic acid (C14:0), octadecanoic acid (C18:0), palmitoleic acid (C16:1), and α-linolenic acid (C18:3(n-3)). Across all regions, MUFA levels exceeded those of SFA and PUFA. AAT and MAT exhibited significantly elevated SFA concentrations relative to NAT, particularly in Caprylic acid (C8:0), Decanoic acid (C10:0), Hendecanoic acid (C11:0), Tridecanoic acid (C13:0), Tetradecanoic acid (C14:0), Pentadecanoic acid (C15:0), Heptadecanoic acid (C17:0), Arachidic acid (C20:0), Heneicosanoic acid (C21:0), and Tricosanoic acid (C23:0) (P < 0.01). C18:0 content followed a descending order of AAT > MAT > NAT, with statistically significant differences (P < 0.01). Both C12:0 and C16:0 levels were significantly higher in MAT than in AAT and NAT, and their concentrations in AAT also exceeded those in NAT (P < 0.01). MUFA levels were highest in NAT, with significantly greater concentrations of myristoleic acid (C14:1), cis-10-pentadecenoic acid (C15:1), palmitoleic acid (C16:1), cis-10-heptadecenoic acid (C17:1), oleic acid (C18:1), cis-11-eicosenoic acid (C20:1), and nervonic acid (C24:1) compared to AAT and MAT. Within this group, C18:1 levels were higher in AAT than MAT, while C16:1 was more abundant in MAT than AAT (P < 0.01). PUFA concentrations were significantly elevated in AAT and MAT compared to NAT, particularly C18:2(n-6) (P < 0.01). Figure 2 presents the results of hierarchical clustering analysis of differentially expressed fatty acids in adipose tissues from three distinct regions. The analysis identified three clusters, indicating significant differences in fatty acid composition between the regions (p < 0.01).
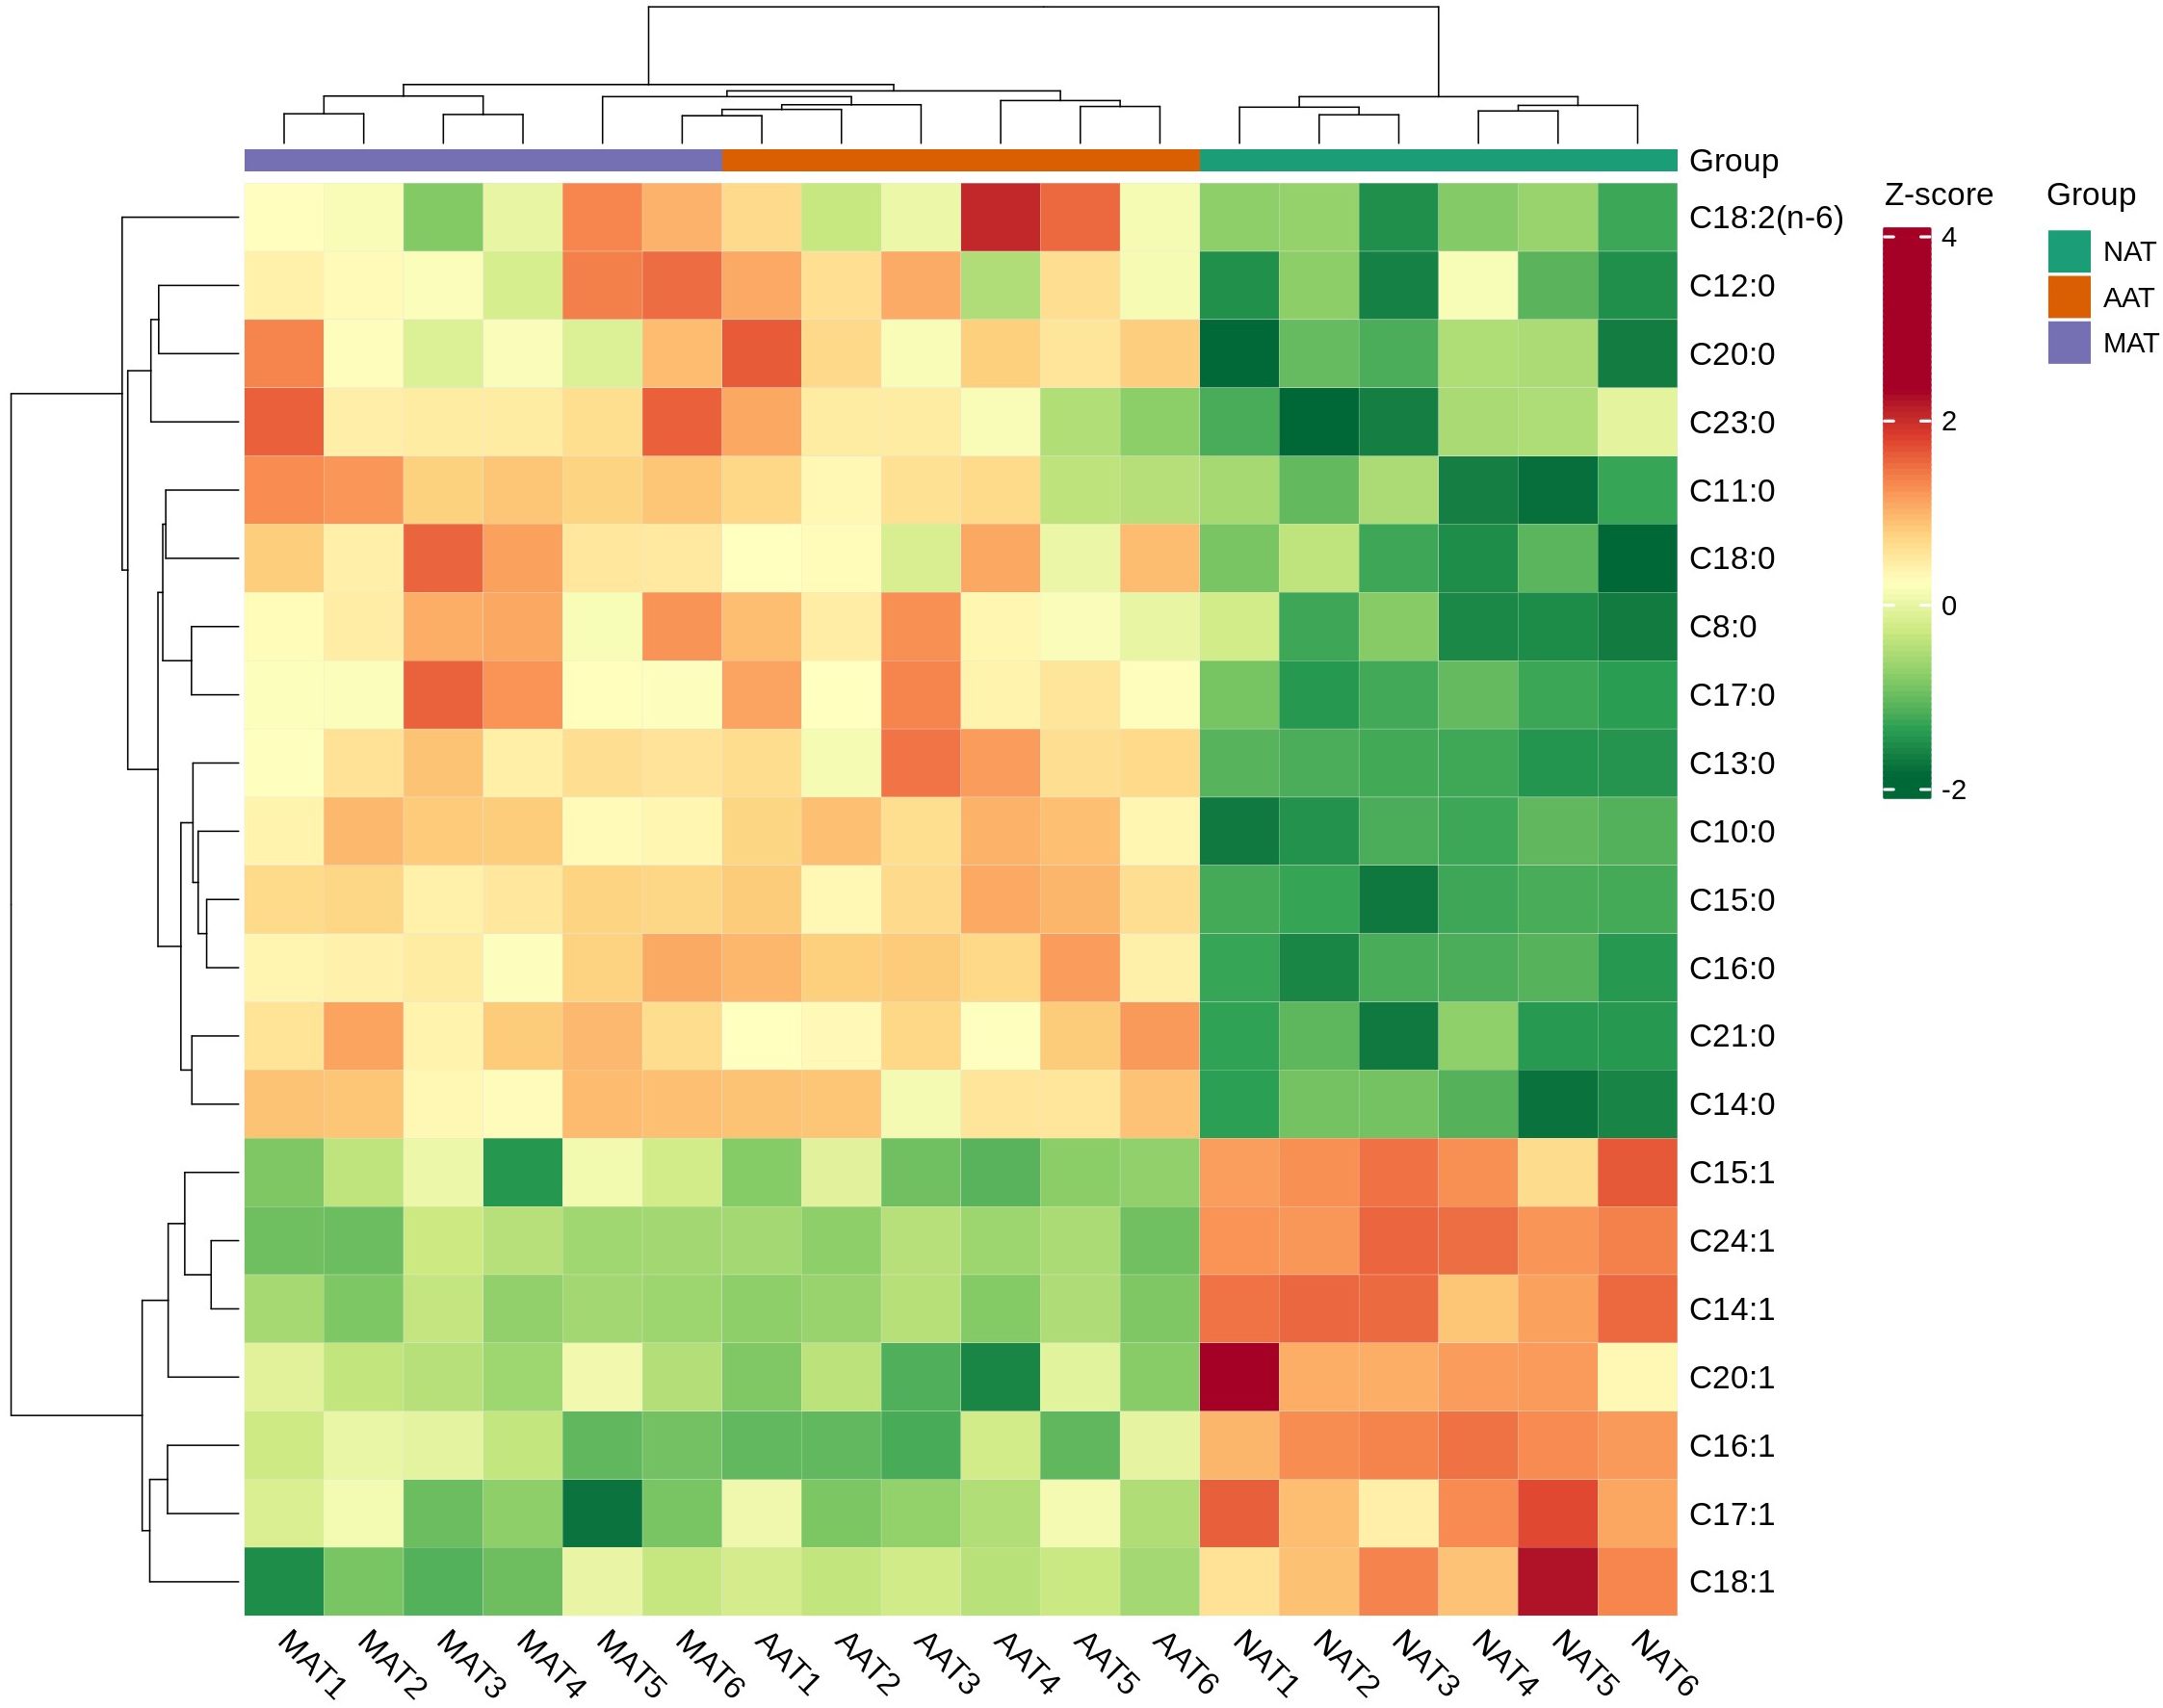
Figure 2. Hierarchical clustering of differentially expressed fatty acids in different adipose tissue regions (P < 0.01).
3.3 Lipidomic profiling of adipose tissues across different regions
3.3.1 OPLS-DA
OPLS-DA was applied to the lipidomic profiles of NAT, AAT, and MAT. For NAT-MAT, the first and second components (C1 and C2) accounted for 48.1% and 11.8% of the variance, respectively (Figure 3A), with R2X = 0.599, R2Y = 0.950, and Q2 = 0.877 (Figure 3B). In the AAT-MAT comparison, C1 and C2 contributed 45.1% and 19.2%, respectively (Figure 3C), and the model yielded R2X = 0.643, R2Y = 0.921, and Q2 = 0.678 (Figure 4D). For NAT-AAT, C1 and C2 explained 62.1% and 10.4% of the variation (Figure 3E), with R2X = 0.725, R2Y = 0.961, and Q2 = 0.866 (Figure 3F). Clear separation among the three sample groups was evident in Figures 3A, C, E. In all models, Q2 values exceeded 0.5, reflecting robust performance.
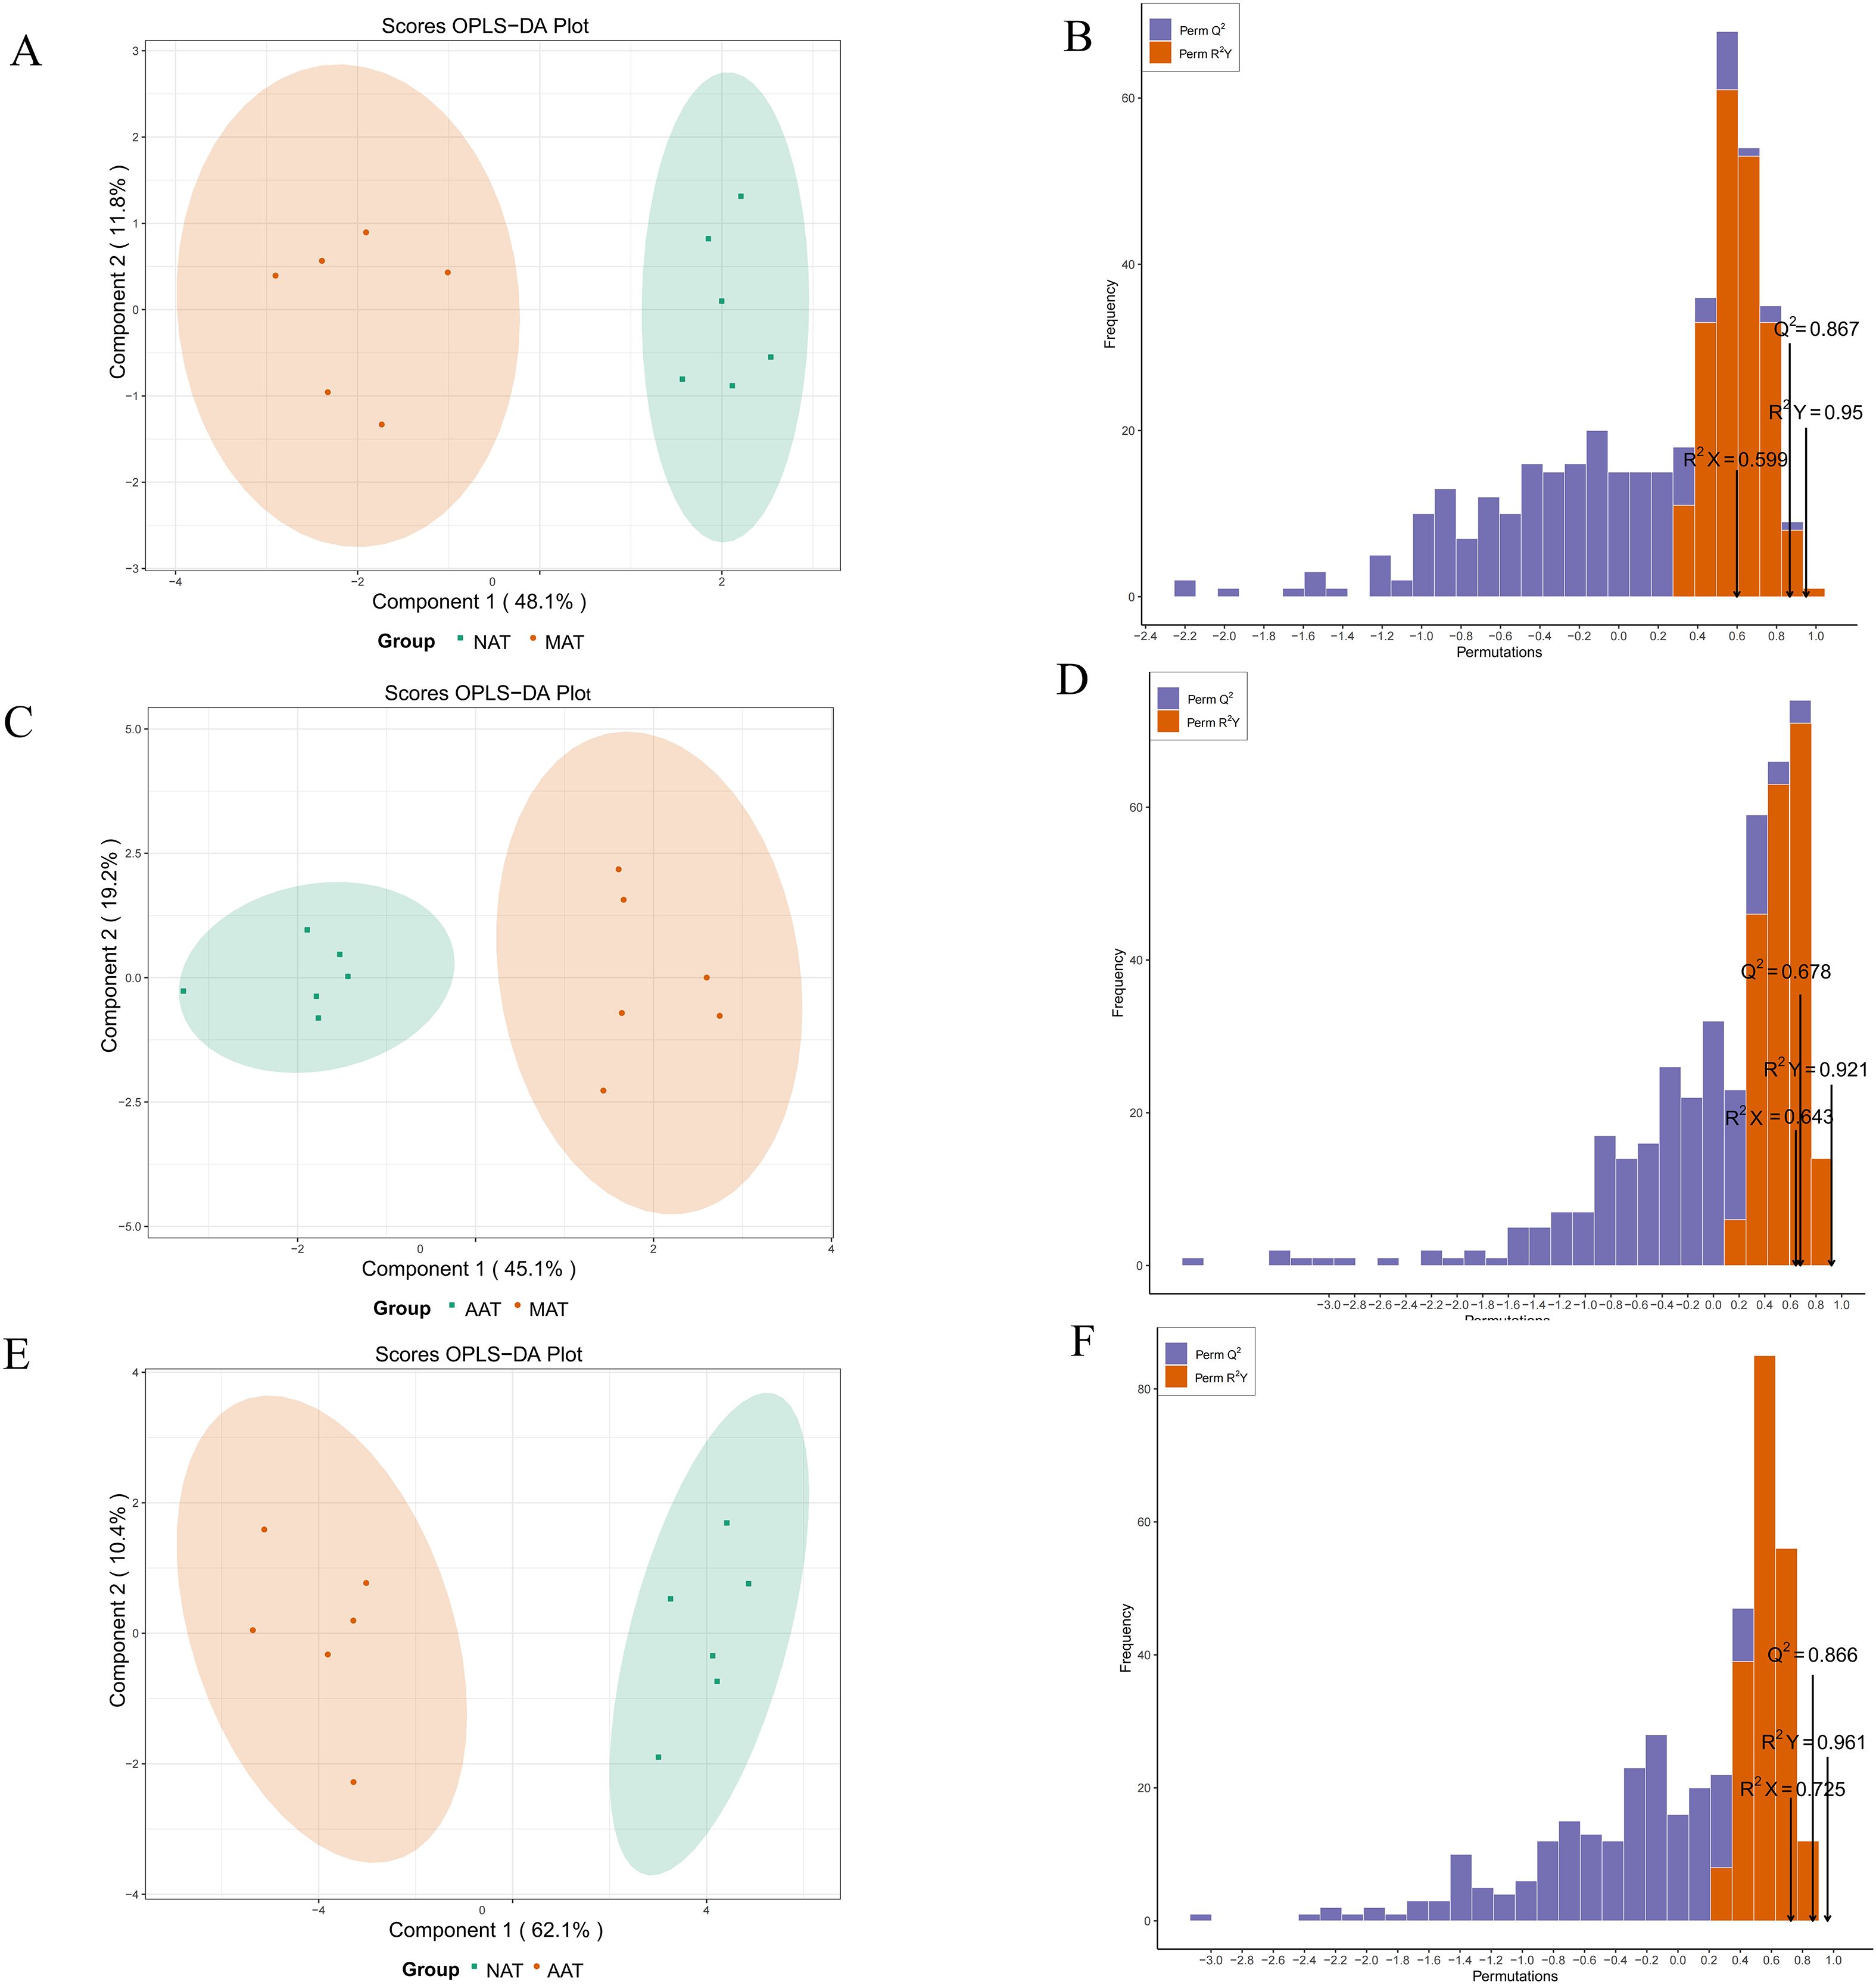
Figure 3. OPLS-DA based on NAT, AAT, and MAT lipid molecules. (A) NAT-MAT score. (B) NAT-MAT permutation test. (C) AAT-MAT score. (D) AAT-MAT permutation test. (E) NAT-AAT score. (F) NAT-AAT permutation test.
3.3.2 Lipid metabolite content and composition
A total of 2,418 lipid species were identified across the three sample groups and annotated using the HMDB database, resulting in classification into seven distinct lipid categories (Figure 4). The distribution comprised 1,083 Glycerophospholipids (GP, 44.80%), 1,071 Glycerolipids (GL, 44.30%), 159 Sphingolipids (SP, 6.57%), 74 Fatty Acids (FA, 3.06%), 19 Derivatized lipids (0.78%), 9 Sterol Lipids (ST, 0.37%), and additional minor constituents.
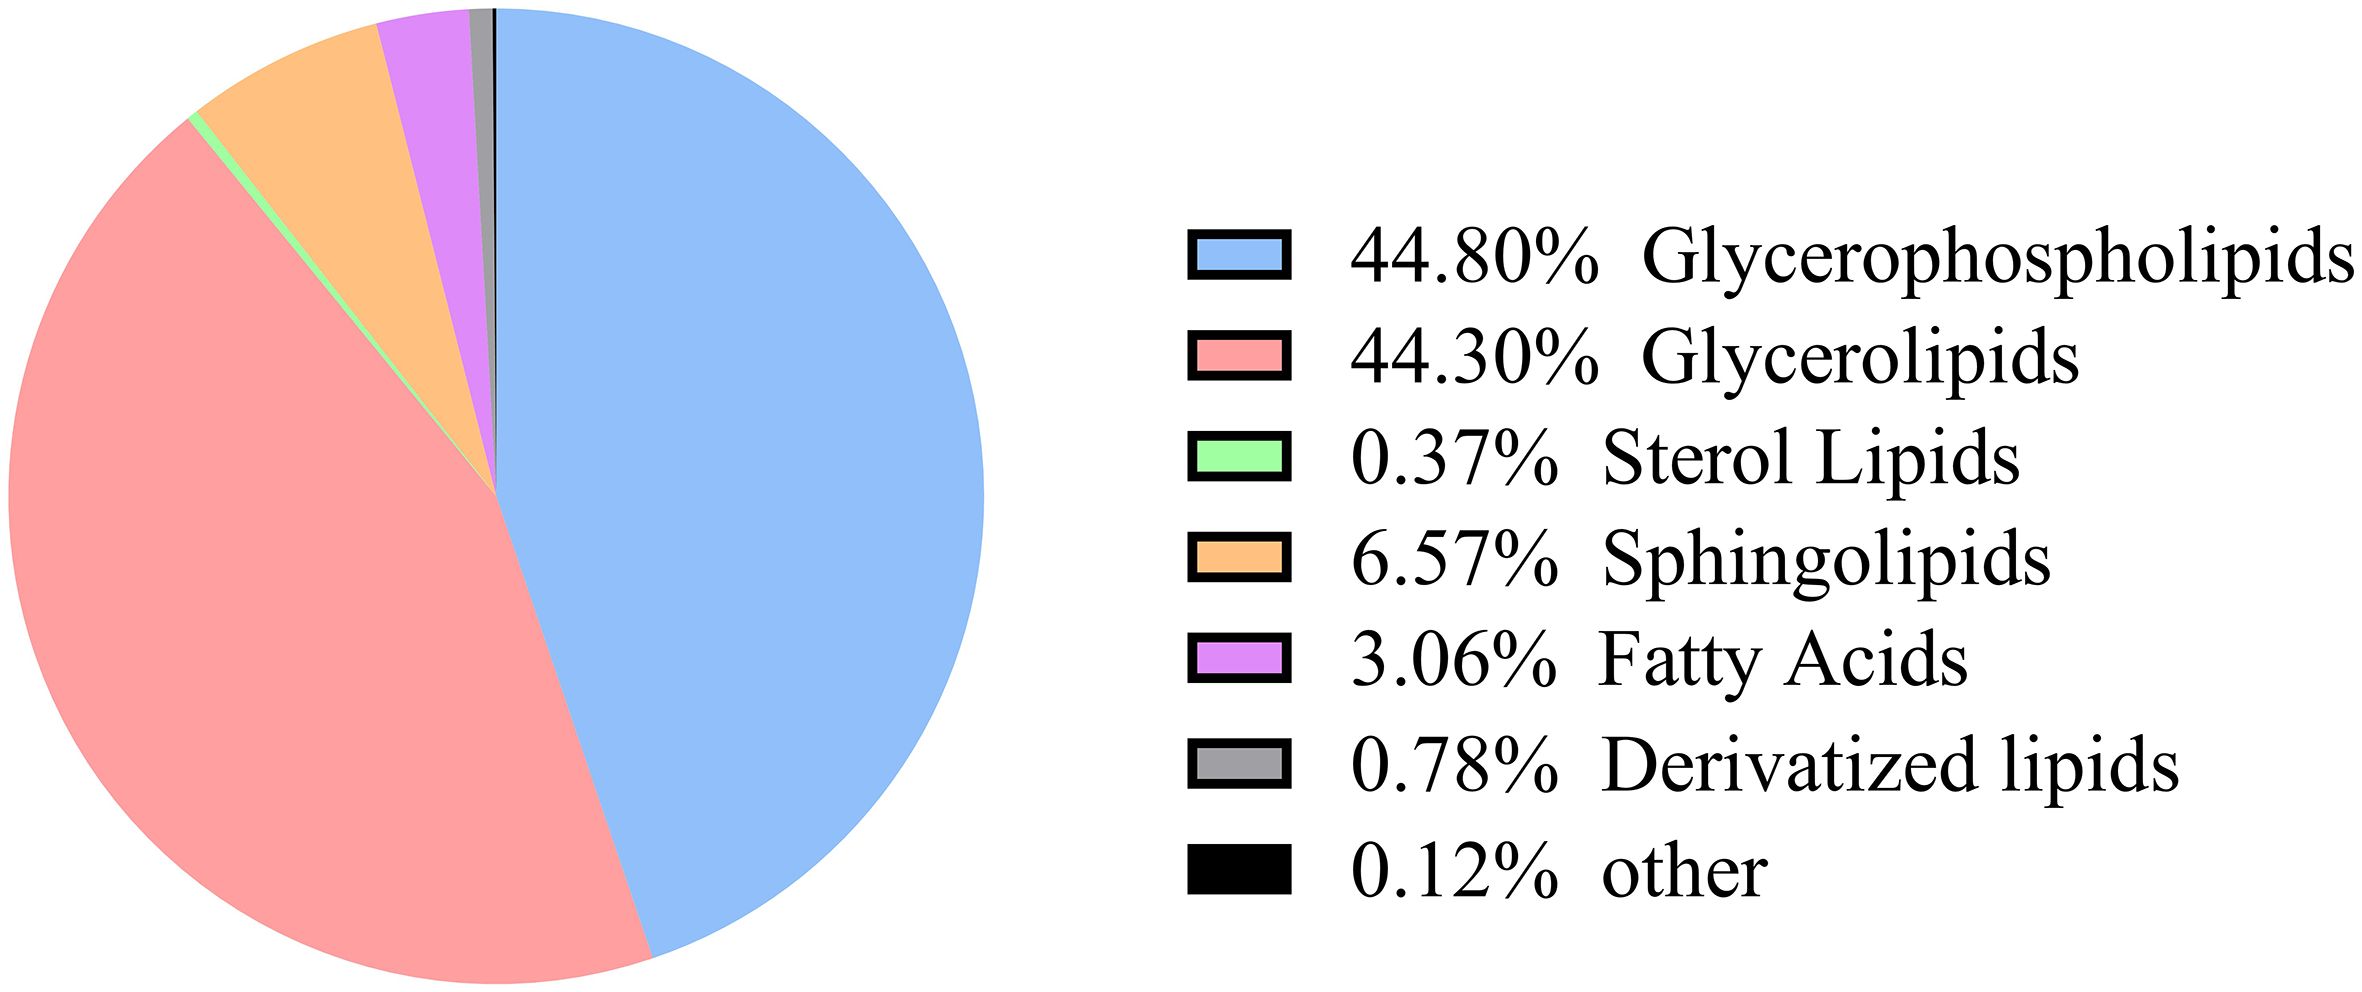
Figure 4. Classification of lipid metabolites.
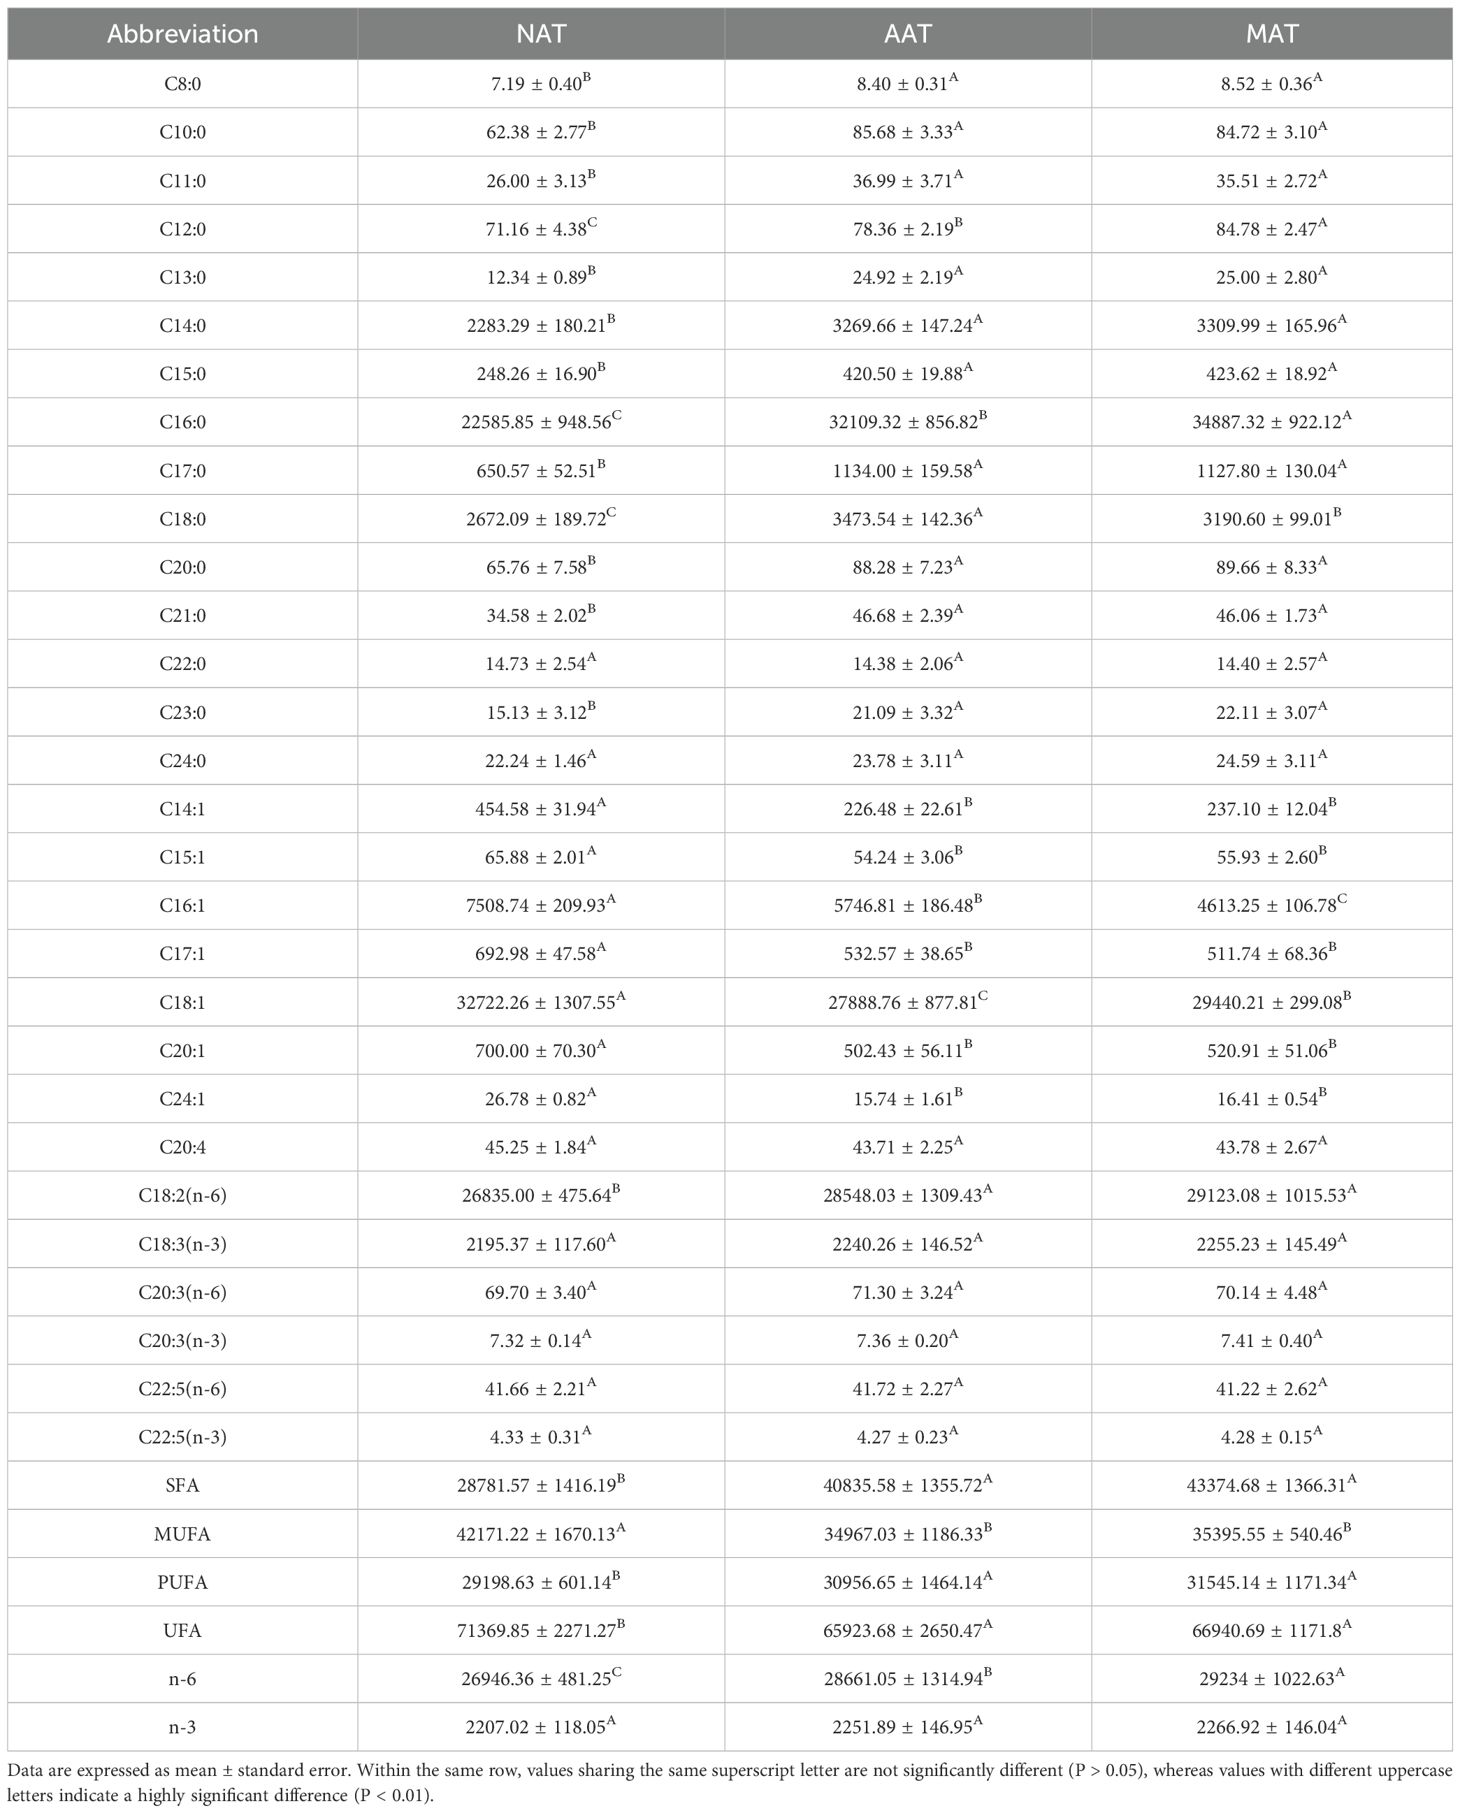
Table 1. Fatty acid composition in different adipose tissue regions (mg/100g).
3.3.3 Analysis of differentially abundant lipid species
DALs were identified using VIP >1, P < 0.05, and FC ≥2 or FC ≤0.5 as selection cri-teria (Figure 5). In the NAT-MAT comparison, 170 DALs were identified, with 154 up-regulated and 16 downregulated species. These included Cer (4), SM (3), LSM (1), TG (106), DG (3), Hex2Cer (1), LPA (2), LPC (3), LPE (6), LPI (1), LPS (3), PC (21), PE (8), PEt (1), PG (1), PI (3), and PS (3), corresponding predominantly to sphingolipids (SP, 4.70%), glycerolipids (GL, 64.71%), and glycerophospholipids (GP, 30.59%). In the AAT-MAT comparison, 44 DALs were identified, comprising 42 upregulated and 2 downregulated metabolites, including AcCa (1), TG (41), Cer (1), and LPS (1), with the distribution dominated by GL (93.19%), and minor contributions from FA (2.27%), SP (2.27%), and GP (2.27%). In the NAT-AAT comparison, 109 DALs were detected, with 19 upregulated and 90 downregulated. These included AcCa (1), Cer (4), Hex2Cer (1), Hex3Cer (1), GM3 (1), SM (11), TG (7), DG (1), LBPA (1), LPA (2), LPC (5), LPE (8), LPI (2), LPS (5), CL (5), PA (1), PC (26), PE (11), PEt (2), PG (3), PI (3), and PS (6). The lipid class distribution consisted of FA (0.92%), GL (7.34%), SP (18.35%), and GP (73.39%). In the DALs of the three adipose tissues, we found that GL had the highest proportion, followed by GP. Among them, TG, PC, and PE were the major lipid subclasses. The differentially expressed lipid molecules are listed in Appendix S1. Furthermore, we measured the content of lipid subclasses with the highest proportions of differential lipids (Table 2). The results showed that the content of TG, PC, and PE in SAT was significantly higher than in AAT and MAT (P < 0.05), while the content of DG and FA was significantly lower in SAT compared to AAT and MAT (P < 0.05).
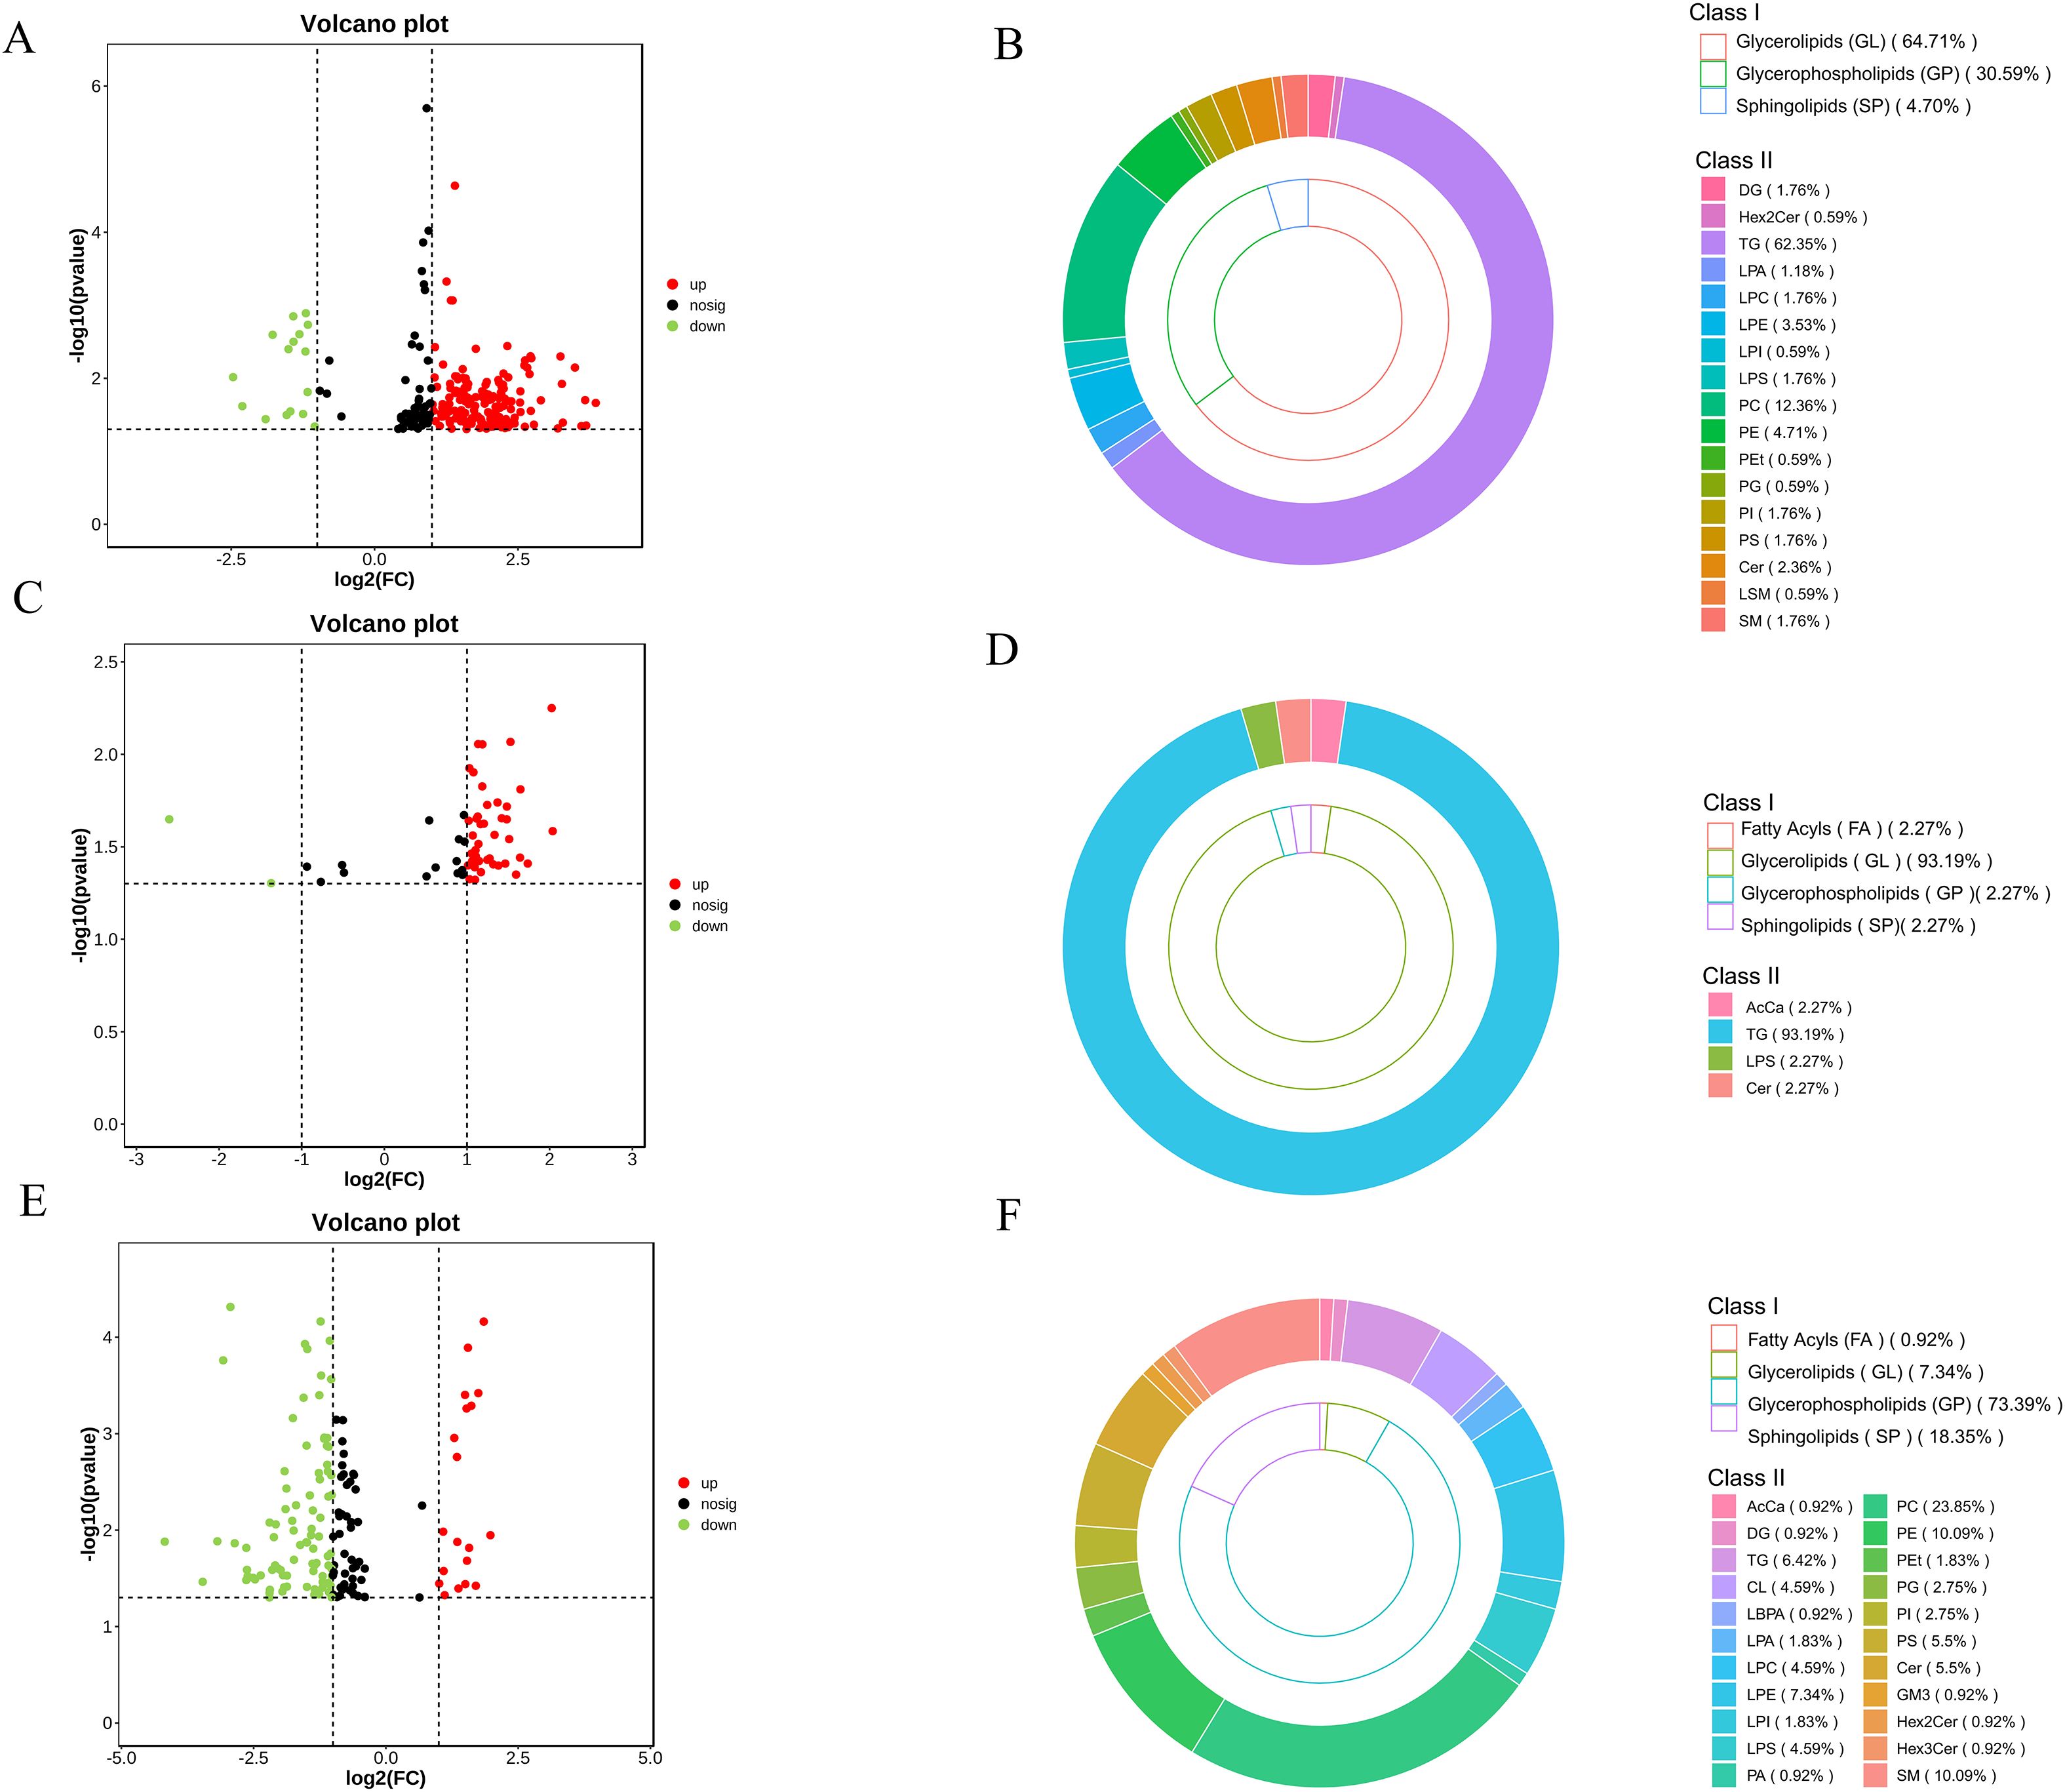
Figure 5. Analysis of DALs. (A) NAT-MAT volcano plot. (B) NAT-MAT classification doughnut chart. (C) AAT-MAT volcano plot. (D) AAT-MAT classification doughnut chart. (E) NAT-AAT volcano plot. (F) NAT-AAT classification doughnut chart.
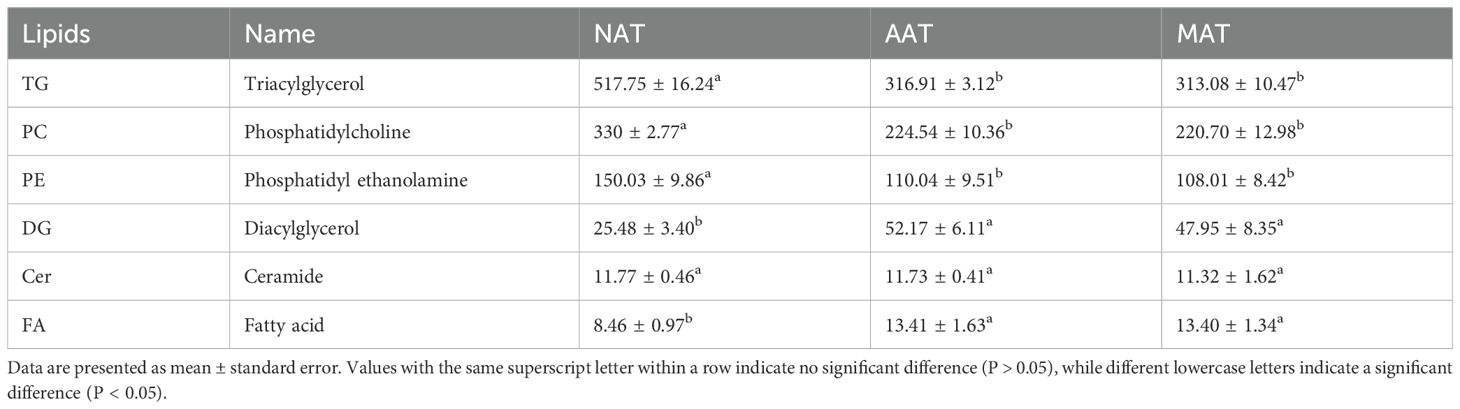
Table 2. Comparison of lipid content in different adipose tissues (ug/g).
3.3.4 Enriched pathway analysis of DALs
KEGG enrichment analysis of the identified DALs (Figure 6) revealed seven significantly enriched metabolic pathways. Among them, one pathway pertained to glycan synthesis and metabolism, specifically Glycosylphosphatidylinositol (GPI)-anchor biosynthesis. Three pathways were associated with lipid metabolic processes, including Glycerophospholipid metabolism, Glycerolipid metabolism, and Ether lipid metabolism. The remaining three pathways involved UFA metabolism, comprising Linoleic acid metabolism, alpha-Linolenic acid metabolism, and Arachidonic acid metabolism.
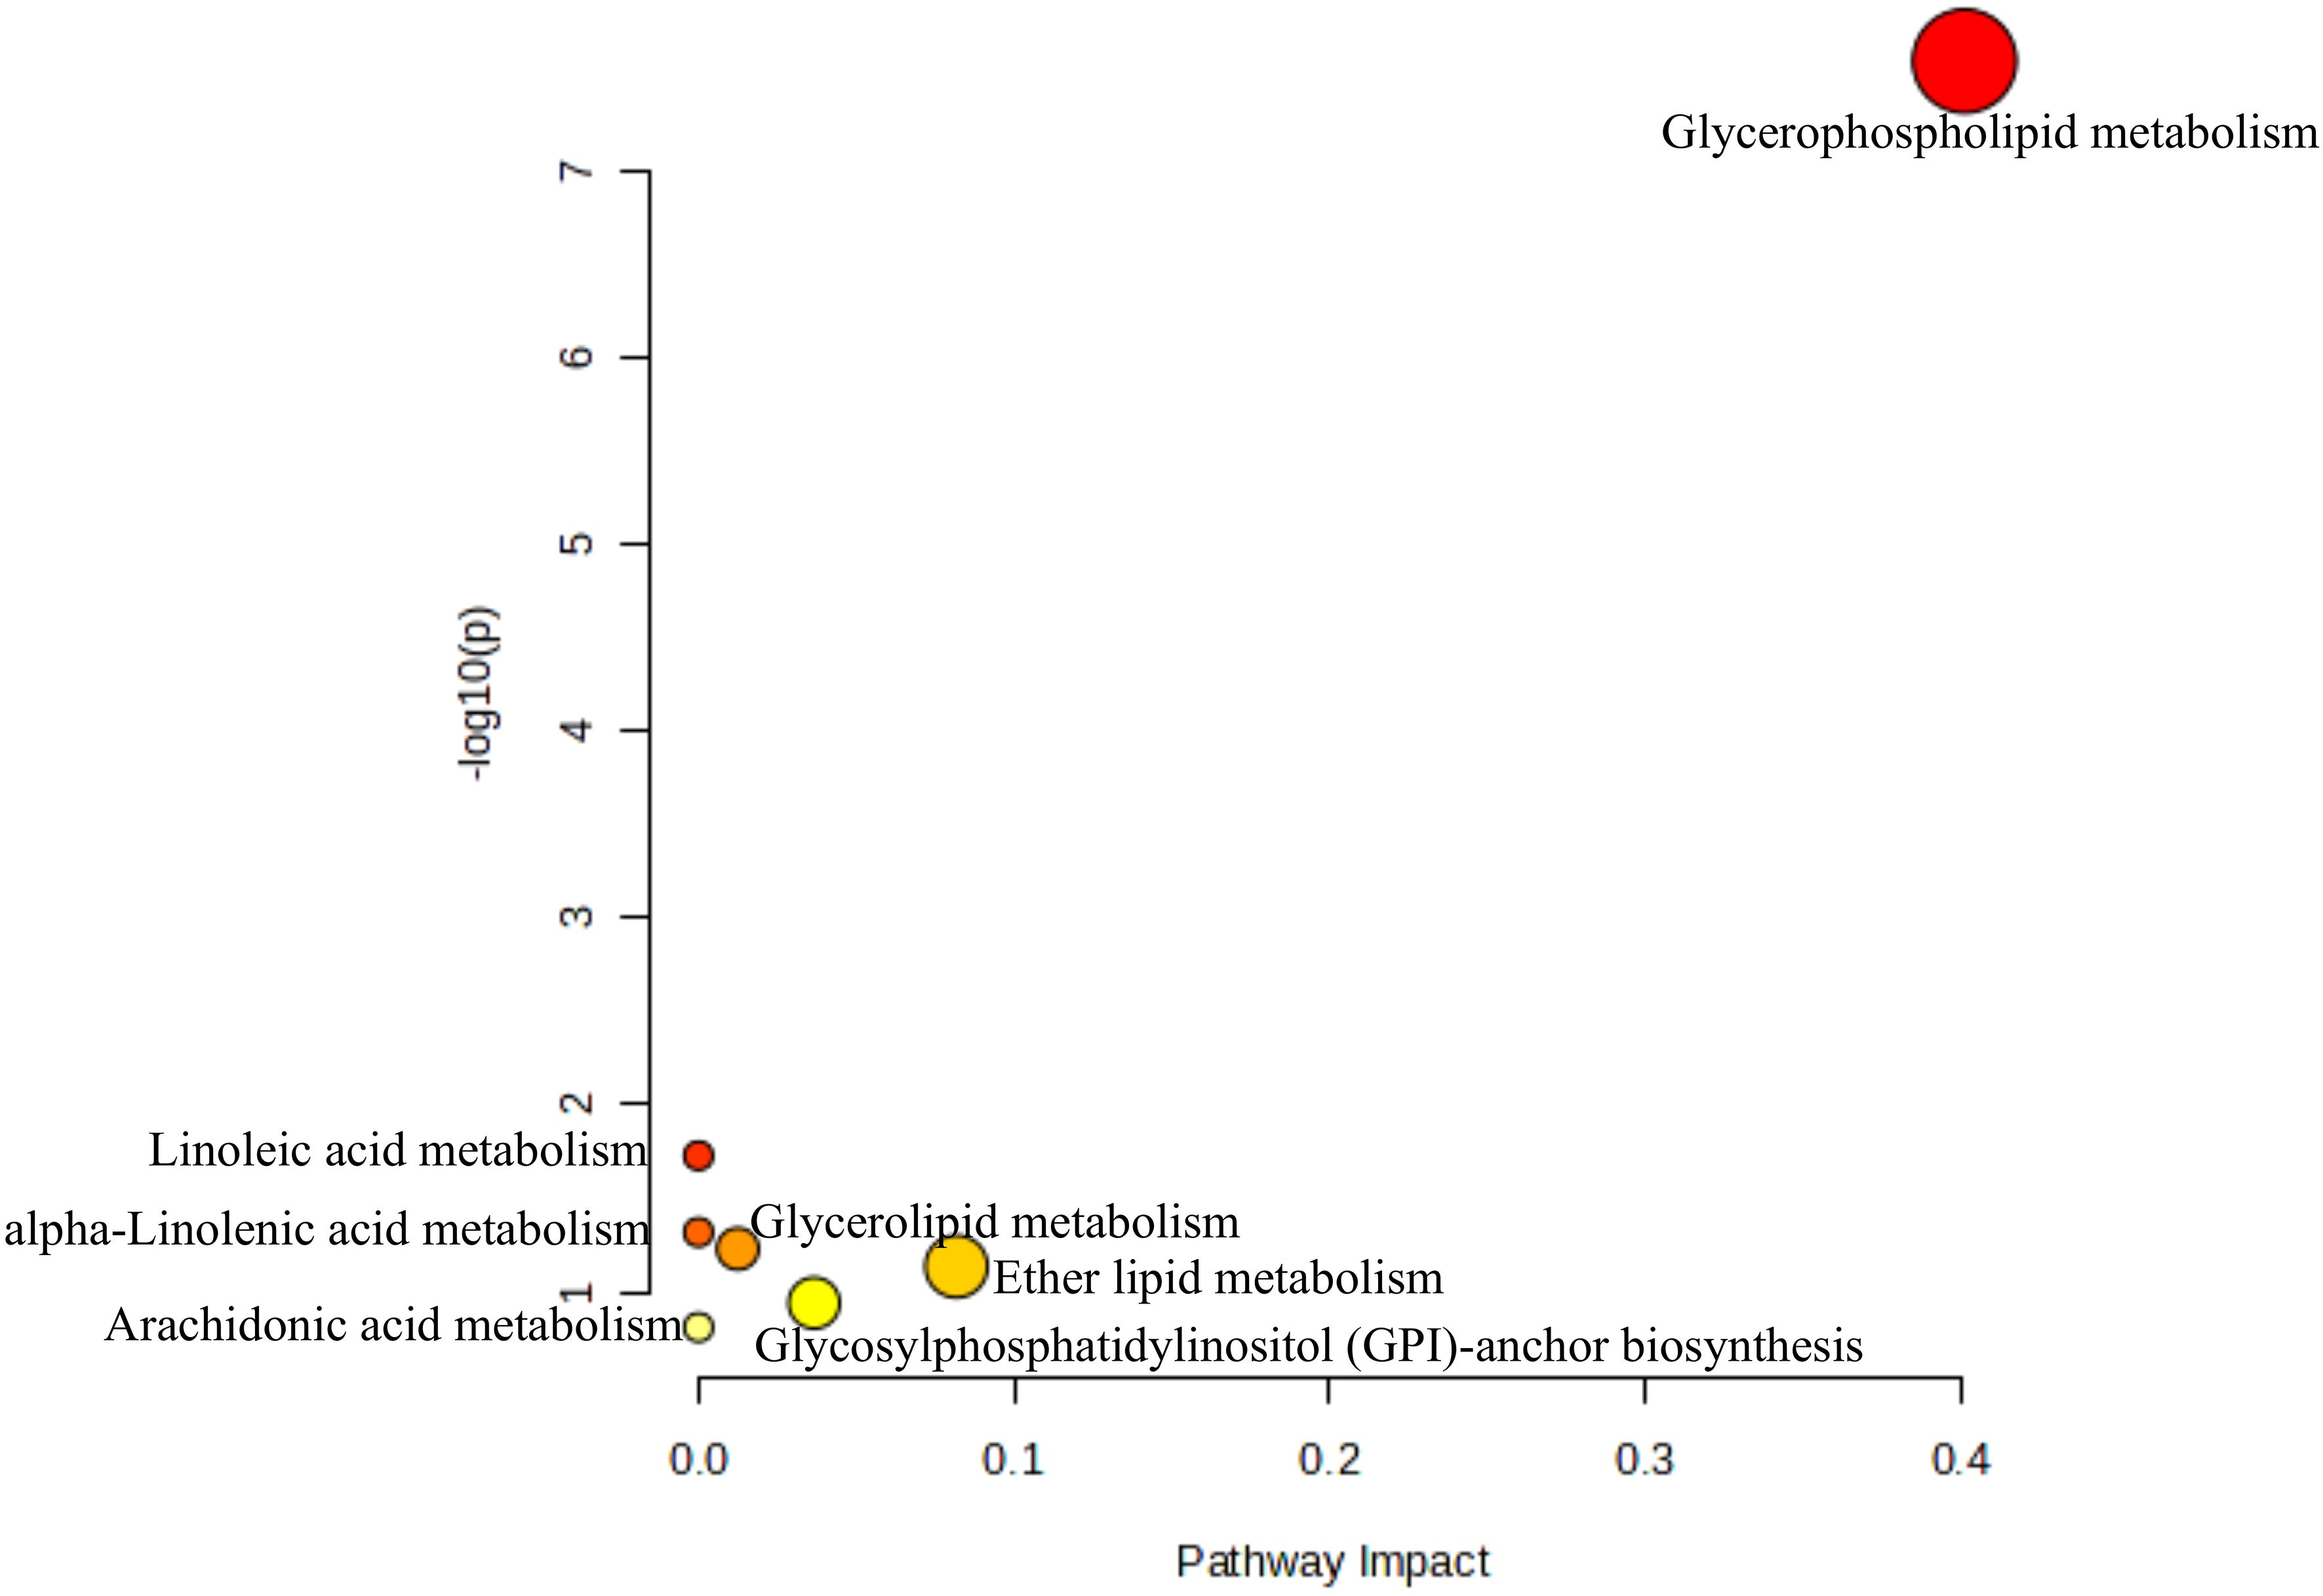
Figure 6. Enrichment pathways of all DALs identified in the three groups.
4 Discussion
Adipose tissue morphology exhibits region-specific variation, with distinct histological features observable across anatomical sites. In the present analysis, NAT displayed the smallest mean cell area and diameter alongside the highest adipocyte density. We hypothesize that this is due to the abundant vascularization in the neck, where the adipose layer serves to prevent the loss of core body temperature through the carotid artery, leading to the formation of fat deposition (Speakman, 2018). Adipose accumulation results from either adipocyte hypertrophy or hyperplasia (Jo et al., 2009), with subcutaneous fat deposition predominantly attributed to hyperplasia (Han et al., 2024), supporting the observed adipocyte abundance and reduced cell size in NAT. In contrast, AAT and MAT revealed larger adipocyte dimensions microscopically, consistent with greater lipid droplet volume and enhanced lipid storage capacity (Olzmann and Carvalho, 2019), potentially linked to the species-specific digestive physiology of horses.
Fatty acids (FA), as integral constituents of adipose tissue, influence its texture, flavor, and nutritional profile (Wood et al., 2004). Specific FA types have been shown to modulate absorption processes, thereby altering adipose tissue function and metabolic activity (Li et al., 2021). In the present analysis, UFA levels surpassed those of SFA across all three adipose tissue types. SFA has been associated with ectopic lipid deposition (Rosqvist et al., 2014), and excessive SFA intake may disrupt gut microbial composition and mucosal gene expression, indirectly contributing to lipid accumulation (De Wit et al., 2012). UFAs have been reported to attenuate endogenous TG synthesis (Qi et al., 2008) and promote lipid digestion and absorption within the gastrointestinal tract, ultimately improving FA digestibility and elevating metabolizable energy availability (Ravindran et al., 2016; Rodriguez-Sanchez et al., 2019). The primary source of FA in adipocytes derives from dietary intake, whereby FA enters cells to form neutral TG for energy storage, leading predominantly to the accumulation of SFA and MUFA (Ahmadian et al., 2007). This pattern aligns with the current findings, which showed SFA and MUFA concentrations exceeding those of PUFA. The predominant SFA species identified in all three adipose tissues were C16:0, C14:0, and C18:0. In mammals, FA biosynthesis primarily utilizes α-phosphoglycerol and acyl-CoA as substrates, and fatty acid synthase catalyzes the formation of SFA, particularly C16:0 and C18:0 (Bas et al., 2005). Consequently, these two SFAs constitute the major saturated lipid components in animal adipose tissue (Iggman and Risérus, 2011). Within the MUFA profile of Kazakh horse adipose tissue, C18:1 was the most abundant. This dominance is likely related to the digestive characteristics of horses as non-ruminants. The hydrogenation of fatty acids by intestinal microbiota is relatively limited in horses, allowing dietary C18:0 to be efficiently converted into C18:1 via the Δ9-desaturase pathway. Moreover, C18:1 is more chemically stable than other fatty acids and less prone to oxidation (Nagao et al., 2019), which further contributes to its predominance in the fatty acid composition. The elevated PUFA content in equine adipose tissue relative to other livestock species (He et al., 2005) is attributed to the distinct anatomical and functional features of the equine gastrointestinal tract. Fermentation primarily occurs in the hindgut, and due to the rapid transit of digestive juice through the stomach and small intestine, ingested feed typically reaches the hindgut within approximately 3 hours (Van Weyenberg et al., 2006) This rapid passage enables dietary PUFA to be absorbed and incorporated into tissues prior to microbial biohydrogenation in the hindgut (Belaunzaran et al., 2015; Clauss et al., 2009). The predominant PUFA species identified in adipose tissue were C18:2(n-6) and C18:3(n-3), and PUFA could influence lipid metabolic pathways by suppressing adipocyte differentiation, promoting fatty acid oxidation, enhancing energy expenditure, and thereby limiting lipid accumulation (Kim and Voy, 2021; Chen et al., 2021). Among adipose tissues from different anatomical regions, MUFA levels were significantly higher in NAT compared to AAT and VAT (P < 0.01), while SFA concentrations were markedly lower in NAT than in AAT and MAT (P < 0.01), aligning with prior observations (Li Hua et al., 2009). These regional differences may reflect the influence of localized tissue temperature variations on the transformation of fatty acids. Higher visceral and abdominal temperatures facilitate the saturation of unsaturated fatty acids, as elevated temperatures enhance the fluidity and reactivity of fatty acid chains, thus promoting the saturation process (Nagao et al., 2019). In contrast, the subcutaneous temperature in the neck region is lower, which causes the surface tissues to stiffen and solidify. However, as the degree of fatty acid desaturation increases, the tissue becomes more fluid, enabling it to better maintain the thermal gradient. As a result, the neck’s subcutaneous fat contains a higher proportion of unsaturated fatty acids.
As a branch of metabolomics, lipidomic uses liquid chromatography-tandem mass spectrometry to accurately quantify lipid molecules, thereby enabling the exploration of the intrinsic relationship between lipid molecules and phenotypes. In this study, a total of 2,418 lipid molecules were identified by testing the lipid extracts of NAT, AAT, and MAT, and TG was determined to be the lipid subclass with the highest content. An intergroup differential comparison of NAT, AAT, and MAT was conducted using the OPLS-DA statistical model. The results revealed significant lipidomic differences between NAT and both AAT and MAT, while the differences between AAT and MAT were relatively small. This smaller discrepancy may be attributed to the close anatomical location of AAT and MAT, as well as their similar physiological characteristics, which lead to comparable lipid metabolic patterns. In contrast, the lipid differences between NAT and both AAT and MAT are likely closely related to their distinct physiological functions and metabolic properties. The lipid molecules in adipose tissue are primarily composed of GL and GP, with TG and DG being the most prevalent within the GL category. In our study, compared to the NAT-AAT group, the DALs in the NAT-MAT and AAT-MAT groups exhibited higher GL abundance, particularly TG and DG. This finding highlights the significant role these lipids play in lipid metabolism. For NAT, lipid molecules are predominantly composed of GL, with TG accounting for the largest proportion, which is significantly higher than that in AAT and MAT (P < 0.05). This is due to the fact that adipose tissue primarily stores energy in the form of TG, and subcutaneous adipose tissue has the greatest capacity for storage, making it the primary site for energy storage (Zhang et al., 2022). TG is a glyceride compound formed via the esterification of glycerol-3-phospholipid and three fatty acids, catalyzed by acyltransferases. Functioning as a principal energy depot, TG undergoes β-oxidation to release energy. Excess caloric intake promotes TG accumulation in adipocytes, leading to fat droplet enlargement to accommodate increased lipid storage (Redinger, 2009; Bonnet, 2019; McFie et al., 2022). TG functions both as an energy reserve and as a supplier of FA and DG for membrane biosynthesis during cell proliferation. This dual role positions TG as a central regulator of lipid equilibrium (Kohlwein, 2010).
Phospholipids, possessing a hydrophilic head and hydrophobic tail, are integral to the structural integrity of the phospholipid bilayer. Their synthesis supports membrane expansion and remodeling, processes essential for cell growth and adaptive responses to environmental stimuli (Ye et al., 2017; Fang et al., 2022). Our results indicate that the DALs in NAT-AAT are predominantly composed of GP, with PC and PE being the major lipid subclasses. PC and PE represent the predominant phospholipids in mammalian cell membranes, with their relative abundance influencing lipid droplet morphology and dynamics. Inhibition of PC biosynthesis under TG-accumulating conditions results in increased lipid droplet size (Guo et al., 2008; Krahmer et al., 2011), while elevated PE content on droplet surfaces facilitates coalescence of smaller droplets into larger structures (Hafez and Cullis, 2001), indicating a mechanistic role for PC and PE in lipid droplet formation. More importantly, the metabolic balance between PC and PE is closely related to the regulatory network of lipid biosynthesis. When this balance is disrupted, it activates the de novo lipogenesis (DNL) pathway (Brown and Goldstein, 1997; Smulan et al., 2016), which is mediated by sterol regulatory element-binding proteins (SREBPs). Notably, we also found that the contents of PC, and PE in NAT were significantly higher than those in AAT and MAT (P < 0.05). Phospholipid metabolism is also associated with thermogenesis in adipose tissue (Su et al., 2022). NAT not only stores energy but plays a critical role in thermoregulation, heat production, and lipid metabolism (Scheidl et al., 2023), which could explain the higher levels of PC, and PE in NAT. In contrast, AAT and MAT exhibited significantly higher DG and FA contents, surpassing NAT (P < 0.05). DG, as a direct precursor of TG synthesis, undergoes esterification with activated fatty acyl-CoA under the catalysis of diacylglycerol acyltransferase to form TG. It is important to note that, unlike TG, DG has the potential to inhibit fat accumulation and reduce serum TG, cholesterol, and glucose levels (Lee et al., 2020). AAT and MAT have higher FFA contents, largely because visceral adipose tissue has a stronger ability to synthesize and release fatty acids and absorb and metabolize glucose. Due to excessive energy intake in modern lifestyles, coupled with insufficient physical activity, the release of fatty acids from visceral adipose tissue often exceeds the needs of surrounding tissues. The excess free fatty acids are released into the bloodstream and, if not promptly utilized, accumulate in the body, contributing to increased fat storage (Zhang et al., 2022b). In summary, these lipid molecules drive differences in fat metabolism and have an impact on fat deposition and the heterogeneity of adipose tissue.
Interestingly, pathway enrichment analysis of all DALs identified across the three groups revealed that three pathways were enriched in lipid metabolism, and three others were enriched in pathways related to unsaturated fatty acid metabolism. This suggests a close link between lipid synthesis and fatty acid metabolism. The synthesis of fatty acids is fundamental to lipid metabolism, and variations in the types and metabolic pathways of fatty acids directly affect fat storage and conversion processes. Therefore, the differences in lipid composition across different adipose tissues not only reflect varying requirements for fat storage and energy metabolism but also reveal the adaptive and functional differences of adipose tissues under different physiological conditions.
5 Conclusions
In summary, TG and PC are the primary lipid subclasses in different adipose tissues. The levels of TG, PC, and PE in NAT are higher than those in AAT and MAT, whereas the levels of DG and FA are lower in NAT compared to AAT and MAT. The expression patterns of fatty acids in AAT and MAT are more consistent than in NAT. DALs are primarily enriched in glycerophospholipids, glycerides, and the metabolism of unsaturated fatty acids. This study provides a theoretical basis for the genetic selection and regulation of fat deposition in specific regions of the Kazakh horse and offers new theoretical insights for the integrated utilization of equine fat products, as well as for advancing the development of the equine industry.
Data availability statement
The original contributions presented in the study are included in the article/Supplementary Material. Further inquiries can be directed to the corresponding author.
Ethics statement
The animal study was approved by the Xinjiang Agricultural University Ethics Committee. The study was conducted in accordance with the local legislation and institutional requirements.
Author contributions
RW: Methodology, Data curation, Project administration, Writing – original draft. WR: Writing – original draft, Methodology, Conceptualization. LL: Writing – original draft, Investigation, Software. ZL: Data curation, Conceptualization, Writing – original draft. SM: Writing – original draft, Validation, Resources. DS: Investigation, Formal Analysis, Writing – original draft. QH: Supervision, Writing – review & editing, Validation. YS: Writing – review & editing, Resources, Visualization. JW: Writing – review & editing, Resources, Funding acquisition.
Funding
The author(s) declare financial support was received for the research and/or publication of this article. This research was funded by Key R&D projects of Xinjiang Uygur Autonomous Region (2024B02013-3-2), Xinjiang Key Laboratory of Equine Breeding and Exercise Physiology (XJMFY202406), Central Guidance for Local Science and Technology Development Fund (ZYYD2025JD02), and Basic Research Funding Projects for Scientific Research in Xinjiang Universities (XJEDU2025J057).
Acknowledgments
The authors express their gratitude to the Xinjiang Key Laboratory of Equine Breeding and Exercise Physiology for their generous support.
Conflict of interest
The authors declare that the research was conducted in the absence of any commercial or financial relationships that could be construed as a potential conflict of interest.
Generative AI statement
The author(s) declare that no Generative AI was used in the creation of this manuscript.
Any alternative text (alt text) provided alongside figures in this article has been generated by Frontiers with the support of artificial intelligence and reasonable efforts have been made to ensure accuracy, including review by the authors wherever possible. If you identify any issues, please contact us.
Publisher’s note
All claims expressed in this article are solely those of the authors and do not necessarily represent those of their affiliated organizations, or those of the publisher, the editors and the reviewers. Any product that may be evaluated in this article, or claim that may be made by its manufacturer, is not guaranteed or endorsed by the publisher.
Supplementary material
The Supplementary Material for this article can be found online at: https://www.frontiersin.org/articles/10.3389/fanim.2025.1662895/full#supplementary-material
References
Ahmadian M., Duncan R. E., Jaworski K., Sarkadi-Nagy E., and Sook Sul H. (2007). Triacylglycerol metabolism in adipose tissue. Future Lipidol. 2, 229–237. doi: 10.2217/17460875.2.2.229
Audano M., Pedretti S., Caruso D., Crestani M., De Fabiani E., and Mitro N. (2022). Regulatory mechanisms of the early phase of white adipocyte differentiation: An overview. Cell. Mol. Life Sci. 79, 139. doi: 10.1007/s00018-022-04176-7
Bas P., Dahbi E., El Aich A., Morand-Fehr P., and Araba A. (2005). Effect of feeding on fatty acid composition of muscles and adipose tissues in young goats raised in the Argan tree forest of Morocco. Meat. Sci. 71, 317–326. doi: 10.1016/j.meatsci.2005.04.018
Belaunzaran X., Bessa R. J., Lavín P., Mantecón A. R., Kramer J. K., and Aldai N. (2015). Horse-meat for human consumption—Current research and future opportunities. Meat. Sci. 108, 74–81. doi: 10.1016/j.meatsci.2015.05.006
Belaunzaran X., Lavín P., Barron L. J., Mantecón A. R., Kramer J. K., and Aldai N. (2017). An assessment of the fatty acid composition of horse-meat available at the retail level in northern Spain. Meat. Sci. 124, 39–47. doi: 10.1016/j.meatsci.2016.10.014
Brown M. S. and Goldstein J. L. (1997). The SREBP pathway: regulation of cholesterol metabolism by proteolysis of a membrane-bound transcription factor. Cell 89, 331–340. doi: 10.1016/S0092-8674(00)80213-5
Chen J., Cui H., Liu X., Li J., Zheng J., Li X., et al. (2021). Effects of dietary n-6: n-3 polyunsaturated fatty acid ratio on growth performance, blood indexes, tissue fatty acid composition and the expression of peroxisome proliferator-activated receptor gamma signaling related genes in finishing pigs. Anim. Biosci. 35, 730. doi: 10.5713/ab.21.0288
Christie W. W. (1982). A simple procedure for rapid transmethylation of glycerolipids and cholesteryl esters. J. Lipid Res. 23, 1072–1075. doi: 10.1016/S0022-2275(20)38081-0
Clauss M., Grum C., and Hatt J. M. (2009). Polyunsaturated fatty acid content in adipose tissue in foregut and hindgut fermenting mammalian herbivores: a literature survey. Mamm. Biol. 74, 153–158. doi: 10.1016/j.mambio.2008.04.004
De Wit N., Derrien M., Bosch-Vermeulen H., Oosterink E., Keshtkar S., Duval C., et al. (2012). Saturated fat stimulates obesity and hepatic steatosis and affects gut microbiota composition by an enhanced overflow of dietary fat to the distal intestine. Am. J. Physiology-Gastrointest. Liver. Physiol. 303, G589–G599. doi: 10.1152/ajpgi.00488.2011
Du L., Chang T., An B., Liang M., Deng T., Li K., et al. (2022). Transcriptomics and lipid metabolomics analysis of subcutaneous, visceral, and abdominal adipose tissues of beef cattle. Genes 14, 37. doi: 10.3390/genes14010037
Fang W., Zhu Y., Yang S., Tong X., and Ye C. (2022). Reciprocal regulation of phosphatidylcholine synthesis and H3K36 methylation programs metabolic adaptation. Cell Rep. 39, 110672. doi: 10.1016/j.celrep.2022.110672
Folch J., Lees M., and Stanley G. S. (1957). A simple method for the isolation and purification of total lipides from animal tissues. J. Biol. Chem. 226, 497–509. doi: 10.1016/S0021-9258(18)64849-5
Guo Y., Walther T. C., Rao M., Stuurman N., Goshima G., Terayama K., et al. (2008). Functional genomic screen reveals genes involved in lipid-droplet formation and utilization. Nature 453, 657–661. doi: 10.1038/nature06928
Hafez I. M. and Cullis P. R. (2001). Roles of lipid polymorphism in intracellular delivery. Adv. Drug Deliv. Rev. 47, 139–148. doi: 10.1016/S0169-409X(01)00103-X
Han Y., He X., Yun Y., Chen L., Huang Y., Wu Q., et al. (2024). The characterization of subcutaneous adipose tissue in Sunit sheep at different growth stages: A comprehensive analysis of the morphology, fatty acid profile, and metabolite profile. Foods 13, 544. doi: 10.3390/foods13040544
He M. L., Ishikawa S., and Hidari H. (2005). Fatty acid profiles of various muscles and adipose tissues from fattening horses in comparison with beef cattle and pigs. Asian-Australasian. J. Anim. Sci. 18, 1655–1661. doi: 10.5713/ajas.2005.1655
Ibrahim M. M. (2010). Subcutaneous and visceral adipose tissue: structural and functional differences. Obes. Rev. 11, 11–18. doi: 10.1111/j.1467-789X.2009.00623.x
Iggman D. and Risérus U. (2011). Role of different dietary saturated fatty acids for cardiometabolic risk. Clin. Lipidol. 6, 209–223. doi: 10.2217/clp.11.7
Jiang M., Fan W. L., Xing S. Y., Wang J., Li P., Liu R. R., et al. (2017). Effects of balanced selection for intramuscular fat and abdominal fat percentage and estimates of genetic parameters. Poultry. Sci. 96, 282–287. doi: 10.3382/ps/pew334
Jo J., Gavrilova O., Pack S., Jou W., Mullen S., Sumner A. E., et al. (2009). Hypertrophy and/or hyperplasia: dynamics of adipose tissue growth. PloS Comput. Biol. 5, e1000324. doi: 10.1371/journal.pcbi.1000324
Kim M. and Voy B. H. (2021). Fighting fat with fat: n-3 polyunsaturated fatty acids and adipose deposition in broiler chickens. Front. Physiol. 12. doi: 10.3389/fphys.2021.755317
Kohlwein S. D. (2010). Triacylglycerol homeostasis: insights from yeast. J. Biol. Chem. 285, 15663–15667. doi: 10.1074/jbc.R110.118356
Krahmer N., Guo Y., Wilfling F., Hilger M., Lingrell S., Heger K., et al. (2011). Phosphatidylcholine synthesis for lipid droplet expansion is mediated by localized activation of CTP: phosphocholine cytidylyltransferase. Cell Metab. 14, 504–515. doi: 10.1016/j.cmet.2011.07.013
Lee Y. Y., Tang T. K., Phuah E. T., Tan C. P., Wang Y., Li Y., et al. (2020). Production, safety, health effects and applications of diacylglycerol functional oil in food systems: A review. Crit. Rev. Food Sci. Nutr. 60, 2509–2525. doi: 10.1080/10408398.2019.1650001
Lee M. J., Wu Y., and Fried S. K. (2013). Adipose tissue heterogeneity: implication of depot differences in adipose tissue for obesity complications. Mol. Aspects. Med. 34, 1–11. doi: 10.1016/j.mam.2012.10.001
Li R., Tan C. P., Xu Y. J., and Liu Y. (2021). Alteration of endogenous fatty acids profile and lipid metabolism in rats caused by a high-colleseed oil and a high-sunflower oil diet. Eur. J. Lipid Sci. Technol. 123, 2100100. doi: 10.1002/ejlt.202100100
Li. H., Rong. Q., Zhang. X., and Wu G. (2009). Study on the composition of fatty acid in four part fat of horse. 1341–1344. doi: 10.5555/20113401852
Liu Y., Ren X., Fan C., Wu W., Zhang W., and Wang Y. (2022). Health benefits, food applications, and sustainability of microalgae-derived N-3 PUFA. Foods 11, 1883. doi: 10.3390/foods11131883
Lu B., Hanyaloglu A. C., Ma Y., Frampton A. E., Limb C., Merali N., et al. (2025). Propionate induces energy expenditure via browning in mesenteric adipose tissue. J. Clin. Endocrinol. Metab. dgaf280. doi: 10.1210/clinem/dgaf280
Luo G., Hong T., Yu L., and Ren Z. (2023). FTO regulated intramuscular fat by targeting APMAP gene via an m6A-YTHDF2-dependent manner in Rex rabbits. Cells 12, 369. doi: 10.3390/cells12030369
Matyash V., Liebisch G., Kurzchalia T. V., Shevchenko A., and Schwudke D. (2008). Lipid extraction by methyl-tert-butyl ether for high-throughput lipidomics. J. Lipid Res. 49, 1137–1146. doi: 10.1194/jlr.D700041-JLR200
McFie P. J., Patel A., and Stone S. J. (2022). The monoacylglycerol acyltransferase pathway contributes to triacylglycerol synthesis in HepG2 cells. Sci. Rep. 12, 4943. doi: 10.1038/s41598-022-08946-y
Mottillo E. P. and Steinberg G. R. (2020). Current and emerging roles of adipose tissue in health and disease. Biochem. J. 477, 3645–3647. doi: 10.1042/BCJ20200696
Nagao K., Murakami A., and Umeda M. (2019). Structure and function of Δ9-fatty acid desaturase. Chem. Pharm. Bull. 67, 327–332. doi: 10.1248/cpb.c18-01001
Nawrocki A. R. and Scherer P. E. (2004). The delicate balance between fat and muscle: adipokines in metabolic disease and musculoskeletal inflammation. Curr. Opin. Pharmacol. 4, 281–289. doi: 10.1016/j.coph.2004.02.006
Olzmann J. A. and Carvalho P. (2019). Dynamics and functions of lipid droplets. Nat. Rev. Mol. Cell Biol. 20, 137–155. doi: 10.1038/s41580-018-0085-z
Petrov K. A., Makhutova O. N., and Gladyshev M. I. (2020). “Fatty acid composition of yakut horse tissues,” In Doklady Biochemistry and Biophysics, (Moscow: Pleiades Publishing), (2020) 492, 105–107. doi: 10.1134/S1607672920030047
Qi K., Fan C., Jiang J., Zhu H., Jiao H., Meng Q., et al. (2008). Omega-3 fatty acid containing diets decrease plasma triglyceride concentrations in mice by reducing endogenous triglyceride synthesis and enhancing the blood clearance of triglyceride-rich particles. Clin. Nutr. 27, 424–430. doi: 10.1016/j.clnu.2008.02.001
Qiang G., Kong H. W., Fang D., McCann M., Yang X., Du G., et al. (2016). The obesity-induced transcriptional regulator TRIP-Br2 mediates visceral fat endoplasmic reticulum stress-induced inflammation. Nat. Commun. 7, 11378. doi: 10.1038/ncomms11378
Ravindran V., Tancharoenrat P., Zaefarian F., and Ravindran G. (2016). Fats in poultry nutrition: Digestive physiology and factors influencing their utilisation. Anim. Feed. Sci. Technol. 213, 1–21. doi: 10.1016/j.anifeedsci.2016.01.012
Redinger R. N. (2009). Fat storage and the biology of energy expenditure. Trans. Res. 154, 52–60. doi: 10.1016/j.trsl.2009.05.003
Rodriguez-Sanchez R., Tres A., Sala R., Guardiola F., Barroeta A. C., et al. (2019). Evolution of lipid classes and fatty acid digestibility along the gastrointestinal tract of broiler chickens fed different fat sources at different ages. Poultry. Sci. 98, 1341–1353. doi: 10.3382/ps/pey458
Rosqvist F., Iggman D., Kullberg J., Cedernaes J., Johansson H. E., Larsson A., et al. (2014). Overfeeding polyunsaturated and saturated fat causes distinct effects on liver and visceral fat accumulation in humans. Diabetes 63, 2356–2368. doi: 10.2337/db13-1622
Scheidl T. B., Brightwell A. L., Easson S. H., and Thompson J. A. (2023). Maternal obesity and programming of metabolic syndrome in the offspring: Searching for mechanisms in the adipocyte progenitor pool. BMC Med. 21, 50. doi: 10.1186/s12916-023-02730-z
Scherer P. E. (2006). Adipose tissue: from lipid storage compartment to endocrine organ. Diabetes 55, 1537–1545. doi: 10.2337/db06-0263
Smulan L. J., Ding W., Freinkman E., Gujja S., Edwards Y. J., Walker A. K., et al. (2016). Cholesterol-independent SREBP-1 maturation is linked to ARF1 inactivation. Cell Rep. 16, 9–18. doi: 10.1016/j.celrep.2016.05.086
Speakman J. R. (2018). Obesity and thermoregulation. Handb. Clin. Neurol. 156, 431–443. doi: 10.1016/B978-0-444-63912-7.00026-6
Su H., Guo H., Qiu X., Lin T.-Y., and Chen X. (2022). 309-OR: Lipocalin 2 deficiency impairs mitochondrial dynamics and phospholipid metabolism in brown adipocytes. Diabetes 71 (Supplement_1), 309–OR. doi: 10.2337/db22-309-OR
Van Weyenberg S., Sales J., and Janssens G. P. J. (2006). Passage rate of digesta through the equine gastrointestinal tract: A review. Livestock. Sci. 99, 3–12. doi: 10.1016/j.livprodsci.2005.04.008
Vishvanath L. and Gupta R. K. (2019). Contribution of adipogenesis to healthy adipose tissue expansion in obesity. J. Clin. Invest. 129, 4022–4031. doi: 10.1172/JCI129191
Wajchenberg B. L. (2000). Subcutaneous and visceral adipose tissue: their relation to the metabolic syndrome. Endocrine. Rev. 21, 697–738. doi: 10.1210/edrv.21.6.0415
Wood J. D., Richardson R. I., Nute G. R., Fisher A. V., Campo M. M., Kasapidou E., et al. (2004). Effects of fatty acids on meat quality: a review. Meat. Sci. 66, 21–32. doi: 10.1016/S0309-1740(03)00022-6
Wubulikasimu M., Liu J., Yao X., Meng J., Wang J., Zeng Y., et al. (2025). Transcriptomic sequencing and differential analysis of Kazakh horse muscles from various anatomical locations. Front. Vet. Sci. 12, 16337865. doi: 10.3389/fvets.2025.1633786
Ye C., Sutter B. M., Wang Y., Kuang Z., and Tu B. P. (2017). A metabolic function for phospholipid and histone methylation. Mol. Cell 66, 180–193. doi: 10.1016/j.molcel.2017.02.026
Keywords: Kazakh horse, adipose cell, fatty acid, adipose tissue, lipidomics
Citation: Wang R, Ren W, Li L, Li Z, Ma S, Shan D, Huang Q, Su Y and Wang J (2025) The characterization of adipose tissue in distinct anatomical regions of the Kazakh horse: a comprehensive analysis of the morphology, fatty acid profile, and lipidomic profile. Front. Anim. Sci. 6:1662895. doi: 10.3389/fanim.2025.1662895
Received: 09 July 2025; Accepted: 06 October 2025;
Published: 20 October 2025.
Edited by:
Markku Saastamoinen, Natural Resources Institute Finland (Luke), FinlandReviewed by:
Agnieszka Żak-Bochenek, Wroclaw University of Environmental and Life Sciences, PolandYunfei Han, Inner Mongolia Academy of Agricultural and Animal Husbandry Sciences, China
Copyright © 2025 Wang, Ren, Li, Li, Ma, Shan, Huang, Su and Wang. This is an open-access article distributed under the terms of the Creative Commons Attribution License (CC BY). The use, distribution or reproduction in other forums is permitted, provided the original author(s) and the copyright owner(s) are credited and that the original publication in this journal is cited, in accordance with accepted academic practice. No use, distribution or reproduction is permitted which does not comply with these terms.
*Correspondence: Jianwen Wang, d2p3MTI2MjAyMkAxMjYuY29t