 Lucía Gil-Zibil
 Gastón Ortega
 Diego Custodio1
 Pablo Chilibroste
- 1Departamento de Producción Animal y Pasturas, Facultad de Agronomía Universidad de la República, Canelones, Uruguay
- 2Departamento de Producción Animal y Pasturas, Facultad de Agronomía Universidad de la República, Montevideo, Uruguay
- 3Departamento de Producción Animal y Pasturas, Facultad de Agronomía Universidad de la República, Paysandú, Uruguay
The increased intensification of pasture-based dairy systems has led to greater use of external inputs, increasing the risk of nutrient losses to the environment. Limited information is available in Uruguay on how intensification strategies affect productivity and nutrient balances at the farm scale. This study compared productive variables and farm-gate nutrient balances of nitrogen (N), phosphorus (P), and potassium (K) \under two pasture-based dairy intensification strategies over three fiscal years (July 2021–June 2024). Two intensification strategies were evaluated in a 3-year completely randomized block design: (1) High Productivity (HP), with a stocking rate of 2.8 cows/ha, using bought-in conserved forage and concentrates; and (2) Medium Productivity (MP), with 1.7 cows/ha, self-sufficient in conserved forage and concentrates and featuring simplified management. Cows were paired by calving date, body condition score, body weight, and previous milk yield, then randomly assigned to each system. Farm-gate nutrient balances accounted for inputs from feed, fertilizers, biological N fixation, and atmospheric deposition, and outputs from milk, live weight changes, and bedding materials. Data were analyzed using linear mixed models, with treatment and year as fixed effects and blocks as random effects. No significant differences were observed in forage production between systems; however, HP relied more on harvesting by grazing (7,073 vs. 4,782 kg DM/ha for HP and MP, respectively; p<0.05), whereas MP had higher mechanical harvest (473 vs. 1,862 kg DM/ha for HP and MP, respectively; p<0.05). Milk (22,178 vs. 13,606 kg milk ha-1), and solids (1,907 vs. 1,184 kg solids ha-1) productivity were significantly higher for HP than for MP. Regarding nutrient inputs, feed was the main source of N for HP, whereas fertilizer was predominant for MP. For P and K, feed was the largest input in both systems. Nutrient surpluses for N, P, and K were 312 vs. 205, 82 vs. 50, and 128 vs. 44 kg/ha for HP and MP, respectively. Nutrient use efficiency did not differ significantly between treatments. Time in confinement was higher for HP (55% vs. 37%). Higher intensification increased productivity but also nutrient surpluses, highlighting the importance of infrastructure and effluent management. Additionally, effluent reutilisation emerged as an opportunity to improve nutrient use efficiency in intensified systems.
1 Introduction
Global dairy demand is projected to increase in the next decade alongside population growth (OECD–FAO, 2024). Additionally, land competition and fluctuating milk and concentrate markets have driven dairy systems toward intensification to remain competitive (Fariña and Chilibroste, 2019; Delaby et al., 2020). In this context, Uruguayan dairy systems have undergone an intensification process, achieving an annual production growth rate of 3.7% despite a reduction of approximately 50% in dairy land area (DIEA, 2023). Key productivity variables such as stocking rate and individual milk yield have increased, with commercial systems averaging 8,831 L/ha of milk and 624 kg/ha of milk solids. These results were achieved using 5.3 t/ha of home-grown forage and 1.8 t/ha of concentrate feed (Fariña and Chilibroste, 2019).
To support the intensification process, several national farmlet studies have been conducted to explore strategies combining stocking rate, feeding approaches, and confinement systems (Stirling et al., 2021; Méndez et al., 2023; Ortega et al., 2024; Menegazzi et al., 2025). These trials reported milk solids yields between 980 and 1,825 kg/ha and home-grown forage production ranging from 6,430 to 9,472 kg DM/ha, demonstrating that dairy intensification can be achieved through increased forage production combined with strategic supplementation. However, forage growth seasonality, climatic events (e.g., droughts, heavy rainfall, heat stress), and higher stocking rates demand the implementation of pasture recovery periods, restrict grazing, and require areas for feed supplementation, often through confinement infrastructure (Chilibroste et al., 2024). As a result, animals may spend 40%–60% of their time in confinement, highlighting the importance of adequate infrastructure (Stirling et al., 2021; Ortega et al., 2024), which remains a limiting factor for many Uruguayan dairy farms (Aguerre et al., 2018). Moreover, intensification also increases the demand for labor, infrastructure, and time-saving technologies, affecting farmers’ quality of life (Tse et al., 2017; INALE, 2019).
Strategies aimed at increasing stocking rate directly affect forage harvested without compromising home-grown forage production (Baudracco et al., 2011). Consequently, these systems decrease surplus forage available for mechanical harvest, relying more on bought-in feed (Fariña and Chilibroste, 2019; Ortega et al., 2024). Several studies have also shown that as intensification progresses, both operating profit and nutrient surpluses tend to rise (Gourley, 2012; Ros et al., 2023; Wivstad et al., 2023; Stirling et al., 2024a). However, this also implies greater use of inputs and potential negative environmental impacts (Oenema and Oenema, 2021). Farm-gate nutrient balances are useful tools to assess system performance, benchmark production efficiency, and identify potential environmental risks. In Uruguay, confinement areas have been identified as critical hotspots for N losses through leaching and ammonia volatilization (Stirling et al., 2024b), contrasting with countries such as New Zealand and Ireland, where the main losses occur through pasture leaching (Treacy et al., 2008; De Klein et al., 2010). Therefore, understanding the spatial distribution of nutrients within systems is key to evaluating environmental risks in relation to intensification levels and management strategies.
While previous national studies have mainly focused on productivity outcomes of dairy intensification, there is still limited understanding of its environmental implications, especially concerning nutrient flows and farm-gate nutrient balances. Building on this knowledge gap, this study was designed to assess both productive performance and farm-gate nutrient balances under contrasting intensification strategies.
The hypothesis of this study is that intensification strategies do not affect forage production when proper monitoring and planning are implemented. However, more intensified systems will achieve greater harvest by grazing, whereas less intensified systems will have higher mechanical harvest. More intensified systems are expected to exhibit greater nutrient inputs and surpluses per hectare, with distinct spatial nutrient distribution due to reduced grazing opportunities and increased confinement. Therefore, the aim of this study was to assess productive performance and farm-gate N, P, and K balances of two intensified pasture-based dairy systems in Uruguay to better understand the effect of different intensification pathways on production results and nutrient balance.
2 Materials and methods
The experiment was conducted at the Centro Regional Sur dairy farm, Faculty of Agronomy, UdelaR (34°36.810′ S, 56°13.088′ W), from July 1, 2021, to June 30, 2024, covering fiscal years 2021–2022 (year 1), 2022–2023 (year 2), and 2023–2024 (year 3). Animal care and handling procedures were carried out according to the research protocol for animal use in science approved by the Comisión Honoraria de Experimentación Animal (CHEA; protocol no. 020300-000174-22). Rainfall and temperature were recorded at 30-min intervals by a Davis Vantage Pro 2 meteorological station (Davis Instruments Corp.) located at Centro Regional Sur.
2.1 Treatment and experimental design
Throughout the three-year duration of the experiment, the study protocol, treatments, and management were reviewed by a board committee composed of researchers, farmers, consultants, and industry representatives. The experiment followed a completely randomized block design and evaluated two pasture-based dairy systems representing different intensification strategies that can be adopted in Uruguay, based on stocking rates, feeding strategies, and infrastructure.
The treatment defined as High Productivity (HP) was designed to represent the high end of the productivity range in pasture-based dairy system experiments in Uruguay, exceeding 18,280 kg milk ha−1 (Chilibroste et al., 2024). It had an average annual stocking rate of 2.8 milking cows per ha of milking platform, and grazing 87 was managed through daily strips. The feeds used consisted of corn silage, which was bought-in from a support area, and commercial concentrates.
The treatment defined as Medium Productivity (MP) aimed for medium productivity levels (13,606 kg milk/ha). It had an annual average stocking rate of 1.7 milking cows/ha, and grazing management involved three- to four-day strip occupation for simpler daily operations. This system was self-sufficient in conserved forage (haylage) produced on the milking platform, while concentrate was bought-in from the market.
The total experimental area comprised 41.4 ha divided into six paddocks, which were split equally between HP and MP cows, resulting in 20.7 ha per treatment. Paddocks were balanced by soil-type location, distance from the milking parlor, and forage species. Each paddock had drinking water supplied to every grazing strip.
The infrastructure for HP consisted of a loafing pad with access to a concrete feed pad (0.4 ha), a resting paddock with shade and water (0.5 ha), and a stand-off pad (0.06 ha) equipped with an effluent collection system (DairyNZ, 2017). The stand-off pad was designed specifically for HP to mitigate the greater risk of soil damage and muddy conditions associated with the higher stocking rate. It was used when rainfall exceeded 30 mm per event, as pastures are typically unsuitable for grazing under such conditions.
In contrast, the MP treatment did not have a stand-off pad. Under similar wet or muddy conditions, MP cows had access to a resting paddock with shade, water, and feeders (1.3 ha) where haylage was provided. Effluents were collected from the holding area of the milking parlor (HP and MP), the concrete feed pad (HP), and the stand-off pad (HP).
2.2 Experimental management
2.2.1 Pasture rotation and management
The milking platform consisted of the total area of the six paddocks grazed by the milking herd and remained unchanged throughout the experiment. The study used a 6-year pasture rotation, with paddocks sown with perennial and biennial forage species. Perennial forages included cocksfoot grass (Dactylis glomerata) or tall fescue (Lolium arundinaceum) combined with legumes such as white clover (Trifolium repens) and lucerne (Medicago sativa) and had a 4-year duration. The biennial forage mixture comprised ryegrass (Lolium multiflorum), chicory (Cichorium intybus), and red clover (Trifolium pratense). Both systems included the same area of each forage component.
All paddocks were soil-sampled (0–15 cm) in autumn to analyze N, P, and K content for fertilizer application decisions. Nitrogen fertilization was applied at sowing at a rate of 75 kg N/ha and after each grazing cycle at 35–46 kg N/ha (0.46 N), depending on forage growth rate. Phosphorus fertilization was applied at sowing as a compound fertilizer (7-40-40-0 + 5 S), considering soil analysis and critical soil nutrient levels.
2.2.2 Grazing and feeding management
Pasture was managed under a rotational stocking method for both treatments (Ortega et al., 2024). Measurements of sward height were performed weekly on the milking platform using a C-Dax Pasture Meter (C-Dax Systems Ltd.). The average sward height of each paddock was converted to kg DM/ha, using calibrations established in Uruguay for the same pastures (Ortega et al., 2023). Based on this, forage growth rate (kg DM ha-¹ day-¹) was calculated to estimate potential grazing and forage allowance per cow, which determined the grazing rules. These data were used to calculate forage mass on the milking platform (kg DM/ha). The target forage mass was 2,100 kg DM/ha.
The pasture management strategy aimed to utilize all forage produced, either through grazing or mechanical harvesting. When the average forage mass exceeded 2,100 kg DM/ha and growth rates surpassed intake capacity, the surplus was harvested for haylage. Conversely, if forage mass dropped below the target, grazing sessions were gradually reduced—from two grazing sessions per day to one, and ultimately to full confinement when necessary. Each grazing or confinement session lasted approximately 7–8 h after each milking.
Forage allowance defined the feeding strategy and supplementation with conserved forage (silage for HP and haylage for MP) and concentrate. On average, diets consisting of forage alone or combined with supplementation were formulated to achieve 21.2 L milk per cow per day (ranging from 16.0 to 26.0 L depending on days in milk). The outcome was reflected in the time cows spent each day grazing or in confinement.
Supplementation was adjusted according to the cow’s potential intake, based on estimated grazing harvest. Conserved forage (silage for HP and haylage for MP) and concentrates were provided as needed using data from the Lecheras Excel dataset (CONAPROLE, n.d.). This dataset considers body weight, number of lactations, pregnancy status, milk production, and milk fat content, based on the nutritional requirements of a cow producing 7,750 L per lactation in both treatments.
Concentrate supply was adjusted according to season and physiological stage, and different concentrate types were used throughout the study. Concentrates were offered twice daily in the milking parlor through automatic feeders, varying according to feed combination and treatment. Concentrates included commercial pellets (DM 88%, CP 180 g kg-¹ DM), ground corn grain (DM 88%, CP 87 g kg-¹ DM), corn and rapeseed grain (DM 90%, CP 203 g kg-¹ DM), and soybean hulls (DM 88%, CP 140 g kg-¹ DM) when diets were low in fiber.
2.2.3 Animal management
At the beginning of the experiment, cows were paired according to body weight (BW; 485 ± 76.0 kg), body condition score (BCS; 2.9 ± 0.33), calving date, parity (2.96 ± 1.5), and previous 305-day milk yield (6,543 ± 1,360 L), and were randomly assigned to the treatments. Once assigned, cows remained in the same treatment for the entire experimental period. Cows in both treatments calved between autumn and spring. The replacement rate was 25% throughout the experimental period, and primiparous cows were introduced annually at this rate in each treatment. Lactating cows grazed on the milking platform, and 60 days before calving they were dried off and moved to a naturalized grassland (Allen et al., 2011) with Festuca arundinacea and Stipa setigera, where they remained until prepartum, 25 days before calving. The prepartum diet consisted of a total mixed ration of corn silage, oat hay, concentrate, and nutrient premix (3.5, 2.3, 4.4, and 0.39 kg DM cow-1 day-1, respectively) offered in a loafing pad.
2.3 Measurements
2.3.1 Animal measurements
Cows were milked twice daily, and individual milk production was recorded at each milking using DairyPlan software (GEA Ltd.). Individual milk composition, including milk fat, crude protein, lactose, and urea, was determined monthly by Fourier-transform interferometry (Bentley Combi 600 FTS and Delta Lactoscope Combi 600). Body condition score was assessed by the same evaluator throughout the study (scale 1–5; Edmonson et al., 1989), and body weight was measured monthly using a portable electronic scale (Farmquip Ltd.).
2.3.2 Home grown forage harvest
Harvest by grazing was calculated as the difference between post-grazing and pre-grazing mass, measured with a C-Dax Pasture Meter (C-Dax Systems Ltd.), and multiplied by the area of the daily strip in each paddock. Surplus forage mechanically harvested as haylage was weighed using a portable electronic scale (Farmquip Ltd.) to calculate DM yield for each paddock. Samples were taken when chopped and before being offered to animals to determine DM content.
2.4 Supplementation and feed nutritive value
For HP, supplements (silage and concentrates) offered on the feed pad were weighed daily using the mixer’s electronic scale (Mary, 2018). For both systems, concentrate offered in the milking parlor was weighed fortnightly. Samples of all feeds in the diet were taken weekly and pooled monthly for chemical analysis. Pasture samples were collected manually by hand-plucking from each paddock before grazing (De Vries, 1995).
Feed chemical composition was determined following AOAC International (2023) methodologies: DM (method 934.01), ash (method 967.01), and CP (6.25 × Kjeldahl N; method 954.01). P and K contents in pasture and conserved forage were determined by atomic emission spectrometry (digestion with a MARS Microwave system and quantification with an MP-AES Agilent 4200). Neutral detergent fiber (Robertson and Van Soest, 1981) and acid detergent fiber (Robertson and Van Soest, 1981) were analyzed non-sequentially using the Ankom system (model 220, Ankom Technology Corp.).
2.5 Farm-gate nutrient balance
Farm-gate balance (surplus) and nutrient use efficiency for N, P, and K were determined using the farm-gate methodology developed by the EU Expert Panel (2015) for each treatment and fiscal year. Calculations for farm-gate balance and nutrient use efficiency are presented in Equations 1, 2. The area unit considered in this study was the milking platform (the area used for milking cows).
2.5.1 Nutrient imports
Inputs accounted for N, P, and K entering the farm included fertilizer, concentrates, conserved forages, biological N fixation, bedding material, and atmospheric deposition.
Nutrient inputs from concentrates and conserved forage (silage for HP and haylage for MP, when a positive surplus stock occurred) were calculated as the total amount imported multiplied by crude protein content divided by 6.25 (McDonald et al., 1995). Haylage surplus for MP was considered when the difference between forage reserves produced and consumed was positive. Because HP was not designed to produce or be fed with haylage, any haylage produced was accounted for as a negative input, as recommended by De Klein et al. (2017).
To estimate N fixation, the proportion of legumes in the mixed swards was recorded annually. The area with mixed swards represented 53%, 62%, and 100% of the total area in years 1, 2, and 3, respectively. Consequently, the legume proportion within the mixed swards ranged from 5% to 15% in years 1 and 2, and 5% to 35% in year 3. N fixation ranged from 22 to 28 kg N per ton of legume DM (Lussich, 2020).
Nutrients from fertilizers were calculated as the quantity applied multiplied by the nutrient content of each fertilizer. Atmospheric deposition values were taken from data reported for Uruguay (Carnelos et al., 2019). Finally, nutrients from the stand-off pad bedding materials (HP) were estimated by chemical analysis for each batch of material imported.
2.5.2 Nutrient exports
The outputs accounted for were milk, live weight production, and bedding material from the HP stand-off pad. Nitrogen output in milk was calculated from annual milk production and crude protein (CP) concentration, divided by 6.38 (Agricultural Research Council, 1994). Values of 0.10% and 0.15% were used for P and K milk concentrations, respectively (La Manna, 2002). Exports from live weight were calculated as the difference between replacement heifers and culled cows, using standard values of 0.024% for N (Agricultural Research Council, 1994), 0.72% for P, and 0.19% for K (La Manna, 2002).
2.5.3 Spatial heterogeneity
The time spent by animals in each area for both treatments was estimated as follows Equation 3:
where ISR refers to instantaneous stocking rate,
N represents the number of animals,
A is the area occupied by the animals (e.g., pasture, milking parlor, confinement areas such as resting paddocks and stand-off pad), and
t is the time (hours) spent in each area.
2.5.4 Statistical analysis
Response variables per area unit—such as annual forage production, harvest by grazing, mechanical harvest, supplementation allowance (concentrate and forage reserves), milk and solids production—were analyzed using a completely randomized block design as in Ortega et al. (2024). The six paddocks were considered replicates in space, and the fiscal years were considered a fixed effect. The model for system performance variables is represented in Equation 4.
where μ is the mean of the variable;
T represents the fixed effect of the treatment (i = HP or MP);
year is the fixed effect of the fiscal year (j = year 1, 2 and 3);
block denotes the effect of the blocks (k = paddocks, six per treatment); represents the residual error.
For individual animal observations, the cow was considered the experimental unit. The model included treatment and fiscal year as fixed effects. Cows were nested within fiscal year as a random effect. Data were fitted with linear mixed models (lmer) using the car package in RStudio Equation 5):
where µ represented the mean of the variable;
T is the fixed effect of the treatment (i = HP or MP);
year is the fixed effect of fiscal year (j = year 1, 2 and 3);
cow denotes the ID of the cow nested in the year;
group is the cows grouped for productivity, calving date, number of lactations, BW and BCS at calving; is the residual error.
The model for the time spent in two, one, or zero grazing turns was fitted using a logistic regression with a binomial distribution in SAS software (GENMOD procedure). The model included fixed effects for treatment and fiscal year as well as their interaction Equation 6:
For farm-gate balances, a general linear model was applied, considering the system as the experimental unit and the fiscal years as replicates Equation 7).
Effects were declared statistically significant at p ≤ 0.05 and discussed as trends for 0.05 < p ≤ 0.10 based on Tukey’s test.
2.6 Results
The monthly mean temperature and total rainfall for the three years evaluated, compared with the 30-year historical average, are presented in Figure 1. The mean temperatures during the experimental years (16.7°C, 17.6°C, and 16.6°C for years 1, 2, and 3, respectively) were similar to the historical average (16.0°C), but higher than historical values during summer, especially in 2022–2023. The total annual rainfall was 960, 652, and 1,337 mm for years 1, 2, and 3, respectively, with high variability within each year. Compared with the historical average (1,157 mm), annual rainfall varied –7%, –44%, and +13% for years 1, 2, and 3, respectively. Year 1 was characterized by lower precipitation than the historical average except in summer. In year 2, the most severe drought in Uruguay’s history occurred. Lastly, although year 3 had a dry summer, autumn rainfall was exceptionally high, with 52% more than the historical annual average (INUMET, 2023).
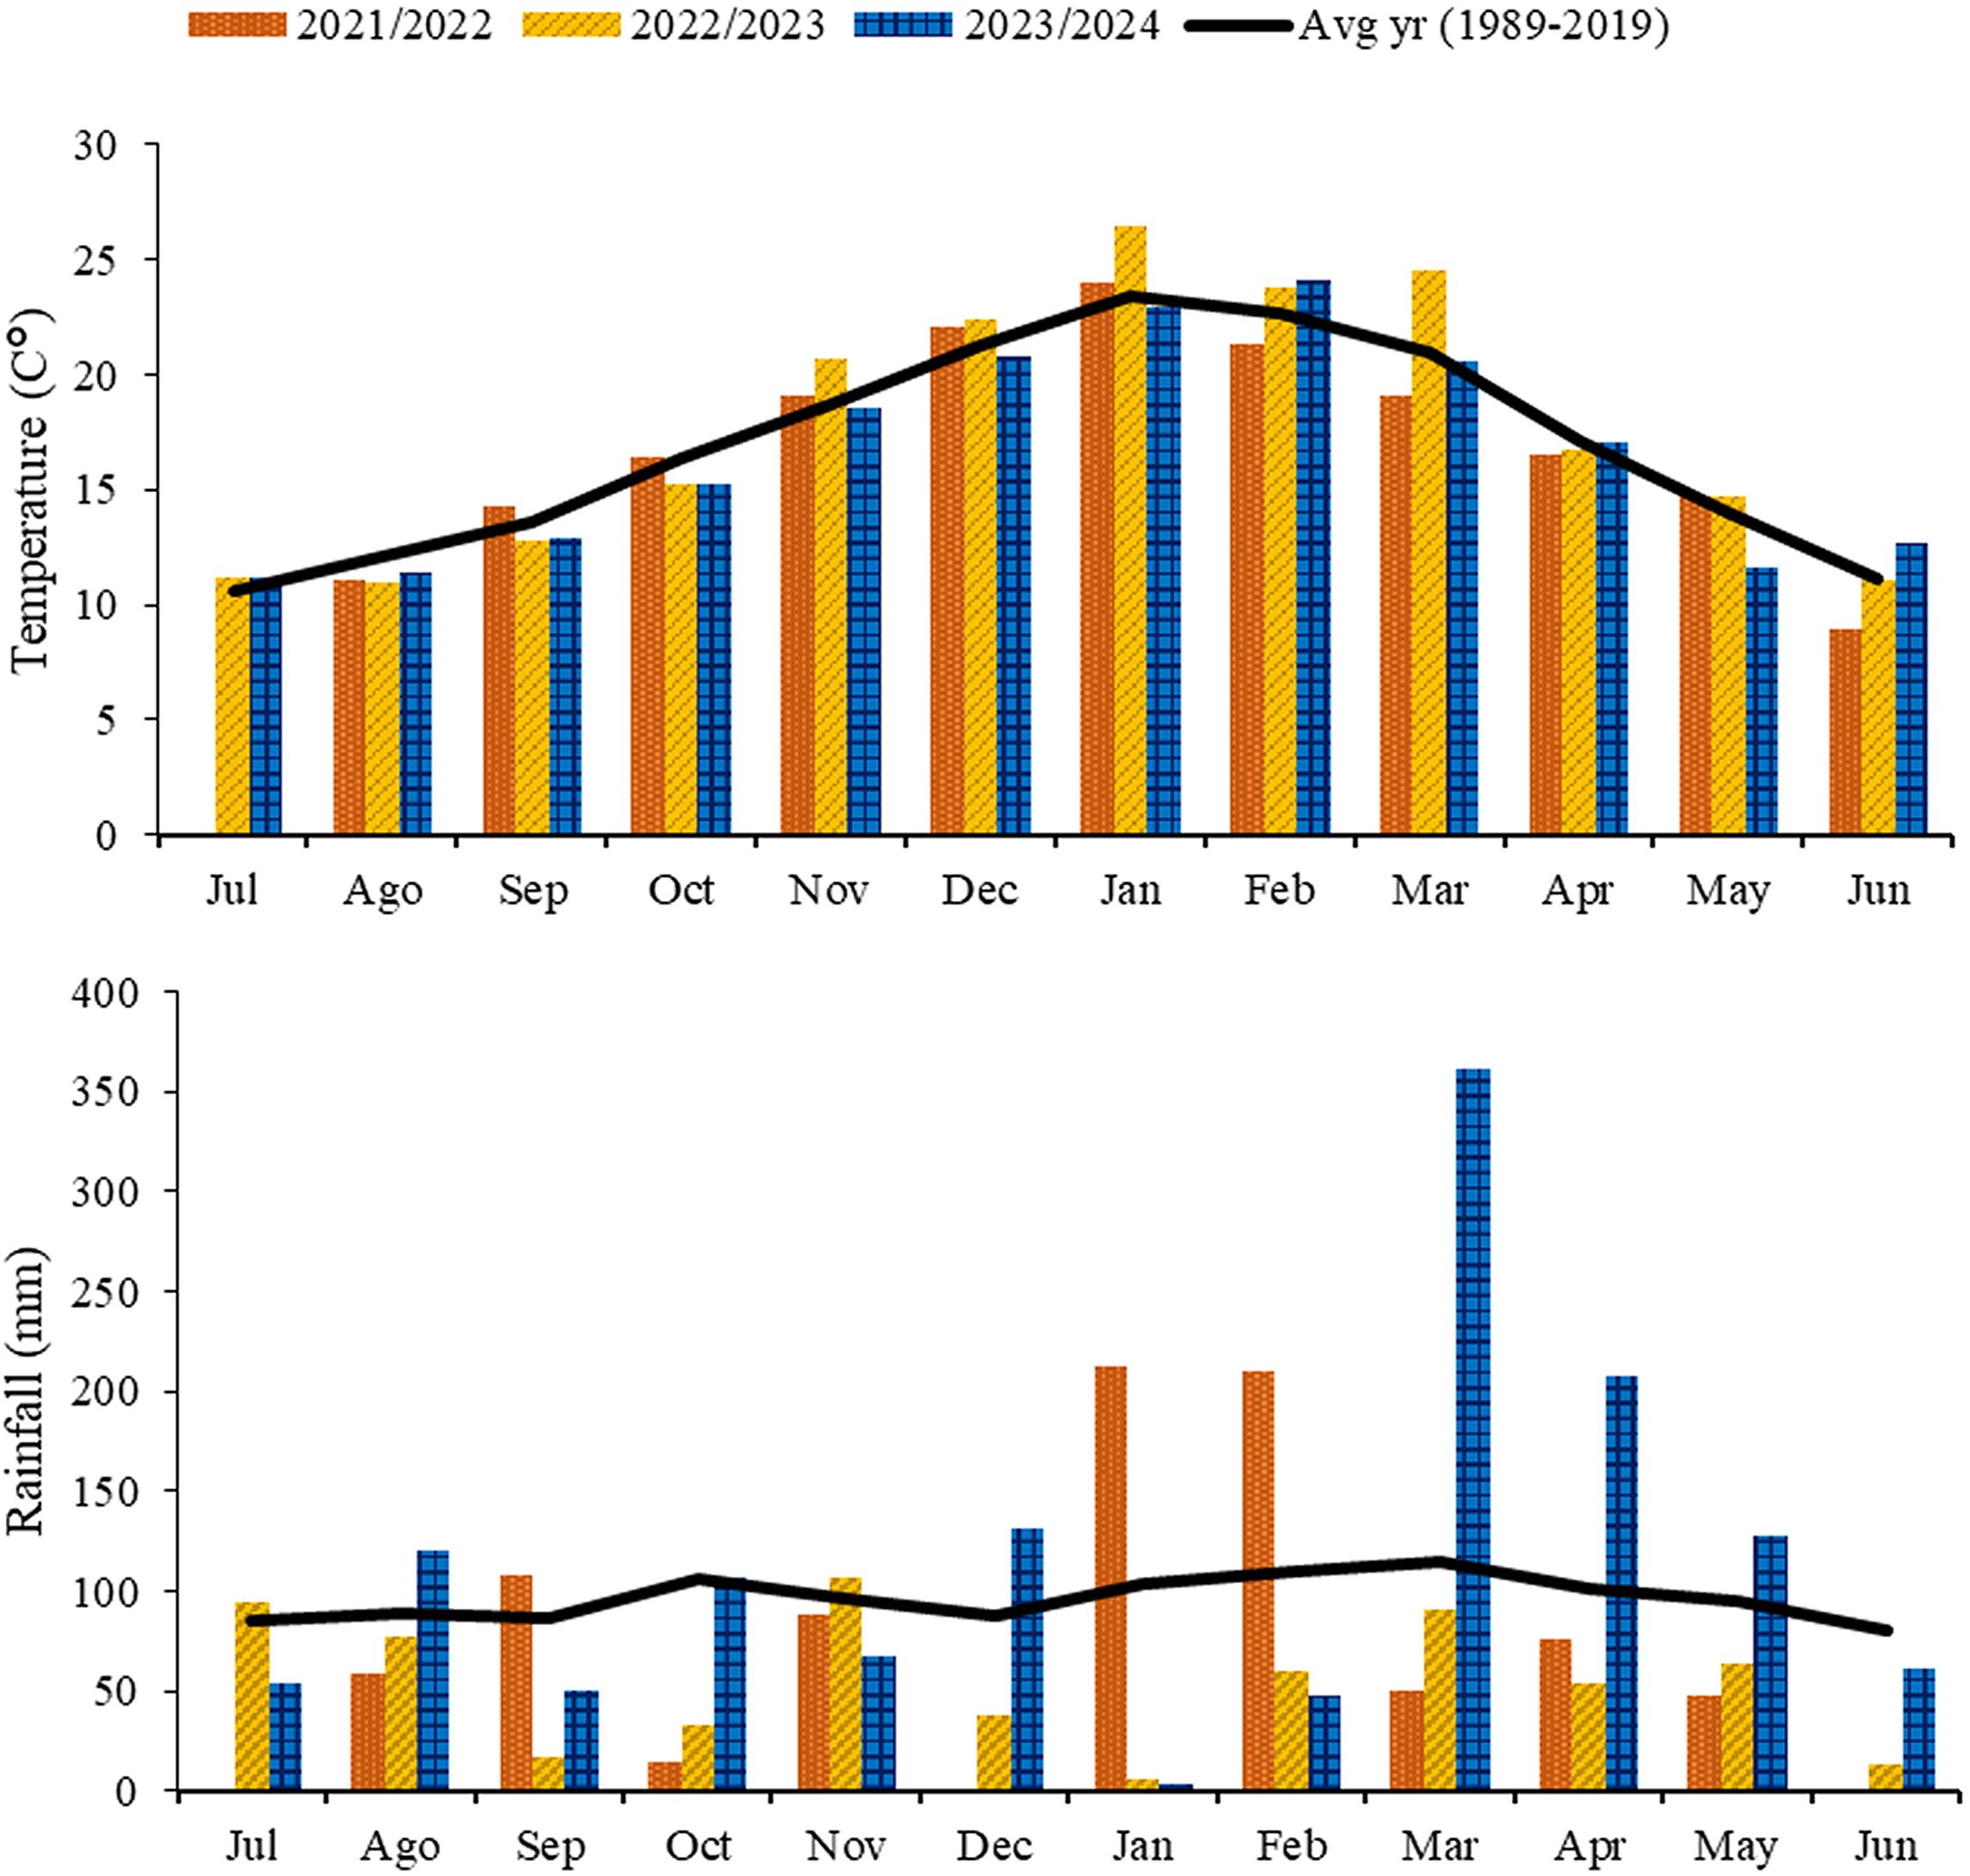
Figure 1. Monthly mean temperature and total rainfall for the three experimental years compared with the historical average.
Productivity variables for each treatment are presented in Table 1. Annual forage production and total harvest did not differ between treatments. However, there were differences in harvest strategy: HP had a higher harvest by grazing (+47%) and lower mechanical harvest (–75%) than MP. Additionally, the amount of conserved forage and concentrate offered was affected by treatment, with HP importing 46% more conserved forage and 50% more concentrate than MP.
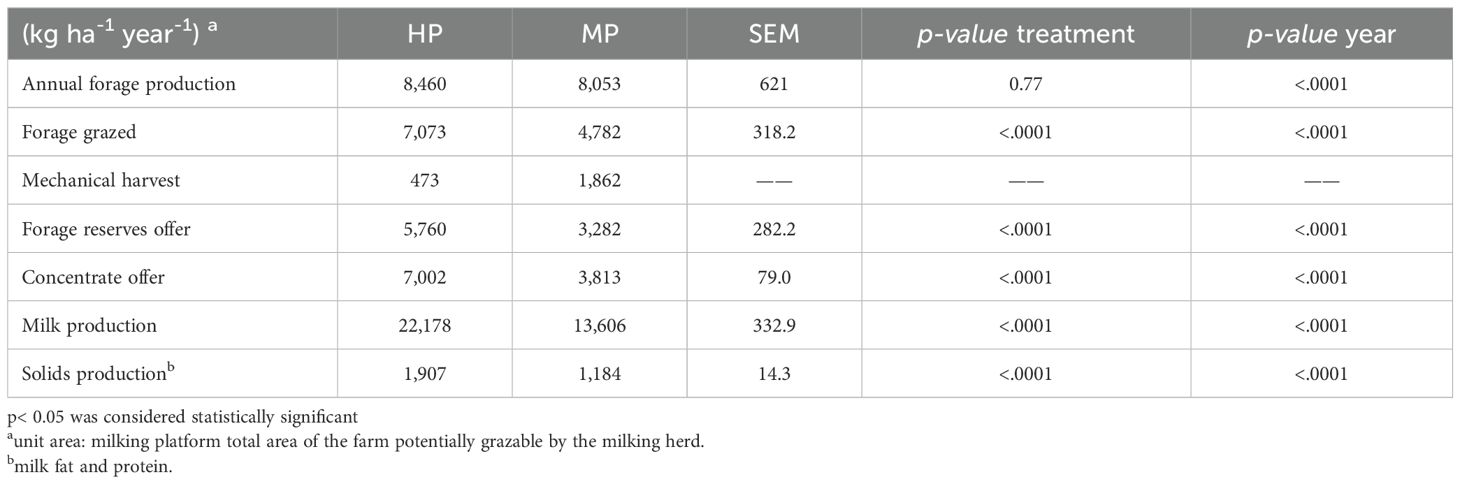
Table 1. Description of forage production and harvest, feed offer, and productivity variables for high-productivity (HP) and medium-productivity (MP) systems.
No differences in individual milk production or milk protein and fat concentrations were found between treatments (Table 2). Consequently, the higher stocking rate in HP resulted in significant differences in milk and solids productivity (solids ha-¹).
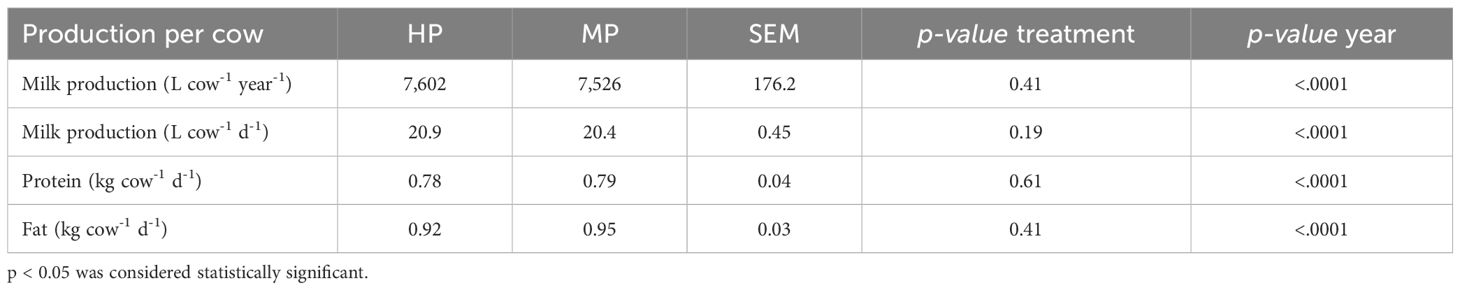
Table 2. Individual milk and solids production for high-productivity (HP) and medium-productivity (MP) systems.
The feeding strategies in terms of grazing opportunities are shown in Table 3. Treatment MP had more frequent one- and two-grazing events, while HP was characterized mainly by one grazing event and, secondly, by zero grazing events.
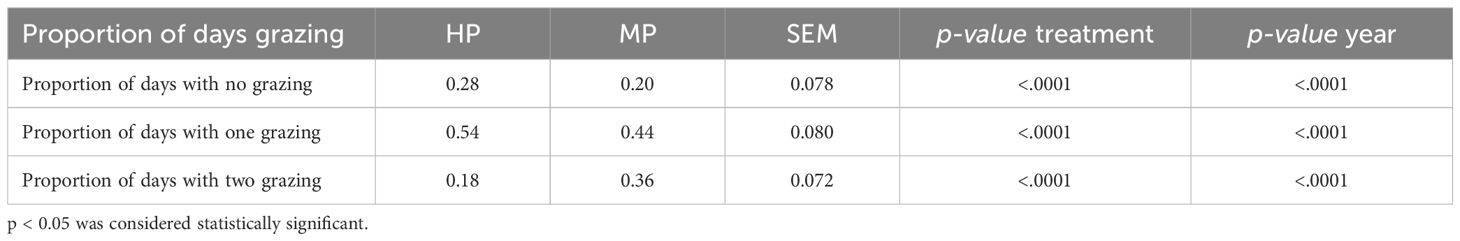
Table 3. Proportion of days with one, two, and zero grazing for high-productivity (HP) and medium-productivity (MP) systems.
An overview of N, P, and K inputs, outputs, farm-gate balance, and efficiency metrics for the two experimental systems is presented in Table 4. Annual nutrient inputs for HP were higher than for MP by 53%, 65%, and 148% for N, P, and K, respectively. Regarding outputs, significant differences between treatments were found for all nutrients. Moreover, the farm-gate balances were 52%, 64%, and 191% higher for N, P, and K, respectively, with statistical differences between treatments for N and K.
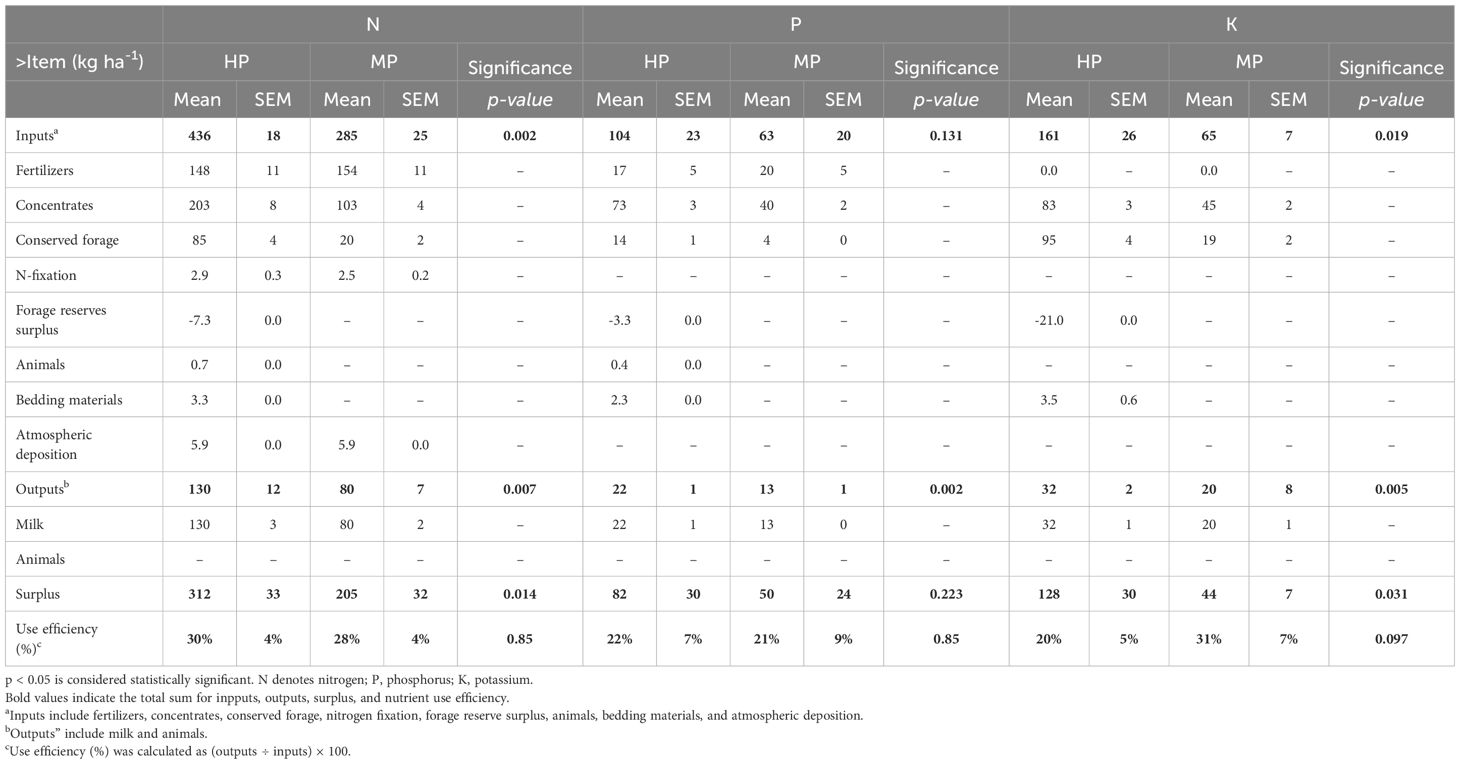
Table 4. Farm-gate nutrient balance and sources of N, P and K for high-productivity (HP) and medium-productivity (MP) systems.
In the HP system, the average structure of N inputs was mainly attributed to feed (46% and 19% from concentrates and conserved forage, respectively) and secondarily to fertilizers (33%). For MP, fertilizer was the greatest N input source (52%), followed by feed (37% and 7% from concentrates and conserved forage, respectively). A summary of the nutrient content of the bought-in feeds and haylage is provided in Table 5.
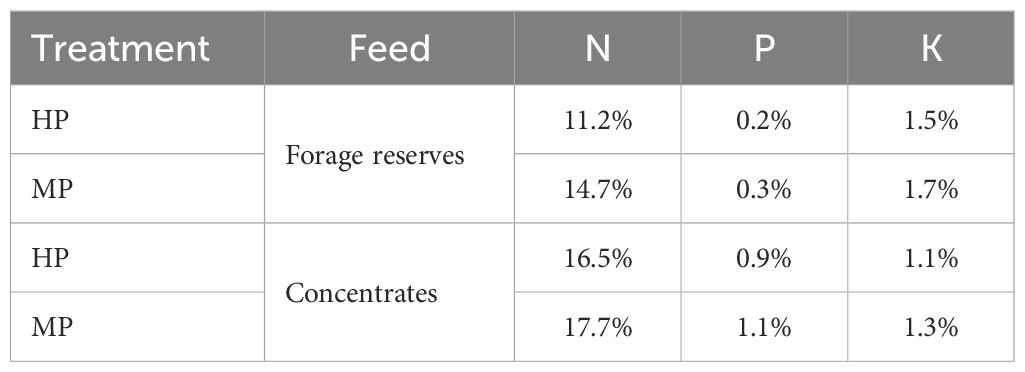
Table 5. Nutrient (N, P and K) feeds content for treatments high-productivity (HP) and medium-productivity (MP) systems.
Regarding interannual variation in N sources, the drought in year 2 notably altered the proportions of input sources across treatments. From year 1 to year 2, feed input increased by 12% in HP (from 60% to 72%) and 17% in MP (from 40% to 57%). In year 3, feed input decreased to 62% in HP and 37% in MP. Remarkably, year 2 was the only year in which feed outweighed fertilizer inputs in the MP system. Fertilizer inputs also declined in year 2, dropping to 26% in HP and 40% in MP, compared with higher proportions in years 1 and 3 (37% and 36% in HP and 57% and 60% in MP for years 1 and 3, respectively).
For P, feed constituted the main input across treatments and years. The largest contribution for HP came from concentrates, which gradually increased from year 1 to 3 (from 62% to 83% in HP and from 51% to 94% in MP). Fertilizer use decreased progressively over time, reaching zero by year 3 (from 24% in HP and 46% in MP in year 1). For K, feed represented the major input source for both treatments, and the contributions from concentrates and conserved forage varied between years.
Outputs consisted mainly of milk production and live-weight differences; however, the contribution from live weight was negligible because stocking rate was maintained constant.
N and P use efficiencies did not differ between treatments (p > 0.05 for N and P), whereas K use efficiency showed a tendency to differ. Moreover, there was a year effect (not shown in Table 4) for N and P (p < 0.05), while for K the year effect was not significant (p > 0.05).
The indicator developed to assess nutrient spatial heterogeneity, the instantaneous stocking rate (ISR), showed that nutrients were mainly concentrated in the milking parlor and, secondly, in confinement areas (Figure 2 and Table 6). Treatment HP presented higher nutrient accumulation than MP, attributed to the greater animal stocking rate and longer time spent in these locations. For pasture paddocks, although HP had a higher stocking rate than MP, correction by grazing time resulted in similar ISR values (1.2 and 1.1 for HP and MP, respectively).
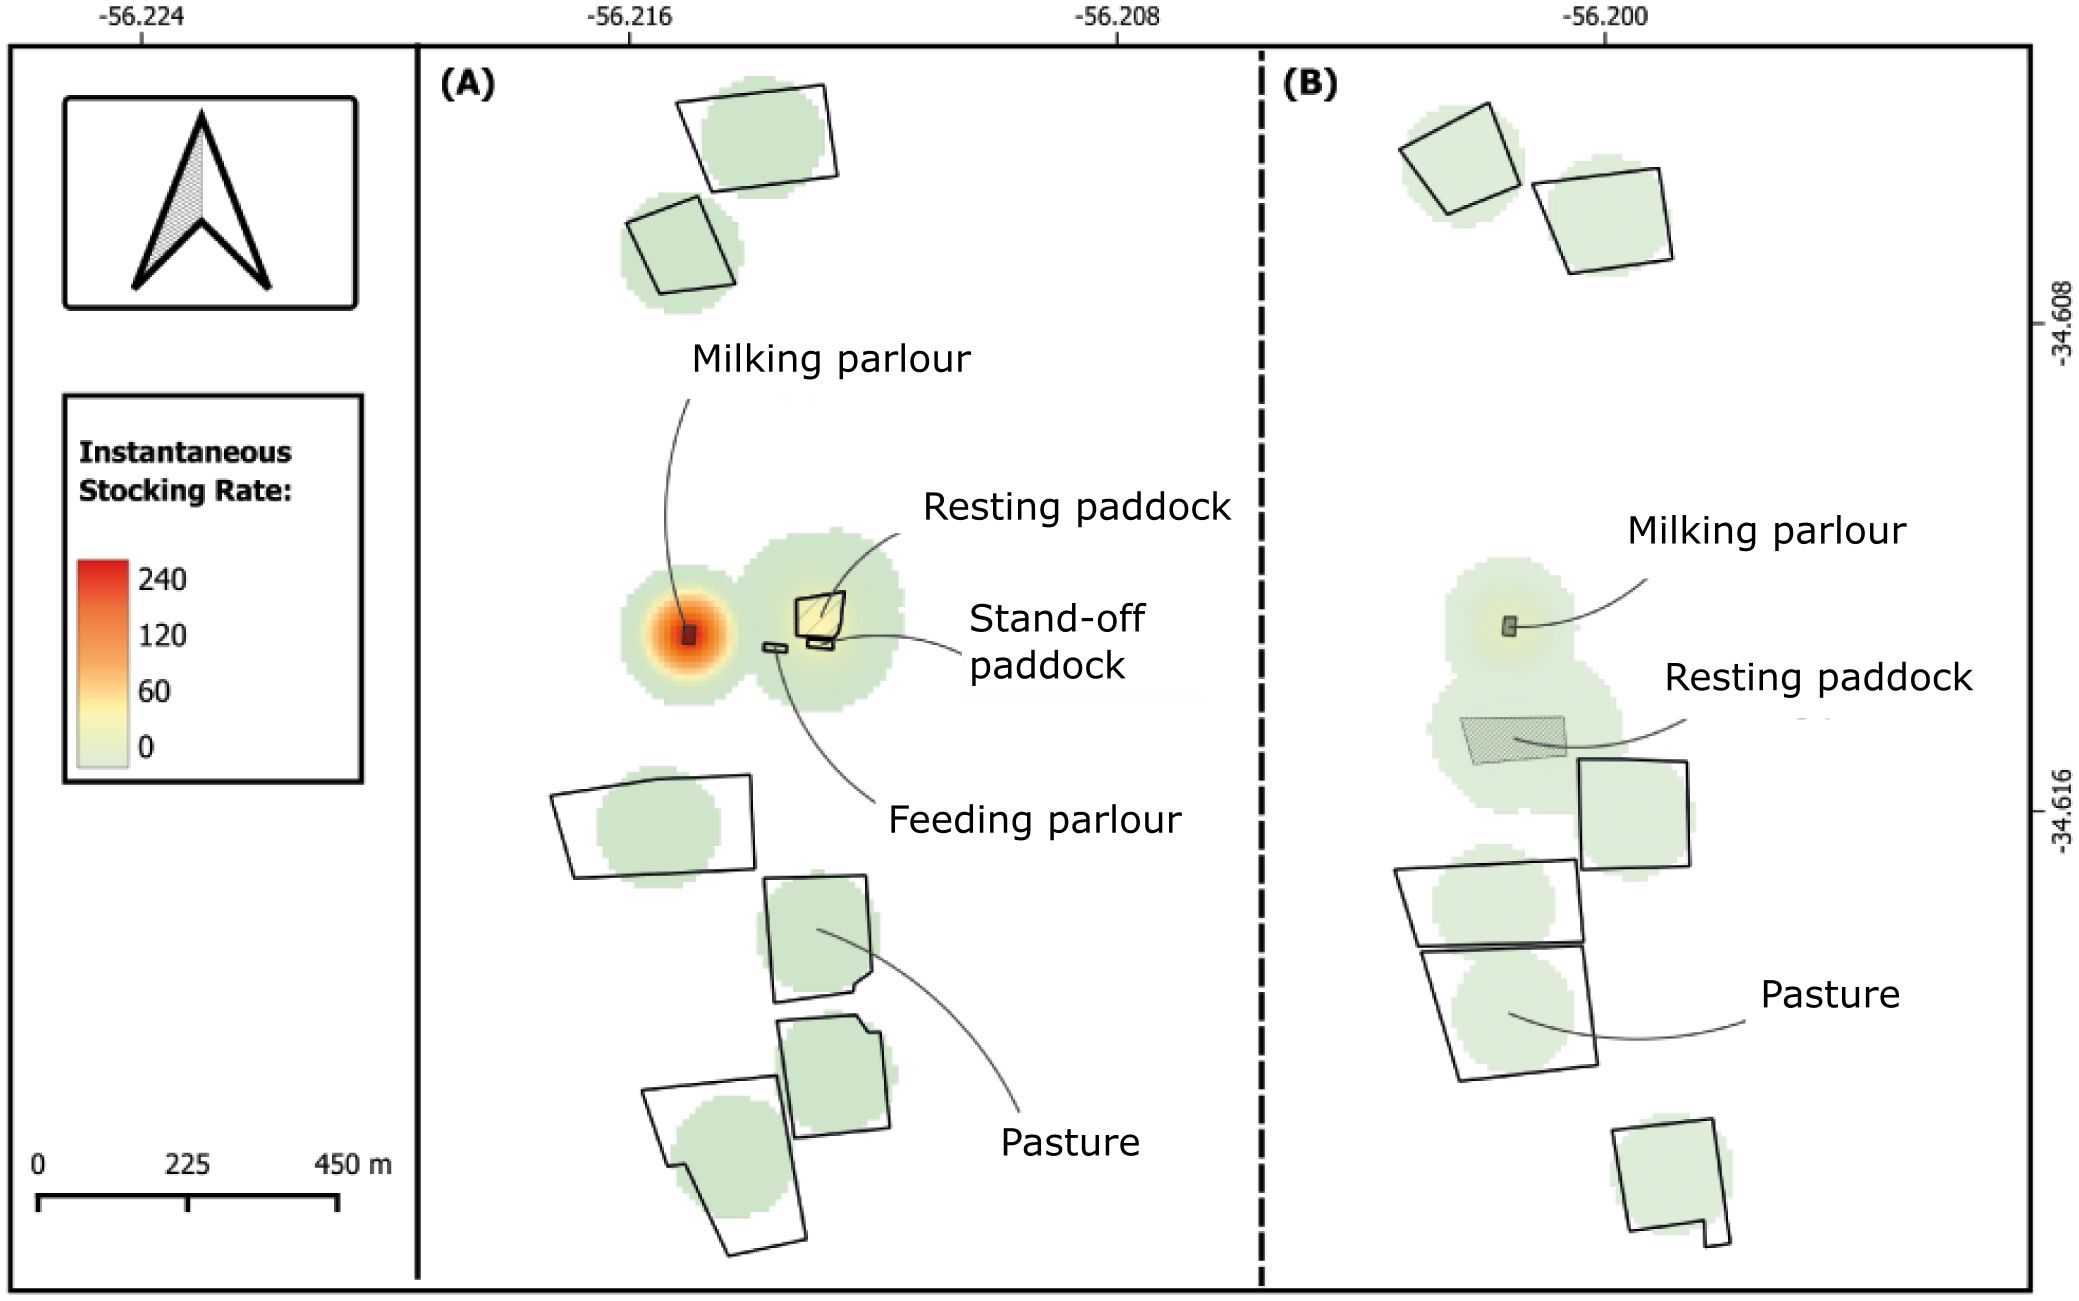
Figure 2. Heatmap of instantaneous stocking rate for high-productivity (A) and medium-productivity (B) systems.
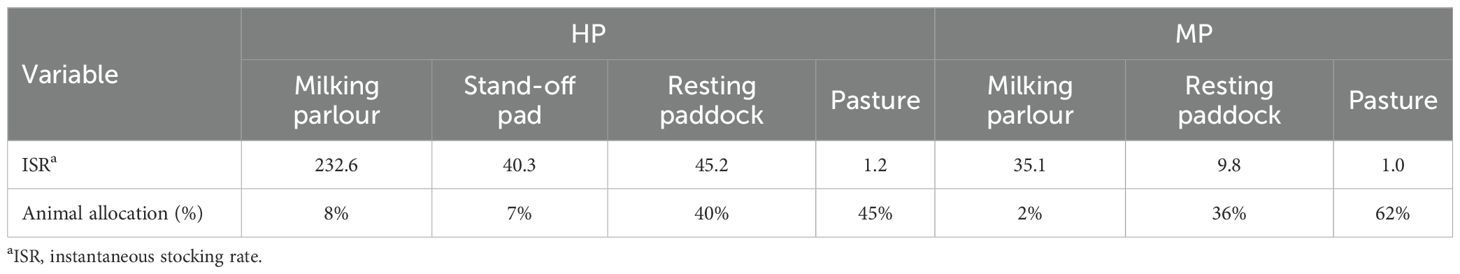
Table 6. Instantaneous stocking rate (ISR) weighted by area and time, and proportion of time spent in specific locations by cows in high-productivity (HP) and medium-productivity (MP) systems.
Cows spent 45% and 63% of their time grazing in HP and MP, respectively. In the HP system, the use of the stand-off pad varied across years. Of the total time spent in confinement (55%), cows spent 7%, 9%, and 29% of their time on the stand-off pad during years 1, 2, and 3, respectively, with the remainder spent in the sacrifice paddock, where no effluent management was implemented. The stand-off pad was designed for use in muddy conditions; hence, during the first two years, its use was limited due to drought, while in the last year its use increased.
2.7 Discussion
This study considered a wide range of variables to describe two intensification strategies, some of which were estimated using indirect methods that may carry inherent uncertainty. Nevertheless, the consistency of three years of data and rigorous management practices provide robust results. Based on these findings, dairy systems can be intensified without compromising overall forage production, although harvest methods are significantly affected. The more intensive system led to higher nutrient surpluses due to increased input use; however, nutrient use efficiency did not differ between treatments, although a significant year effect was observed (excluding K). Moreover, as intensification increases, grazing time declines, demanding greater supplementation and specific infrastructure.
Animal confinement when not grazing results in elevated nutrient accumulation within a reduced area, mostly near the milking parlor, which becomes more pronounced with increased intensification. Nonetheless, longer periods in confined spaces allow for manure collection and, consequently, its reuse. Therefore, integrating grazing management with adequate supporting infrastructure becomes critical to balance forage production, animal welfare and performance, and effective manure and waste management.
2.7.1 Forage annual production, diet, and milk production per hectare
As predicted, there were no differences between treatments in annual forage production. However, the method of forage harvest differed between HP and MP. Although HP grazed 47% more forage than MP, forage planning and management enabled MP to achieve a total harvest (through grazing and mechanical harvesting) similar to that of HP (Table 1). Moreover, mechanical harvest for MP was above national commercial farm values (1,367 kg and 1,862 kg DM ha-¹ for national farms and MP, respectively; Fariña and Chilibroste, 2019). Although HP was not designed for mechanical harvest, conserved forage as haylage was produced in year 2 due to lower animal stocking rates during spring, which resulted in forage production exceeding animal consumption capacity. Overall, despite the drought experienced during the three study years (Figure 1), annual forage production (8.3 t DM ha-¹) was comparable to values reported in international and national farmlet studies. For example, Baudracco et al. (2011) reported annual forage production of 11.9 t DM ha-¹ in lucerne-based pastures established on more productive soils, while Stirling et al. (2021) and Ortega et al. (2024), working with mixed pasture rotations in similar productive conditions in Uruguay, reported 8.8 and 7.7 t DM ha-¹, respectively. In addition, forage utilization ranged between 83% and 89% as a consequence of rigorous forage management and strategic planning that enabled efficient grazing and mechanical harvest.
As animal stocking rate increases, forage allowance and herbage DM intake per cow decrease, requiring strategic supplementation to maintain milk production per cow (Baudracco et al., 2010; Patton et al., 2016; Ortega et al., 2024). In this study, HP required more conserved forage (+46%) and concentrates (+50%) than MP, decreasing grazing time and increasing confinement periods (Table 3). Previous studies have shown that increasing stocking rate from 1.5 to 2.0 cows ha-¹ raises the proportion of time with one grazing turn by 12% and decreases time under two grazing turns by 14% (Ortega et al., 2024). Likewise, Stirling et al. (2021) found that diets maximizing grazing can double the number of pasture days compared with diets using fixed supplementation. Similarly, in this experiment, increasing stocking rate from 1.7 cows ha-¹ in MP to 2.8 cows ha-¹ in HP increased the one-grazing-turn time by 10% and reduced two-turn grazing by 18% (Table 3). These findings highlight that intensification limits grazing opportunities, emphasizing the importance of infrastructure for system performance, environmental sustainability, and animal welfare.
Individual milk production was not affected by the treatments, consistent with findings from other pasture-based farmlet studies with different stocking rates (Table 2; Baudracco et al., 2011; Fariña et al., 2011; Ortega et al., 2024). However, other studies on pasture-based dairy systems have reported that individual milk production can decrease with increasing stocking rate due to a reduction in individual pasture DM intake (Macdonald et al., 2008). In the present study, feed management was designed to maintain a target milk production that required a specific dry matter intake (DMI). When forage production was insufficient, strategic supplementation with conserved forage and concentrates was provided to prevent any negative effect on milk production.
2.7.2 Farm-gate nutrient balance
As expected, HP showed greater nutrient inputs and surpluses than MP, with significant differences for N and K. This pattern aligns with previous studies (Gourley, 2012; Stirling et al., 2024a). Treatment HP relied primarily on feed (silage and concentrates), whereas MP depended more on fertilizers, reflecting their contrasting feeding strategies (Table 4). As observed in earlier studies, intensification in pasture-based dairy systems is generally associated with a greater reliance on bought-in feed to sustain milk output per hectare (Macdonald et al., 2008; Baudracco et al., 2011; Ortega et al., 2024).
N biological fixation values were lower than national reports (29–49 kg N ha-¹; Stirling et al., 2024), explained by the low legume content (15%), grazing management favoring grasses, and high N fertilization rates (148–151 kg N ha-1 year-1). These effects could have been intensified by prolonged and consecutive droughts throughout the trial period.
Farm-gate balances can vary depending on whether they are calculated per milking platform (De Klein et al., 2017; Gourley, 2012) or for the total dairy area. In this experiment, if the dairy area instead of the milking platform were used, nutrients from the conserved forage produced on the support area would reduce HP nutrient imports by 20%, 9%, and 25% for N, P, and K, respectively, due to the reallocation of nutrients from feed imports to fertilizer use on the support area. Conversely, MP would show minor changes for N and P and a 10% increase for K.
The results of this study followed the same trend as national data, in which more intensified systems required higher inputs and resulted in larger surpluses. The HP system showed nutrient surpluses above the national range reported for commercial and experimental dairy farms (71–299 kg N ha-1 year-1), whereas MP values were within this range but exceeded those observed in some less intensified systems (Stirling et al., 2024a). These findings highlight the importance of generating more information and understanding how intensification factors affect farm-gate nutrient balances.
Studies in pasture-based dairy systems have shown the relationship between intensification and nutrient surplus (Gourley, 2012; Stott and Gourley, 2016; De Klein et al., 2017; Quemada et al., 2020; Stirling et al., 2024a). For instance, an analysis of a 22-year period (1999–2012) of ongoing intensification in Australia revealed that as stocking rate increased from 1.4 to 1.6 cows ha-¹ of dairy area, purchased feeds rose by 60% and N fertilizer by 21%, increasing the N surplus from 54 to 158 kg N ha-1 (Stott and Gourley, 2016). Similarly, a study conducted in New Zealand (Luo and Ledgard, 2021) found that an increase in stocking rate from 2.65 to 2.85 cows ha-1 of dairy area was accompanied by a 30% increase in N fertilizer use and a doubling of feed imports.
Although the unit area accounted for in the Australian and New Zealand studies (Stott and Gourley, 2016; Luo and Ledgard, 2021) differs from that in this work, limiting direct comparisons, the increase in animal stocking rate from 1.7 (MP) to 2.8 (HP) cows ha-¹ represented a 65% increase in purchased feeds (Table 1). Moreover, there were no differences between treatments in N fertilizer inputs. Nevertheless, when analyzed at the dairy-area scale, HP required higher fertilization due to the additional support area needed to meet the requirements of the higher stocking rate (Table 4).
Previous research has shown that a greater nutrient surplus is not necessarily correlated with increased nutrient losses to the environment, though it can serve as an indicator for nutrient loss estimation (Luo and Ledgard, 2021; Powell et al., 2010; Dalgaard et al., 2012; Stirling et al., 2024b). Complementing surplus calculations with information on nutrient distribution and concentration areas is essential to identify potential environmental risks. A national study analyzing four dairy systems with contrasting feeding strategies and cow genotypes estimated environmental losses from N surplus (Stirling et al., 2024a). This study also found that leaching and volatilization were the main pathways of N loss, with feed/loafing pads identified as critical hotspots (60% of N losses from 6% of the area), followed by fallow periods (Stirling et al., 2024b).
The high nutrient surpluses observed in this experiment raise concerns about potential environmental losses. The HP treatment could represent a higher risk than MP due to its greater surplus and longer time in confinement areas (55% vs. 40% for HP and MP, respectively), where nutrients accumulate in limited areas. In addition, HP produces its own conserved forage (silage), with fallow periods that can increase the risk of nutrient loss. However, nutrient losses depend not only on the magnitude of the surplus but also on infrastructure design and management. In this case, HP had greater capacity for manure collection and storage in confinement areas (stand-off pad and feed pad) than MP, which relied solely on a resting paddock. As dairy system intensification develops, infrastructure should be considered a key factor in system design, as it remains one of the main constraints for sustainable growth in Uruguayan dairy systems (Aguerre et al., 2018; Fariña and Chilibroste, 2019; Ortega et al., 2024).
A review of data from Europe, New Zealand, and the United States also confirmed the trend of increased surplus with greater intensification, reflected in higher inputs, surpluses, and outputs (De Klein et al., 2017). However, a study from the Netherlands (Oenema and Oenema, 2021) found that nutrient surplus remained stable despite intensification, attributed to a balance between increased inputs from feed and outputs from milk, animals, and manure export. In this study, inputs and outputs were not balanced, with fewer outputs from manure due to the lack of effluent management planning. This gap presents an opportunity to reduce surplus in intensified systems through improved manure management.
The farm-gate P and K surplus values were higher in magnitude than data reported in the literature, although within the ranges described (Wivstad et al., 2023). For the three-year average, the main P and K inputs came from bought-in feed for both HP and MP. In intensified dairy systems from the United States and Australia, feed also accounted for the highest P input and was significantly correlated with P surplus, as observed in this experiment (Gourley, 2012; Pearce and Maguire, 2020). Many studies have reported negative balances due to reliance on soil nutrient reserves and the absence of P or K fertilization, which can be an effective strategy when initial soil nutrient levels are high (Oenema et al., 2003). In this case, soils were fertilized according to soil testing to minimize potential losses. In fact, there was no K fertilization during the three years and no P fertilization in the last year, due to high soil concentrations of both nutrients.
Considering that dairy cows can excrete up to 66% of the nutrients imported onto the farm and that their distribution depends on the time cows spend in an area (Aarons et al., 2017, Aarons et al., 2023), both treatments in this study likely showed nutrient saturation in specific zones because of imbalances in P and K. In this context, it is important for pasture-based dairy systems to integrate mitigation strategies to prevent nutrient transfer to streams and surface waters, such as maintaining buffer areas, avoiding fertilizer application in years with heavy rainfall (Alfaro et al., 2008), establishing long-term pastures to minimize erosion (Mcdowell et al., 2017), and including rotations with high P-extracting crops such as legumes (Sulieman et al., 2013).
Differences in N use efficiency between HP and MP were minor (Table 4). National studies (La Manna and Durán, 2008) reported N use efficiency ranging from 22% to 66%, with values above 60% corresponding to less-intensified systems undergoing nutrient mining. Quemada et al. (2020) reported an average N use efficiency of 38%, ranking HP and MP in a favorable position, though still with room for improvement. One strategy to enhance N use efficiency is the reutilization and management of effluents to reduce fertilizer inputs. For example, previous studies have shown comparable forage production, crop yield, soil nutrient content, and microbial activity, as well as low pathogen loads, when using effluents instead of urea fertilization (Lombardi et al., 2022; Illarze et al., 2024).
De Klein et al. (2017) reported that dairy systems achieving N use efficiency near 40% had N inputs below 400 kg ha-1 year-1. In this study, HP exceeded that threshold, while MP remained below it but achieved similar efficiency. The relationship between N use efficiency and intensification is complex: some authors have reported a negative trend (De Klein et al., 2017), whereas national data indicate a peak around 100 kg N ha-1 year-1 of input, regardless of input type (Stirling et al., 2024a). In this study, the highest N use efficiency (year 2) coincided with greater concentrate use, highlighting the influence of year-dependent management decisions on input variation. However, the efficiency of concentrate-derived N is not straightforward. Although it bypasses the plant–soil interface, its conversion efficiency into milk depends on multiple factors such as the cows’ energy balance and the form of N (Dijkstra et al., 2013). Conversely, N from fertilizer must be absorbed by pasture before animal consumption, introducing an additional loss pathway. Both routes involve inherent inefficiencies that vary with site-specific and agro-climatic conditions (De Klein et al., 2017).
Nutrient use efficiency depends on both inputs and outputs, with a substantial fraction of inputs derived from bought-in feeds. However, nutrient losses associated with feed production are not accounted for in farm-gate balances, leading to overestimation of nutrient use efficiency. Therefore, when accounting for the externalization of nutrient feed production and manure utilization, N use efficiency decreases (De Klein et al., 2017; Quemada et al., 2020; Oenema and Oenema, 2022). Quemada et al. (2020) proposed an adjustment factor assuming a 50% N use efficiency for N derived from bought-in feed. Applying this factor to the present study would reduce N use efficiency by 12% and 9% for HP and MP, respectively, reflecting HP’s greater reliance on external feed inputs. These results demonstrate that including externalized losses provides a more accurate assessment of nutrient flows beyond the farm-gate balance.
2.7.3 Spatial heterogeneity
Although the relationship between farm-gate nutrient balance and environmental impact is not always clear (Öborn et al., 2003), it is evident that nutrients are not homogeneously distributed within the system (Gourley et al., 2015), and nutrient losses can be accentuated in areas where they are concentrated (Stirling et al., 2024b). Considering that time spent in an area is positively correlated with nutrients excreted (White et al., 2001), the higher nutrient concentrations observed in the milking parlor and confinement areas in this study are consistent with the spatial distribution patterns expected in more intensive systems (Figure 2).
These results align with data from commercial dairy farms in Australia, where studies on soil P, K, and S distribution showed that higher nutrient levels were associated with dairy effluent application areas and night, calving, and sacrifice paddocks (Gourley et al., 2015). Similarly, in Uruguay, nutrient characterization of sacrifice paddocks in commercial dairy farms determined nutrient concentrations ranging from 7 to 176 N mg kg-1 and 45 to 302 mg P kg-¹ in the top 7.5 cm of soil (Ciganda and La Manna, 2009), exceeding the recommended national limit for P in soils (31 ppm; Ministerio de Ambiente, 2020).
In contrast, in New Zealand dairy systems, the main source of N leaching comes from pastures due to urine patches (De Klein et al., 2010), whereas in Uruguayan dairy systems, Stirling et al. (2024b) estimated that 60% of predicted N losses occurred within 6% of the farm area—specifically in feed/loafing pads, raceways, and effluent storage areas—showing similar patterns to those identified in this study.
Understanding where nutrients accumulate within the system is essential for developing adequate infrastructure that enhances nutrient reutilization and supports a more balanced distribution. In this context, both treatments in this study managed effluents in the milking parlor, while HP also handled effluents in the feeding parlor and stand-off pad. As system intensification increases, the proportion of time cows spend in confinement areas without effluent management also rises, emphasizing the need for infrastructure in dairy systems that capture manure and support mitigation strategies.
2.8 Future research
Future research should focus on nutrient balances across diverse dairy intensification strategies, with particular emphasis on P and K, given the limited national data available. These efforts should aim to generate more information, expand current knowledge, and reduce uncertainties to improve predictive models adapted to our region.
Considering that cows in national dairy systems can spend a considerable amount of time in confinement areas (depending on climatic conditions), it is important to generate data based on direct measurements of nutrient losses under different mitigation strategies, along with infrastructure that enables nutrient capture—such as the use of stand-off pads as structural confinement spaces rather than conventional sacrifice paddocks.
Additionally, evaluating the impact of effluent recirculation on nutrient balances, forage production, and economic outcomes will provide valuable insight and guidance for sectoral policies promoting sustainable productivity.
2.9 Conclusions
This study demonstrated that although intensification increases productivity, it also introduces significant challenges in nutrient management and potential environmental impacts. The two intensification strategies evaluated did not affect annual forage growth or total harvested yield, but they did influence the harvest method (grazing or mechanical), resulting in different feeding strategies.
Higher intensification was associated with greater reliance on external inputs and nutrient surpluses, potentially increasing the risk of environmental losses—especially in confinement areas. Severe weather conditions drove adjustments in feeding strategies and fertilizer decisions that influenced nutrient inputs across the years evaluated, highlighting interannual variability.
Although animals in the HP treatment spent more time in confinement and required more bought-in feed compared with MP, nutrients in both systems were concentrated in areas without effluent management, underscoring the need for infrastructure suited to each intensification level. A potential solution could be the structural use of stand-off pads as part of the confinement infrastructure in pasture-based dairy systems combined with supplementation, which shows promising potential.
Furthermore, the absence of an effluent management plan suggests an opportunity to reduce fertilizer inputs by improving nutrient recycling practices. In summary, integrating infrastructure and nutrient recycling strategies is essential to balance productivity with sustainability in intensified dairy systems.
Data availability statement
The authors deposited the data in Zotero repository available on link: https://www.zotero.org/groups/5918899/exploring_intensification_strategies_of_pasture-based_dairy_systems_in_uruguay_high-productivity_and_inputs_vs._medium-productivity_and_simpler_systems.
Ethics statement
The animal study was approved by Comisión Honoraria de Experimentación Animal (CHEA). The study was conducted in accordance with the local legislation and institutional requirements.
Author contributions
LGZ: Conceptualization, Data curation, Formal Analysis, Investigation, Methodology, Writing – original draft, Writing – review & editing. GO: Conceptualization, Data curation, Formal Analysis, Investigation, Methodology, Project administration, Supervision, Visualization, Writing – review & editing. DC: Data curation, Writing – review & editing. CL: Writing – review & editing. MB: Data curation, Writing – review & editing. PC: Conceptualization, Data curation, Formal Analysis, Funding acquisition, Investigation, Methodology, Project administration, Resources, Supervision, Validation, Visualization, Writing – review & editing.
Funding
The author(s) declare financial support was received for the research and/or publication of this article. This project was funded PGG Wrightson Seeds, COLAVECO, CONAPROLE and Red Tecnológica Sectorial de Lechería (RTS) and the Agencia Nacional de Investigación e Innovación (ANII) funded post-graduate scholarship awarded to L. Gil-Zibil (POS_NAC_2021_1_170222). The funders were not involved in the study design, collection, analysis, interpretation of data, the writing of this article, or the decision to submit it for publication.
Acknowledgments
The authors gratefully acknowledge the technical assistance of J. Dieste and P. Cracco, and the daily help in the field to the dairy staff and students of Centro Regional Sur. The authors also acknowledge the steering committee members for their contributions and insightful advice throughout this project.
Conflict of interest
The authors declare that the research was conducted in the absence of any commercial or financial relationships that could be construed as a potential conflict of interest.
Generative AI statement
The author(s) declare that no Generative AI was used in the creation of this manuscript.
Any alternative text (alt text) provided alongside figures in this article has been generated by Frontiers with the support of artificial intelligence and reasonable efforts have been made to ensure accuracy, including review by the authors wherever possible. If you identify any issues, please contact us.
Publisher’s note
All claims expressed in this article are solely those of the authors and do not necessarily represent those of their affiliated organizations, or those of the publisher, the editors and the reviewers. Any product that may be evaluated in this article, or claim that may be made by its manufacturer, is not guaranteed or endorsed by the publisher.
References
Aarons S. R., Gourley C. J. P., and Hannah M. C. (2017). Measuring spatial and temporal variation in lactating dairy cow placement on diverse grazing system farms. Agriculture. Ecosyst. Environment. 248, 175–189. doi: 10.1016/j.agee.2017.07.010
Aarons S. R., Gourley C. J. P., and Powell J. M. (2023). Estimating excreted nutrients to improve nutrient management for grazing system dairy farms. Animals. 13, 1404. doi: 10.3390/ani13081404
Aguerre M., Méndez M. N., Torterolo S., and Chilibroste P. (2018). Pasture base dairy farm intensification: the role of growth strategy (stocking rate vs. individual milk production) and availability of infrastructure. J. Dairy Science. 101, 255–256. Available online at: https://www.adsa.org/Portals/0/SiteContent/Docs/Meetings/PastMeetings/Annual/2018/ADSA2018_full_abstracts_book.pdf.
Alfaro M., Salazar Sperberg F., Iraira S., Teuber N., Villarroel D., and Ramirez L. (2008). Nitrogen, phosphorus and potassium losses in a grazing system with different stocking rates in a volcanic soil. Chilean J. Agric. Res. 68, 68. doi: 10.4067/S0718-58392008000200004
Allen V., Batello C., Berretta E. J., Hodgson J., Kothmann M. M., Li X., et al .(2011). An international terminology for grazing lands and grazing animals. Grass Forage Sci. 66 2–28. doi: 10.1111/j.1365-2494.2010.00780.x
AOAC International (2023). Official methods of analysis of AOAC international. 22nd ed (Rockville, MD, USA: AOAC International).
Agricultural Research Council (1994). The nutrient requirements of ruminant livestock. CAB International.
Baudracco J., Lopez-Villalobos N., Holmes C., and Macdonald K. (2010). Effects of stocking rate, supplementation, genotype and their interactions on grazing dairy systems: A review. New Z. J. Agric. Res. 53, 109–133. doi: 10.1080/00288231003777665
Baudracco J., Lopez-Villalobos N., Romero L. A., Scandolo D., Maciel M., Comeron E. A., et al. (2011). Effects of stocking rate on pasture production, milk production and reproduction of supplemented crossbred Holstein–Jersey dairy cows grazing lucerne pasture. Anim. Feed Sci. Technol. 168, 131–143. doi: 10.1016/j.anifeedsci.2011.03.017
Carnelos D. A., Portela S. I., Jobbágy E. G., Jackson R. B., Di Bella C. M., Panario D., et al. (2019). First record of bulk atmospheric deposition patterns of major ions in southern South America (261-71: Biogeochemistry.144(3). doi: 10.1007/s10533-019-00584-3
Chilibroste P., Battegazzore G., and Fariña S. (2024). Productivity versus area: The growth dilemma of the Uruguayan dairy sector. Agrociencia Uruguay 28, Article NE1. doi: 10.31285/AGRO.28.1236
Ciganda V. and La Manna A. (2009). Acumulación y distribución de nutrientes en suelos de potreros sacrificio en predios lecheros de Uruguay. Rev. Argent. Producción Anim. 29, 375–376. 32. Available online at: https://ainfo.inia.uy/digital/bitstream/item/14801/1/SP-59-Revista-Argentina-de-Produccion-Animal-v.-29-suppl.-1.pdf.
CONAPROLE Lecheras. Available online at: http://www.eleche.com.uy/files/planilla-lechera-w-2008?es (Accessed August 22, 2024).
DairyNZ (2017). Stand-off pads: Design and management (DairyNZ). Available online at: https://www.dairynz.co.nz/business/off-paddock-infrastructure/stand-off-pad/ (Accessed May 5, 2022).
Dalgaard T., Bienkowski J., Bleeker A., Drouet J., Durand P., Dragosits U., et al. (2012). Farm nitrogen balances in six European agricultural landscapes—A method for farming system assessment, emission hotspot identification, and mitigation measure evaluation. Biogeosciences 9, 5303–5321. doi: 10.5194/bg-9-5303-2012
De Klein C., Monaghan R., Alfaro M., Gourley C., Oenema O., and Powell M. (2017). Nitrogen performance indicators for dairy production systems. Soil Res. 55, 479–488. doi: 10.1071/SR16349
De Klein C., Monaghan R., Ledgard S., and Shepherd M. (2010). A system’s perspective on the effectiveness of measures to mitigate the environmental impacts of nitrogen losses from pastoral dairy farming. Proc. Australas. Dairy Sci. Symposium 4, 14–28.
Delaby L., Finn J. A., Grange G., and Horan B. (2020). Pasture-based dairy systems in temperate lowlands: challenges and opportunities for the future. Frontiers in Sustainable Food Systems. 4. doi: 10.3389/fsufs.2020.543587
De Vries M. (1995). Estimating forage intake and quality in grazing cattle: A reconsideration of the hand-plucking method. J. Range Manage. 48, 370–375. doi: 10.2307/4002491
Dijkstra J., Oenema O., van Groenigen J. W., Spek J. W., van Vuuren A. M., and Bannink A. (2013). Diet effects on urine composition of cattle and N2O emissions. Animal 7(Supplement 2), 292–302. doi: 10.1017/S1751731113000578
Dirección de Estadística Agropecuaria (DIEA) (2023). Anuario estadístico agropecuario 2023. Available online at: https://www.gub.uy/ministerio-ganaderia-agricultura-pesca/comunicacion/publicaciones/anuario-estadistico-agropecuario-2023 (Accessed March 13, 2024).
Edmonson A., Lean I., Weaver L., Farver T., and Webster G. (1989). A body condition scoring chart for Holstein dairy cows. J. Dairy Science. 72, 68–78. doi: 10.3168/jds.S0022-0302(89)79081-0
EU Nitrogen Expert Panel (2015). Nitrogen use efficiency (NUE) an indicator for the utilization of nitrogen in agriculture and foodsystems (Wageningen: Wageningen University), 47.
Fariña S. and Chilibroste P. (2019). Opportunities and challenges for the growth of milk production from pasture: The case of farm systems in Uruguay. Agric. Syst. 176, 102631. doi: 10.1016/j.agsy.2019.05.001
Fariña S., Garcia S., Fulkerson W., and Barchia I. (2011). Pasture-based dairy farm systems increasing milk production through stocking rate or milk yield per cow: Pasture and animal responses. Grass Forage Sci. 66, 316–332. doi: 10.1111/j.1365-2494.2011.00795.x
Gourley C. (2012). Farm-scale nitrogen, phosphorus, potassium and sulphur balances and use efficiencies on Australian dairy farms. Anim. Production Sci. 52, 929–944. doi: 10.1071/AN11337
Gourley C. P., Aarons S. R., Hannah M. C., Awty I. M., Dougherty W. J., and Burkitt L. L. (2015). Soil phosphorus, potassium and sulphur excesses, regularities and heterogeneity in grazing-based dairy farms. Agriculture Ecosyst. Environment. 201, 70–82. doi: 10.1016/j.agee.2014.12.010
Illarze M., Pérez M., and Rodríguez L. (2024). Effect of untreated and stabilized dairy effluent applications on soil fertility and associated health risks. Agrociencia Uruguay 28, e1304. doi: 10.31285/AGRO.28.1304
Instituto Nacional de la Leche (INALE) (2019). Encuesta Lechera 2019: Resultados preliminares. Available online at: https://www.inale.org/estadisticas/encuesta-lechera-2019-resultados-preliminares/ (Accessed July 23, 2024).
Instituto Nacional de la Leche (INALE) (2022). Sistemas de producción de leche de Uruguay. Available online at: https://www.inale.org/informes/sistemas-de-produccion-de-leche-de-Uruguay/ (Accessed March 11, 2024).
Instituto Uruguayo de Meteorología (INUMET) (2023). Informe final: Sequía Final 2020–2023. Available online at: https://www.inumet.gub.uy/sites/default/files/2024-01/Informe%20final_Sequ%C3%ADa%20Final_2020_2023_compressed.pdf (Accessed December 12, 2024).
La Manna A. (2002). Feeding strategies and nutrient management of grazing cattle in Uruguay [PhD] (Oklahoma (OK: Oklahoma State University).
La Manna A. and Durán H. (2008). Balance de nutrientes en tambos, una primera aproximación al proceso de intensificación y su potencial impacto en el ambiente, VI Jornadas Uruguayas de Buiatría, Paysandú, Uruguay, 12–14 June (Paysandú: CMV), 12–17.
Lombardi B., Orden L., Varela P., Garay M., Iocoli G. A., Montenegro A., et al. (2022). Is dairy effluent an alternative for maize crop fertigation in semiarid regions? An approach to agronomic and environmental effects. Animals 12, 2025. doi: 10.3390/ani12162025
Luo J. and Ledgard S. (2021). New Zealand dairy farm systems and key environmental effects. Front. Agric. Sci. Eng. 8, 148–158. doi: 10.15302/J-FASE-2020372
Lussich F. (2020). Variabilidad de la fijación biológica de nitrógeno de leguminosas forrajeras en Uruguay: Posibles causas y consecuencias nutricionales. [master´s tesis] (Montevideo (UY: Universidad de la República).
Macdonald K. A., Penno J. W., Lancaster J. A. S., and Roche J. R. (2008). Effect of stocking rate on pasture production, milk production, and reproduction of dairy cows in pasture-based systems. J. Dairy Sci. 91, 2151–2163. doi: 10.3168/jds.2007-0630
Mary (2018). Horizontal feed mixer MS 85 with scale. Available online at: https://mary.com.uy/producto/mixer-horizontal-m110/.
McDonald P., Edwards R. A., Greenhalgh J. F. D., and Morgan C. A. (1995). Animal nutrition. Prentice Hall.
Mcdowell R., Monaghan R., Dougherty W., Gourley C., Vibart R., and Shepherd M. (2017). Balancing water-quality threats from nutrients and production in Australian and New Zealand dairy farms under low profit margins. Animal Production Science. 57, 1413–1423. doi: 10.1071/AN16646
Méndez M. N., Grille L., Mendina G. R., Robinson P. H., Adrien M. d. L., Meikle A., et al. (2023). Performance of autumn and spring calving Holstein dairy cows with different levels of environmental exposure and feeding strategies. Animals 13, 1211. doi: 10.3390/ani13071211
Menegazzi G., Mendina G. R., Grille L., Méndez M. N., Pons V., Pedemonte A., et al. (2025). Performance of autumn- and spring-calving Holstein dairy cows confined indoors or managed with pasture and supplementation under various housing conditions. J. Dairy Sci. 108, 7179–7201. doi: 10.3168/jds.2024-26084
Ministerio de Ambiente (2020). Manual para la gestión ambiental de tambos (Ministerio de Ambiente). Available online at: https://www.gub.uy/ministerio-ambiente/comunicacion/publicaciones/manual-para-gestion-ambiental-tambos (Accessed April 20, 2024).
Öborn I., Edwards A. C., Witter E., Oenema O., Ivarsson K., Withers P. J. A., et al. (2003). Element balances as a tool for sustainable nutrient management: A critical appraisal of their merits and limitations within an agronomic and environmental context. European Journal of Agronomy 20 (1–2), 211–225. doi: 10.1016/S1161-0301(03)00080-7
OECD/FAO (2024). OECD-FAO agricultural outlook 2024-2033 (Paris: OECD Publishing). Available online at: https://www.oecd.org/es/publications/2024/07/oecd-fao-agricultural-outlook-2024-2033_e173f332.html (Accessed Mar 18, 2025).
Oenema O., Kros H., and De Vries W. (2003). Approaches and uncertainties in nutrient budgets: Implications for nutrient management and environmental policies. Eur. J. Agron. 20, 3–16. doi: 10.1016/S1161-0301(03)00067-4
Oenema J. and Oenema O. (2021). Intensification of grassland-based dairy production and its impacts on land, nitrogen and phosphorus use efficiencies. Front. Agric. Sci. Eng. 8, 130. doi: 10.15302/J-FASE-2020376
Oenema J. and Oenema O. (2022). Unraveling feed and nutrient use efficiencies in grassland-based dairy farms. Front. Sustain. Food Syst. 6. doi: 10.3389/fsufs.2022.846561
Ortega G., Berberian N., and Chilibroste P. (2024). The effects of stocking rate, residual sward height, and forage supplementation on forage production, feeding strategies, and productivity of milking dairy cows. Front. Anim. Sci. 5. doi: 10.3389/fanim.2024.1319150
Ortega G., Chilibroste P., Garrido J. M., Waller A., Fariña S. R., and Lattanzi F. A. (2023). Monitoring herbage mass and pasture growth rate of large grazing areas: A comparison of the correspondence, cost and reliability of indirect methods. J. Agric. Sci. 161, 502–511. doi: 10.1017/S0021859623000333
Patton D., Pierce K. M., and Horan B. (2016). Effect of stocking rate on milk and pasture productivity and supplementary feed use for spring calving pasture fed dairy systems. J. Dairy Sci. 99, 5904–5915. doi: 10.3168/jds.2015-10305
Pearce A. and Maguire R. (2020). The state of phosphorus balance on 58 Virginia dairy farms. J. Environ. Qual. 49, 324–334. doi: 10.1002/jeq2.20054
Powell J. M., Gourley C. J. P., Rotz C. A., and Weaver D. M. (2010). Nitrogen use efficiency: A potential performance indicator and policy tool for dairy farms. Environ. Sci. Policy 13, 217–228. doi: 10.1016/j.envsci.2010.03.007
Quemada M., Lassaletta L., Jensen L. S., Godinot O., Brentrup F., Buckley C., et al. (2020). Exploring nitrogen indicators of farm performance among farm types across several European case studies. Agric. Syst. 177, 102689. doi: 10.1016/j.agsy.2019.102689
Robertson J. B. and Van Soest P. J. (1981). The detergent system of analysis. James W. P. T. and Theander O. (eds.), The analysis of dietary fiber in food (123–158). Marcel Dekker.
Ros M. B. H., Godber O. F., Olivo A. J., Reed K. F., and Ketterings Q. M. (2023). Key nitrogen and phosphorus performance indicators derived from farm-gate mass balances on dairies. J. Dairy Sci. 106, 3268–3286. doi: 10.3168/jds.2022-22297
Stirling S., Delaby L., Mendoza A., and Fariña S. (2021). Intensification strategies for temperate hot-summer grazing dairy systems in South America: Effects of feeding strategy and cow genotype. J. Dairy Sci. 104, 12647–12663. doi: 10.3168/jds.2021-20507
Stirling S., Lattanzi F. A., Fariña S., and Vibart R. (2024b). Nitrogen loss partitioning and emissions in intensive subtropical hybrid dairy systems. Nutrient Cycling Agroecosystems. 129, 73–91. doi: 10.1007/s10705-024-10359-4
Stirling S., Lussich F., Ortega G., Manna A., Pedemonte A., Artagaveytia J., et al. (2024a). Balancing nitrogen at the farm gate: Economic-environmental sustainability trade-off in pastoral dairy systems of Uruguay. Agrociencia Uruguay 28, 1243. doi: 10.31285/AGRO.28.1243
Stott K. J. and Gourley C. J. P. (2016). Intensification, nitrogen use and recovery in grazing-based dairy systems. Agric. Syst. 144, 101–112. doi: 10.1016/j.agsy.2016.01.003
Sulieman S., Ha C. V., Schulze J., and Tran L. S. P. (2013). Growth and nodulation of symbiotic Medicago truncatula at different levels of phosphorus availability. J. Exp. Bot. 64, 2701–2712. doi: 10.1093/jxb/ert122
Treacy M., Humphreys J., Namara K., and Browne R. (2008). Farm-gate nitrogen balances on intensive dairy farms in the south west of Ireland. Irish J. Agric. Food Res. 47, 105–117. Available online at: http://hdl.handle.net/11019/628.
Tse C., Barkema H. W., DeVries T. J., Rushen J., and Pajor E. A. (2017). Effect of transitioning to automatic milking systems on producers’ perceptions of farm management and cow health in the Canadian dairy industry. J. Dairy Science. 100, 2404–2414. doi: 10.3168/jds.2016-11521
White S. L., Sheffield R. E., Washburn S. P., King L. D., and Green J. J.T. (2001). Spatial and time distribution of dairy cattle excreta in an intensive pasture system. J. Environ. Qual. 30, 2180–2187. doi: 10.2134/jeq2001.2180
Keywords: pasture-based, dairy systems, grazing, milk production, farm-gate nutrient balance
Citation: Gil-Zibil L, Ortega G, Custodio D, Loza C, Briñón MP and Chilibroste P (2025) Exploring intensification strategies of pasture-based dairy systems in Uruguay: high-productivity and inputs versus medium-productivity and simpler systems. Front. Anim. Sci. 6:1685390. doi: 10.3389/fanim.2025.1685390
Received: 13 August 2025; Accepted: 29 October 2025;
Published: 24 November 2025.
Edited by:
Serkan Ates, Oregon State University, United StatesReviewed by:
Long Cheng, The University of Melbourne, AustraliaLobke Steyn, Stellenbosch University, South Africa
Copyright © 2025 Gil-Zibil, Ortega, Custodio, Loza, Briñón and Chilibroste. This is an open-access article distributed under the terms of the Creative Commons Attribution License (CC BY). The use, distribution or reproduction in other forums is permitted, provided the original author(s) and the copyright owner(s) are credited and that the original publication in this journal is cited, in accordance with accepted academic practice. No use, distribution or reproduction is permitted which does not comply with these terms.
*Correspondence: Lucía Gil-Zibil, bHVjaWFnaWxAZmFncm8uZWR1LnV5