 Ross L. Thorn1
 Lauryn E. Coffman1
 Madeline M. Rabalais Bass1Charles R. Long1Ronald D. Randel1
 Thomas H. Welsh Jr.2*
 Anil C. Somenahally1*
- 1Texas A&M AgriLife Research, Texas A&M AgriLife Research and Extension Center, Overton, TX, United States
- 2Department of Animal Science, Texas A&M University, College Station, TX, United States
The interactive responses of cattle genetics and the rumen microbiome (G×M) govern variations in the feed efficiency and methane emissions, which subsequently impact cattle productivity and their environmental footprint. Modulation of the rumen microbiome can be done through dietary supplementation, such as with the antimicrobial ionophore monensin, which offers a pathway to favorably alter metabolic outcomes. However, the limited data on breed-specific microbiome shifts in response to dietary changes restrict the understanding of the impacts of G×M on fermentation and nutrient utilization. The objective of the study was to determine the effect of a monensin-fed diet on the ruminal microbiome and the short-chain fatty acid (SCFA) profile of temperate and tropically adapted cattle breeds. A total of 10 steers each of the Angus, Brahman, and F1 (Angus × Brahman) breed types were fed forage ± a monensin ionophore supplement. Ruminal fluid samples were collected during four 21-day periods (one equilibrium and three treatments). At the conclusion of each period, the SCFAs were analyzed via gas chromatography. The microbiome profiles were analyzed through DNA extraction, quantitative PCR (qPCR) assays, and sequencing to evaluate the G×M interactions. SCFA analysis showed a decrease in the acetate/propionate ratio (p = 0.001) across all breed types under monensin treatment. However, breed type variations were evident, as the total SCFA concentrations were lower only in the Brahman steers that consumed monensin. The qPCR assays indicated significantly lower ruminal methanogen contents (mcrA gene; p < 0.01) and a reduced methanogen/prokaryote ratio (MPR; p < 0.001) in monensin-fed steers compared with the control. A treatment-by-breed interaction was observed for the fungi/prokaryote ratio (FBR; p = 0.003), with only F1 steers on the monensin diet showing a lower FBR than those on the control diet. The permutational analysis of variance (PERMANOVA) and beta diversity analyses demonstrated significant differences in the ruminal microbiome structure between the control and the monensin-treated groups for both prokaryotic and fungal communities. Several amplicon sequence variants (ASVs) within the genera Faecalimonas, Streptococcus, and Prevotella showed variable abundance among breeds in response to monensin treatment, confirming the influence of (G×M) interactions on the microbiome structure. This study established the potential of dietary supplementation with an antimicrobial ionophore (monensin) to modulate the rumen microbiome structure, alter the metabolic profiles, and reduce methanogens while emphasizing the need for breed-specific dietary strategies due to the influence of G×M interactions.
1 Introduction
Ruminant livestock, including beef cattle, are a significant part of the global meat and dairy production. Their production on grazing lands unsuitable for crops presents an avenue for food production on these lands. This offers a potential avenue for land rejuvenation and soil carbon sequestration (Food and Agriculture Organization of the United Nations, 2020). The environmental impacts of livestock production must also be taken into consideration, in particular the methane emissions from cattle, which are an important consideration as the global meat demand continues to grow. Methane (CH4) production from cattle is primarily through the fermentation of substrates by methanogen within the reticulorumen. In 2022, approximately 4,891 kt of methane was emitted from beef cattle in the United States alone (U.S. Environmental Protection Agency (EPA), 2024). Cattle consuming diets primarily consisting of forages can produce more methane as there is a greater proportion of acetate produced by the fermentation of forages compared with grains (National Academies of Sciences, Engineering, and Medicine, 2016). This is of concern as ruminal acetate synthesis creates an excess of 1 mol of H2 per molecule of glucose, which is utilized by methanogens to produce methane (Pereira et al., 2022). Feeding grain-based diets to beef cattle in concentrated animal feeding operations (CAFO) may result in manure management and ammonia runoff issues, which can have deleterious effects on the surrounding environments (Burkholder et al., 2007). Methane production in ruminants also represents a loss of energy as carbon is being exhaled, which could have been otherwise incorporated into usable substrates for the animal. Therefore, there is an opportunity to improve cattle efficiency and local ecosystems by either diet modification or ruminal microbial changes (Soltan and Patra, 2021).
Ruminal microorganisms play an important role in the digestion process of ingested forages, and their diversity can impact the efficiency with which forages are digested. Improving the feed efficiency through microbiome alteration is a promising approach to reducing methane emissions and increasing production efficiency. Recent studies have emphasized the critical role of the rumen microbiome, a complex community of microorganisms, in influencing both the feed efficiency and methane emissions (Shabat et al., 2016). Monensin, which is one of the three ionophores approved for use in cattle diets in the United States, has been used extensively in the United States’s cattle industry. Monensin has the ability to lower the ruminal acetate/propionate (A/P) ratio and change the ruminal short-chain fatty acid (SCFA) concentrations, which have been well documented (National Academies of Sciences, Engineering, and Medicine, 2016). Specifically, monensin is a commonly fed ionophore with the ability to influence the diversity of the ruminal microbiome and improve the feed efficiency in cattle (Duffield et al., 2012). Monensin complexes with cations such as sodium are essential in maintaining the ion gradient of the cellular membrane (Bergen and Bates, 1984). This causes bacteria to expend greater amounts of ATP in order to maintain their cellular ion gradients, and Gram-negative bacteria are usually better able to maintain their ion gradients compared with Gram-positive bacteria. When monensin is fed to cattle, it can selectively inhibit the Gram-positive bacteria in the rumen, which results in the reduced production of acetate and methane, two key by-products of ruminal fermentation (Russell and Strobel, 1989). This shift also promotes the production of propionate, a more energetically favorable SCFA, and can also improve nitrogen utilization in the animal by reducing the protein digestion in the rumen, which would otherwise be fermented to ammonia. These changes contribute to a more efficient feed conversion and can lead to reduced methane emissions, offering a potential tool for mitigating the environmental impact of beef production. As a result, we used monensin as a model dietary supplement to investigate microbiome responses, including the shifts in the community structure and the core taxa. We note that monensin is not approved or available in several European countries, and our study does not advocate its use. The impact of monensin on the rumen metabolome and microbiome may differ; however, data are lacking as many studies considered only European- and British-influenced cattle breeds such as Angus and did not include American-influenced breeds such as Brahman, which may possess distinct microbiomes and are adapted to tropical climate conditions (Della Rosa et al., 2023). Particularly, studies on the reduction of methane using Bos indicus cattle are more limited compared with those on Bos taurus cattle (Della Rosa et al., 2023).
The interactive responses of cattle genetics and the rumen microbiome (G×M) are especially relevant in the context of climate change as tropically adapted cattle have preferred traits to influence animal productivity and longevity (Turner, 1980; Hunter and Siebert, 1985). Thus, the microbiome variability across cattle breeds, specifically between temperate and tropically adapted cattle, presents an important opportunity to study these interactions for potential applications. Research has indicated that G×M interactions play a significant role in determining variations in the feed efficiency and methane emissions between cattle breeds (Roehe et al., 2016; Li et al., 2019). The ruminal microbiomes of British and European and American breeds also appear to possess inherently different microbiome structures, which may lead to differential metabolic responses (Latham et al., 2018). However, it is not clear how the rumen microbial structure and functionality shift in response to diet modifications among the cattle genetic types. The lack of data on breed-specific microbiome responses has further limited our understanding of the potential differential impacts on fermentation processes and nutrient utilization due to G×M. Filling these data gaps will provide insights into the further application of G×M interactions to improve beef production under changing climatic conditions.
This study was conducted with the hypothesis that temperate and tropically adapted breeds establish a variable rumen microbiome composition in response to a monensin-fed diet. In addition, we supposed that these G×M interactions lead to significant changes in the fatty acid metabolic profiles. The main objective was to determine the effect of a monensin-fed diet on the ruminal microbiome and the SCFA profiles of temperate and tropically adapted cattle breeds.
2 Materials and methods
2.1 Cattle feeding trial and collection of rumen samples
All procedures complied with the Guide for the Care and Use of Agricultural Animals in Research and Teaching (McGlone et al., 2010) and were approved by the Texas A&M AgriLife Research Animal Use and Care Committee (animal use protocol no. 2017-038A). This study was conducted at the Texas A&M AgriLife Research and Extension Center at Overton, TX, and used a total of 30 one-year-old castrated male cattle (steers; 264 ± 6 kg body weight) representing three cattle genetic types: Angus (n = 10), Brahman (n = 10), and F1 (Angus × Brahman; n = 10). The cattle were fed Tifton Bermudagrass hay (Cynodon dactylon) ad libitum. Two phases were utilized, in which steers were fed within breed type a diet consisting of Tifton Bermudagrass hay given ad libitum for 21 days (phase 1). Tifton Bermudagrass was chosen as forage-fed cattle tend to produce greater amounts of methane, which should lead to greater proportions of methanogens. Monensin tends to shift ruminal acetate production to propionate production through the reduction of Gram-positive bacteria (Russell and Strobel, 1989). After this period, the steers were then assigned into groups of five within breed type to pens equipped with Calan gates (so that steers ate from separate feed bunks rather than eating from a group feed bunk) and fed at 0800 hours for an additional 21 days. Steers were fed ad libitum Bermudagrass hay along with a 0.55-kg supplement consisting of ground corn, soybean meal, and dried molasses with or without monensin (Rumensin 90; Elanco Animal Health, Greenfield, IN, USA) at a rate of 200 mg·per steer per day. After 21 days, ruminal fluid samples were collected, homogenized, subsampled for biochemical and DNA extraction, and stored at −80°C until analysis. Two additional batches for 21-day time periods were replicated, individually sampled separately for all three replicate cattle for the individual breed × treatment factor, and analyzed as the phase 2 set.
Rumen fluid samples were collected by orogastric intubation (Raun and Burroughs, 1962; McCartor et al., 1979). An orogastric tube was fitted with a suction strainer (19-mm diameter and 1.5-mm mesh) and obtained samples from the dorsal and ventral sacs of the rumen before the animals were fed on the morning of the sample collection. After each usage, the tubes were cleaned with sterile water and wiped with alcohol. The rumen fluid samples (150–200 ml) were stored at −80°C until they were thawed for analytical procedures. A subsample of the rumen before freezing was assessed for pH using a portable pH meter (HACH, Inc., Loveland, CO, USA) to monitor the sample quality and maintain the sample integrity.
2.2 Ruminal short-chain fatty acid analysis
Ruminal SCFAs (acetate, propionate, and butyrate) and branched-chain fatty acids (BCFAs; isobutyrate, isovalerate, and valerate) were measured using gas chromatography–mass spectrometry (GC-MS) following the standard protocol of the Integrated Metabolomics Analysis Core at Texas A&M University. In brief, the samples were mixed using a Precellys homogenizer and then centrifuged for 10 min at 15,000 × g at 4°C. Supernatants were collected and mixed with an equal volume of ethyl acetate, vortexed for 10 s to emulsify, incubated on ice for 5 min, and then centrifuged for 1 min at 15,000 × g at 4°C. From each sample, 150 μl of the supernatant was transferred into sample vials and maintained at room temperature on an autosampler before injection. A 1-μl volume of the extracted sample was injected at a split ratio of 20:1 into a gas chromatography triple quadrupole mass spectrometer (TSQ EVO 8000; Thermo Scientific, Waltham, MA, USA) for chromatographic separation and quantification. The ionization was carried out in the electron impact (EI) mode at 70 eV. Separation was achieved using a ZB WAX Plus capillary column (30 m × 0.25 mm, 0.25-μm film thickness; Phenomenex, Torrance, CA, USA). The mass spectroscopy (MS) data and the retention times were acquired in full scan mode from mass-to-charge ratios (m/z) of 40–500 for the individual target compounds. The target compounds were quantified in the selected ion monitoring (SIM) mode using the following product ions in positive ion mode (compound: product ions in m/z): acetic acid: 43, 45, and 60; propionic acid: 43, 73, and 74; isobutyric acid: 41, 43, and 73; butyric acid: 42, 60, and 73; isovaleric acid: 43, 60, and 87; valeric acid: 41, 60, and 73; and d7-butyric acid: 45, 63, and 77. The injector, the MS transfer line, and the ion source were maintained at 230°C, 240°C, and 240°C, respectively. The flow rate of the helium carrier gas was kept at 1 ml/min. The internal standard d7-butyric acid, an isotopically labeled butyric acid, was spiked into each sample and was used to normalize the extraction efficiency. The samples were extracted in ethyl acetate, and the standard curve was prepared in ethyl acetate. The absolute levels of SCFAs (in micromolars) were calculated after normalization to the internal standard and dilution factor. Sample acquisition and analysis were performed with TraceFinder 3.3 (Thermo Scientific, Waltham, MA, USA).
The ruminal SCFA data were analyzed using the GLIMMIX Procedure of the Statistical Analysis System (SAS, version 9.4). SCFA and the cattle breed type were used as fixed effects, with phase being used as the random effect. Significant effects for treatments were declared when p-values were ≤0.05.
2.3 DNA extraction and sequencing
A rumen subsample of 20 ml, stored at −80°C, was used for DNA extraction. After thawing, the rumen samples were centrifuged at 4,700 × g at 4°C for 10 min. The resultant pellet, without supernatant, was dissolved in rumen extraction buffer and subjected to microbial cell separation following the procedure described by Jami et al. (2013). The microbial cell pellet obtained was then used for DNA extraction using the Fecal DNA Extraction Kit following the manufacturer’s protocol (Qiagen Inc., Hilden, Germany). The DNA concentration and quality were determined using a SimpliNano spectrophotometer (GE Healthcare Life Sciences, Inc., Chicago, IL, USA).
2.4 Quantitative PCR
A subsample of rumen DNA was used to estimate the gene abundance of the prokaryotes (16S rRNA gene) and fungi (ITS gene) (Fierer et al., 2005; Git et al., 2010; Harter et al., 2013). Methanogens were estimated by targeting the functional gene mcrA (encoding the alpha subunit of the methyl coenzyme M reductase) (Steinberg and Regan, 2008; Ma et al., 2012; Kim et al., 2014). Gene marker abundance was estimated using SsoAdvanced Universal SYBR Green Supermix (Bio-Rad Laboratories, Hercules, CA, USA) and the gene-specific primers and PCR conditions provided in Supplementary Table S1. Each quantitative PCR (qPCR) run was set up to include appropriate standard curves, quality controls [positive and negative culture controls, standard checks, spikes, and no template controls (NTCs)], and the assay results were evaluated according to the MIQE guidelines (Bustin et al., 2009). The qPCR analysis was performed using a Rotogene (Qiagen Inc.). Sample preparation for the qPCR reaction plates was performed using a Corbett CAS1200 auto pipetting robot (Qiagen Inc.). Standards were made via serial dilution of a gBock synthetic DNA sequence manufactured by ITD DNA Technologies, Inc. (Coralville, IA, USA). Spikes were composed of equal parts sample and middle standard gBock synthetic DNA. All standards, samples, NTC, spikes, positive controls, and negative controls were run as triplicate. Melt curve analysis was performed by running a denaturing temperature of 55–98°C, increased by 1° for every 5 s/cycle melt. Data were accepted only after passing quality checks for reaction efficiency, standard curve r2, gene copy numbers in the controls, NTC, spikes, and the positive and negative controls. The gene copy numbers in the reaction volume were subsequently converted to rumen mass basis (per gram dry). Ruminal qPCR data were analyzed using the GLIMMIX procedure of SAS. Gene copy number and cattle breed type were used as fixed effects, while phase was used as the random effect. Significant effects for treatments were declared when p-values were ≤0.05.
2.5 Microbiome sequencing, assembly, and analysis
A subsample of DNA was submitted to an external service lab for sequencing (RTL, Lubbock, TX, USA). Sequencing for bacteria, Archaea, and fungi was performed separately. For Archaea (Arch 16S), theV4–V6 region was targeted using the forward primer Arch519wF (5'-CAGCMGCCGCGGTAA) and the reverse primer Arch1017R (5'-GGCCATGCACCWCCTCTC). The bacterial primers were 357wF (5'-CCTACGGGNGGCWGCAG) and 785R (5'-GACTACHVGGGTATCTAATCC), targeting the V3–V4 region of the 16S rRNA gene. The primers ITS1F (5'-CTTGGTCATTTAGAGGAAGTAA) and ITS2aR (5'-GCTGCGTTCTTCATCGATGC) were used for fungal sequencing to target the ITS1 gene region.
The microbiome was analyzed with QIIME 2 2024.5 (Bolyen et al., 2019). The raw sequence files were quality filtered using the plug-in q2-demux. Subsequently, DADA2 (Callahan et al., 2016) was used to denoise the sequences using q2-dada2. Mafft (Katoh et al., 2002), via q2-phylogeny, aligned all amplicon sequence variants (ASVs) in combination with fasttree2 (Price et al., 2010), via q2-phylogeny, to build a phylogeny. The ASVs were assigned taxonomy with the q2-feature-classifier classify-sklearn naive Bayes (Bokulich et al., 2018) trained on the V3–V4 region with the Greengenes 13.8 database (McDonald et al., 2012) for the prokaryote samples and the UNITE v10.0 (Abarenkov et al., 2024) dynamic for the fungal samples as reference sequences. The Greengenes 13.6 database was utilized due to memory limitation during computation. The chosen database has its limitations, such as not being updated since 2013; however, its taxonomic identification still aligns well with that of the NCBI database (https://citation-needed.springer.com/v2/references/10.1186/s12864-017-3501-4?format=refman&flavour=citation). The files generated in QIIME were then transferred into R for further analysis with the help of the qiime2R package (Bisanz, 2018) to create phyloseq objects.
The phyloseq package (McMurdie and Holmes, 2013) was used to determine and graph the alpha and beta diversity implementing the Shannon index and the Bray–Curtis diversity, respectively. The normality and the homogeneity of variance assumptions were tested utilizing QQ plots from the ggpubr package (Kassambara, 2023a) and the Shapiro and Levene’s tests, both from the rstatix package (Kassambara, 2023b). Analysis of variance (ANOVA) was used to statistically evaluate the alpha diversity with the anova_test function from the rstatix package. Permutational analysis of variance (PERMANOVA) was used for statistical evaluation of the beta diversity with the adonis2 function from the vegan package (Dixon, 2003). Canonical correlation analysis (CCA) was also performed using the vegan package. Differential abundance was performed through linear discriminant analysis effect size (LEfSe) by applying the microbiome Maker package (Cao et al., 2022). A p-value cutoff of 0.05 was implemented for both the Wilcoxon signed-rank and Kruskal–Wallis tests.
3 Results
3.1 Ruminal short-chain fatty acid concentrations
The ruminal acetate concentrations were not different between treatments (p = 0.4853). However, a treatment-by-breed type interaction was observed (p = 0.039) (Figure 1), where Brahman consuming the monensin diet had a decreased concentration of ruminal acetate compared with Brahman steers consuming the control diet. The ruminal propionate concentrations were also not different between treatments (p = 0.241). However, a treatment-by-breed interaction (p = 0.042) (Figure 2) was observed. Angus steers consuming monensin had greater ruminal propionate concentrations compared with the Angus steers consuming the control diet. No differences were observed for the ruminal butyrate concentrations (p = 0.834) (Supplementary Figure S1). No differences in the main effects of treatment on the total ruminal SCFA concentration were observed (p = 0.827) (Figure 3). However, Brahman steers consuming the monensin diet had a decreased total ruminal SCFA concentration compared with the Brahman steers consuming the control diet. Lastly, steers consuming the monensin diet had a decreased ruminal A/P ratio compared with the steers consuming the control diet (p = 0.001) (Figure 4).
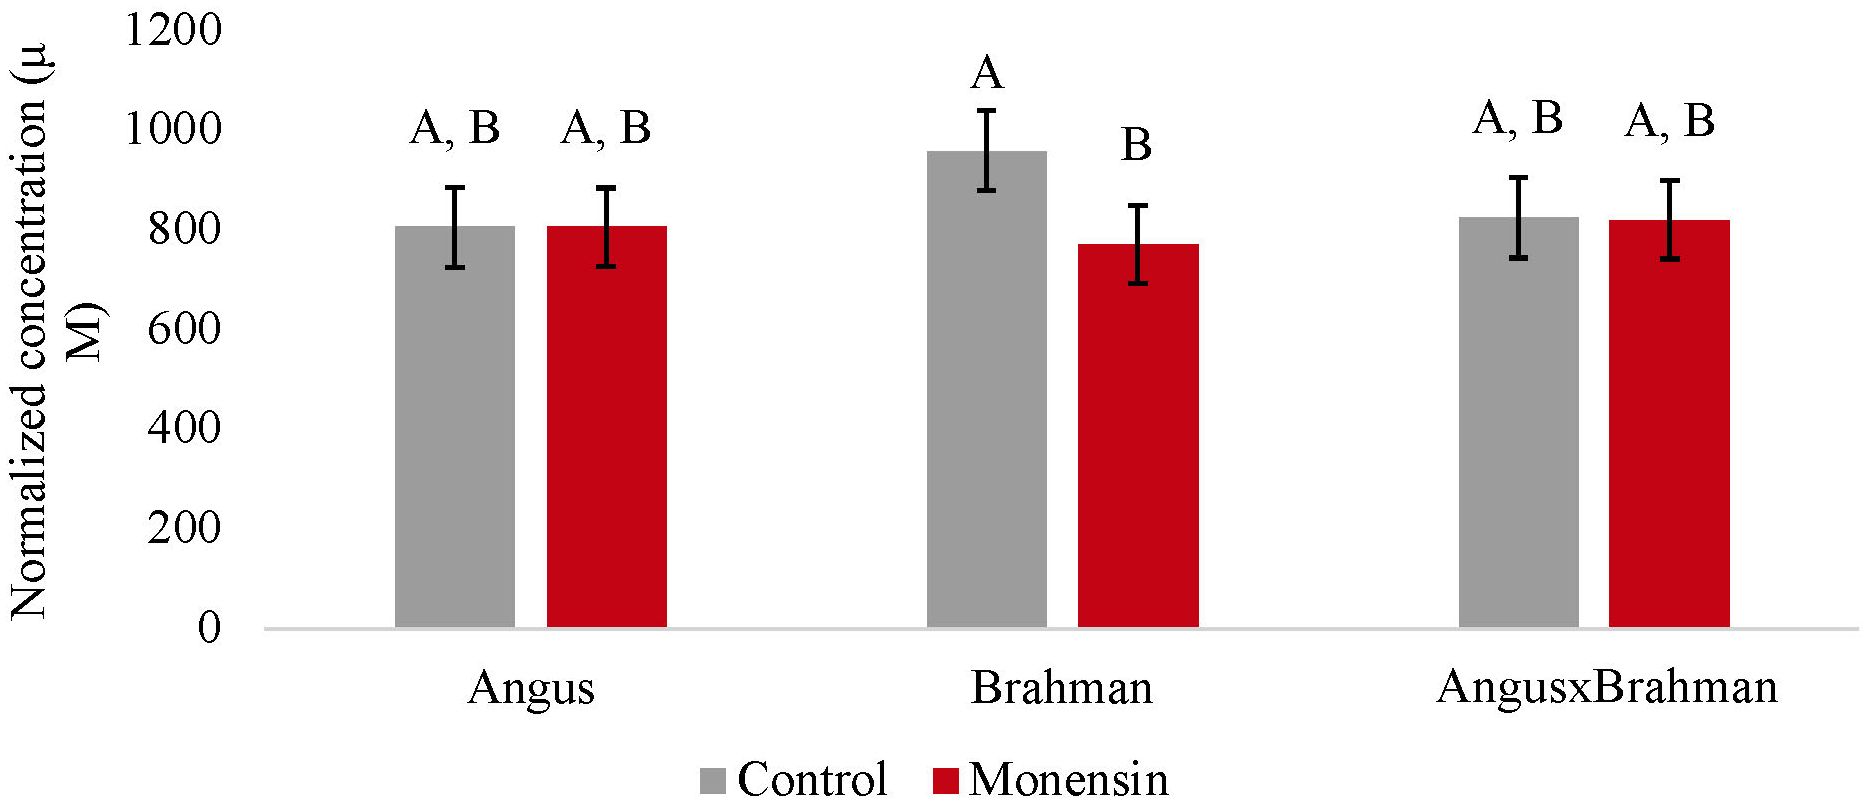
Figure 1. Ruminal acetate concentrations. Values are least-square means (LSM) ± standard error of the means (SEM). Main effects of treatments on ruminal acetate concentrations were not different (P=0.4853). A treatment-by-breed interaction was observed (P=0.039). Letters A and B indicate significance between treatment and breed interaction (P<0.05).
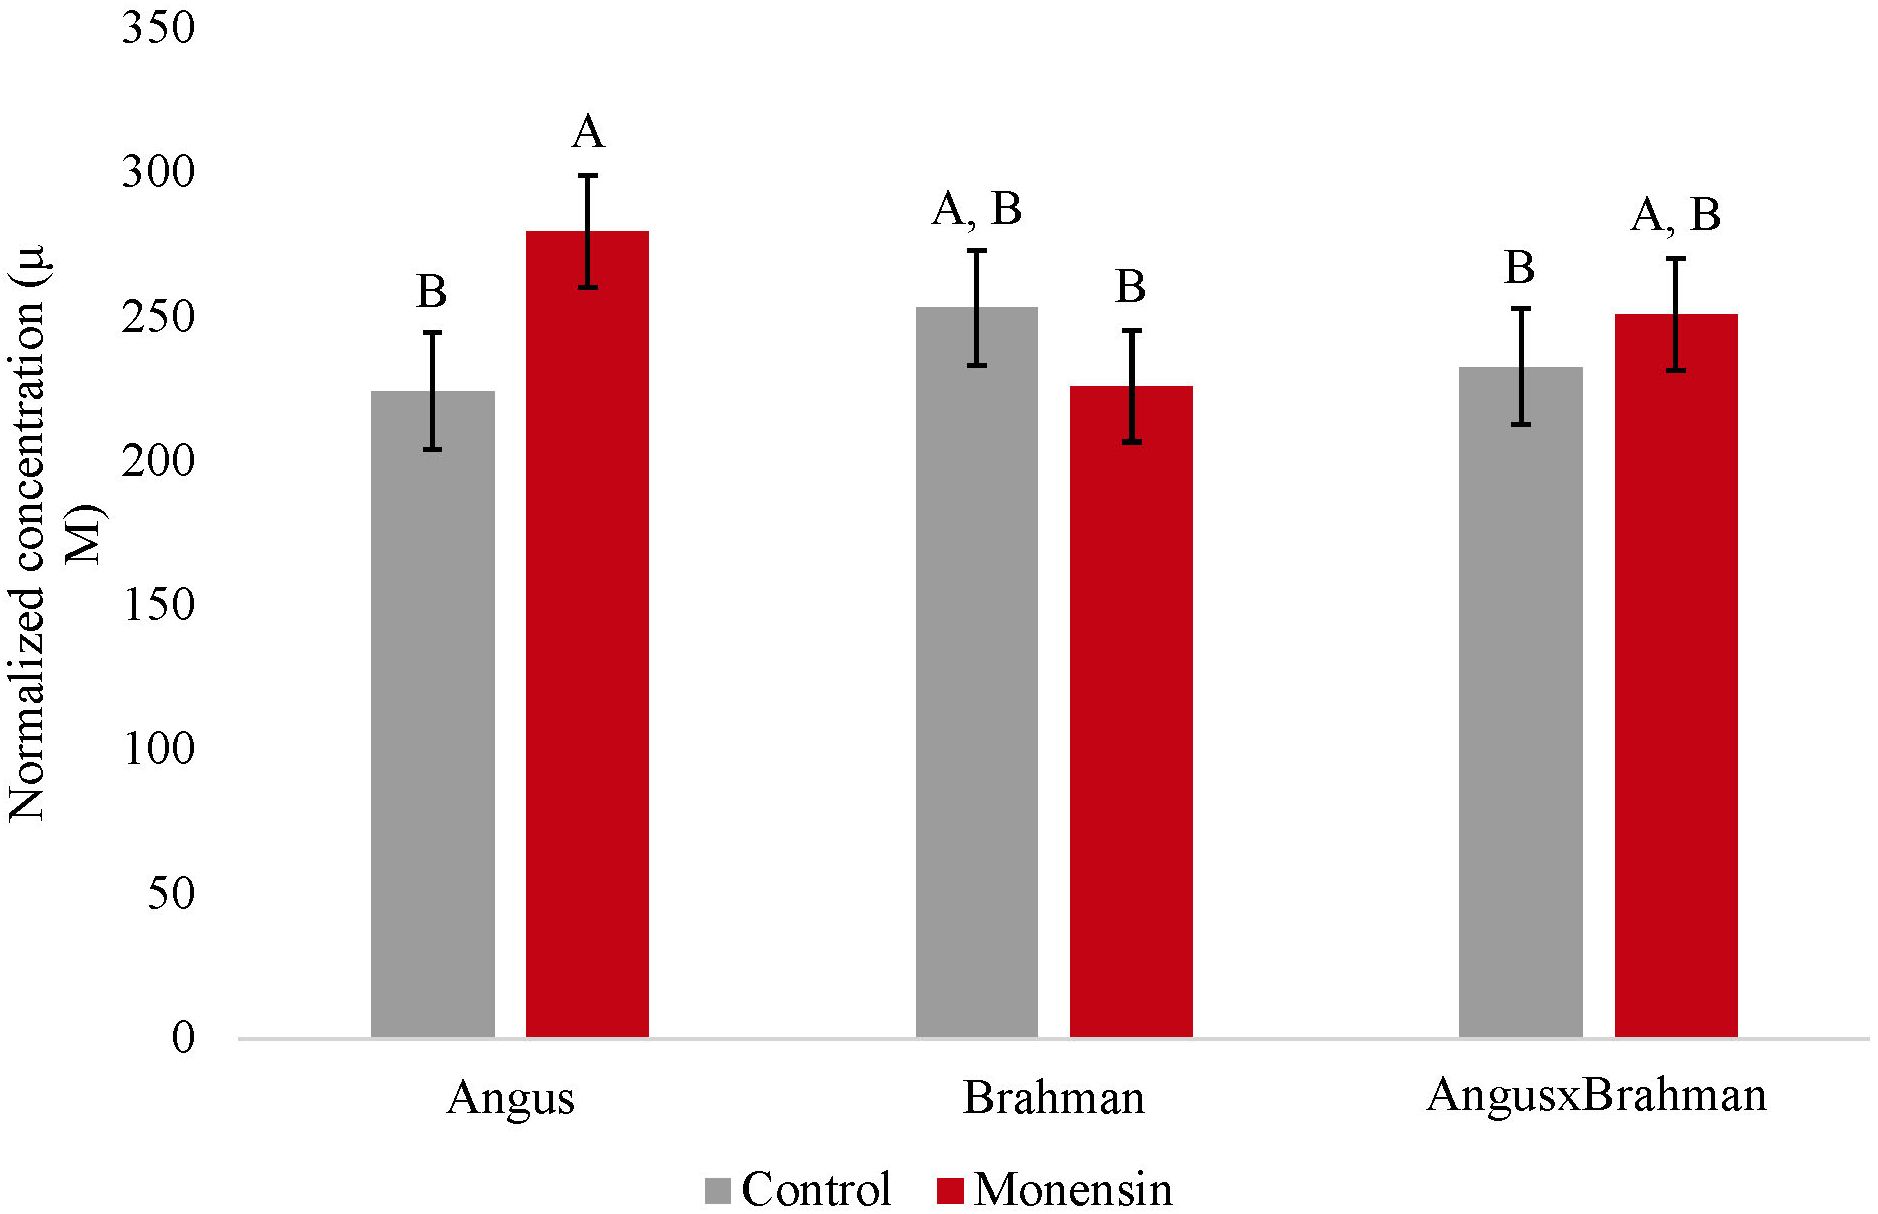
Figure 2. Ruminal propionate concentration. Values are least-square means (LSM) ± standard error of the means (SEM). Main effects of treatments on ruminal propionate concentrations were not different (P=0.241). A treatment- by-breed interaction was observed (P=0.042). Letters A and B indicate significance between treatment and breed interaction (P<0.05).
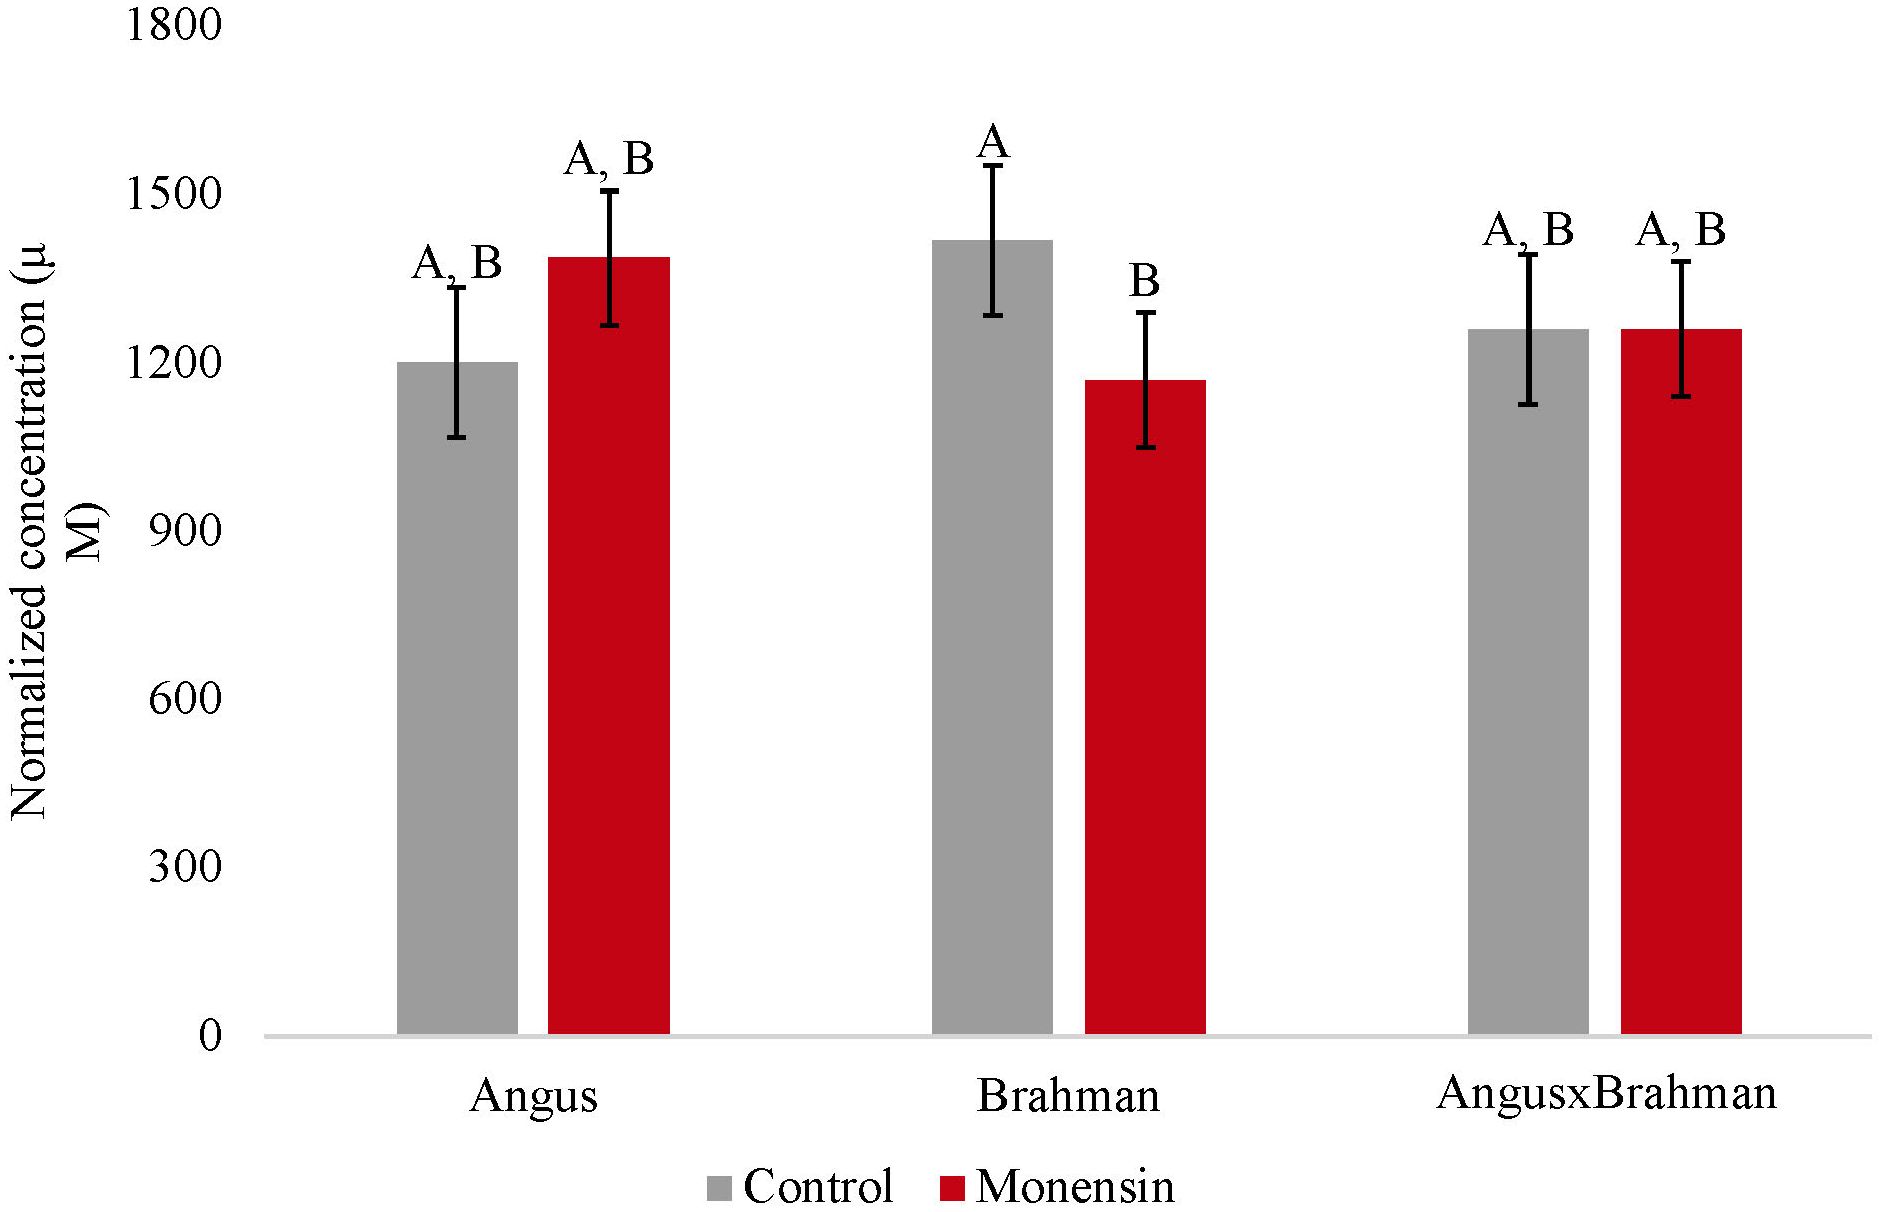
Figure 3. Total ruminal short chain fatty acid concentration. Values are least-square means (LSM) ± standard error of the means (SEM). Main effects of treatments on total ruminal short chain fatty acid concentrations were not different (P=0.827). A treatment-by-breed interaction was observed (P=0.033). Letters A and B indicate significance between treatment and breed interaction (P<0.05).
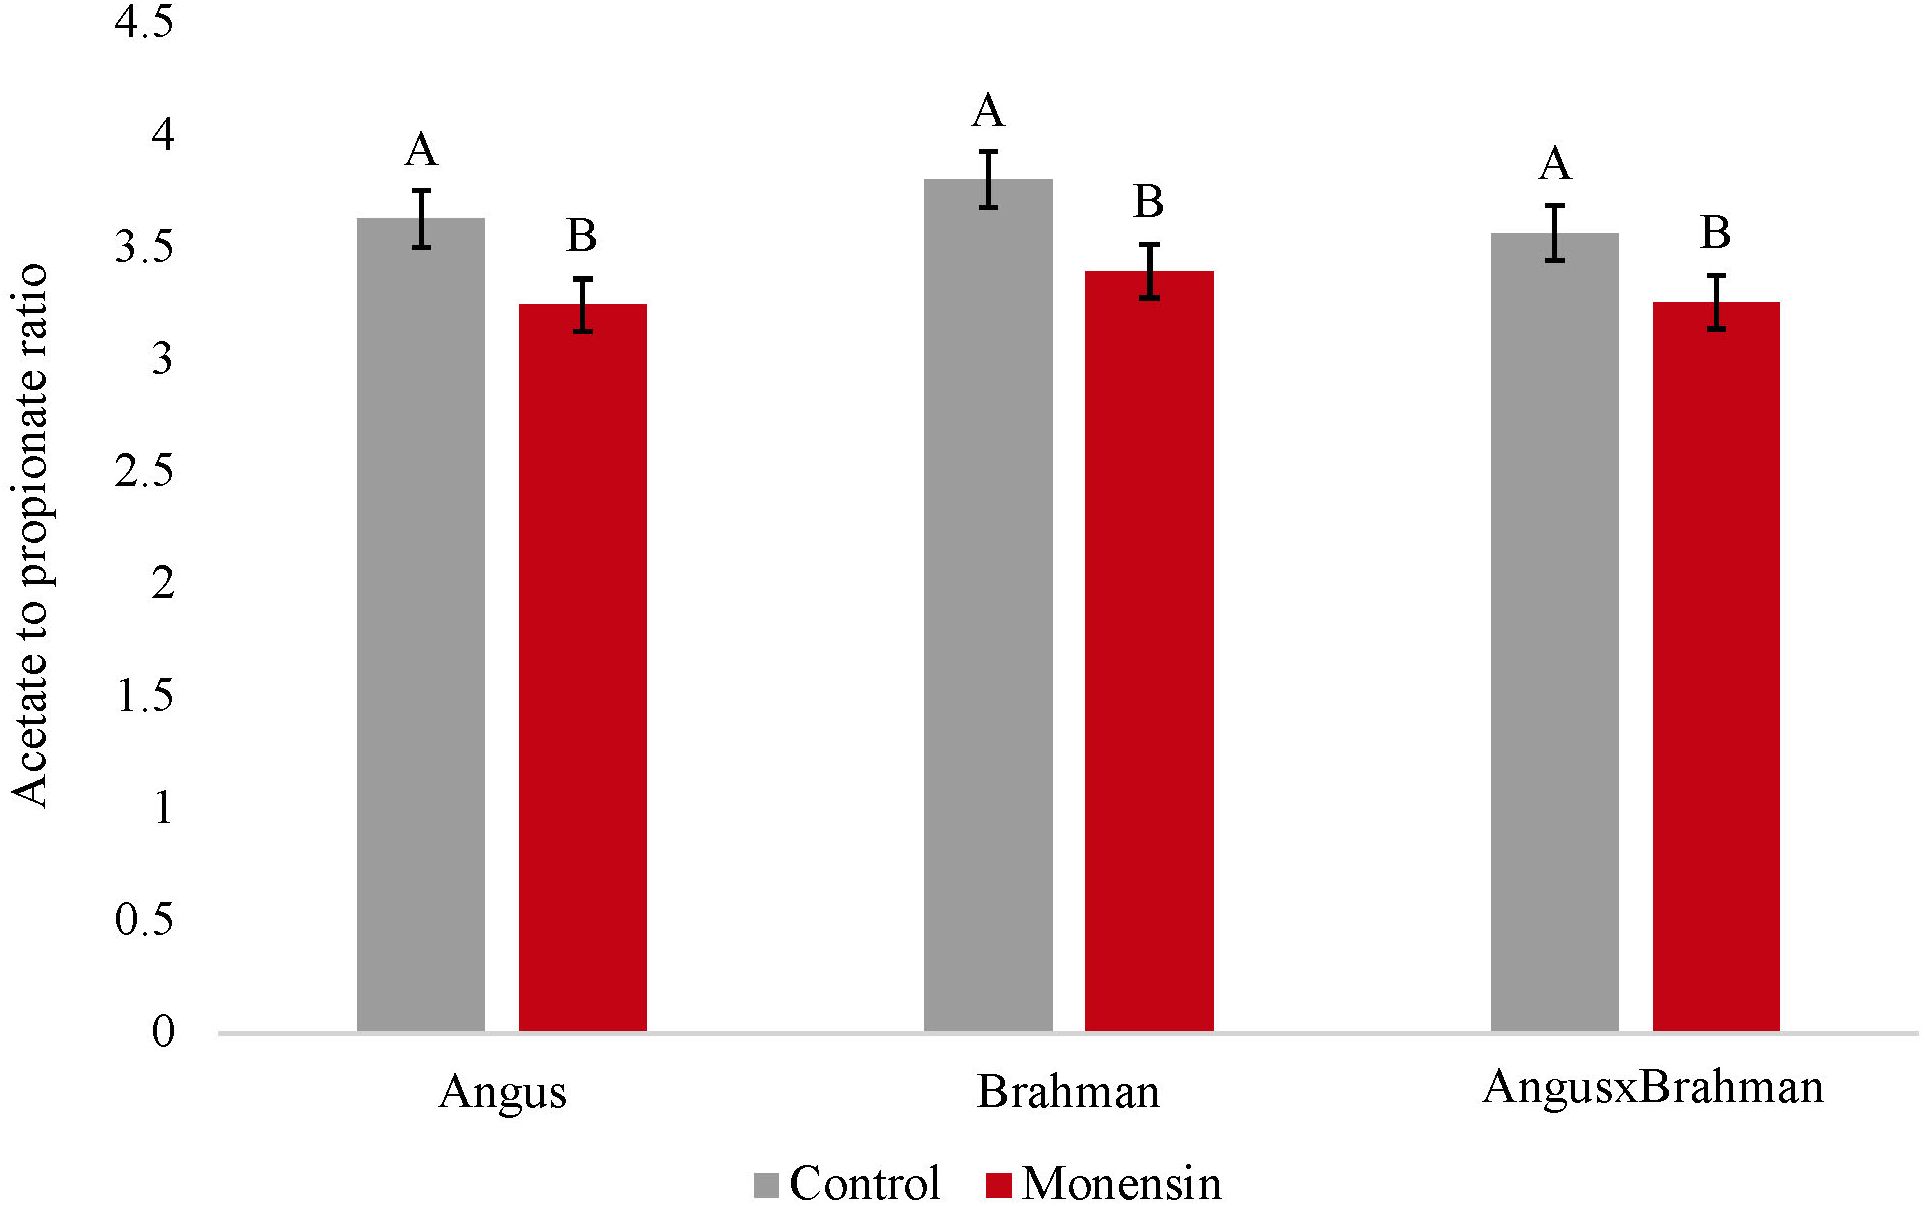
Figure 4. Ruminal acetate to propionate ratio. Values are least-square means (LSM) ± standard error of the means (SEM). Main effects of treatments on ruminal acetate:propionate ratio was different (P=0.001). A treatment-by-breed interaction was not observed (P=0.912). Letters A and B indicate significance between treatments (P<0.05).
3.2 Ruminal prokaryotic, fungal, and methanogen contents
The ruminal prokaryotic abundance (based on the qPCR assays for the 16S rRNA gene) was not significantly different between treatments (p = 0.720) (Supplementary Figure S2). The ruminal fungal abundance (ITS gene) was also not significantly different between treatments (p = 0.554) (Supplementary Figure S3). The ruminal methanogen abundance (mcrA gene) significantly differed between treatments (p < 0.01) (Figure 5), with steers consuming monensin having lower copy numbers compared with steers consuming the control diet. The main effect of treatment on the ruminal fungi/prokaryote ratio (FBR) was not different (p = 0.147) (Figure 6), although a treatment-by-breed interaction was observed (p = 0.003), where F1 steers consuming monensin had a lower ratio compared with F1 steers consuming the control diet. Lastly, the ruminal methanogen/prokaryote ratio (MPR) was affected by monensin (p < 0.001) (Figure 7), with steers consuming monensin having a lower MPR compared with steers consuming the control diet.
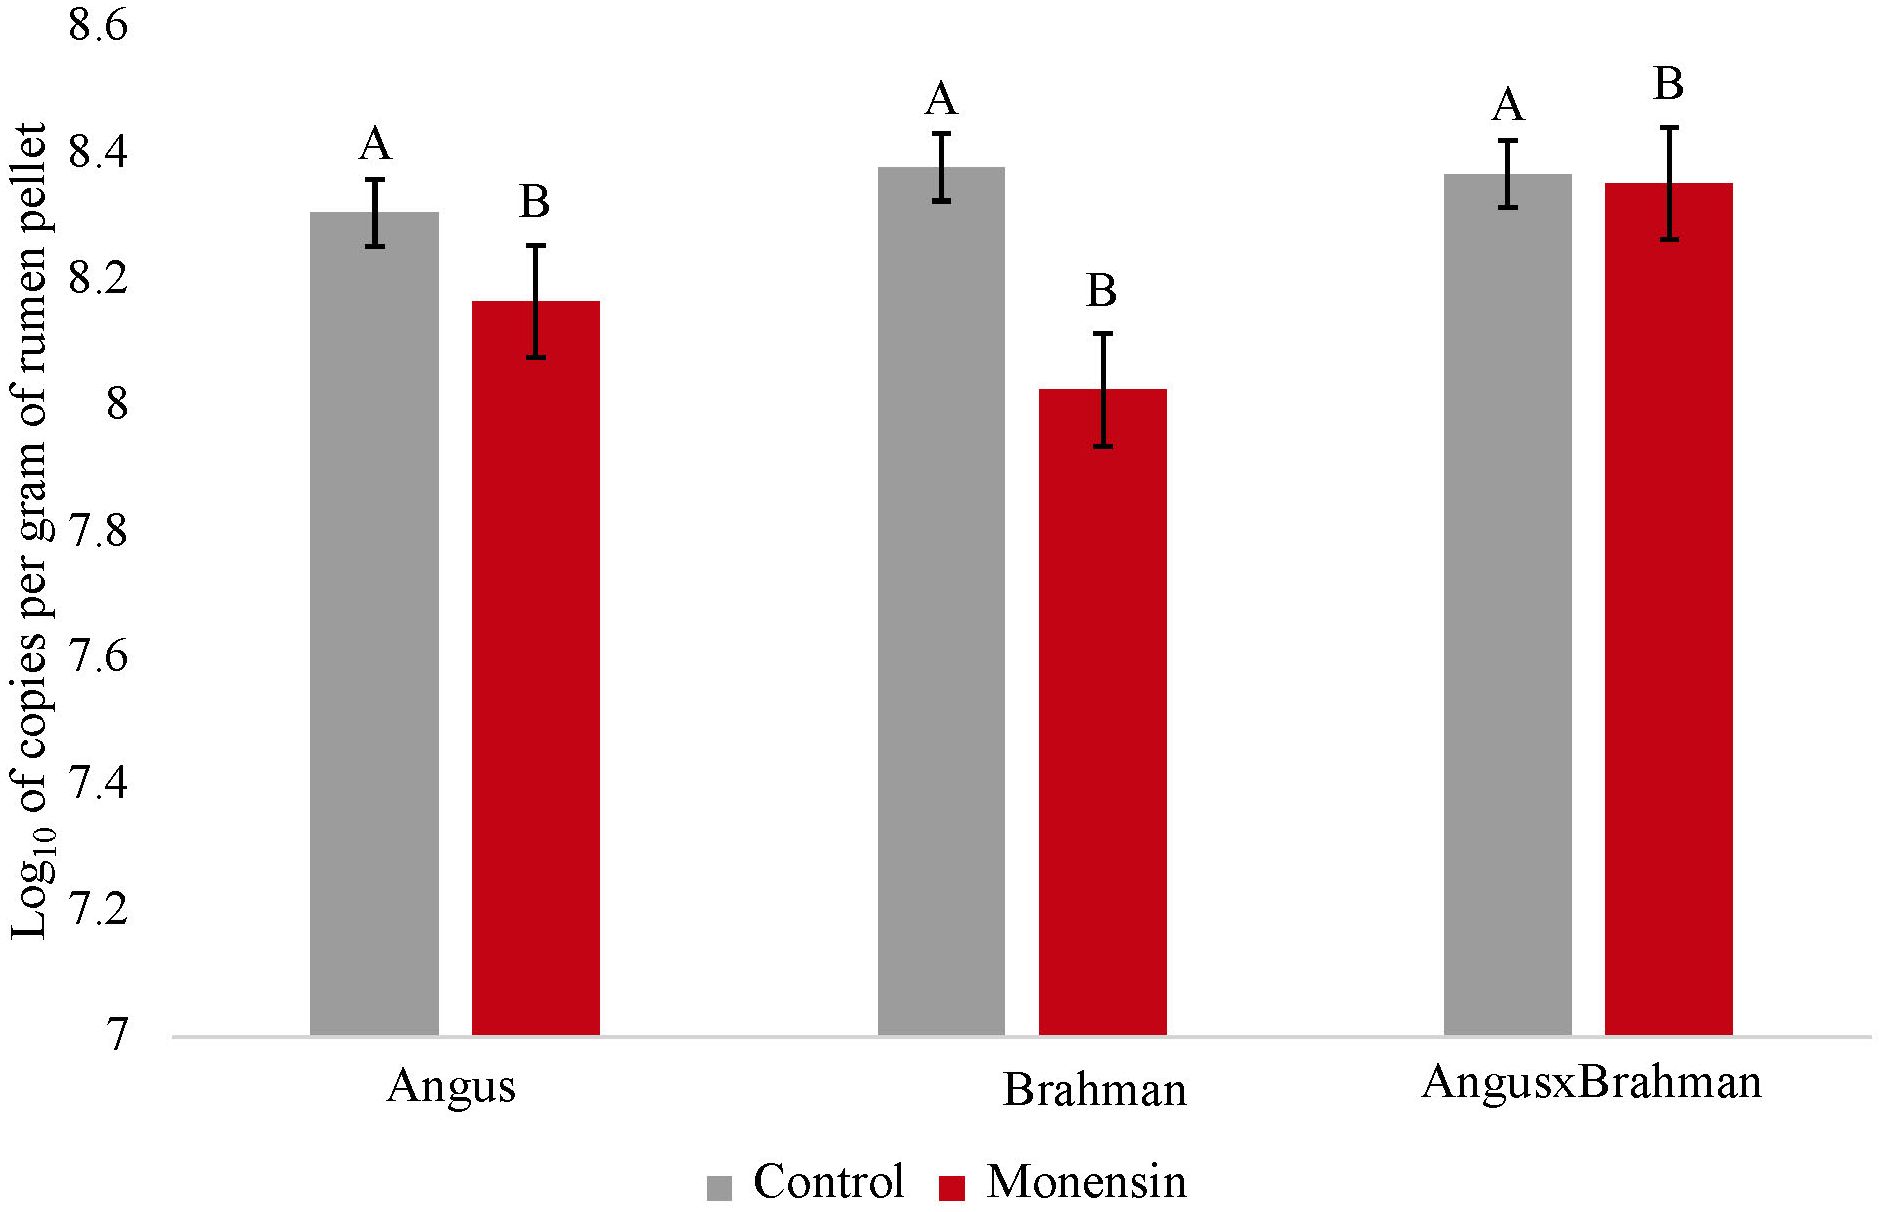
Figure 5. Ruminal methanogen abundance. Values are least-square means (LSM) ± standard error of the means (SEM). Main effects of treatments on ruminal methanogen content were different (P=0.005). No treatment-by-breed interaction was observed (P=0.069). Letters A, and B indicates significance (P<0.05). Letters A and B indicate significance between treatments (P<0.05).
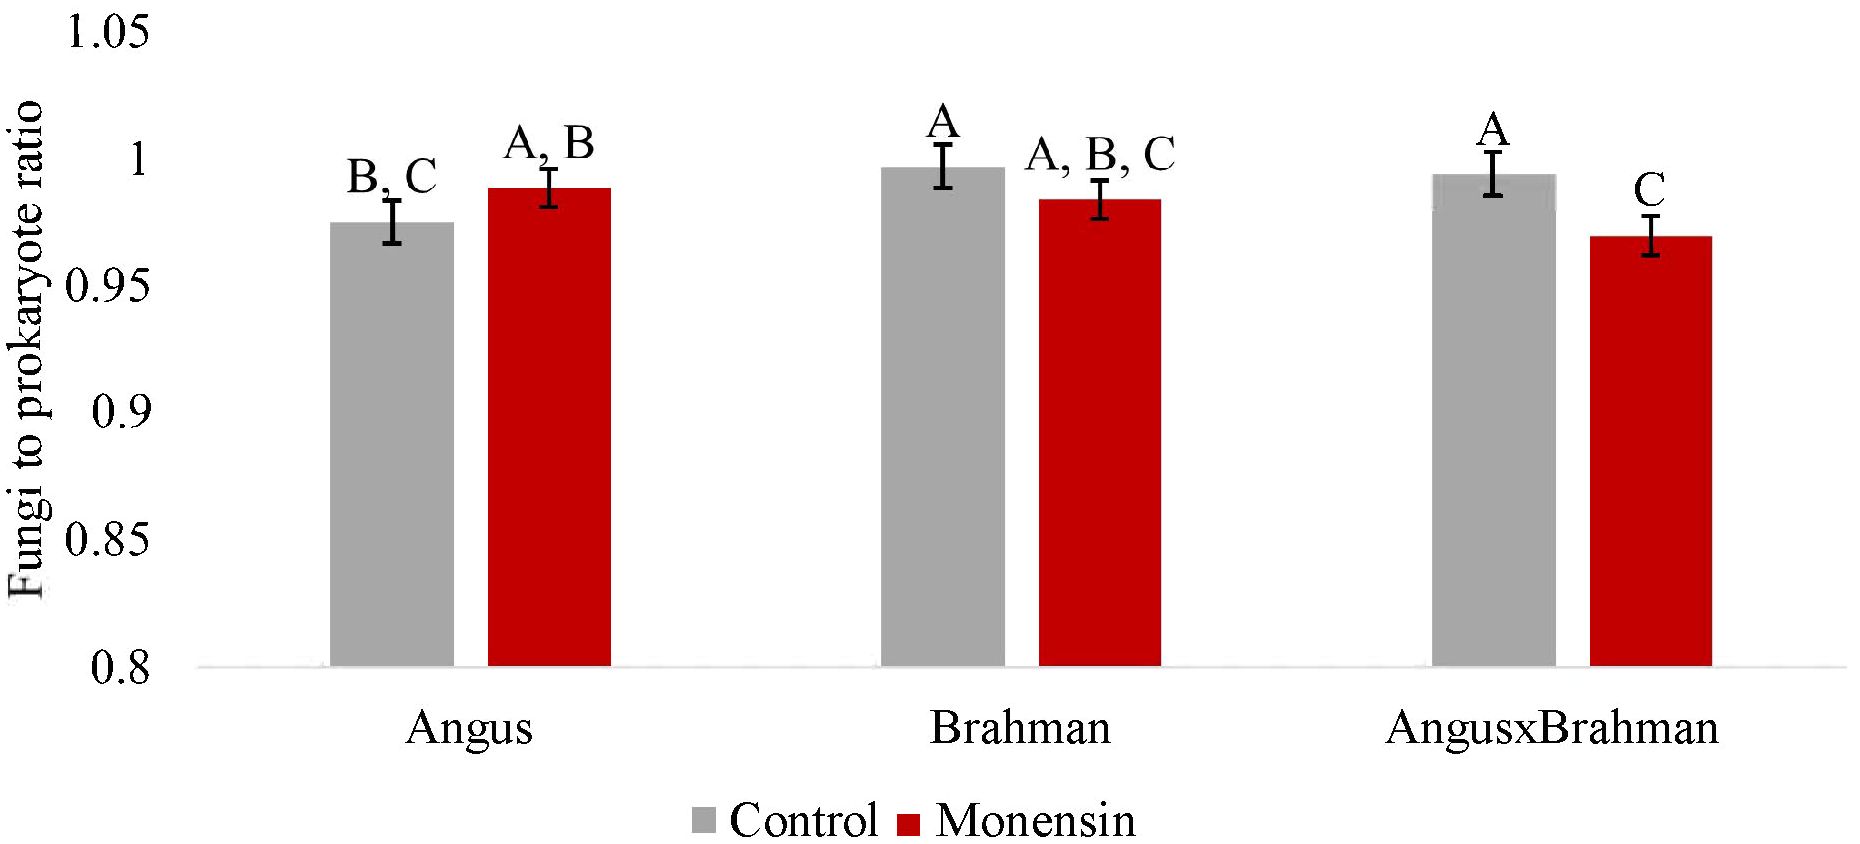
Figure 6. Ruminal fungi to prokaryote ratio. Values are least-square means (LSM) ± standard error of the means (SEM). Main effects of treatments on rumen fungi to prokaryote ratio were not different (P=0.147). A treatment-by- breed interaction was observed (P=0.003). Letters A, B and C indicate significance between treatment and breed interaction (P<0.05).
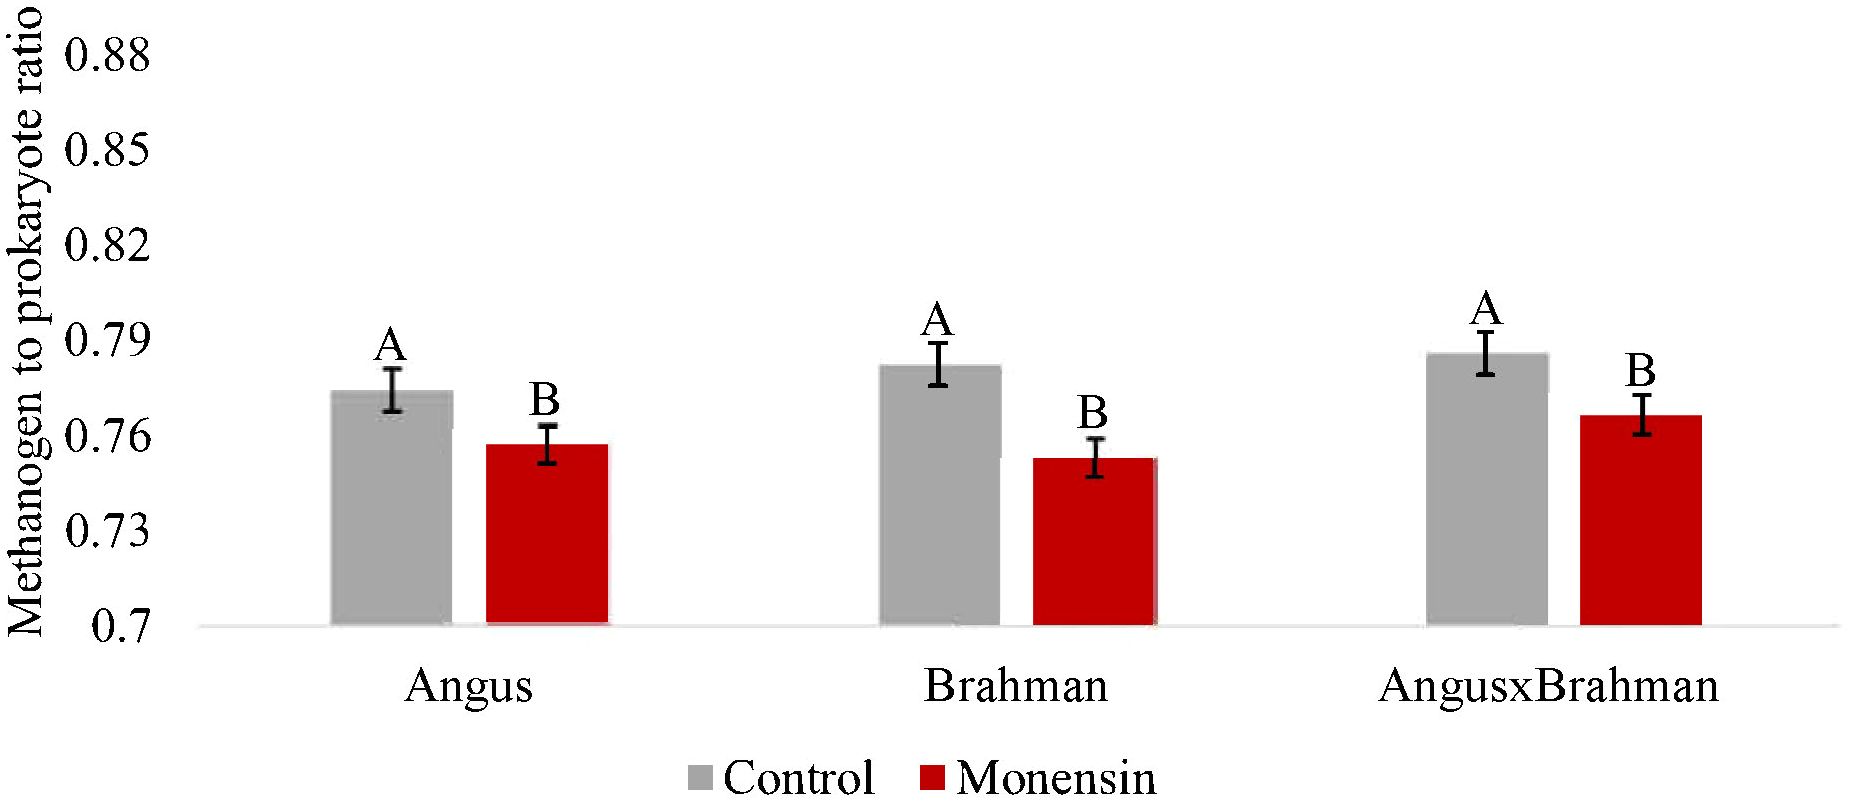
Figure 7. Ruminal methanogen to prokaryote ratio. Values are least-square means (LSM) ± standard error of the means (SEM). Main effects of treatments on ruminal methanogen to prokaryote ratio was different (P<0.001). A treatment- by-breed interaction was not observed (P=0.392. Letters A and B indicate significance between treatments, P<0.05).
3.3 Ruminal microbiome changes
For post-processing and quality filtering, the average number of sequences per sample were 2,171 ± 1,025 (SEM) and 38,832 ± 15,298 for the bacterial (16S rRNA gene) and fungal (ITS gene) samples, respectively. There were 13 prokaryotic phyla (two archaeal and 11 bacterial) and six fungal phyla classified among all samples. Of the prokaryotes, there were five phyla found across all samples, with the most abundant being Firmicutes, specifically Firmicutes_A (28% ± 7% relative abundance) and Bacteroidota (66% ± 7%) (Figure 8A). The prokaryotic phyla with a relative abundance between 1% and 3% were Proteobacteria, Firmicutes_C, and Firmicutes_D. Firmicutes_A was composed of 20 different genera, with the most prevalent being Butyrivibrio_A_168226, Pseudobutyrivibrio, Faecalimonas, and Acutalibacter. The phylum Bacteroidota had five genera classified, represented by Cryptobacteroides, Egerieousia, RF16, Paraprevotella, and Prevotella. The phyla Proteobacteria, Firmicutes_C, and Firmicutes_D were composed of five, two, and four different genera, respectively.
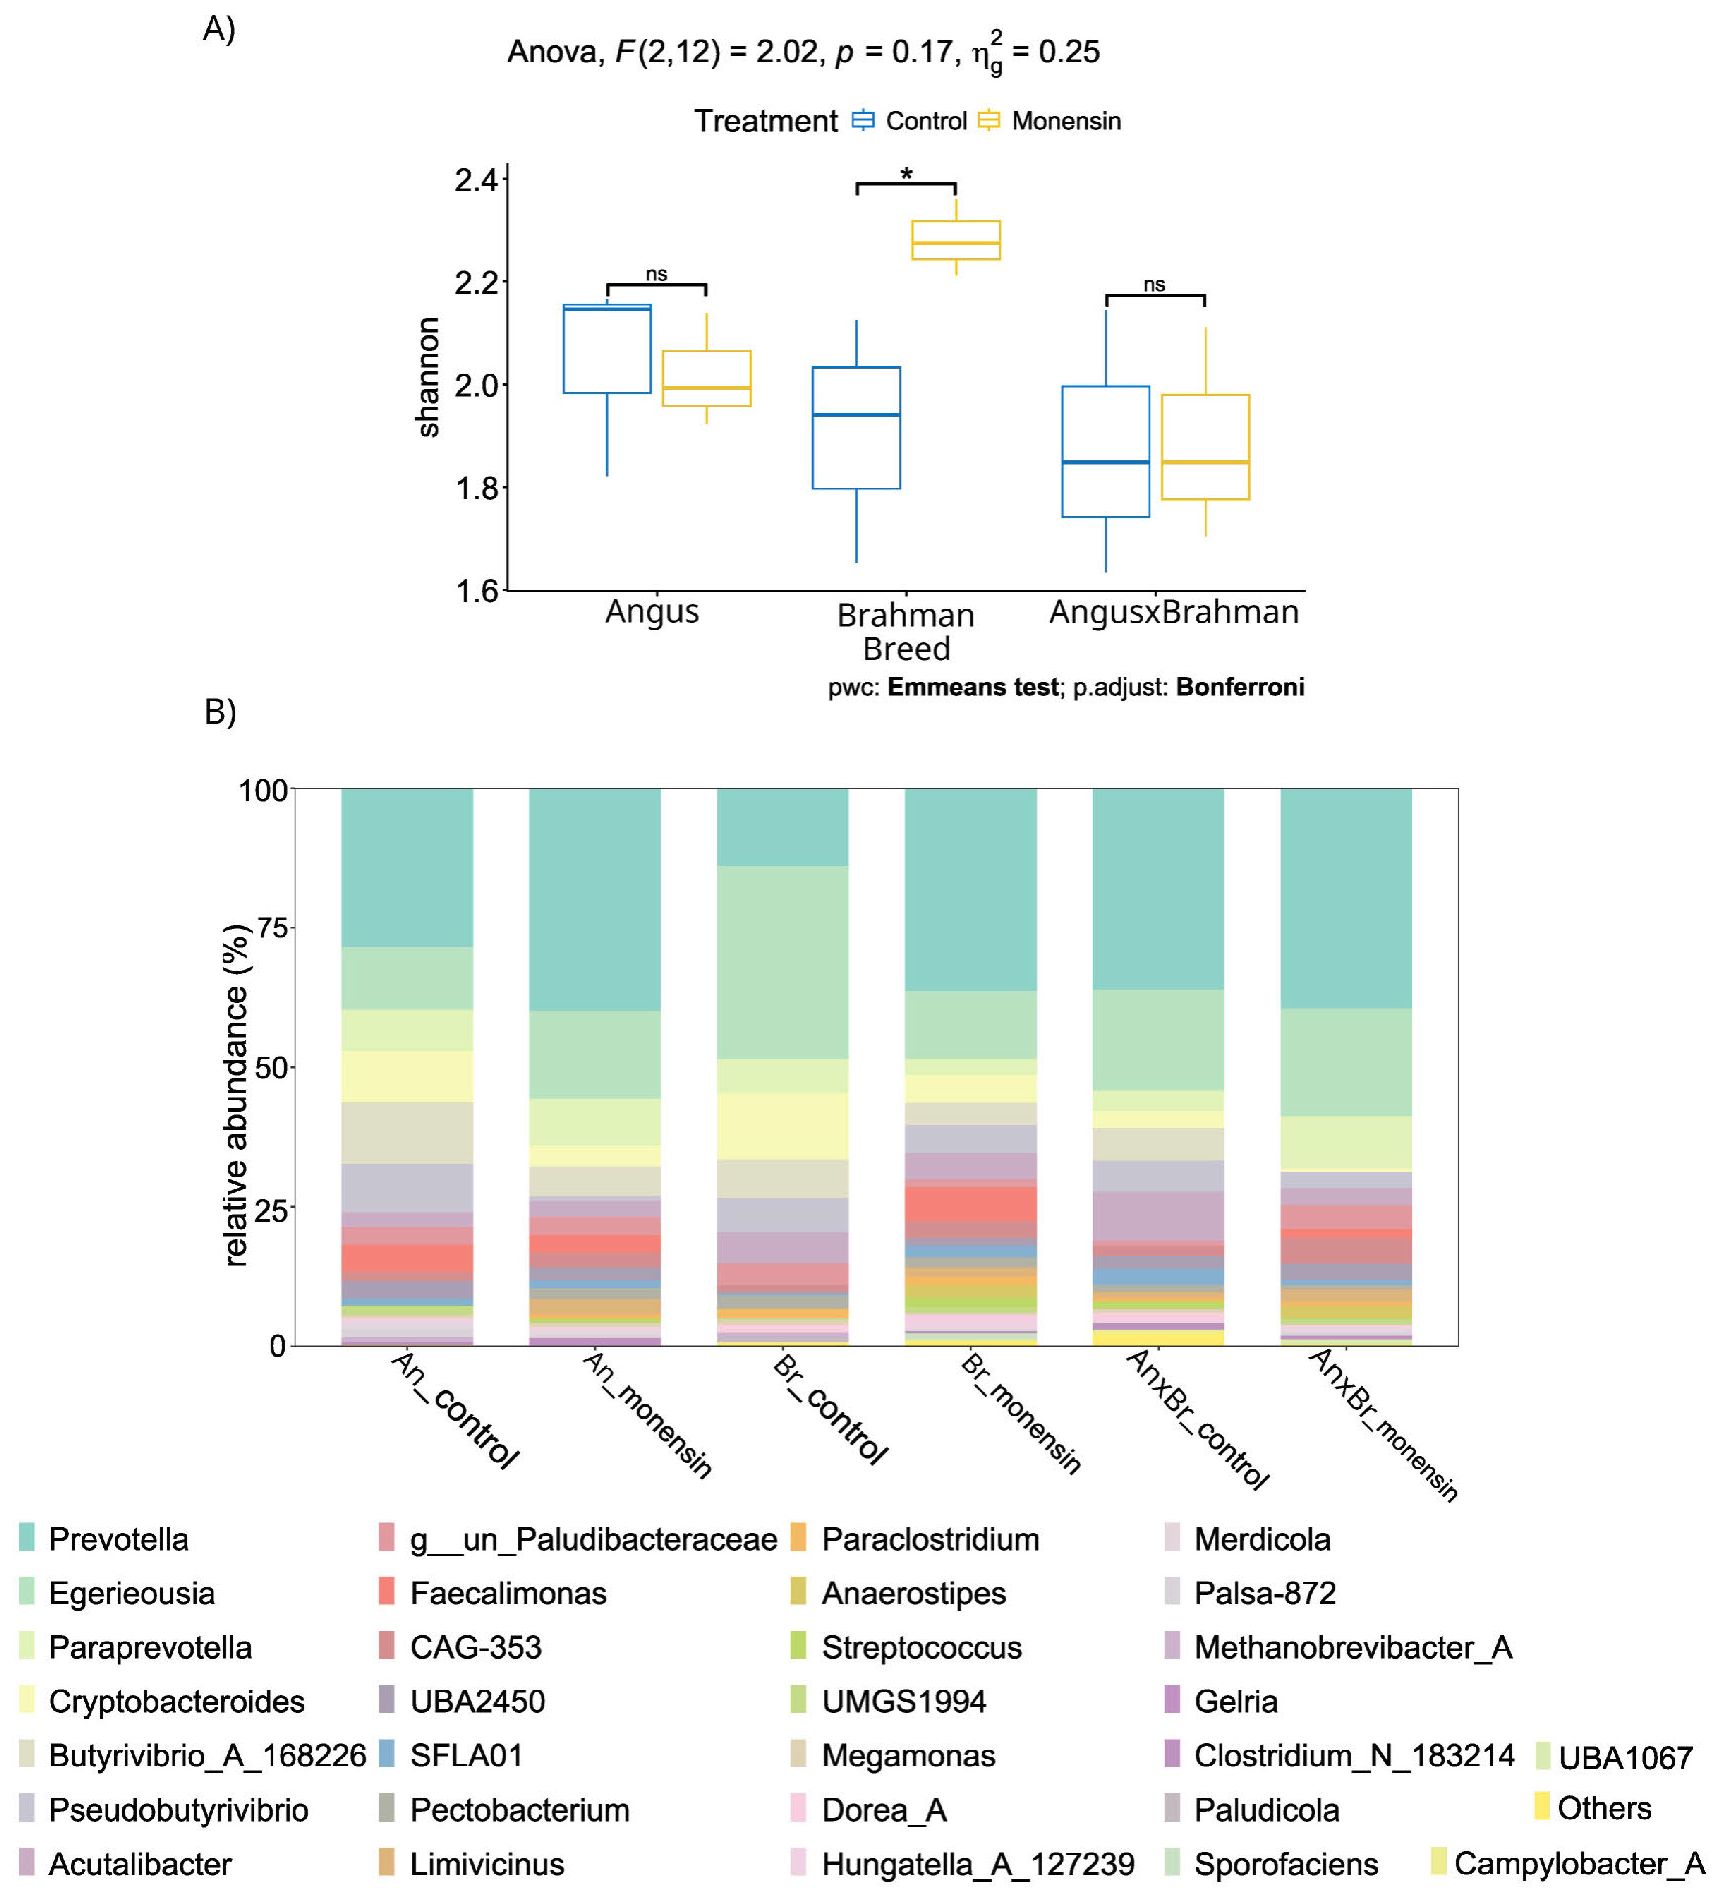
Figure 8. Relative abundance (A) and Shannon diversity (B) of bacterial ruminal microbial community. Values for A are relative abundance of AS Vs, while values of B are Shannon diversity index with ANOVA analysis. Plots represent the top 30 phyla assigned. The top 30 being the 30 most abundant phyla. Pairwise comparison revealed a significant variation Angus fungal diversity (P=0.040). A treatment-by-breed interaction was not observed (P=0.287). Individually, breed and treatment interactions were not observed (P=0.084, 0.283). Symbol * indicates significance, and ns indicates non-significance (P>0.05).
Of the six fungal phyla that were classified, two had sparse abundance of less than 1%, while the others were Neocallimastigomycota (63% ± 8%), Incertae sedis (17% ± 6%), Ascomycota (15% ± 3%), and Basidiomycota (4% ± 5%) (Figure 9A). Of the 10 genera from the Neocallimastigomycota phylum, five had an average relative abundance greater than 3%, these being Pecoramyces, Piromyces, Cyllamyces, Orpinomyces, and Incertae sedis. The phylum Ascomycota was represented by 41 genera, of which only Paraconiothyrium (3 ± 2%) and Furcasterigmium (8 ± 5%) were of relatively high abundance. Lastly, Basidiomycota was characterized by 20 different genera, all with relatively low relative abundance.
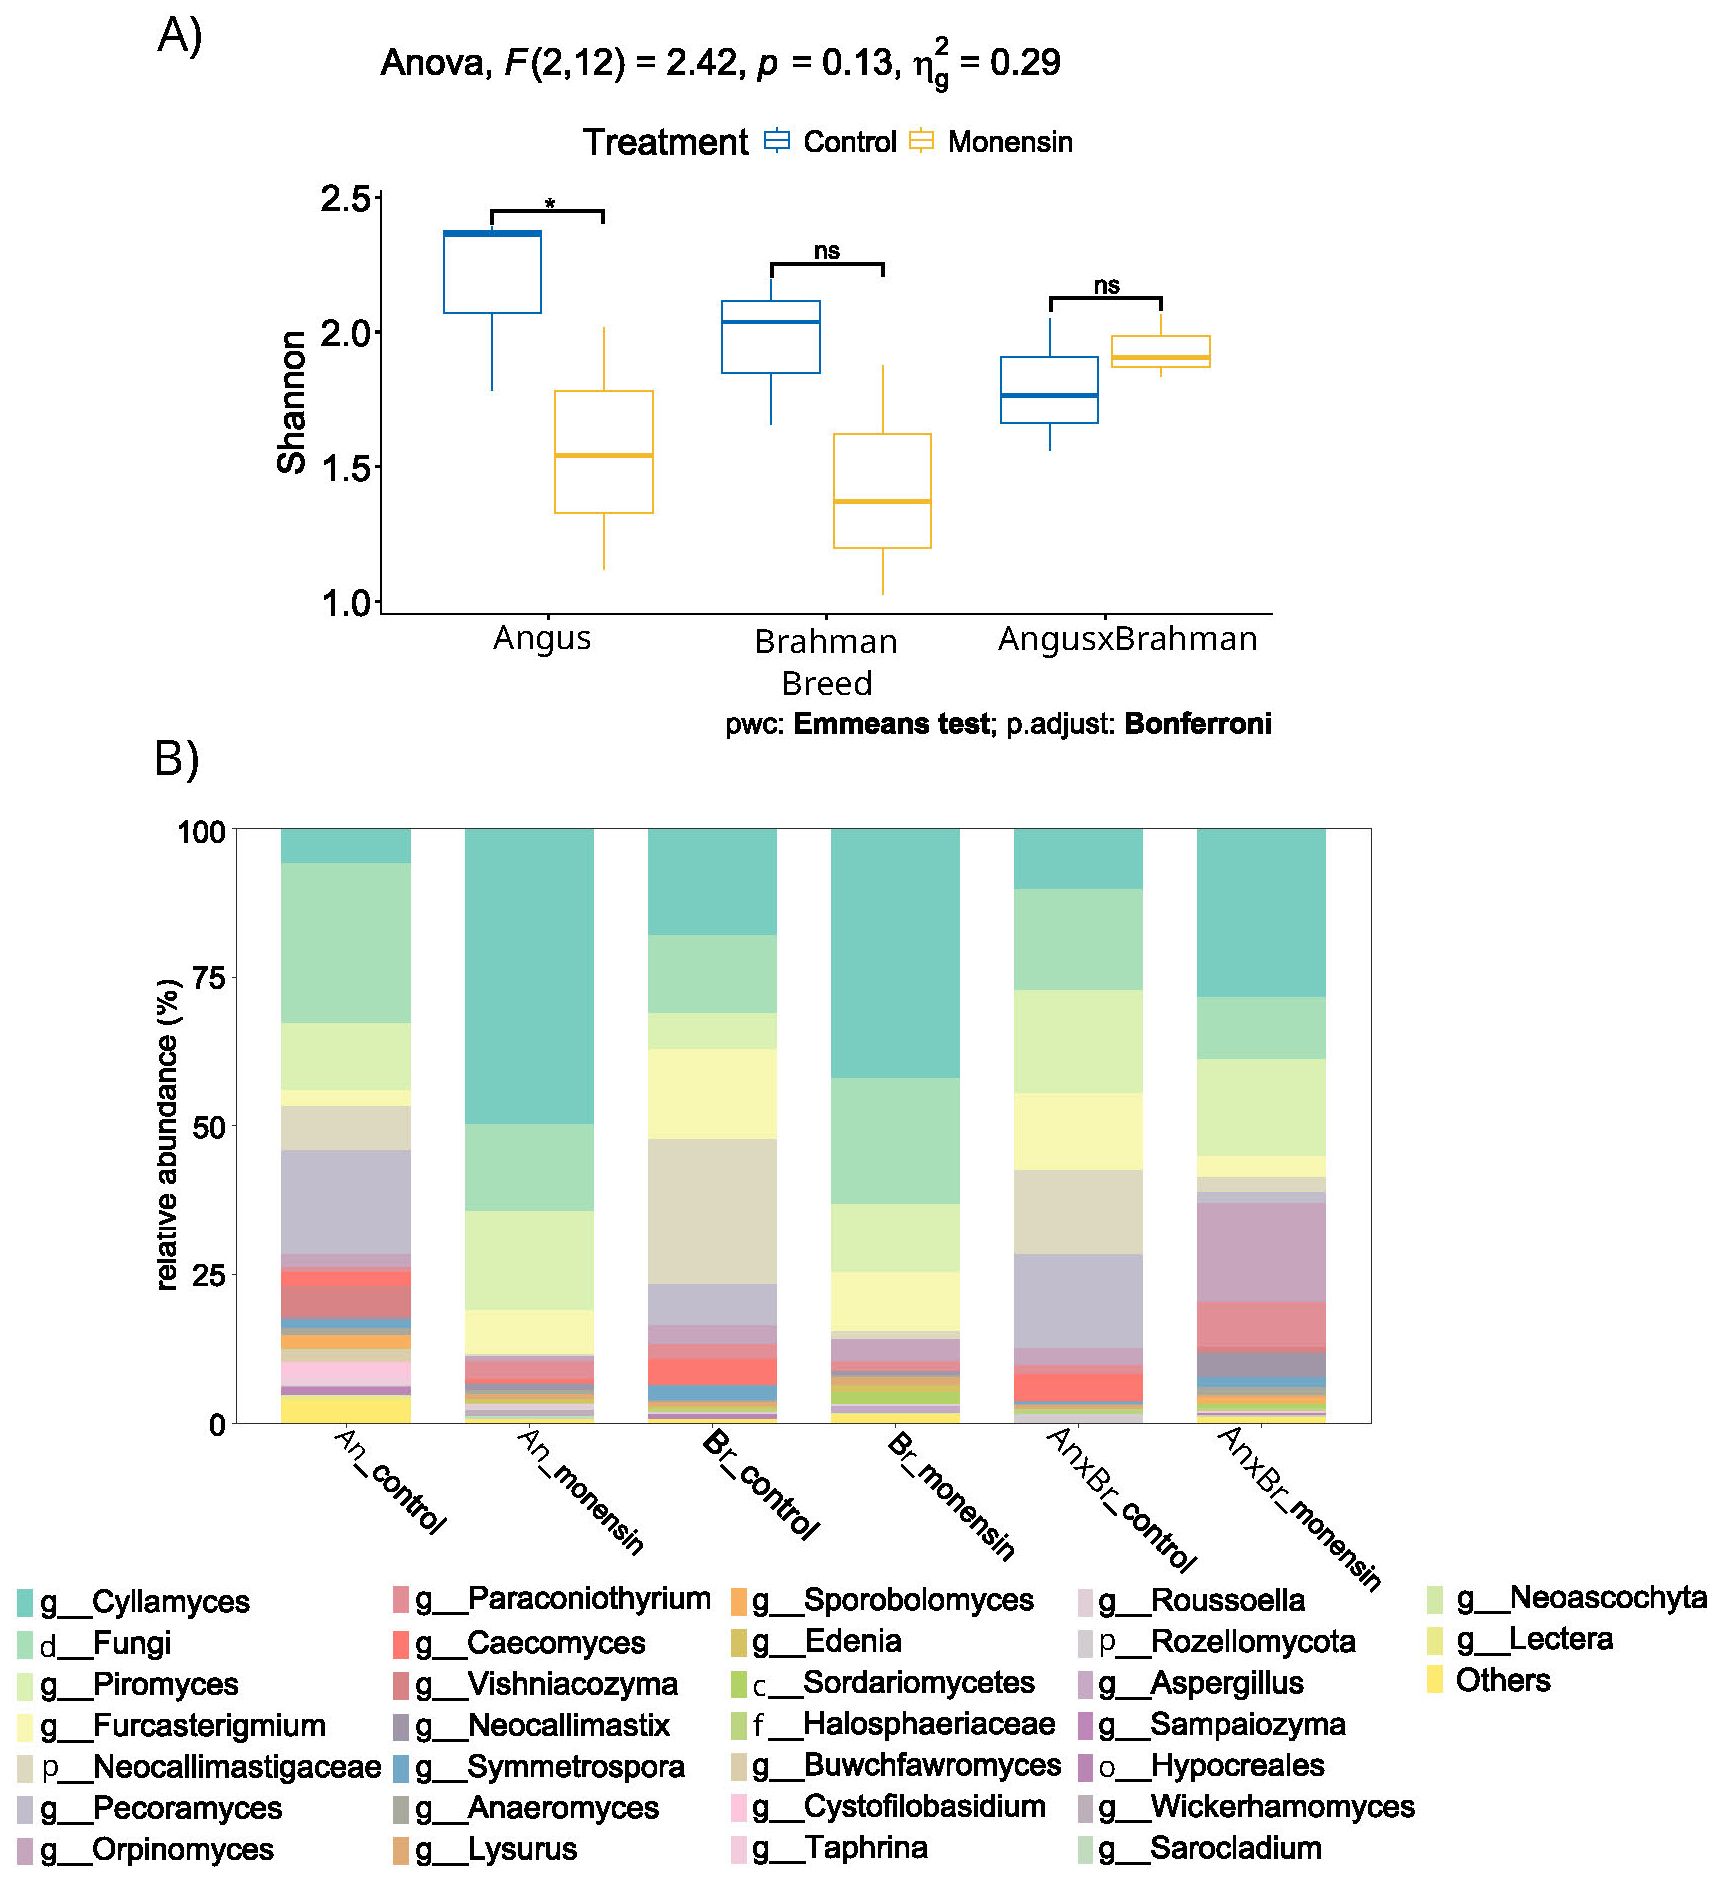
Figure 9. Relative abundance (A) and Shannon diversity (B) of fungal ruminal microbial community. Values are for A are relative abundance of ASVs, while values of B are Shannon diversity index with ANOVA analysis. Plots represent the top 30 phyla assigned. The top 30 being the 30 most abundant phyla. Pairwise comparison revealed a significant variation Angus fungal diversity (P=0.040). A treatment-by-breed interaction was not observed (P=0.287). Individually, breed and treatment interactions were not observed (P=0.084, 0.283). Symbol * indicates significance (P<0.05), and ns indicates non-significance (P>0.05).
Looking into the overall community characteristics, the alpha diversity was analyzed. Brahman steers were the only breed to have significant (p = 0.033) differences in Shannon diversity, with an increase in bacterial diversity after monensin treatment (Figure 8B). Monensin treatment did not show any significant changes in the bacterial community diversity of Angus and F1 steers. The fungal Shannon diversity significantly (p = 0.04) decreased in Angus steers, and there was a decrease in the fungal Shannon diversity of Brahman steers as well, but without statistical significance (p = 0.69) (Figure 9B). However, F1 steers appeared to have no fungal Shannon diversity changes in response to monensin treatment.
The beta diversity analysis revealed significant variations in the fungal and bacterial communities in response to monensin treatment (16S: p = 0.01, ITS: p < 0.01), but not between the cattle breed types (Table 1). Among the several metadata factors compared for their correlation with the microbial community structure based on the CCA, the A/P ratio was the major correlating factor in response to monensin treatment, followed by the mcrA gene abundance and FBR factors (Figure 10A). Similarly for the fungal community, the abundance of the mcrA gene and the A/P ratio were the major correlating factors during treatment with monensin (Figure 10B).
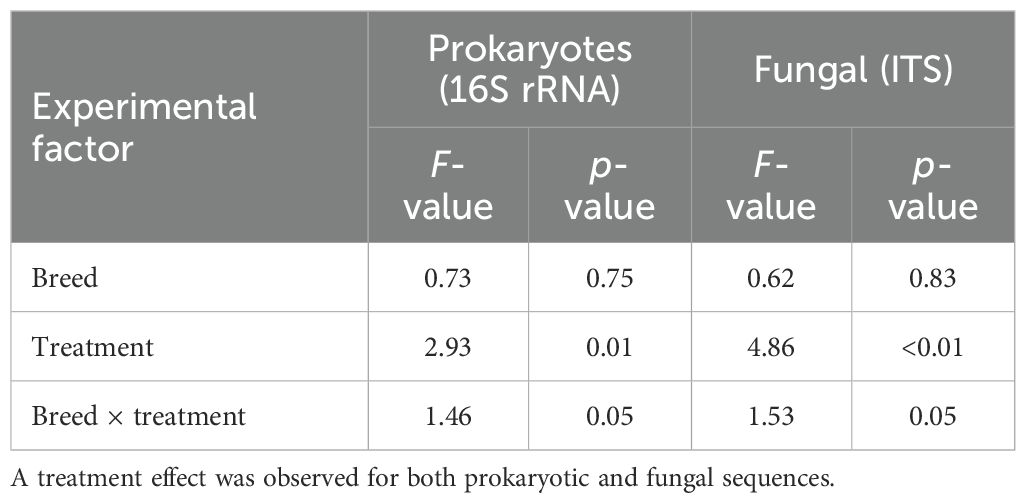
Table 1. Bray–Curtis-based permutational analysis of variance (PERMANOVA) for rumen microbiome sequence data.
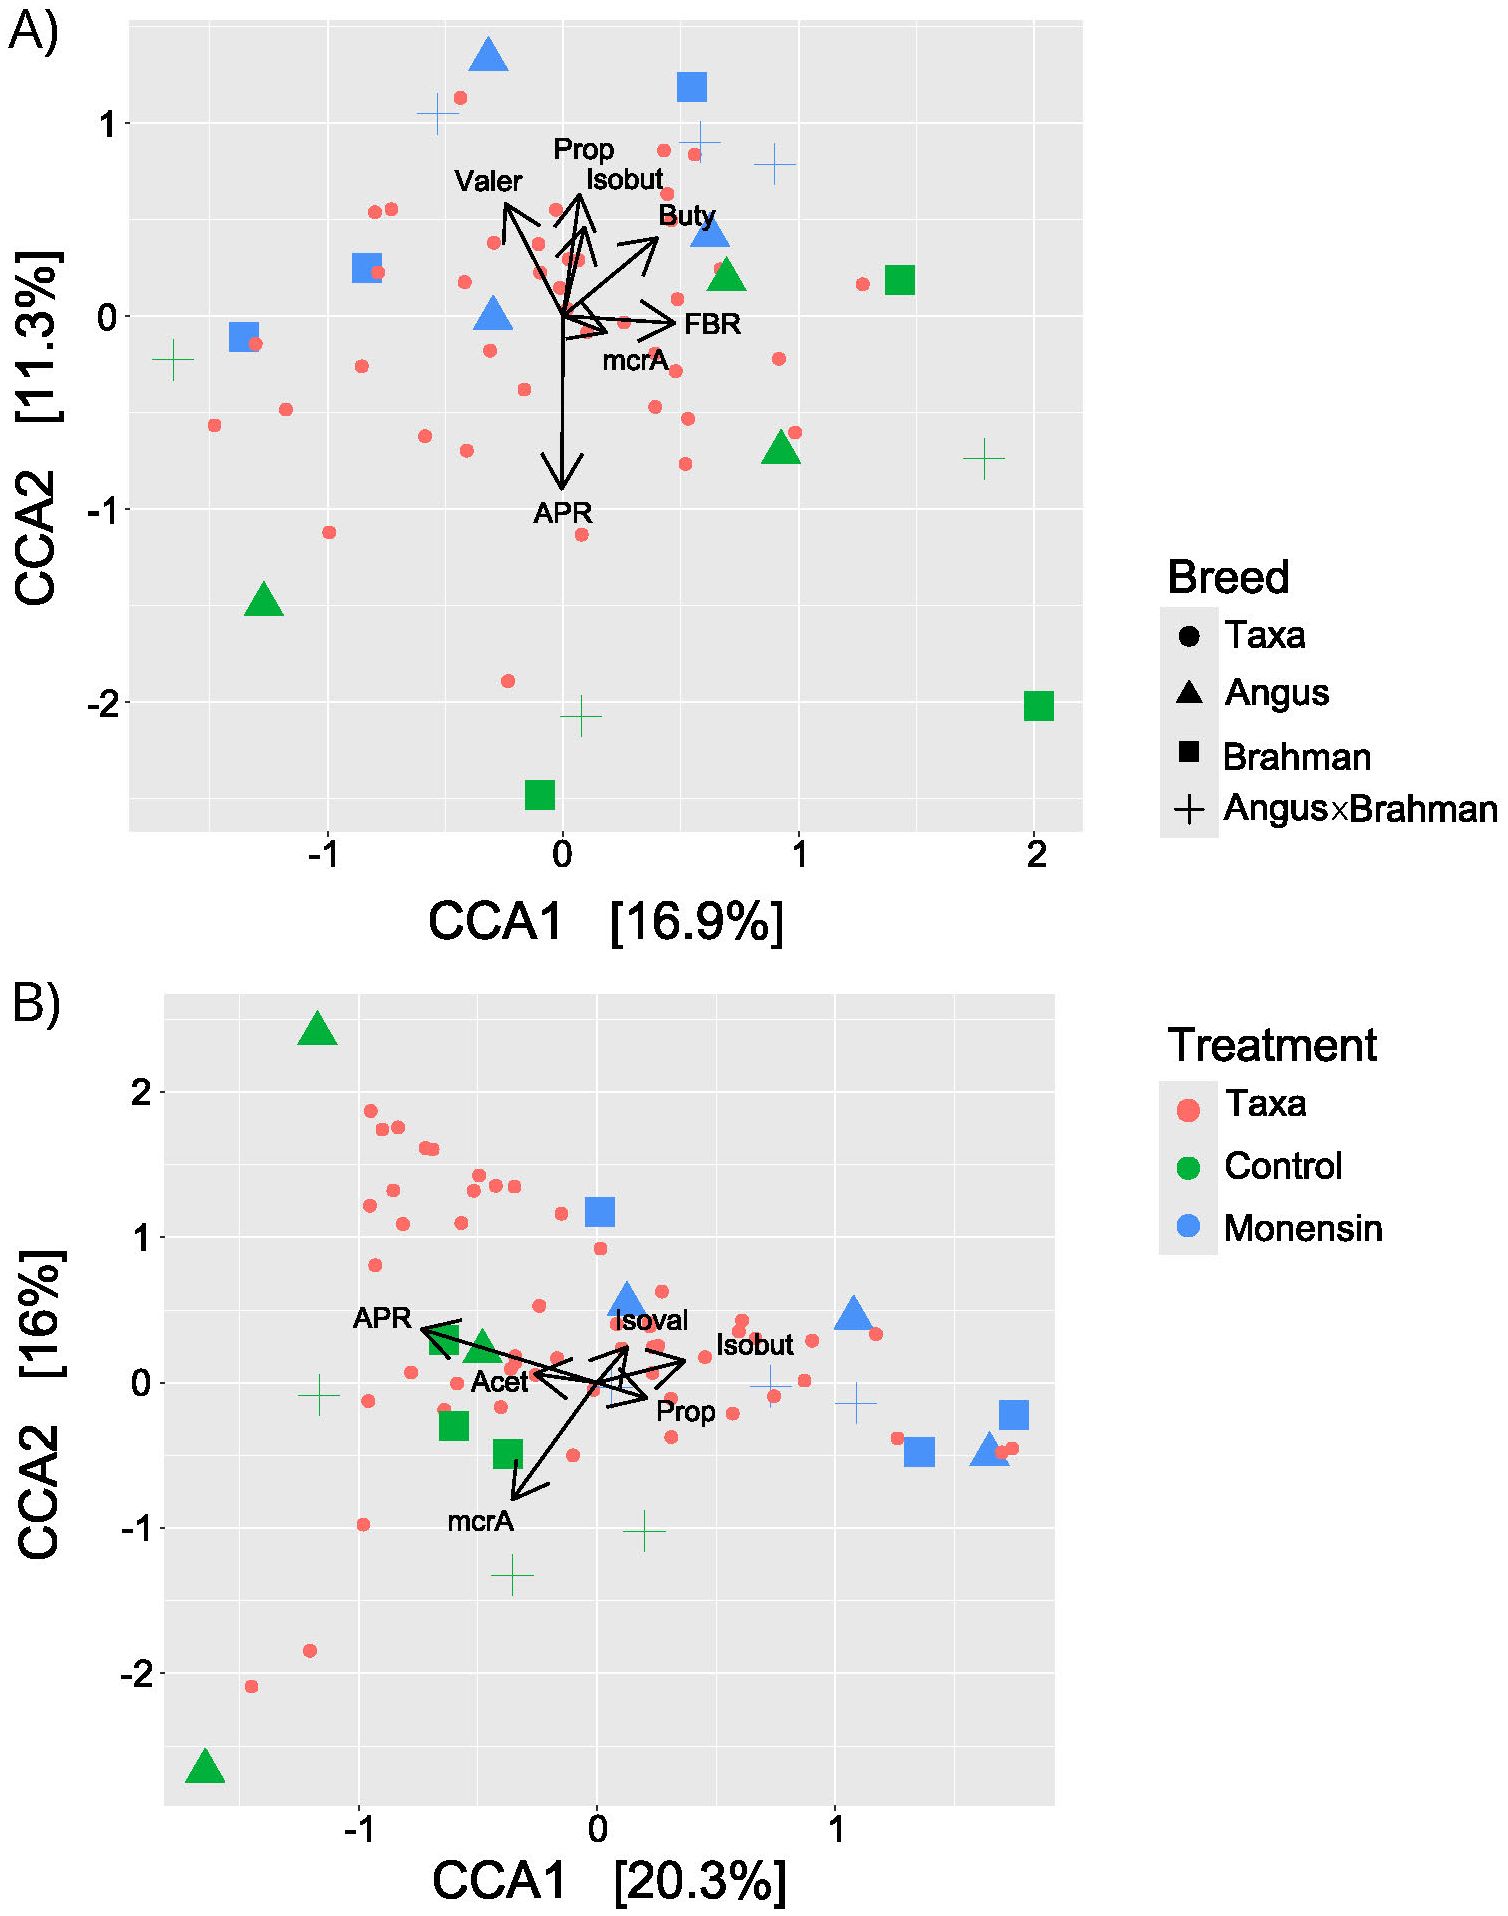
Figure 10. Plots showing CCA analysis comparing the ASV distance matrix to metadata, with (A) representing prokaryotic and (B) representing fungal communities. Colors represent treatment with green for control and blue for monensin, while red are taxa. The shapes are as follows circle represents taxa, triangle represents Angus, square represents Brahman, and a plus represents F1. Vectors length and direction signify correlation strength of individual metadata to experimental treatments.
The LEfSe was run to determine the differentially abundant (DA) microbial genera between cattle treated with and without monensin. Across all treatment structures, there were three DA bacterial genera with p < 0.05: Prevotella (LDA = 5.2), CAG-353 (Family: Ruminococcaceae; LDA = 4.3), and Limivicinus (LDA = 4.1) (Figure 11A). The DA microbial genera were from either the Bacteroidota or the Firmicutes_A phylum. Pairwise analysis for treatment effects within individual breed types showed no significantly different bacterial genera between the cattle genetic types. However, Firmicutes_A had higher relative abundance in all subspecies and F1 steers during monensin treatment, and except for F1, both Angus and Brahman exhibited increases of the phylum Bacteroidota during monensin treatment. Brahman steers had an increase in different bacterial genera from both Firmicutes_A and Bacteroidota, which increased during monensin treatment. On the other hand, Angus steers had only an increase of some bacterial genera during treatments.
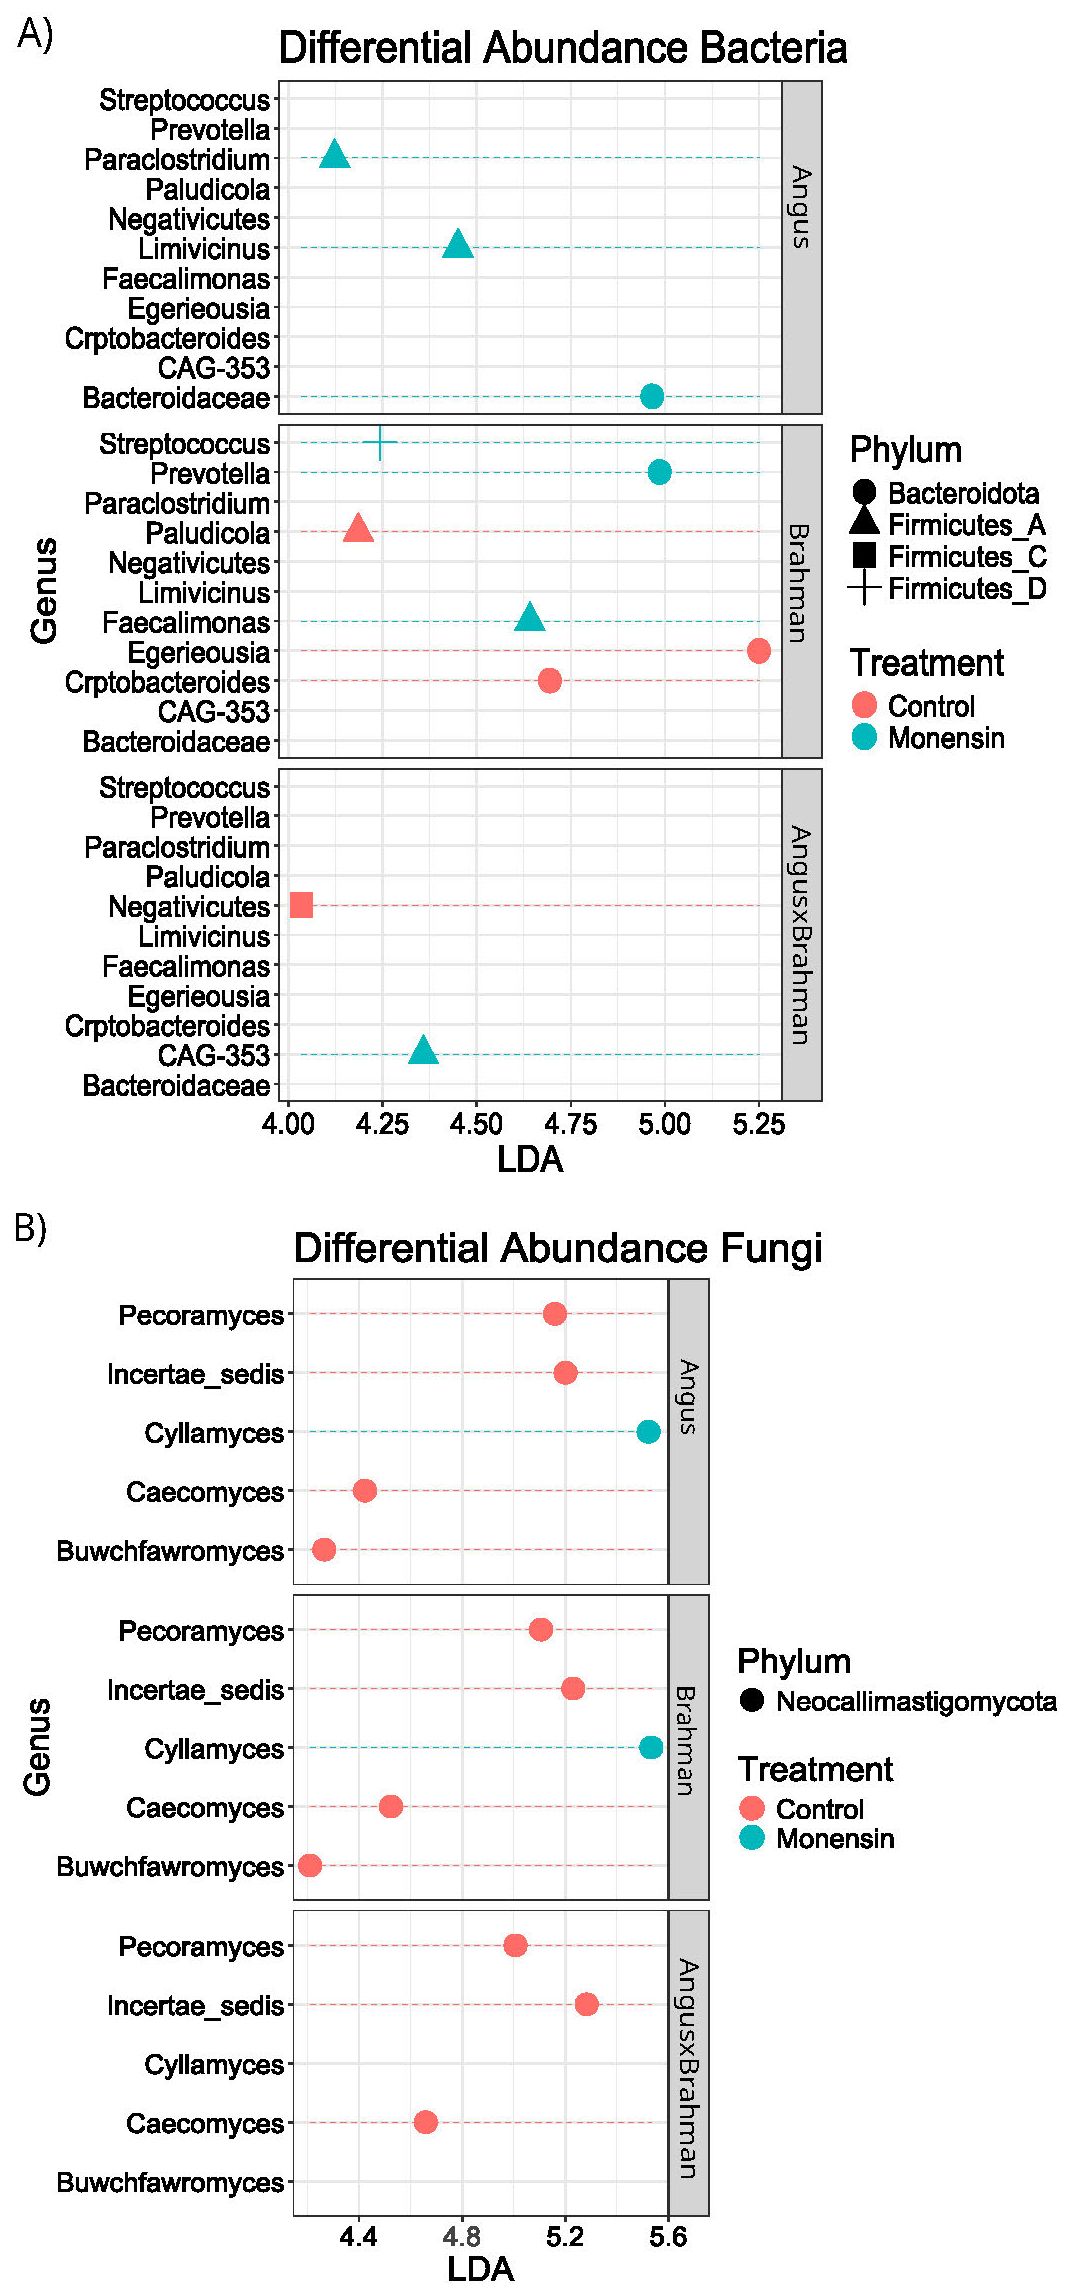
Figure 11. Linear discriminat analysis Effect size Differential abundance analysis. All values are LDA scores(log10), with (A) representing prokaryotic and (B) representing fungal communities. This graph reflects differential abundance across pairwise analysis of subspecies-by-treatment structure. Red represent control while blue represent monensin. Shape of graph A are as follow circle for Bacteroidota, triangle for Firmicutes_A, and square for Firmicutes_C and a plus for Firmicutes_D. Shapes for graph B are all circles for Neocallimastgomycota.
There were five DA fungal genera (with p < 0.03), all of which were from the phylum Neocallimastigomycota: Incertae sedis (LDA = 5.2), Pecoramyces (LDA = 5.1), Caecomyces (LDA = 4.6), Buwchfawromyces (LDA = 4.0), and Cyllamyces (LDA = 5.4) (Figure 11B). Pairwise analysis of the control vs. monensin for each breed type of steers individually showed a noticeable shift away from the phylum Neocallimastigomycota, with higher abundance in the control compared with the monensin treatment. There was an exception for the Neocallimastigomycota genus Cyllamyces, which was increased in the monensin treatment for both Angus (LDA = 5.5) and Brahman (LDA = 5.5). Only Brahman steers showed shifts in the Neocallimastigomycota phylum, Angus steers had a slight increase in the Ascomycota genus Wickerhamomyces (LDA = 4.0), and F1 steers had a slight increase in the Basidiomycota class Microbotryomycetes (LDA = 4.1) during treatment with monensin.
4 Discussion
The results of this study demonstrated that the cattle rumen microbiome is responsive to short-term diet changes, highlighting the potential for modulating the microbiome through dietary interventions. The PERMANOVA and beta diversity results clearly demonstrated that the microbiome structure was significantly different between the control and the monensin-treated cattle, both for the prokaryotic and fungal communities. Consistent with previous studies (Iqbal et al., 2018; Xue et al., 2020), Bacteroidetes, Firmicutes, and Proteobacteria were identified as the dominant phyla across these cattle breed types. Within the ruminal populations, we saw specific shifts of the genera Faecalimonas, Streptococcus, and Prevotella. The most notable of which was Prevotella, a genus known for producing propionate and playing a critical role in ruminal metabolism. Increases in the Prevotella abundance occurred with monensin supplementation, something that has been documented in previous research (Betancur-Murillo et al., 2022). Interestingly, the rumen fungal microbiome exhibited similar levels of diversity, with the Shannon diversity indices observed for fungal ASVs ranging from 1.026 to 2.391. These data on fungal microbiomes across different cattle genetic types are less readily available. However, some studies have reported a similar community structure, with dominance by the phylum Neocallimastigomycota (Liggenstoffer et al., 2010; Wang et al., 2019). The phylum Neocallimastigomycota was the most affected by the treatment as many DA genera were noted within this phylum. The majority of these DA genera diminished with monensin treatment, except for Cyllamyces. There is a lack of available data on Cyllamyces, with only a few isolated strains; however, these have been isolated from cows and buffaloes, with a partiality for domestic cattle (Hanafy et al., 2022). Neocallimastigomycota is one of the major anaerobic rumen fungi that contribute significantly to plant cell wall breakdown through enzymatic and mechanical actions (Hartinger and Zebeli, 2021; Król et al., 2023). Studies have highlighted the interdependence of anaerobic fungi and methanogens, suggesting that shifts in fungal communities could indirectly affect methanogenesis (Bauchop and Mountfort, 1981; Swift et al., 2019; Li et al., 2021). However, the interactions between ruminal fungi and methanogens are not well studied and warrant further investigation (Bhagat et al., 2023). We acknowledge that our fungal diversity and abundance were slightly higher than anticipated, which we believe could be due to two factors. Firstly, our sampling methodology, which involved collecting rumen contents via orogastric intubation, may have sampled more aerobic portions of the rumen. Other rumen sampling methods might yield slightly different results. Secondly, the ITS primers used in this study may have introduced bias by over-representing anaerobic fungi that dominate the rumen.
The microbiome changes in response to monensin treatment corresponded with a significant reduction in the ruminal A/P ratio and a decrease in the relative abundance of the mcrA gene, both being key markers for methanogenesis. These changes align with prior findings that both the ruminal A/P ratio and the mcrA gene abundance are indicators of a lower methane production potential in the rumen (Russell, 1998). The influence of monensin on the ruminal SCFA concentrations, particularly a reduction in the ruminal A/P ratio, has been well documented (National Academies of Sciences, Engineering, and Medicine, 2016). In particular with propionate, being glucogenic and acts as a hydrogen sink, there is an enhancement in the ruminal digestion efficiency and a reduction of hydrogen for methanogenesis (National Academies of Sciences, Engineering, and Medicine, 2016; Roehe et al., 2016). Bell et al. (2017) found no significant differences in the A/P ratio between B. taurus and B. indicus subspecies consuming a diet of Bermudagrass hay when supplemented with monensin, although steers consuming monensin consistently had lower ruminal A/P ratios compared with steers without supplementation. Although monensin does not directly impact methanogens, it suppresses the hydrogen concentrations, indirectly inhibiting methanogen activity. McGarvey et al. (2019) reported a 3.9- to 7.5-fold decrease in methanogen 16S rRNA gene copies after 20 days of monensin supplementation. Recovery in methanogenesis was observed, however, after prolonged treatment, indicating that the effects of monensin on methanogens may be transient as it is primarily mediated through its impact on hydrogen availability. Nevertheless, the results support our study hypothesis that the microbiome shifts in response to monensin treatment represent a functional rumen microbial structure that could be optimized for reduced methane emissions.
Some of the study results indicated that the microbial community responses to monensin treatment appears to be influenced by cattle genetic types, providing some evidence of G×M interactions that shape the microbiome structure in the rumen. For example, we observed a significant increase in the prokaryotic Shannon diversity in Brahman steers, accompanied by an overall reduction in the total fatty acid concentrations. In contrast, the other cattle breed types trended toward a reduced diversity, correlating with lower ruminal A/P ratios, but with no significant changes in the total SCFA quantities. Only Brahman steers showed a significant increase in bacterial diversity, whereas the fungal diversity decreased in both Angus (p < 0.05) and Brahman (p < 0.10) steers during monensin treatment. In Brahman, the LEfSe analysis between the monensin and the control diet showed that Faecalimonas, Streptococcus, and Prevotella were sufficiently increased after monensin treatment. Thus, changes in the relative abundance of certain dominant ASVs appear to influence the prokaryotic diversity, in this study case, due to the decrease within the genera Cryptobacteroides, Egerieousia, and Paludicola in B_M. However, it is not clear why the total SCFA concentration decreased under monensin treatment.
Among the fungal responses, the phylum Neocallimastigomycota was the most affected by the treatment, but only in Angus steers. Diverse fungal interactions are essential for ruminant nutrition, particularly due to their critical role in fiber digestion. Methanogenesis is also partially dependent on the efficiency of fungal metabolism in converting fiber and cell wall components for downstream methane production. The mechanisms underlying these processes, however, remain poorly understood and require further investigation to better interpret the microbial responses for functional applications.
The study results highlight distinct microbial responses linked to breed type adaptations. Brahman steers displayed a more pronounced bacterial response, while the Angus steers exhibited notable changes in fungal diversity. Long-term studies are necessary to validate these observations and provide insights into the mechanisms governing G×M interactions. Such insights could benefit targeted strategies for the modulation of rumen microbiome functions to optimize animal performance and reduce environmental impacts.
5 Conclusions
The study results illustrate that Angus, Brahman, and F1 crosses respond differently to monensin supplementation in terms of varying ruminal acetate and propionate concentrations, as well as shifts in the ruminal populations of Faecalimonas, Streptococcus, and Prevotella. The results confirmed microbial shifts with respect to Faecalimonas, Streptococcus, and Prevotella when steers were supplemented with monensin, confirming the hypothesis of underlying G×M interaction effects on the microbiome structure. The fungal phylum Neocallimastigomycota appears to be negatively affected by monensin treatment; however, its role in ruminal ecology is limited. The study results provide additional confirmation of the already well-documented effectiveness of monensin in lowering the ruminal A/P ratio and altering the SCFA concentrations across all three genetic types examined. Most importantly, the findings provide novel, parallel data on G×M interactions for the three genetic types. This is particularly significant for advancing the application of G×M interactions to reduce methane emissions, especially in Brahman cattle, for which a paucity of data is available.
Data availability statement
The raw data supporting the conclusions of this study have been deposited in the NCBI BioProject database (BioProject ID PRJNA1232096). Short-chain fatty acid analysis and qPCR analysis data can be accessed within the Supplementary Material.
Ethics statement
The animal study was approved by Texas A&M AgriLife Research Animal Use and Care Committee (Animal Use Protocol # 2017-038A). The study was conducted in accordance with the local legislation and institutional requirements.
Author contributions
RT: Writing – original draft, Writing – review & editing. LC: Writing – original draft, Writing – review & editing. MR: Writing – original draft, Writing – review & editing. CL: Writing – original draft, Writing – review & editing. RR: Writing – original draft, Writing – review & editing. TW: Writing – original draft, Writing – review & editing. AS: Writing – original draft, Writing – review & editing.
Funding
The author(s) declare financial support was received for the research and/or publication of this article. This study was partially funded by USDA-ARS cooperative agreement # ARS 58-3070-3-024 and USDA Formula Animal Health TEX0-9584. This study contributed to USDA NIFA Western Regional project TEX0-3212. Part of Dr. Somenahally’s salary was supported by USDA- Hatch project (Project number: TEX0-1-9603).
Acknowledgments
We acknowledge the assistance of Don Neuendorff, Dustin Law, Nevada King, Cara Case, Javid Mclawrence and Catherine Wellman at the Texas A&M AgriLife Research Center, Overton. We acknowledge the technical assistance for VFA analysis at the TAMU Integrated Metabolomics Core by Dr. Smriti Shankar and Dr. Cory Klemashevich.
Conflict of interest
The authors declare that the research was conducted in the absence of any commercial or financial relationships that could be construed as a potential conflict of interest.
Generative AI statement
The author(s) declare that no Generative AI was used in the creation of this manuscript.
Any alternative text (alt text) provided alongside figures in this article has been generated by Frontiers with the support of artificial intelligence and reasonable efforts have been made to ensure accuracy, including review by the authors wherever possible. If you identify any issues, please contact us.
Publisher’s note
All claims expressed in this article are solely those of the authors and do not necessarily represent those of their affiliated organizations, or those of the publisher, the editors and the reviewers. Any product that may be evaluated in this article, or claim that may be made by its manufacturer, is not guaranteed or endorsed by the publisher.
Supplementary material
The Supplementary Material for this article can be found online at: https://www.frontiersin.org/articles/10.3389/fanim.2025.1686771/full#supplementary-material
References
Abarenkov K., Nilsson R. H., Larsson K. H., Taylor A. F. S., May T. W., Frøslev T. G., et al. (2024). The UNITE database for molecular identification and taxonomic communication of fungi and other eukaryotes: sequences, taxa and classifications reconsidered. Nucleic Acids Res. 52, D791–D797. doi: 10.1093/nar/gkad1039
Bauchop T. and Mountfort D. O. (1981). Cellulose fermentation by a rumen anaerobic fungus in both the absence and the presence of rumen methanogens. Appl. Environ. Microbiol. 42, 1103–1110. doi: 10.1128/aem.42.6.1103-1110.1981
Bell N. L., Anderson R. C., Callaway T. R., Franco M. O., Sawyer J. E., and Wickersham T. A. (2017). Effect of monensin inclusion on intake, digestion, and ruminal fermentation parameters by Bos taurus indicus and Bos taurus taurus steers consuming Bermudagrass hay. J. Anim. Sci. 95, 2736–2746. doi: 10.2527/jas.2016.1011
Bergen W. G. and Bates D. B. (1984). Ionophores: their effect on production efficiency and mode of action. J. Anim. Sci. 58, 1465–1483. doi: 10.2527/jas1984.5861465x
Betancur-Murillo C. L., Aguilar-Marín S. B., and Jovel J. (2022). Prevotella: A key player in ruminal metabolism. Microorganisms 11. doi: 10.3390/microorganisms11010001
Bhagat N. R., Kumar S., Kumari R., and Bharti V. K. (2023). A review on rumen anaerobic fungi: current understanding on carbohydrate fermentation and roughages digestion in ruminants. Appl. Biochem. Micro. 59, 231–249. doi: 10.1134/S0003683823030043
Bisanz J. (2018). qiime2R: Importing QIIME2 artifacts and associated data into R sessions. Available online at: https://github.com/jbisanz/qiime2R (Accessed August 15, 2025).
Bokulich N. A., Kaehler B. D., Rideout J. R., Dillon M., Bolyen E., Knight R., et al. (2018). Optimizing taxonomic classification of marker-gene amplicon sequences with QIIME 2's q2-feature-classifier plugin. Microbiome 6, 90. doi: 10.1186/s40168-018-0470-z
Bolyen E., Rideout J. R., Dillon M. R., Bokulich N. A., Abnet C. C., Al-Ghalith G. A., et al. (2019). Reproducible, interactive, scalable and extensible microbiome data science using QIIME 2. Nat. Biotechnol. 37, 852–857. doi: 10.1038/s41587-019-0209-9
Burkholder J., Libra B., Weyer P., Heathcote S., Kolpin D., Thorne P. S., et al. (2007). Impacts of waste from concentrated animal feeding operations on water quality. Environ. Health Perspect. 115, 308–312. doi: 10.1289/ehp.8839
Bustin S. A., Benes V., Garson J. A., Hellemans J., Huggett J., Kubista M., et al. (2009). The MIQE guidelines: minimum information for publication of quantitative real-time PCR experiments. Clin. Chem. 55, 611–622. doi: 10.1373/clinchem.2008.112797
Callahan B. J., McMurdie P. J., Rosen M. J., Han A. W., Johnson A. J., and Holmes S. P. (2016). DADA2: High-resolution sample inference from Illumina amplicon data. Nat. Methods 13, 581–583. doi: 10.1038/nmeth.3869
Cao Y., Dong Q., Wang D., Zhang P., Liu Y., and Niu C. (2022). microbiomeMarker: an R/Bioconductor package for microbiome marker identification and visualization. Bioinform. 38, 4027–4029. doi: 10.1093/bioinformatics/btac438
Della Rosa M. M., Waghorn G. C., Vibart R. E., and Jonker A. (2023). An assessment of global ruminant methane-emission measurements shows bias relative to contributions of farmed species, populations and among continents. Anim. Prod. Sci. 63, 201–212. doi: 10.1071/AN22051
Dixon P. (2003). VEGAN, A package of R functions for community ecology. J. Veg. Sci. 14, 927–930. doi: 10.1111/j.1654-1103.2003.tb02228.x
Duffield T. F., Merrill J. K., and Bagg R. N. (2012). Meta-analysis of the effects of monensin in beef cattle on feed efficiency, body weight gain, and dry matter intake1. J. Anim. Sci. 90, 4583–4592. doi: 10.2527/jas.2011-5018
Fierer N., Jackson J. A., Vilgalys R., and Jackson R. B. (2005). Assessment of soil microbial community structure by use of taxon-specific quantitative PCR assays. Appl. Environ. Microbiol. 71, 4117–4120. doi: 10.1128/aem.71.7.4117-4120.2005
Food and Agriculture Organization of the United Nations (2020). Land use in agriculture by the numbers. Available online at: https://www.fao.org/sustainability/news/detail/en/c/1274219/ (Accessed September 23 2024).
Git A., Dvinge H., Salmon-Divon M., Osborne M., Kutter C., Hadfield J., et al. (2010). Systematic comparison of microarray profiling, real-time PCR, and next-generation sequencing technologies for measuring differential microRNA expression. RNA. 16, 991–1006. doi: 10.1261/rna.1947110
Hanafy R. A., Dagar S. S., Griffith G. W., Pratt C. J., Youssef N. H., and Elshahed M. S. (2022). Taxonomy of the anaerobic gut fungi (Neocallimastigomycota): a review of classification criteria and description of current taxa. Int. J. Syst.Evol. Microbiol. 72. doi: 10.1099/ijsem.0.005322
Harter J., Krause H.-M., Schuettler S., Ruser R., Fromme M., Scholten T., et al. (2013). Linking N2O emissions from biochar-amended soil to the structure and function of the N-cycling microbial community. ISME J. 8, 660–674. doi: 10.1038/ismej.2013.160
Hartinger T. and Zebeli Q. (2021). The present role and new potentials of anaerobic fungi in ruminant nutrition. J. Fungi. 7, 200. doi: 10.3390/jof7030200
Hunter R. A. and Siebert S. D. (1985). Utilization of low-quality roughage by Bos taurus and Bos indicus cattle. Br. J. Nutr. 53, 637–648. doi: 10.1079/bjn19850073
Iqbal M. W., Zhang Q., Yang Y., Li L., Zou C., Huang C., et al. (2018). Comparative study of rumen fermentation and microbial community differences between water buffalo and Jersey cows under similar feeding conditions. J. Appl. Anim. Res. 46, 740–748. doi: 10.1080/09712119.2017.1394859
Jami E., Israel A., Kotser A., and Mizrahi I. (2013). Exploring the bovine rumen bacterial community from birth to adulthood. ISME J. 7, 1069–1079. doi: 10.1038/ismej.2013.2
Kassambara A. (2023a). ggpubr: “ggplot2” Based Publication Ready Plots. Available online at: https://cran.r-project.org/web/packages/ggpubr/index.html (Accessed August 15, 2025).
Kassambara A. (2023b). “rstatix”: Pipe-Friendly Framework for Basic Statistical Tests. Available online at: https://cran.r-project.org/web/packages/rstatix/index.html (Accessed August 15, 2025).
Katoh K., Misawa K., Kuma K., and Miyata T. (2002). MAFFT: a novel method for rapid multiple sequence alignment based on fast Fourier transform. Nucleic. Acids Res. 30, 3059–3066. doi: 10.1093/nar/gkf436
Kim S. Y., Pramanik P., Bodelier P. L., and Kim P. J. (2014). Cattle manure enhances methanogens diversity and methane emissions compared to swine manure under rice paddy. PloS One 9, e113593. doi: 10.1371/journal.pone.0113593
Król B., Słupczyńska M., Wilk M., Asghar M. U., and Cwynar P. (2023). Anaerobic rumen fungi and fungal direct-fed microbials in ruminant feeding. J. Anim. Feed Sci. 32, 3–16. doi: 10.22358/jafs/153961/2022
Latham E. A., Weldon K. K., Wickersham T. A., Coverdale J. A., and Pinchak W. E. (2018). Responses in the rumen microbiome of Bos taurus and indicus steers fed a low-quality rice straw diet and supplemented protein. J. Anim. Sci. 96, 1032–1044. doi: 10.1093/jas/sky023
Li F., Li C., Chen Y., Liu J., Zhang C., Irving B., et al. (2019). Host genetics influence the rumen microbiota and heritable rumen microbial features associate with feed efficiency in cattle. Microbiome. 7, 92. doi: 10.1186/s40168-019-0699-1
Li Y., Meng Z., Xu Y., Shi Q., Ma Y., Aung M., et al. (2021). Interactions between anaerobic fungi and methanogens in the rumen and their biotechnological potential in biogas production from lignocellulosic materials. Microorganisms. 9, 190. doi: 10.3390/microorganisms9010190
Liggenstoffer A. S., Youssef N. H., Couger M. B., and Elshahed M. S. (2010). Phylogenetic diversity and community structure of anaerobic gut fungi (phylum Neocallimastigomycota) in ruminant and non-ruminant herbivores. ISME. J. 4, 1225–1235. doi: 10.1038/ismej.2010.49
Ma K., Conrad R., and Lu Y. (2012). Responses of methanogen mcrA genes and their transcripts to an alternate dry/wet cycle of paddy field soil. Appl. Environ. Microbiol. 78, 445–454. doi: 10.1128/AEM.06934-11
McCartor M. M., Randel R. D., and Carroll L. H. (1979). Dietary alteration of ruminal fermentation on efficiency of growth and onset of puberty in brangus heifers. J. Anim. Sci. 48, 488–494. doi: 10.2527/jas1979.483488x
McDonald D., Price M. N., Goodrich J., Nawrocki E. P., DeSantis T. Z., Probst A., et al. (2012). An improved Greengenes taxonomy with explicit ranks for ecological and evolutionary analyses of bacteria and archaea. ISME. J. 6, 610–618. doi: 10.1038/ismej.2011.139
McGarvey J. A., Place S., Palumbo J., Hnasko R., and Mitloehner F. (2019). Dosage-dependent effects of monensin on the rumen microbiota of lactating dairy cattle. Microbiologyopen 8, e00783. doi: 10.1002/mbo3.783
McGlone J., Ford S., Mitloehner F., Grandin T., Ruegg P., Stull C., et al. (2010). Guide for the Care and Use of Agricultural Animals in Research and Teaching (Champaign, IL, USA: FASS Inc).
McMurdie P. J. and Holmes S. (2013). phyloseq: an R package for reproducible interactive analysis and graphics of microbiome census data. PloS One 8, e61217. doi: 10.1371/journal.pone.0061217
National Academies of Sciences, Engineering, and Medicine (2016). Nutrient Requirements of Beef Cattle: Eighth Revised Edition (Washington, DC: The National Academies Press).
Pereira A. M., De Lurdes Nunes Enes Dapkevicius M., and Borba A. E. S. (2022). Alternative pathways for hydrogen sink originated from the ruminal fermentation of carbohydrates: Which microorganisms are involved in lowering methane emission? Anim. Microbiome 4. doi: 10.1186/s42523-021-00153-w
Price M. N., Dehal P. S., and Arkin A. P. (2010). FastTree 2–approximately maximum-likelihood trees for large alignments. PloS One 5, e9490. doi: 10.1371/journal.pone.0009490
Raun N. S. and Burroughs W. (1962). Suction Strainer technique in obtaining rumen fluid samples from intact lambs. J. Anim. Sci. 21, 454–457. doi: 10.2527/jas1962.213454x
Roehe R., Dewhurst R. J., Duthie C.-A., Rooke J. A., McKain N., Ross D. W., et al. (2016). Bovine host genetic variation influences rumen microbial methane production with best selection criterion for low methane emitting and efficiently feed converting hosts based on metagenomic gene abundance. PloS Genet. 12, e1005846. doi: 10.1371/journal.pgen.1005846
Russell J. B. (1998). The importance of pH in the regulation of ruminal acetate to propionate ratio and methane production in vitro. J. Dairy Sci. 81, 3222–3230. doi: 10.3168/jds.S0022-0302(98)75886-2
Russell J. B. and Strobel H. J. (1989). Effect of ionophores on ruminal fermentation. Appl. Environ. Microbiol. 55, 1–6. doi: 10.1128/aem.55.1.1-6.1989
Shabat S. K. B., Sasson G., Doron-Faigenboim A., Durman T., Yaacoby S., Berg Miller M. E., et al. (2016). Specific microbiome-dependent mechanisms underlie the energy harvest efficiency of ruminants. ISME J. 10, 2958–2972. doi: 10.1038/ismej.2016.62
Soltan A. Y. and Patra A. K. (2021). “Ruminal Microbiome Manipulation to Improve Fermentation Efficiency in Ruminants,” in Animal Feed Science and Nutrition - Production, Health and Environment. Ed. Patra A. K. (IntechOpen, London).
Steinberg L. M. and Regan J. M. (2008). Phylogenetic comparison of the methanogenic communities from an acidic, oligotrophic fen and an anaerobic digester treating municipal wastewater sludge. Appl. Environ. Microbiol. 74, 6663–6671. doi: 10.1128/aem.00553-08
Swift C. L., Brown J. L., Seppälä S., and O’Malley M. A. (2019). Co-cultivation of the anaerobic fungus Anaeromyces robustus with Methanobacterium bryantii enhances transcription of carbohydrate active enzymes. J. Ind. Microbiol. Biotechnol. 46, 1427–1433. doi: 10.1007/s10295-019-02188-0
Turner J. W. (1980). Genetic and biological aspects of zebu adaptability. J. Anim. Sci. 50, 1201–1205. doi: 10.2527/jas1980.5061201x
U.S. Environmental Protection Agency (EPA) (2024). Inventory of U.S. Greenhouse gas emissions and sinks: 1990-2022. Available online at: https://www.epa.gov/ghgemissions/inventory-us-greenhouse-gas-emissions-and-sinks-1990–2022 (Accessed August 15, 2025).
Wang H., Li P., Liu X., Zhang C., Lu Q., Xi D., et al. (2019). The composition of fungal communities in the rumen of gayals. Pol. J. Microbiol. 68, 505–514. doi: 10.33073/pjm-2019-050
Keywords: angus, brahman, F1, genetics and rumen microbiome (G×M), fatty acids, methanogens
Citation: Thorn RL, Coffman LE, Rabalais Bass MM, Long CR, Randel RD, Welsh TH Jr. and Somenahally AC (2025) Comparison of the ruminal microbiome responses of temperate and tropically adapted beef steers to dietary supplementation with monensin. Front. Anim. Sci. 6:1686771. doi: 10.3389/fanim.2025.1686771
Received: 15 August 2025; Accepted: 04 November 2025; Revised: 23 October 2025;
Published: 26 November 2025.
Edited by:
Assar Ali Shah, Jiangsu University, ChinaReviewed by:
Tara G. McDaneld, Agricultural Research Service (USDA), United StatesEmiliano Lasagna, University of Perugia, Italy
Copyright © 2025 Thorn, Coffman, Rabalais Bass, Long, Randel, Welsh and Somenahally. This is an open-access article distributed under the terms of the Creative Commons Attribution License (CC BY). The use, distribution or reproduction in other forums is permitted, provided the original author(s) and the copyright owner(s) are credited and that the original publication in this journal is cited, in accordance with accepted academic practice. No use, distribution or reproduction is permitted which does not comply with these terms.
*Correspondence: Anil C. Somenahally, QW5pbC5Tb21lbmFoYWxseUBhZy50YW11LmVkdQ==; Thomas H. Welsh Jr., VGhvbWFzLldlbHNoQGFnLnRhbXUuZWR1