 Hannah James
 Martin Perez2
 Hunter Adams
 Julio Giordano
 Mason Peck
- 1Sibley School of Mechanical and Aerospace Engineering, Cornell University, Ithaca, NY, United States
- 2Department of Animal Science, College of Agriculture and Life Sciences, Cornell University, Ithaca, NY, United States
- 3School of Electrical and Computer Engineering, Cornell University, Ithaca, NY, United States
Virtual fencing technologies offer a promising alternative to traditional physical barriers for managing livestock, enabling dynamic and non-invasive control over grazing behavior. However, current systems often rely on simplified assumptions about animal responses, neglecting the cognitive, perceptual, and social dynamics that shape cattle behavior in complex herd environments. This study introduces a biologically grounded modeling framework designed to capture core processes influencing cattle response to auditory cues—specifically frequency sensitivity, amplitude saturation, associative learning, habituation, individual behavioral variability, and social influence. These factors are formalized through modular equations; and integrated into agent-based and differential equation simulations to examine individual and herd-level outcomes. By calibrating the model against empirical behavioral data, we reproduce known learning patterns and explore cue effectiveness under variable conditions. The framework offers an interpretable and flexible foundation for optimizing next-generation virtual fencing systems, improving both functional control and animal welfare.
1 Introduction
Virtual fencing technologies offer a promising alternative to traditional physical barriers for managing livestock movement, enabling dynamic and non-invasive control over grazing patterns (Harland et al., 2025; Musinska et al., 2025). Central to the effectiveness of these systems is the ability to elicit consistent and predictable behavioral responses from animals using sensory cues—most commonly auditory stimuli (Bishop-Hurley et al., 2007; Campbell et al., 2018). Yet, current virtual fencing systems often rely on simplified assumptions about animal behavior, failing to account for the nuanced biological and social dynamics that shape cattle responses to environmental inputs (Hamidi et al., 2024; Simonsen et al., 2024). This gap limits their reliability, particularly in complex herd settings where individual variation, learning, and social facilitation play significant roles (Keshavarzi et al., 2020; Fuchs et al., 2024; Aaser et al., 2022; Gadzama et al., 2025).
This stems partly from a reliance on behaviorist models that emphasize stimulus-response associations without adequately considering cognitive, perceptual, and social processes. For instance, studies have shown that cattle exhibit a wide range of sensitivity to acoustic frequencies (Bishop-Hurley et al., 2007; Waynert et al., 2009), habituate to repeated cues (Lomax et al., 2019; Campbell et al., 2017), and adapt their responses based on prior learning and herd context (Verdon and Rawnsley, 2020; Lee et al., 2009). Furthermore, individual differences in temperament and leadership roles significantly influence herd movement and responsiveness to cues (Keshavarzi et al., 2020; Colusso et al., 2020). Despite these findings, many current virtual fencing systems operate on fixed-threshold algorithms, limiting their responsiveness to dynamic and heterogeneous behavioral patterns in real-world conditions (Wilms et al., 2024). Moreover, failure to model these dynamics accurately has raised welfare concerns, with critics noting the risk of chronic stress or misuse when animals are unable to predict or interpret cues effectively (Lee and Campbell, 2021; Aaser et al., 2022; Grumett and Butterworth, 2022; Gadzama et al., 2025; Musinska et al., 2025). In recognition of these limitations, an Australian government-commissioned review recommended that virtual fencing systems avoid features like rapidly moving boundaries, and many states currently permit their use only under research exemptions or strict welfare oversight (Fisher and Cornish, 2022).
Several previous efforts have attempted to address behavioral control in livestock using computational (Butler et al., 2006) or empirical (Campbell et al., 2018; Lee and Campbell, 2021) approaches. Rule-based systems and threshold-triggered cues have been used to initiate aversive stimuli once an animal crosses a predefined boundary (Bishop-Hurley et al., 2007). While effective under controlled conditions, these systems often lack robustness in more variable field settings, particularly when animals learn to ignore or work around stimuli (Butler et al., 2006). Some models have incorporated learning rates or response decay, but typically without accounting for perceptual saturation, social feedback, or variation across individuals (Colusso et al., 2020; Verdon and Rawnsley, 2020; Hamidi et al., 2024). As a result, virtual fencing remains unreliable in complex environments where cognitive and social factors play central roles in decision-making and movement coordination.
To address these limitations, we present a biologically grounded modeling framework that captures the core perceptual, cognitive, and social processes underlying cattle responses to auditory cues. Drawing from principles in ethology, sensory neuroscience, and behavioral conditioning, the model incorporates frequency sensitivity, amplitude saturation, associative learning, habituation, social influence, and personality variation. These components are synthesized into a set of modular equations that simulate both motion magnitude and the probability of turning behavior—key indicators of effective boundary avoidance. The model is further embedded within agent-based and differential equation simulations to explore herd-level dynamics under various cue conditions and environmental contexts. While prior work such as Butler et al. (2006) demonstrated the feasibility of virtual fencing through rule-based simulations using finite state machines and potential fields, their approach lacked explicit modeling of perceptual processing, learning, or individual variation. In contrast, our framework introduces biologically interpretable mechanisms that allow for dynamic, individualized responses and social facilitation effects, grounded in empirical behavioral data. Through extensive calibration, our approach not only replicates known behavioral trends but also enables predictive simulation of cattle behavior in real-world virtual fencing scenarios. In doing so, this work provides a biologically interpretable and flexible foundation for the design and optimization of next-generation animal management systems.
2 Materials and methods
2.1 Model overview
We developed a biologically informed simulation framework that integrates four interrelated behavioral processes—auditory perception, associative learning, habituation, and social facilitation—to predict cattle responses to virtual-fencing cues. The model represents each cow as an autonomous agent that responds probabilistically to sensory inputs according to empirically derived parameters from behavioral and physiological research (Supplementary Table S1). Its structure combines established functional forms from ethology and sensory neuroscience—Gaussian functions for frequency sensitivity, logistic or exponential curves for learning, and exponential decay for habituation—to capture key mechanisms of perception and adaptation. These equations were newly formulated for this study, rather than adapted directly from previous models, to represent learned associations, sensory tuning, and socially modulated movement. Parameter values were derived and validated using data from 20 peer-reviewed studies on animal behavior, auditory processing, and virtual fencing (Lee et al., 2009; Waynert et al., 1999; Campbell et al., 2017; Hamidi et al., 2024; Colusso et al., 2020; Mota-Rojas et al., 2024; Lee et al., 2008; Gibbons et al., 2009; Aaser et al., 2022; Umstatter et al., 2009; Moreira et al., 2023; Crouch et al., 2019; Nyamuryekung’e et al., 2023; Keshavarzi et al., 2020; Lange et al., 2020; Brouček, 2014; Umstatter et al., 2013; Olczak et al., 2023; Ciborowska et al., 2021; James et al., 2025). Collectively, these components form a unified, biologically grounded simulation capable of reproducing empirically observed patterns of cattle behavior under auditory stimulation.
The framework consists of four modules—auditory perception, learning and habituation, sound type and social context, and behavioral outputs—each represented by one or more equations (Equations 1–9). The final subsections describe model calibration, validation, and computational implementation.
2.2 Auditory perception
This module quantifies how stimulus frequency and amplitude influence a cow’s ability to detect and respond to sound.
2.2.1 Frequency sensitivity F(f)
models the frequency-dependent auditory sensitivity of cattle. Studies show that bovines respond most to sounds between 500 and 8000 Hz, with peak sensitivity near 1000 Hz. This aligns with audiogram data from Heffner and Heffner (1983), Boivin and Braastad (1996), and Psenka et al. (2016), and is supported by Waynert et al. (1999); Moreira et al. (2023), and Olczak et al. (2023). While audiometric data indicates peak sensitivity near 1 kHz, some behavioral studies have found heightened responsiveness to sounds in the 6–8 kHz range, likely due to differences between auditory threshold sensitivity (the lowest detectable sound pressure level) and behavioral salience (the frequency range at which sounds are most likely to provoke attention or aversive responses).
To formalize this sensitivity, the model adopts a Gaussian function centered at the optimal frequency which reflects the maximum auditory responsiveness. Defined as:
Here, is the stimulus frequency (e.g., 784 Hz in Lee et al., 2009), and defines sensitivity bandwidth, with values in the range of 500 to 1500 Hz which are considered appropriate based on the known auditory range of cattle. It peaks at and decreases symmetrically, assuming auditory sensitivity is normally distributed, which is in accordance with standard models of auditory perception.
2.2.2 Amplitude saturation S(A)
models how cattle responsiveness increases with sound amplitude, following a sigmoidal curve that reflects diminishing sensitivity at higher intensities:
is stimulus amplitude (dB), and is the midpoint where response probability reaches 0.5, typically around 70 dB. The parameter controls steepness; higher yields sharper transitions. As , nears zero; at , ; and as , approaches 1, indicating response saturation.
This logistic form reflects known sensory physiology and behavior, modeling how responsiveness plateaus at higher amplitudes. It mirrors neural response functions and logistic regressions of binary behaviors (e.g., turning or alerting) on amplitude. Studies by Brouček (2014); Waynert et al. (1999), and Ciborowska et al. (2021) show cattle react to 85–95 dB aversive sounds (e.g., shouting, clanging), while enrichment sounds fall around 65–70 dB; startling noises may exceed 110 dB. The model is further justified by recent findings in sensory neuroscience and nonlinear systems (Carandini, 2024; Perez-Flores et al., 2022).
Beyond perception, cattle behavior also depends on experience — whether they have learned to associate a cue with a boundary, or have habituated to non-reinforced signals.
2.3 Learning and habituation
This module describes how cattle form and maintain cue–boundary associations over repeated exposures.
2.3.1 Learning curve L(t)
L(t) models how cattle learn to associate stimuli—like auditory cues—with spatial boundaries over repeated exposures. This conditioned learning is key to virtual fencing. A biologically grounded form for this process is a logistic function:
In this function, represents time or exposures, controls curve steepness, and marks the point where the probability of a learned response reaches 0.5. This inflection point reflects the phase of fastest learning. The logistic form captures typical learning curves: slow initial progress, rapid acquisition around t50, then saturation. When is near zero; when , it nears one, indicating full conditioning.
An alternative expression is the exponential learning function:
This formulation solves the differential equation , assuming no decay. It models learning as a continuous, monotonic process with rapid initial gains that plateau over time. While both (exponential) and (logistic) represent learning rates, λ describes continuous acquisition, and γ controls curve steepness near the midpoint. Studies by Lee et al. (2009); Campbell et al. (2017); Verdon and Rawnsley (2020), Gadzama et al. (2024), and Hamidi et al. (2024) support both forms, showing cattle initially respond inconsistently, then progressively develop stable avoidance behavior. Logistic models suit threshold-based learning, while exponential forms fit smoother, continuous learning patterns.
2.3.2 Habituation function H(t)
models the decline in behavioral response after repeated, non-reinforced exposures. In virtual fencing, this reflects how cows gradually ignore auditory cues that lack consistent consequences. Habituation is critical in design, as unreinforced cues may lose effectiveness. A biologically grounded model for this process is exponential decay:
Here, is time or cumulative exposures, and λ is the habituation rate. At , indicating full initial response; as t increases, H(t) declines toward zero, reflecting desensitization. This exponential curve matches observed declines in response to non-reinforced stimuli and aligns with classical habituation models in ethology and neuroscience (Waynert et al., 1999; Thompson, 2009; Dissegna et al., 2021). The differential form of this model is given by:
This first-order process models a decline in responsiveness proportional to the current response level. The parameter sets the habituation rate: higher values mean faster desensitization. In cattle, repeated unreinforced stimuli (e.g., tones) lead to reduced response. In virtual fencing, tones without consequences may be ignored over time. Modeling ) is essential for maintaining effective cue-response conditioning (Varnon et al., 2012).
Behavioral responses also depend on contextual and individual factors, such as the sound type, group behavior, and personality differences.
2.4 Sound type and social context
This module incorporates variation due to sound category, herd influence, and temperament.
2.4.1 Sound-type N(n)
captures how different sound types elicit varying responses in cattle. Some sounds—like shouting or clanging—are more aversive than neutral tones. To reflect this, each sound category (e.g., “tone”, “clanging”, “shouting”) is assigned a scalar modifier . In this model, it is defined as:
Where is an empirically derived scalar representing the aversiveness of sound type n. Based on behavioral data, typical values are: , , and , as informed by Waynert et al., 1999 and Lange et al., 2020. These coefficients come from regression models fitted to cattle responses—such as movement, heart rate, or startle—to controlled sounds. This weighting reflects average behavioral disruption per sound type, allowing the model to capture meaningful differences in stimulus salience and improve behavioral predictions in diverse auditory contexts.
2.4.2 Group influence (g)
The scalar captures the influence of social context on behavior, modeling social facilitation in cattle. As herd animals, cattle often adjust responses based on nearby conspecifics, which can amplify or suppress individual reactions. Group influence is modeled as:
Here, is the average response of nearby cattle, and quantifies an individual’s susceptibility to group behavior. The multiplier scales the individual’s response, ranging from 0.8 (isolation) to 1.3 (strong mimicry). Isolated cattle are typically more cautious, while those in cohesive groups respond more readily, aligning with herd behavior. This assumes a linear relationship between group and individual responses, supported by studies in virtual fencing and cattle learning (Colusso et al., 2020; Keshavarzi et al., 2020; Aaser et al., 2022). Including g allows the model to reflect variability in herd dynamics and social positioning.
2.4.3 Personality sensitivity α
The scalar captures individual variability in behavioral sensitivity, reflecting temperament traits like reactivity or fearfulness. These traits influence how strongly cattle respond to sensory cues. Each animal is assigned an α value to represent this personality-driven responsiveness.
The range reflects temperament variation in cattle, based on studies like Burrow and Dillon (1997) and Lee et al. (2009). Values indicate less reactive animals, while signal more excitable ones. This scalar modulates motion and turn responses, scaling behavior by temperament. α values can be drawn from temperament scores, latency tests, or other validated measures. Including α captures individual differences and improves the model’s realism and predictive accuracy in simulating cattle responses to virtual fencing.
These perceptual, learning, and social factors combine to generate observable behaviors — primarily movement and turning.
2.5 Behavioral outputs
The outputs of the preceding modules combine to generate overall movement intensity and turn probability.
2.5.1 Motion response (M(t))
models the magnitude of a cow’s response—e.g., movement or alertness—to an auditory cue. It integrates multiple biologically informed components to estimate stimulus impact under varying sensory, contextual, and individual conditions. It is defined as:
Here, k1 is a gain constant calibrated to match observed response levels. The terms , , and capture effects of frequency sensitivity, amplitude, habituation, and sound type. Their product assumes independent contributions, where attenuation in any factor reduces the overall response—consistent with cattle behavior. is tuned using empirical data (e.g., step count, latency, posture change). This integrates key influences into a dynamic, interpretable model for simulating cattle responses in virtual fencing systems.
2.5.2 Turn probability (Pturn)
models the probability a cow turns or avoids in response to sound—a key behavior in virtual fencing. It is represented by a sigmoid logistic function:
In this equation, controls the slope of the sigmoid, and is the threshold at which a turn becomes likely. The term reflects group influence, while , and represent amplitude, frequency, and learning effects. The logistic form enables a smooth increase in turn probability as stimulus strength (modulated by learning and context) exceeds . When input is below θ, approaches 0; above , it nears 1. At , , marking a behavioral threshold. This structure captures how avoidance emerges gradually through perception, learning, and social cues. Parameters and can be fit from behavioral data to reflect variability in response thresholds.
2.6 Model calibration
The model converts sound frequency and amplitude into perceptual inputs that are then modulated by learning, habituation, sound aversiveness, and social context. These components jointly determine two behavioral outputs: motion response (M(t)) and turn probability (Pturn). Key control parameters include the gain constant (k1), which scales overall movement intensity, and the sigmoid steepness (k2), which defines how sharply Pturn increases near the decision threshold (θ). A higher k2 value produces abrupt behavioral transitions, while a lower value yields more gradual, uncertain responses. The threshold parameter (θ) sets the stimulus intensity required to elicit turning behavior. Individual differences are captured through the personality sensitivity scalar (α), which modifies L(t) to reflect variation in learning and responsiveness. Animals with higher α values learn more quickly and respond to weaker cues, whereas lower α values indicate slower learning and greater tolerance to repeated or weaker stimuli.
2.6.1 Parameter estimation and calibration
Behavioral parameters—including learning rate (λ, γ), habituation coefficient (h), and learning latency (d)—were estimated using a constrained fitting procedure. Initial parameter ranges were derived from published experimental data on cattle learning, auditory sensitivity, and stress physiology (see Supplementary Table S1). For each validation study, the model was applied under the same stimulus conditions (frequency, amplitude, sound type, and group size) reported in the literature. Parameters were iteratively adjusted within their biologically supported ranges until the simulated outcomes (e.g., avoidance probability, learning latency, or turn response rate) closely matched the empirical data. This procedure ensured that each fitted parameter remained biologically interpretable and empirically grounded.
2.6.2 Validation against empirical data
Model calibration and validation were performed using 20 independent behavioral and physiological studies, representing diverse acoustic conditions and herd contexts. Each dataset was fitted independently to confirm that the model could replicate key empirical patterns across different studies, breeds, and sound environments.
The final parameter set successfully reproduced observed learning rates, habituation trends, and social-facilitation effects within the confidence ranges reported in the literature. The complete list of parameters, their empirical ranges, and the behavioral or physiological rationale for each value are summarized in Supplementary Table S1.
Table 1 summarizes the empirical studies used for model calibration and validation, showing observed and model-predicted values for each behavioral component.

Table 1. Summary of validation studies associated model components, and comparison between observed and model-predicted values.
2.7 Computational environment
All analyses and simulations were conducted in Google Colab using Python 3.12.12 on a Linux-based platform (GCC 11.4.0, glibc 2.35). The following libraries were used: NumPy 2.0.2, Pandas 2.2.2, Matplotlib 3.10.0, and SciPy 1.16.3.
The complete simulation script and example data are provided in a publicly accessible GitHub repository: https://github.com/HannahJames123/Biologically-Informed-Algorithms-for-Modeling-Cattle-Response
3 Results
3.1 Model validation
Building on the framework described in Section 2, we evaluated the model’s predictive accuracy using 19 quantitative behavioral and physiological outcomes drawn from 10 peer-reviewed studies on cattle responses to auditory cues, aversive stimuli, and spatial learning—key behaviors in virtual fencing. These outcomes were simulated under the experimental conditions reported in each study (e.g., stimulus frequency, amplitude, group size), and the model’s predicted responses were then compared with the published results to assess biological validity. To generate model predictions, each study’s experimental conditions (e.g., cue frequency, amplitude, duration, group size) were input into the parameterized equations described in Section 2. The model produced predicted values for the corresponding behavioral metrics (e.g., avoidance probability, learning latency, motion ratio, turn probability). These simulated values were then compared directly with the published empirical outcomes using coefficient of determination (R²) and mean absolute percentage error (MAPE) as measures of fit. Model–data alignment was evaluated both visually (Figure 1) and numerically, with each outcome treated as an independent validation point. This procedure allowed consistent, quantitative comparison of predicted versus observed behavioral responses across all studies. The 17 validation outcomes encompassed behavioral and physiological metrics such as avoidance probability, turn success rate, learning latency, step count, heart rate change, habituation slope, social amplification ratio, and containment rate, corresponding to the measures defined in Section 2.6. Several studies reported multiple quantitative endpoints under distinct experimental conditions, while others contributed only qualitative or contextual data; therefore, 19 quantitative outcomes were derived across 10 total studies. As shown in Figure 1, model predictions aligned closely with observed values (R² = 0.998), demonstrating strong external validity across diverse behavioral domains. A study key linking each validation point in Figure 1 to its corresponding publication and behavioral measure is provided in Supplementary Table S2. While high, this predictive accuracy reflects that the model was calibrated using established behavioral functions and then tested against discrete published endpoints, rather than attempting to reproduce raw trial variability.
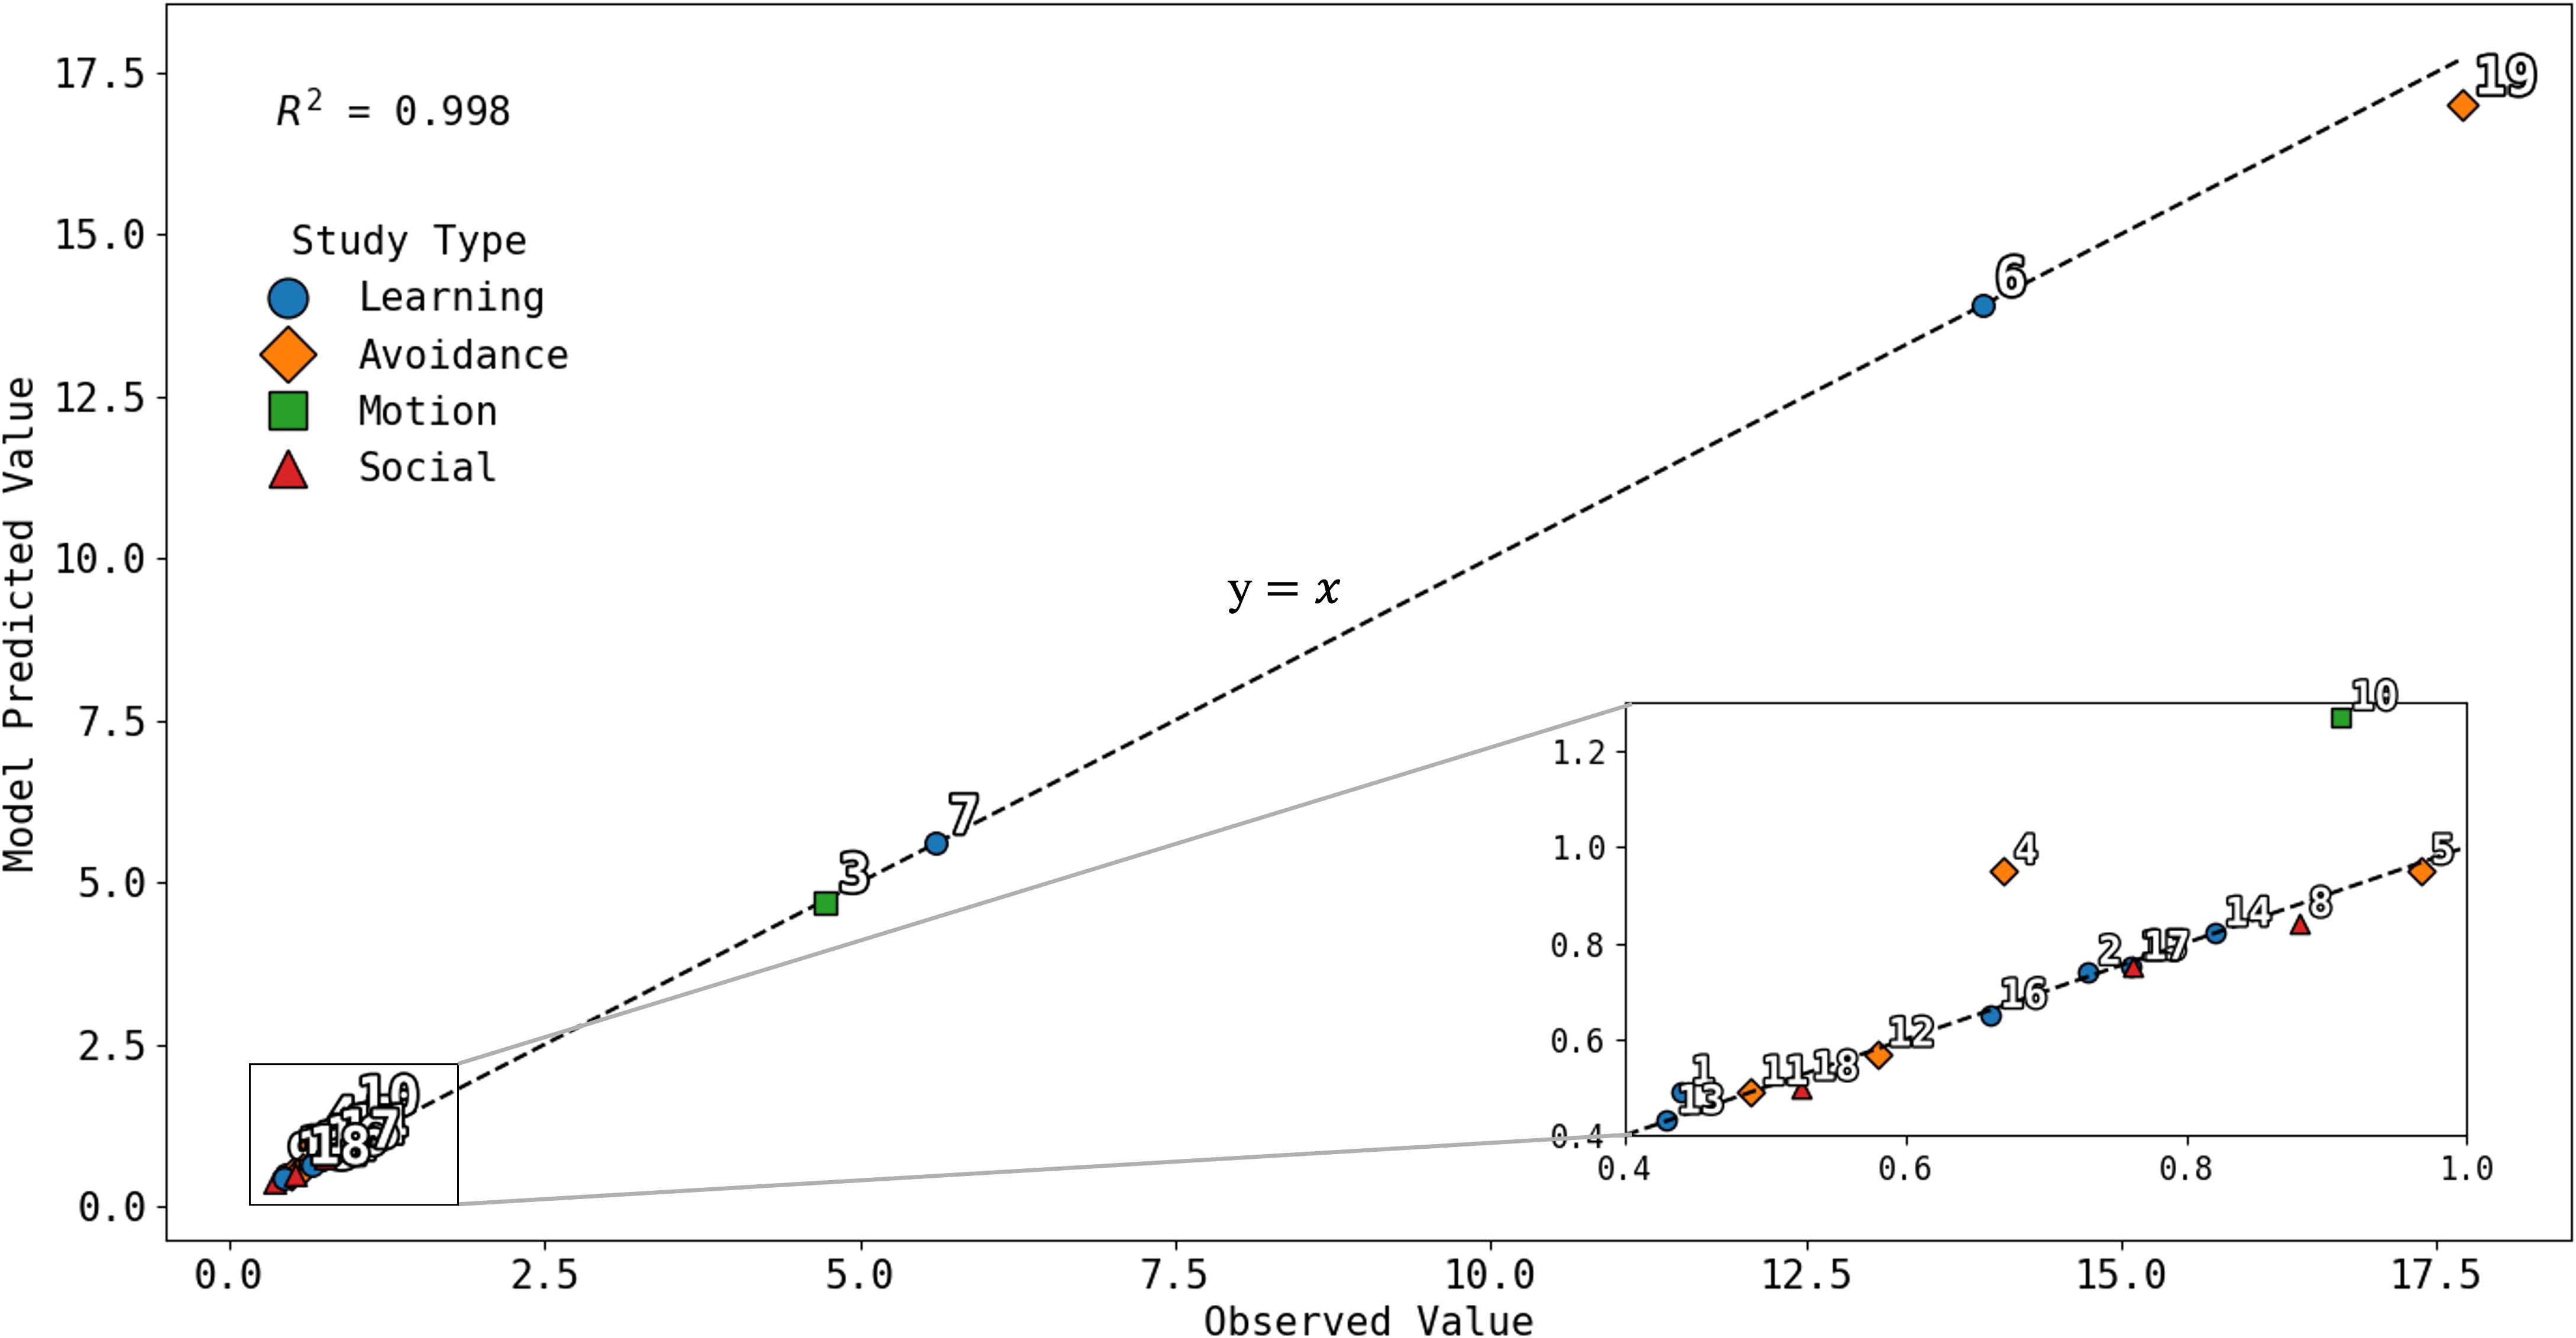
Figure 1. Observed versus model-predicted values (in the same units reported in source studies) for 19 quantitative behavioral outcomes drawn from 10 peer-reviewed studies on cattle responses to auditory cues and virtual-fencing stimuli. Each point represents a distinct published outcome paired with its corresponding model prediction under matched experimental conditions. Response types are color-coded: learning (blue), avoidance (orange), motion (green), and social (red). The dashed line indicates the 1:1 relationship (y = x). The model achieved high predictive accuracy (R² = 0.998). Numbered data points correspond to the studies listed in Supplementary Table S2.
To evaluate the robustness and interpretability of the model, we conducted a global sensitivity analysis based on partial rank correlation coefficients (PRCC; Supplementary Figure S1). The PRCC results showed that learning rate (γ), half-learning time (t50), and amplitude threshold (A50) exerted the strongest influence on model outputs (|ρ| > 0.7), consistent with their roles in shaping cue–response dynamics and auditory perception thresholds. Habituation (H) and the social facilitation multiplier (g) showed moderate effects (ρ = 0.35–0.5), whereas parameters related to noise type, temperament, and chronic stress contributed minimally (|ρ|< 0.3). Complementary one-at-a-time perturbation tests (± 20%) confirmed the model’s stability, with mean prediction variation of 12.4 ± 7.9% and no parameter producing deviations > 40%. Leave-one-study-out (LOSO) analyses yielded a median cross-study variance of 0.008 ± 0.004 in global parameter fits, demonstrating that model calibration was not dominated by any individual dataset. Together, these results indicate that the model generalizes well across behavioral contexts while remaining biologically interpretable.
It is important to note that the results in Figure 1 reflect comparisons between model predictions and published outcomes expressed in their original reported scales (e.g., percentages for avoidance, hours for learning latency, ratios for motion, probabilities for turn success), rather than normalized values, in order to preserve fidelity to the empirical literature.
These validation results demonstrate that the model accurately reproduces a wide spectrum of behavioral responses observed in empirical studies, confirming that the underlying equations capture both individual learning and socially modulated behavior.
Building on this validation, we next applied the framework in a dynamic simulation to explore how individual and group-level factors shape herd responses to virtual fencing stimuli over time.
3.2 Conceptual framework for herd simulation
To apply the validated model in a dynamic context, we simulated a herd of 50 autonomous cattle agents, each with individualized behavioral traits drawn from empirically grounded distributions. Each agent evaluated auditory cues and social inputs in real time according to the equations defined in Section 2. The virtual paddock contained a 30 m boundary, with auditory warnings initiated at 5 m and increasing in both frequency (8–13 kHz; 200 Hz m−1) and amplitude (60–85 dB; 2 dB m−1) as animals approached the fence. Individual differences were introduced via random draws for frequency sensitivity (fopt ∼ N(8000, 1000 Hz)) and temperament (α ∈ [0.7, 1.3]). Learning rate (γ), habituation rate (λ), slope (s), and threshold amplitude (A50) followed biologically validated parameter ranges. The simulation proceeded for 100 time steps, during which each cow continuously updated its learning (L(t)) and habituation (H(t)) states and computed the probability of turning (P_turn) in response to the current auditory intensity and social influence. When P_turn exceeded a stochastic threshold, the animal turned back; otherwise, it advanced toward the boundary. This dynamic implementation allowed us to assess how sensory and social factors jointly shape spatial distribution and boundary compliance over time. The simulation is governed by a set of behavioral assumptions summarized in Table 2:

Table 2. Core behavioral assumptions underlying cow agent dynamics in the virtual fence simulation.
In the simulated trials, cattle exhibited clear spatial learning and group coordination consistent with empirical observations. Most animals began turning 10–15 m before the virtual boundary, indicating effective conditioned avoidance of the auditory zone. Movement patterns stabilized where stimulus intensity supported learning without overstimulation, producing a steady boundary offset over time. Social influence promoted coordinated retreat, with groups turning nearly simultaneously and then reorienting as a herd. These outcomes replicate key behavioral trends reported in pasture-based virtual fencing studies: early avoidance conditioned by repeated cues (Lee et al., 2009; Campbell et al., 2017), enhanced responsiveness under group conditions (Colusso et al., 2020; Keshavarzi et al., 2020), and progressive improvement across repeated exposures (Hamidi et al., 2024; Nyamuryekung’e et al., 2023). Together, these patterns demonstrate that the model reproduces empirically documented learning and social dynamics, providing a predictive tool for testing alternative virtual-fencing strategies.
3.3 Simulating cow and herd behavior
To demonstrate how the biologically informed response functions generate emergent herd-level patterns, we embedded them within a spatially explicit Boid-style simulation. The equations below (Equations 12–17) describe the resulting dynamic behavior of simulated cattle as they interact under virtual-fence stimuli.
To simulate herd-level movement and behavioral contagion, we embed individual cow response functions within a spatially explicit agent-based model inspired by the classic Boid algorithm (Silva et al., 2009; Vande Moere, 2004; Hartman and Beneš, 2006). Each cow is treated as an autonomous agent whose movement is governed by three core behavioral forces: separation, alignment, and cohesion. Separation drives cows to steer away from nearby individuals to avoid crowding and potential collisions. Alignment causes cows to adjust their heading to match the average direction of their local neighbors. Cohesion encourages cows to move toward the center of mass of nearby herd members, thereby maintaining group structure.
These three forces are combined to compute the overall movement vector for each cow at time according to the equation:
Here, , , and , represent the respective weights for separation, alignment, and cohesion. is a stimulus-modulated movement vector derived from the biologically grounded response model. This incorporates directional reactivity and is oriented along , a unit vector pointing away from the stimulus, such as an auditory cue or virtual fence. At each timestep, the model also evaluates the turn probability for every cow, using the integrated response model described earlier. If exceeds a defined threshold - typically - the cow rotates its heading vector away from the fence stimulus by an angle between 45 and 90 degrees. This probabilistic turning rule enables realistic, individual-level variation in behavior and allows reactive behavior to propagate through the herd under certain conditions. Social influence is incorporated through a dynamic parameter which adjusts each cow’s sensitivity to stimuli based on the behavior of nearby herd members. Specifically, if a substantial proportion of a cow’s neighbors have recently turned, the value of increases according to the equation:
where controls the strength of social contagion. This feedback loop allows cascading avoidance, where cow decisions depend on both direct stimuli and herd reactions. The model captures emergent behaviors observed in virtual fencing trials (Jensen, 2018; Stephen et al., 2011; Sowell et al., 2000; Schein and Fohrman, 1955; Couzin et al., 2005; Hall, 2002), including synchronized turns, increased turn probability from group reinforcement, and shifts in movement M(t) based on tone frequency, amplitude, and habituation. By embedding biologically informed response functions in a boid-style spatial model, we reproduce both individual variability and realistic herd-level dynamics under virtual fencing stimuli.
Together, these equations do not introduce new model structure but illustrate the mechanisms driving the simulated outcomes shown in Figure 2—namely, synchronized turning, cascading avoidance, and realistic group reorientation consistent with empirical observations.

Figure 2. Cow positions at four time steps (Frames 0, 26, 43, 62) from the personality-driven Boid simulation (Supplementary Video 1). Colors denote roles: Leader = green, Dominant = red, Shy = purple, Normal = blue. The pale orange circle indicates the attraction goal, and red shaded zones mark the virtual-fence buffer.
3.3.1 Simulation 1: personality driven Boid simulation
We implemented the above model in a custom Python simulation to reflect realistic herd behavior under virtual fencing cues. Each cow is modeled as an agent with a 2D position and heading vector. Behavioral variation is introduced via a personality sensitivity scalar α, drawn from a Beta(6,2) distribution (Gupta and Nadarajah, 2004; McDonald and Xu, 1995), which emphasizes moderate-to-high reactivity while allowing variation. Each cow is also assigned a behavioral role—Leader, Dominant, Shy, or Normal—that affects both behavior and visualization. At each timestep t, learning L(t) and habituation H(t) are updated and used to calculate motion M(t) and turn probability. This dynamic process captures adaptive responses to cumulative exposure, allowing behavior to vary with both stimulus history and social context.
Cow movement is guided by a modified boid-based model, where each individual responds to the positions and headings of local neighbors within a 12-unit radius (Vande Moere., Hartman and Beneš, 2006; Silva et al., 2009). The classic flocking rules – separation (), alignment (), and cohesion () – are calculated and contribute to each cow’s movement vector. In addition, goal-directed behavior is implemented through a vector pointing toward a designated resource location, such as a food or water site positioned at coordinates (60, 60). Cows assigned the Leader role are more strongly attracted to this site, helping to initiate coordinated motion within the herd.
The total movement vector for each cow is then computed as:
where is the cow’s current normalized heading direction. This formulation allows the simulation to capture a realistic blend of environmental, social, and internal motivational influences on movement.
The coefficients (1.5, 1.0, 2.0, 1.8, 1.8) are empirically derived scaling factors representing the relative strength of each behavioral component. The cohesion vector (×2.0) received the largest weight to maintain group integrity, whereas separation (×1.5) prevents spatial overlap while allowing fluid movement. Alignment (×1.0) provides moderate directional coordination without enforcing rigid flocking. Goal attraction (×1.8) reflects a moderate motivational pull toward resources (e.g., food or water), consistent with the tendency of leaders to initiate group movement. The M(t) term, also scaled by 1.8, modulates responsiveness according to the adaptive learning process defined in Equations 10, 11. These coefficients were tuned through iterative pilot simulations to reproduce realistic inter-animal spacing, group cohesion, and response latency observed in Bos taurus herds (Handcock et al., 2009; Gygax et al., 2010) and should be interpreted as biologically informed behavioral gain parameters rather than fitted constants.
Behavior is regulated through a probabilistic turn mechanism. If exceeds a random threshold, the cow reverses direction. The sigmoid function is centered at θ = 0.3, giving a 50% chance of turning at that stimulus level. Above θ, turning likelihood nears 1; below, it approaches 0—capturing real-world behavioral variability. If a cow stays near the fence for over five steps, it is forced to turn, simulating reinforcement (e.g., low-energy shock or tone escalation). When most neighbors turn, gi rises to 1.3, enabling herd-wide cascades. A fence repulsion vector also activates near boundaries, increasing retreat probability. Visualization uses colored dots for roles—green (Leader), red (Dominant), purple (Shy), blue (Normal)—with orange showing goals and red indicating virtual fence zones (Figure 2).
As shown in Figure 2, the Boid algorithm’s separation and limited cohesion parameters caused the herd to gradually disperse over time, even as some individuals remained oriented toward the goal. Early clustering (Frame 0) transitioned to broader spacing and more variable orientations by Frame 62. This Python model generates dynamic visualizations of herd behavior and responses to virtual fencing cues. Learning and habituation modulate movement, while local alignment and goal attraction shape coordinated motion. However, limited sensory range and personality differences can lead to dispersed but stable formations. Such spread is typical of decentralized systems like boid models and mirrors realistic animal spacing under low-stimulus conditions.
3.3.2 Simulation 2: cloud-form herd motion with visual synchronization
Alongside the biologically detailed model, we built a second simulation to replicate the “cloud-like” motion seen in drone footage of grazing cattle. This version shifts focus from internal states to emergent group behavior, emphasizing visual alignment and smooth collective movement. Instead of modeling learning or sensory response, it captures large-scale spatial dynamics. The simulation initializes 120 cows clustered in the upper-middle field, with slight variation in heading and speed. Movement is driven by classic boid rules: separation prevents crowding (strong repulsion within 4 units), alignment causes cows to match heading within 16 units, and cohesion gently pulls cows toward local center, preserving herd structure.
A fourth component, directional movement, is introduced through a time-activated vector , where scales over time, and is a fixed direction vector pointing toward a target area in the lower portion of the field. This directional influence is initially dormant but becomes active after the 7-second mark, gradually increasing in strength as the simulation progresses.
The full movement vector for each cow is computed as a weighted combination of these four components, with time-varying influence:
Here the weights and are adjusted dynamically over the simulation’s 34-second window, enabling the herd to transition through distinct behavioral phases.
In Phase I (0–7 seconds), cows drift forward with loose spacing and little coordinated direction, reflecting an early-stage herd. In Phase II (7–20 seconds), cows begin turning toward the lower corner of the field, with variation in individual rotation angles to reflect natural differences in movement. During Phase III (20–28 seconds), alignment forces increase, causing the herd to compact and move more cohesively, mimicking real-world acceleration and group coherence. In Phase IV (28–34 seconds), cohesion decreases, and a dispersal vector prompts cows to spread out in a loosely coordinated exit pattern. Additional behaviors enhance realism. Cows pause intermittently to graze, especially in early phases, with the probability of pausing decreasing over time. Small angular deviations (up to ±25° per timestep) add natural variation to paths. A smoothing factor blends 85% of each cow’s previous heading with 15% of the new direction, ensuring gradual, fluid motion.
Unlike the earlier stimulus-driven models, this simulation does not use turn probabilities or sensitivity functions. Instead, cow movement is governed by scheduled phases and local proximity rules, enabling flexible tuning and calibration against drone footage. To validate the model, we rendered the simulation alongside real-world footage for direct comparison. The output aligned well with key metrics: timing and angle of reorientation, compaction during the turn, and final dispersal patterns. This match confirms the model captures both the visual flow and structure of natural herd behavior under non-stimulus-driven conditions (see Supplementary Video S1). A simulation screenshot appears in Figure 3.

Figure 3. Cow positions at four timesteps from Supplementary Video 2 of side-by-side comparison between real-world herd movement and simulated cloud-like motion: Frame 0, Frame 641, Frame 1213, and Frame 1797. Left: Drone footage of a cattle herd exhibiting coordinated movement across a pasture (Jones, 2019). Right: Output from the “Cloud-Like Motion” simulation, showing 120 agent-based cows governed by local separation, alignment, cohesion, and a time-dependent directional drift. The simulation replicates the group’s spreading, turning, and density-shifting behavior to visually match the observed dynamics.
To quantitatively compare the simulated herd to drone footage, we used frame-wise group dispersion which is the mean Euclidean distance of animals to the herd centroid per frame. In the simulation, blue boids were segmented via HSV masking; in the aerial video, cow centroids were extracted using adaptive thresholding. The two videos were trimmed to equal length of 2,040 synchronized frames (≈ 1.1 min at 30 fps)—, smoothed with a Savitzky–Golay filter (window = 31, poly = 3), and compared via Pearson correlation, yielding strong agreement (r = 0.86). This indicates the model captures the herd’s tightness and spread over time. This cloud-style simulation supports the view that herd-wide behavioral coherence can arise from simple time-staged rules and local forces, even without individualized personality or explicit auditory stimulus modeling.
3.3.3 Simulation 3: extension toward differential equation based dynamics
While previously described agent-based simulations were grounded in biologically calibrated rules, we now present an equivalent differential equation formulation that enables a continuous-time perspective on herd motion. This bridges our simulation with feedback control theory and enables real-time behavior modulation via continuous system dynamics. We integrate in discrete time with Δt = 0.2 s and take 500 steps as one simulated “day” for rate metrics.
The state of each cow at time is defined by its position and velocity ,governed by the standard kinematic system:
Each cow is in one of three behavioral states: Grazing, Walking, or Reacting. These states modulate movement speed, the relative influence of various forces, and exposure to biologically inspired stimuli. Upon entering the Reacting state, cows experience a cooldown period, which suppresses sensitivity to further stimuli and reflects natural ethological recovery.
The total acceleration vector is calculated as a weighted combination of biologically grounded forces:
Each force reflects an ethological mechanism: enforces personal space (Couzin et al., 2005), promotes local cohesion (Couzin et al., 2005), and aligns heading with neighbors (Hartman and Beneš, 2006). captures pairwise social ties (Schein and Fohrman, 1955; Colusso et al., 2020), and directs cows toward preferred grazing zones (Hamidi et al., 2024). Fence avoidance is modeled by , driven by aversion to auditory cues (Aaser et al., 2022). We implement an auditory-first cue→shock policy: an audio cue is issued on first entry into the 16-unit warning band; after a brief grace window of 4 steps (≈0.8 s), a short electric pulse may be delivered once per cue only if the animal (i) remains in the warning band and (ii) is still moving toward the nearest boundary (dot-product criterion). Each shock starts a refractory period of 10 steps (≈2 s). Escalation probabilities are phase-specific and adapted online by a simple feedback controller: during training (first 30% of timesteps) the controller scales the escalation probability to target ~1–6.5 shocks·cow−1·day−1; during post-learning it is bounded so that only ~10–30% of cues escalate and the rate targets ~0.06–0.12 shocks·cow−1·day−1 (audio remains primary; pulses are a minority) (e.g., Aaser et al., 2022; Umstatter et al., 2013; Campbell et al., 2017; Nyamuryekung’e et al., 2023). Calibration targets: training ≈ 1–6.5 shocks·cow−1·day−1; post-learning ≈ 0.06–0.12 shocks·cow−1·day−1, with ~10–30% of cues escalating. introduces individual variability in movement (González et al., 2015). Exploratory drive M(t) (Equation 8) integrates auditory frequency response F(f) (Equation 1), amplitude saturation S(A) (Equation 2), habituation H(t) (Equation 4), and noise type N(n) (Equation 5), scaled by gain k1. Turn probability is given by Equation 9, which combines stimulus salience, frequency sensitivity, and learning L(t) (Equation 3) with group influence gi (Equation 6) and individual threshold θ. Behavioral states apply different force weightings. Grazing cows move slowly toward food (). Walking cows rely on alignment, cohesion, and wander forces. Reacting cows are strongly influenced by separation and fence repulsion, triggered by high , accumulated arousal, prolonged fence exposure, or cue-gated electric reinforcement, and is followed by a short cooldown (refractory) period. Arousal accumulates over time via neighbor influence as follows:
When or the fence exposure time exceeds the reaction threshold the cow transitions into the Reacting state. After this episode, it enters a cooldown period to suppress rapid re-entry and emulate stress adaptation cycles.
The full system is solved using forward Euler integration:
This continuous-time simulation, built from Equations 1-9, combines biologically grounded functions with a control-based framework and an auditory-first cue then shock cue policy: after a brief grace window (0.8 s), a short electric pulse may be delivered only if the animal remains near and continues approaching the boundary, followed by a 2 s refractory period. It generates trajectories that respond to auditory cues, electric reinforcement, fence proximity, and social dynamics, supporting both research and welfare applications. Figure 4 shows the output: cows are color-coded by state—green (Grazing), blue (Walking), red (Reacting). Herd motion reflects the combined effects of sensory input, social influence, and real-time updates, capturing realistic spacing, avoidance, and behavioral transitions consistent with cattle physiology and behavior. For 60 animals and one simulated day (500 steps), we observed 55 cues and 25 shocks (18 training, 7 post-learning). Training shocks were ~1.00 shocks·cow−1·day−1 (within the target band). Post-learning shocks were ~0.167 shocks·cow−1·day−1 with ~24% of cues escalating—within the 10–30% cue-escalation band and slightly above the 0.06–0.12 shocks·cow−1·day−1 target due to the deliberate probe bias (tunable via controller bounds).

Figure 4. Cow positions at four timesteps from Supplementary Video 3 of the biologically informed differential equation simulation: Frames 0, 15, 111, and 124. Each frame corresponds to 0.2 s of simulated time; with STEPS = 500 the run spans 100 s, and Supplementary Video 3 (saved at 25 fps) plays in 20 s (i.e., 5× time-compressed); the “500 steps ≈ 1 day” convention is used only to normalize rate metrics (e.g., shocks·cow−1·day−1) and does not imply a real-time 24-hour rendering. Each animal’s position and velocity evolve through continuous-time dynamics influenced by biologically grounded forces representing grazing drive, social cohesion, personal space, and fence avoidance. Red-tinted margins denote the fence warning band (width = 16 units); light-green rectangles are resource-rich grazing patches. Behavioral states—grazing (green), walking (blue), and reacting (red)—emerge from interactions between an auditory warning cue (8 kHz tone at ~80 dB, issued on first entry into the red warning band; after a 0.8 s grace window a pulse may occur only if the cow remains near and keeps moving toward the boundary), accumulated social arousal, and the environmental context of a square paddock with red-tinted fence margins and three resource-rich grazing patches. Overlays: yellow rings mark active cue windows; magenta “×” marks electric shocks (at most one per cue, delivered after a 0.8 s grace window and followed by a 2 s refractory; escalation requires continued movement toward the nearest boundary). Representative run (500 steps ≈ 1 day, seed = 42): 55 cues and 25 shocks (18 training, 7 post); escalation 45.5% overall (training 69.2%, post 24.1%); shocks·cow−1·day−1 = 1.00 during training (target 1–6.5) and 0.167 post-learning (target 0.06–0.12); 19/60 cows received ≥1 shock.
Building on the validated simulation framework, we next applied the model to a representative case study designed to test its predictive capacity under field-like conditions. This case study demonstrates how the integrated behavioral equations can be used to explore management-relevant scenarios in virtual fencing design.
3.3.4 Case study application: field-scale virtual fencing scenario
To test the robustness of the biologically informed control framework, we explored five alternative scenarios, each a variant of Simulation 3, in addition to the baseline configuration.
Each simulation comprised 500 discrete time steps (Δt = 0.2 s), corresponding to ~100 s of simulated behavior. The training phase spanned 30% of total duration (150 steps), followed by a post-learning phase (350 steps). Adaptive gain control maintained biologically realistic escalation probabilities, targeting 1.0–6.5 shocks·cow−1·day−1 during training and 0.06–0.12 shocks·cow−1·day−1 during post-learning. When observed shock rates fell outside these ranges, the model adjusted escalation probability multiplicatively (GAIN_UNDER = 1.10; GAIN_OVER = 0.92) to restore equilibrium. Learning rate and habituation were governed by γ = 0.1, t50 = 25, and λ = 0.05, parameters that shape the sigmoid learning curve and gradual decline in responsiveness over time.
Scenario 1 – baseline: This represents the standard model configuration with a 16-unit warning zone, typical auditory cue parameters (~8 kHz at ~80 dB), and full social cohesion among animals. It serves as the reference for all comparative analyses.
Scenario 2 – cue_only_post: In this scenario, electric shocks were disabled after the initial training period, allowing auditory cues alone to maintain compliance. This represents a system where cattle have already learned the cue–boundary association and rely solely on non-aversive signals for containment.
Scenario 3 – low_salience: Cue detectability was reduced by lowering amplitude and flattening the sigmoid response slope, mimicking situations where environmental noise, wind, or vegetation may mask auditory cues. This scenario tests how reduced perceptual salience affects learning persistence and post-training compliance.
Scenario 4 – temptation_edge: A high-quality forage patch was introduced within the fence warning zone to simulate behavioral conflict between resource attraction and avoidance learning. This configuration examines whether strong external incentives can override conditioned virtual-fence avoidance.
Scenario 5 – no_bonds: Social-pairing effects were removed, reducing group cohesion and making individual animals behave independently of herd influence. This scenario evaluates the stabilizing role of social facilitation in maintaining group-level compliance.
Scenario 6 – narrow_band: The warning-zone width was reduced from 16 to 10 units, testing how spatial compression affects cue frequency, escalation rates, and overall system efficiency. A narrower warning zone challenges animals to respond more precisely to cues, revealing potential trade-offs between fence compactness and control reliability.
Outputs from these simulations are provided as Supplementary Videos 4a–e, corresponding to the baseline, cue-only, low-salience, temptation-edge, no-bonds, and narrow-band conditions, respectively. To compare how model assumptions influenced outcomes, we summarized key performance metrics across the baseline and alternative scenarios derived from Simulation 3 (Table 3).

Table 3. Median results (across five random seeds) for Simulation 3 scenarios, showing cue frequency, shock incidence, escalation rates, and normalized shock delivery rates during training and post-learning phases.
Across five independent random-seed replicates, variation among runs was modest: median post-learning shock rates differed from the baseline by 0.071 ± 0.023 shocks·cow−1·day−1 (95% CI [0.037, 0.104]), and overall escalation rates by 4.2 ± 1.5 percentage points (95% CI [2.1, 6.4]). These differences fall within expected biological variation and indicate that model outcomes are statistically robust to stochastic variability and parameter perturbation.
Figure 5 illustrates how shocks and escalation rates varied across the six simulated scenarios derived from Simulation 3. Panel (a) compares training versus post-learning shocks per cow per day (median, IQR). As expected, training values were consistently higher than post-learning, reflecting initial exposure followed by adaptation to the fence system. Scenarios such as temptation_edge and low_salience maintained higher post-learning shocks relative to the baseline, consistent with added challenges from resource placement or cue detectability. By contrast, the cue_only_post scenario eliminated post-learning shocks entirely. Panel (b) shows the overall escalation rate (audio cue → shock) across scenarios. While most conditions clustered around 35–40%, escalation was markedly lower in cue_only_post - due to shocks being delivered only during training - and slightly elevated in narrow_band, highlighting how fence geometry and cue reliability can shift learning outcomes. Together, these results confirm that the biologically informed control framework is sensitive to environmental manipulations while remaining robust in reproducing realistic patterns of adaptation.

Figure 5. Outcomes from six scenarios based on Simulation 3. (a) Shocks per cow per day during training (purple) and post-learning (teal), shown as medians with interquartile ranges (IQR). Training shocks are consistently higher, with temptation_edge and low_salience sustaining elevated post-learning rates, while cue_only_post eliminates post shocks entirely. (b) Overall audio→shock escalation rates (%), with most scenarios near 35–40%. Escalation is lowest under cue_only_post and highest under narrow_band, reflecting how fence geometry and cue salience influence learning.
4 Discussion
These equations and simulations integrate auditory perception, learning, habituation, and social facilitation into an algorithm that replicates cattle responses to virtual fencing. All parameter values underpinning these processes were empirically derived from published behavioral and physiological studies and are summarized in Supplementary Table S1, providing the empirical foundation for each functional relationship. Modeled outputs match behavioral patterns observed in studies (Lee et al., 2009; Waynert et al., 1999; Campbell et al., 2017; Colusso et al., 2020), confirming that biologically grounded equations can mirror real-world stimulus-response dynamics. The mathematical terms used in the model correspond directly to measurable behavioral and cognitive processes. The learning rate (γ) and half-learning time (t50) represent the pace and midpoint of associative conditioning, describing how rapidly cattle acquire a connection between auditory cues and spatial boundaries. The habituation coefficient (H) governs response decay with repeated exposure, mirroring reductions in physiological arousal and approach motivation as stimuli become familiar. The amplitude threshold (A50) and slope (s) in the sigmoid auditory response curve define perceptual sensitivity and discrimination—indicating the sound intensity at which cues become detectable and how sharply responsiveness increases around that point. The social facilitation factor (g) quantifies how neighbouring cattle influence each other’s responses, reproducing group synchrony and social contagion observed in real herds. Together, these parameters capture how perception, learning, and social context jointly determine the probability of avoidance or compliance. The model integrates sensitivity to frequency, amplitude, sound type, and social cues, to enhance ecological validity, while its learning and habituation functions allow adaptive responses to emerge over time (Hamidi et al., 2024; Varnon et al., 2012). his biologically grounded structure enables the model to reproduce core behavioral transitions observed in empirical studies: rapid initial learning followed by stable avoidance and gradual habituation, consistent with conditioning theory and neural models of sensory adaptation. The model incorporates sigmoid learning and turn probability curves to represent behavioral thresholds that shift with individual experience, herd influence, and stimulus salience. This formulation mirrors nonlinear, probabilistic decision-making observed in animals (Gibbons et al., 2009; Aaser et al., 2022).
Model predictions align with observed trends from commercial systems such as Vence, eShepherd, Halter, and NoFence (Boyd et al., 2022; Lees et al., 2024; Verdon et al., 2024; Harland et al., 2025). In our simulations, shock frequency declined sharply after the training phase while remaining nonzero in the post-learning phase, mirroring field reports of reduced but persistent enforcement. Unlike rigid rule-based platforms, our approach simulates behavior as a flexible, probabilistic function of cognitive and sensory factors, offering potential benefits for welfare-focused designs (Umstatter et al., 2009; Moreira et al., 2023). The model also aligns with external frameworks: its learning function parallels Bayesian updating (McNamara et al., 2006), the motion equation echoes stochastic differential approaches (Preisler et al., 2004), and the turn probability formulation (Equations 7-9) follows collective behavior threshold models (Sumpter, 2006; Giardina, 2008). Saturation dynamics resemble auditory neuroscience models (Carandini, 2024), and although machine learning tools classify livestock behavior effectively (Kleanthous et al., 2018), our interpretable, mechanism-driven approach provides a transparent platform for hypothesis testing and system design. However, the model currently omits tactile and visual stimuli, and assumes uniform sound propagation, neglecting environmental factors like wind or terrain (Mota-Rojas et al., 2024; Brouček, 2014). While the personality scalar captures temperament, richer individual histories and social positioning could further improve realism (Olczak et al., 2023).
Beyond its theoretical contributions, this modeling framework provides practical guidance for the design and tuning of auditory cue systems in virtual fencing. Because the model explicitly links cue amplitude (A) to motion response, it can be used to identify parameter combinations that maintain high compliance while minimizing distress. In Simulation 3, cue duration and escalation timing (approximately 0.8–2.4 s auditory window, ~3 s reaction delay) produced stable learning rates and low post-training escalation, indicating that brief, predictable cues are most effective for conditioning. These results suggest that optimal learning occurs when cues are brief (≤ 2 s), delivered at consistent intervals, and escalate only when movement toward the boundary persists beyond the cue window—conditions that reduce unnecessary exposure while preserving control efficiency. The framework can also be extended to test adaptive cue schedules, such as gradually reducing cue frequency once avoidance behavior stabilizes, or varying tone sequences to prevent desensitization. By simulating thousands of behavioral trajectories under controlled conditions, the model enables welfare-focused optimization before field deployment—helping manufacturers and researchers to calibrate devices that operate within safe auditory limits while maintaining effective containment.
From an animal-welfare perspective, the model also provides insight into how acoustic stimuli can be optimized to reduce stress while maintaining effective containment. Domestic cattle (Bos taurus) hear across approximately 23 Hz–37 kHz, with functional sensitivity extending into ultrasonic ranges (Lenner et al., 2025). Their hearing threshold lies near 85–90 dB SPL, with exposure above ≈ 110 dB capable of causing auditory tissue damage. These boundaries align with the World Organization for Animal Health (WOAH) guidelines, which recommend that “exposure of cattle to sudden or loud noises should be minimized where possible to prevent stress and fear reactions,” and that machinery and equipment be operated so as to “cause the least possible amount of noise” (WOAH Terrestrial Animal Health Code, Ch. 7.9, 2023). In our model, amplitude–response functions were parameterized below these welfare thresholds, ensuring that simulated auditory cues remained within documented tolerance ranges. While absolute sound levels define safe exposure limits, the temporal pattern and predictability of cue delivery ultimately determine whether virtual fencing promotes learning or induces stress. Controlled repetition of cues promotes predictability and learning, yet excessive or poorly timed repetition can produce learning fatigue—a reduction in attention or responsiveness to the cue caused by overstimulation. As Fisher and Cornish (2022) note, repetitive exposure without meaningful reinforcement can result in cue desensitisation, while overly frequent or abrupt cues may elevate physiological stress and compromise welfare. Habituation generally benefits welfare when it reduces unnecessary arousal, but if auditory stimuli remain intense, inescapable, or unpredictable, animals may experience chronic stress rather than adaptation. Moreover, As Fisher and Cornish (2022) emphasize that welfare risks are greatest during the learning phase, before cattle establish the cue–boundary association. Inexperienced animals may receive multiple shocks before learning the contingency, leading to transient stress or fear responses. Rapid learning—facilitated by clear predictability and consistent cue timing—is therefore essential to welfare. Individual variation in temperament, age, breed, and prior experience also modifies welfare outcomes: calmer or previously trained cattle habituate faster, while highly reactive individuals may require longer adaptation periods. Overexposure to cues without meaningful reinforcement can induce cognitive fatigue or apathy, whereas socially facilitated learning (e.g., through herd observation) reduces shock frequency and improves welfare outcomes. In the long term, the review identifies predictability, controllability, and social learning as the three key determinants of humane virtual-fencing systems. Chronic stress is most likely when cues or shocks occur unpredictably, when fence boundaries move frequently, or when animals have limited ability to control exposure. Welfare is optimized when cattle can reliably avoid aversive events by responding to consistent cues, with sufficient rest intervals to prevent overstimulation. These principles are directly reflected in our model, where the habituation parameter (λ) represents the balance between sensory fatigue and adaptive learning. Together, these insights reinforce that effective virtual-fencing systems must regulate cue frequency, intensity, and boundary stability to maintain responsiveness while preventing chronic stress—consistent with international animal-welfare standards and empirical evidence from field studies.
While this modeling framework captures empirically grounded patterns of perception, learning, and social behavior, several limitations warrant acknowledgment. First, the analysis relies on secondary behavioral and physiological data drawn from diverse studies (Supplementary Table S1), and no direct experimental testing of model predictions has yet been conducted under controlled field conditions. Consequently, although validation against independent datasets supports the model’s accuracy, experimental replication with live animals is needed to confirm its predictive reliability. Second, the model currently represents auditory cues in isolation and assumes uniform sound propagation and perception across environments, omitting potential effects of terrain, wind, or background noise on cue detectability. Third, parameterization is based primarily on Bos taurus data and may not fully capture breed-specific or management-related variability, particularly for Bos indicus or crossbreds managed in tropical systems. Finally, the virtual cattle agents learn individually but do not yet integrate dynamic social hierarchy or leadership changes observed in real herds. These constraints highlight the need for continued refinement and empirical testing, including cross-breed trials and welfare monitoring, to ensure that virtual fencing technologies informed by this model perform robustly across production contexts.
Overall, this framework advances existing behavioral models of virtual fencing by unifying sensory, cognitive, and social mechanisms within a single interpretable system. Previous approaches have focused either on empirical response data (e.g., Lee et al., 2009; Campbell et al., 2017) or on data-driven classifiers without explicit behavioral structure (e.g., Kleanthous et al., 2018). By combining the strengths of both, our model bridges computational ethology and applied livestock management, offering a mechanistic basis for refining welfare-oriented virtual-fencing technologies and guiding future experimental design.
5 Conclusion
This work introduces a biologically grounded modeling framework that advances virtual fencing beyond traditional rule-based systems. By integrating core elements of animal cognition—such as auditory perception, learning, habituation, and social facilitation—the model generates adaptive, probabilistic behavior that mirrors known patterns of cattle response. It captures threshold effects and nonlinear dynamics that shift with individual experience and social context, offering improved ecological validity and predictive capacity compared to rule-based virtual fencing algorithms that lack learning and social terms. The framework’s ability to replicate observed behavior trends—such as increased responsiveness over time, evidenced by the decline in shock frequency from training to post-learning phases (Table 3; Figure 5), and heightened group influence, illustrated by clustered state transitions driven by arousal contagion (Supplementary Video 3) —validates its utility for simulating real-world herd dynamics. Together, these validation steps—from alignment with published behavioral studies to convergence with commercial system outcomes—confirm the robustness of the modeling approach. Unlike black-box machine learning or rigid deterministic models, this transparent, mechanism-based approach facilitates hypothesis testing, system design, and scenario exploration. To further enhance realism, future extensions should incorporate multisensory inputs, refine spatial sound propagation, and introduce energy constraints or physiological feedback. Richer representations of personality, memory, and spatial social networks may also improve individual differentiation within the herd.
By reliably capturing key aspects of cattle behavior, the framework lays a strong foundation for next-generation virtual fencing systems—tools capable of adapting to behavioral complexity while promoting both effectiveness and animal welfare. More than just a simulation tool, this framework serves as a methodological bridge between behavioral science and precision livestock management—and a platform for future innovation in welfare-centered agricultural technologies.
Data availability statement
The original contributions presented in the study are included in the article/Supplementary Material. Further inquiries can be directed to the corresponding author.
Author contributions
HJ: Conceptualization, Methodology, Writing – review & editing, Investigation, Validation, Writing – original draft, Software, Formal analysis, Visualization. MPer: Conceptualization, Investigation, Data curation, Writing – review & editing. HA: Conceptualization, Writing – review & editing. JG: Resources, Writing – review & editing, Funding acquisition, Supervision, Project administration, Validation. MPec: Supervision, Writing – review & editing, Conceptualization, Methodology. DE: Writing – review & editing, Conceptualization, Resources, Project administration, Funding acquisition, Supervision.
Funding
The author(s) declare financial support was received for the research and/or publication of this article. We thank the Bezos Earth Fund for providing financial support for this project. This research was also supported by the USDA National Institute of Food and Agriculture (NIFA) Farm of the Future project # 2023-77038-38865.
Conflict of interest
The authors declare that the research was conducted in the absence of any commercial or financial relationships that could be construed as a potential conflict of interest.
The author(s) declared that they were an editorial board member of Frontiers, at the time of submission. This had no impact on the peer review process and the final decision.
Generative AI statement
The author(s) declare that Generative AI was used in the creation of this manuscript. Generative AI tools (ChatGPT, OpenAI, 2025) were used to support language editing and to assist with formatting tasks such as drafting section summaries, refining figure captions, and polishing grammar and flow. The authors reviewed, revised, and take full responsibility for all content, analyses, and conclusions presented in the manuscript.
Any alternative text (alt text) provided alongside figures in this article has been generated by Frontiers with the support of artificial intelligence and reasonable efforts have been made to ensure accuracy, including review by the authors wherever possible. If you identify any issues, please contact us.
Publisher’s note
All claims expressed in this article are solely those of the authors and do not necessarily represent those of their affiliated organizations, or those of the publisher, the editors and the reviewers. Any product that may be evaluated in this article, or claim that may be made by its manufacturer, is not guaranteed or endorsed by the publisher.
Supplementary material
The Supplementary Material for this article can be found online at: https://www.frontiersin.org/articles/10.3389/fanim.2025.1708415/full#supplementary-material
References
Aaser M. F., Staahltoft S. K., Korsgaard A. H., Trige-Esbensen A., Alstrup A. K. O., Sonne C., et al. (2022). Is virtual fencing an effective way of enclosing cattle? Personality, herd behaviour and welfare. Animals 12, 842. doi: 10.3390/ani12070842
Bishop-Hurley G. J., Swain D. L., Anderson D. M., Sikka P., Crossman C., and Corke P. (2007). Virtual fencing applications: Implementing and testing an automated cattle control system. Comput. Electron. Agric. 56, 14–22. doi: 10.1016/j.compag.2006.12.003
Boivin X. and Braastad B. O. (1996). Cattle behaviour and the human–animal relationship: Variation, factors and consequences in breeding. INRA Prod. Anim. 9, 117–129. Available online at: https://www.researchgate.net/publication/238750188 (Accessed November 25, 2025).
Boyd C. S., O’Connor R., Ranches J., Bohnert D. W., and Bates J. D. (2022). Virtual fencing effectively excludes cattle from burned sagebrush steppe. Rangeland Ecol. Manag 81, 55–62. doi: 10.1016/j.rama.2022.01.001
Brouček J. (2014). Effect of noise on performance, stress, and behaviour of animals. Vet. Med. 59, 1–13.
Burrow H. M. and Dillon R. D. (1997). Relationships between temperament and growth in a feedlot and commercial carcass traits of Bos indicus crossbreds. Aust. J. Exp. Agric. 37, 407–411. doi: 10.1071/EA96148
Butler Z., Corke P., Peterson R., and Rus D. (2006). From robots to animals: Virtual fences for controlling cattle. Int. J. Robot. Res. 25, 485–508. doi: 10.1177/0278364906065375
Campbell D. L. M., Lea J. M., Farrer W. J., Haynes S. J., and Lee C. (2017). Tech-savvy beef cattle? How heifers respond to moving virtual fence lines. Animals 7, 72. doi: 10.3390/ani7090072
Campbell D. L. M., Lea J. M., Haynes S. J., Farrer W. J., Leigh-Lancaster C. J., and Lee C. (2018). Virtual fencing of cattle using an automated collar in a feed attractant trial. Appl. Anim. Behav. Sci. 200, 71–77. doi: 10.1016/j.applanim.2017.12.002
Carandini M. (2024). Sensory choices as logistic classification. Neuron 112, 2854–2868.e1. doi: 10.1016/j.neuron.2024.06.016
Ciborowska P., Michalczuk M., and Bien D. (2021). The effect of music on livestock: Cattle, poultry and pigs. Animals 11, 3572. doi: 10.3390/ani11123572
Colusso P. I., Clark C. E. F., and Lomax S. (2020). Should dairy cattle be trained to a virtual fence system as individuals or in groups? Animals 10, 1767. doi: 10.3390/ani10101767
Couzin I. D., Krause J., Franks N. R., and Levin S. A. (2005). Effective leadership and decision-making in animal groups on the move. Nature 433, 513–516. doi: 10.1038/nature03236
Crouch K., Evans B., and Montrose V. T. (2019). The effects of auditory enrichment on the behaviour of dairy cows. Animals 9, 1031.
Dissegna A., Turatto M., and Chiandetti C. (2021). Context-specific habituation: A review. Animals 11, 1767. doi: 10.3390/ani11061767
Fisher A. and Cornish A. (2022). Independent scientific literature review on animal welfare considerations for virtual fencing (Department of Agriculture, Fisheries and Forestry). Available online at: https://www.agriculture.gov.au/agriculture-land/animal/welfare/awtg (Accessed November 25, 2025).
Fuchs P., Stachowicz J., Schneider M. K., Probo M., Bruckmaier R. M., Umstätter C., et al. (2024). Stress indicators in dairy cows adapting to virtual fencing. J. Anim. Sci. 102, skae024. doi: 10.1093/jas/skae024
Gadzama I. U., Asadi H., Hina Q., and Ray S. (2025). Influence of virtual fencing technology in cattle management and animal welfare. Ruminants 5, 21. doi: 10.3390/ruminants5020021
Giardina I. (2008). Collective behavior in animal groups: theoretical models and empirical studies. HFSP J. 2, 205–219. doi: 10.2976/1.2961038
Gibbons J., Lawrence A., and Haskell M. (2009). Responsiveness of dairy cows to human approach and novel stimuli. Appl. Anim. Behav. Sci. 116, 163–173. doi: 10.1016/j.applanim.2008.08.009
González L. A., Bishop-Hurley G. J., Handcock R. N., and Crossman C. (2015). Behavioural classification using motion sensors in cattle. Comput. Electron. Agric. 110, 91–102. doi: 10.1016/j.compag.2014.10.018
Grumett D. and Butterworth A. (2022). Electric shock control of farmed animals: Welfare review and ethical critique. Anim. Welf 31, 373–385. doi: 10.7120/09627286.31.4.006
Gupta A. K. and Nadarajah S. (2004). Handbook of Beta Distribution and its Applications (Boca Raton: CRC Press).
Gygax L., Neisen G., and Wechsler B.(2010). Socio-spatial relationships in dairy cows. Ethology 116, 10–23. doi: 10.1111/j.1439-0310.2009.01708.x
Hall S. J. G. (2002). “Behaviour of cattle,” in The Ethology of Domestic Animals: An Introductory Text. Ed. Jensen P. (CABI: CAB International), 131–145.
Hamidi D., Grinnell N. A., Komainda M., Wilms L., Riesch F., Horn J., et al. (2024). Training cattle for virtual fencing: Different approaches to determine learning success. Appl. Anim. Behav. Sci. 273, 106220. doi: 10.1016/j.applanim.2024.106220
Handcock R. N., Swain D. L., Bishop-Hurley G. J., Patison K. P., Wark T., Valencia P., et al.(2009).Monitoring animal behaviour and environmental interactions using wireless sensor networks, GPS collars and satellite remote sensing. Sensors 9, 3586–3603. doi: 10.3390/s90503586
Harland A. J., Novais F. J., Durunna O. N., Fitzsimmons C. J., Church J. S., and Bork E. W. (2025). Evaluation of the nofence system in Canada. Smart Agric. Technol. 10, 100713. doi: 10.1016/j.atech.2024.100713
Hartman C. and Beneš B. (2006). Autonomous boids. Comput. Animat. Virtual Worlds 17, 199–206. doi: 10.1002/cav.123
Heffner R. S. and Heffner H. E. (1983). Hearing in large mammals: Sound-localization acuity in cattle (Bos taurus) and goats (Capra hircus). Behav. Neurosci. 97, 299–309. doi: 10.1037/0735-7044.97.2.299
James H., Perez M., Kocher D., Knapp A., Rial C., Giordano J., et al. (2025). Design, development, and field testing of a GPS-enabled virtual fencing ear tag for cattle in resource-constrained systems. Cornell University.
Jensen M. B. (2018). “The role of social behavior in cattle welfare,” in Advances in Cattle Welfare. Ed. Tucker C. B. (Sawston Cambridge: Elsevier), 123–155. doi: 10.1016/B978-0-08-100938-3.00006-1
Jones J. A. (2019). Cattle herd from drone (YouTube). Available online at: https://www.youtube.com/watch?v=YADUetlqcJg (Accessed November 25, 2025).
Keshavarzi H., Lee C., Lea J. M., and Campbell D. L. M. (2020). Virtual fence responses are socially facilitated. Front. Vet. Sci. 7, 543158. doi: 10.3389/fvets.2020.543158
Kleanthous N., Hussain A., Mason A., Sneddon J., Shaw A., Fergus P., et al. (2018). “Machine learning techniques for classification of livestock behavior,” in International Conference on Neural Information Processing (Springer, Cham), 304–315. doi: 10.1007/978-3-030-04212-7_26
Lange A., Bauer L., Futschik A., Waiblinger S., and Lürzel S. (2020). Talking to cows: Reactions to auditory stimuli. Front. Psychol. 11. doi: 10.3389/fpsyg.2020.579346
Lee C. and Campbell D. L. M. (2021). A multi-disciplinary approach to assess the welfare impacts of a new virtual fencing technology. Front. Vet. Sci. 8. doi: 10.3389/fvets.2021.637709
Lee C., Fisher A. D., Reed M. T., and Henshall J. M. (2008). The effect of low energy electric shock on cortisol, β-endorphin, heart rate and behaviour of cattle. Appl. Anim. Behav. Sci. 113, 32–42. doi: 10.1016/j.applanim.2007.10.002
Lee C., Henshall J. M., Wark T. J., Crossman C. C., Reed M. T., Brewer H. G., et al. (2009). Associative learning by cattle. Appl. Anim. Behav. Sci. 119, 15–22. doi: 10.1016/j.applanim.2009.03.010
Lees J., Lea J. M., Henry S., Lee C., and Campbell D. L. M. (2024). “Social learning facilitates virtual fencing: Group training reduces shock exposure and improves retention,” in AAAS Annual Meeting (Denver CO: AAAS).
Lenner Á., Papp Z. L., and Komlósi I. (2025). Analysis of sounds made by Bos taurus and Bubalus bubalis dams to their calves. Front. Veterinary Sci. 12, 1549100. doi: 10.3389/fvets.2025.1549100
Lomax S., Colusso P., Gargulio J., and Clark C. (2019). Determining learning and behavioural response to a virtual fence for dairy cows. Animals 9, 429. doi: 10.3390/ani9070429
McDonald J. B. and Xu Y. J. (1995). A generalization of the beta distribution with applications. J. Econom 66, 133–152. doi: 10.1016/0304-4076(94)01645-Y
McNamara J. M., Green R. F., and Olsson O. (2006). Bayes’ theorem and its applications. Oikos 112, 243–251. doi: 10.1111/j.0030-1299.2006.14228.x
Moreiraa S. M., Silveiraa I. D. B., da Cruz L. A. X, Minello L. F., Pinheiroc C. L., Schwengber E. B., et al. (2023). Auditory sensitivity in beef cattle. J. Vet. Behav. 59, 67–72. doi: 10.1016/j.jveb.2022.10.004
Mota-Rojas D., Whittaker A. L., Domínguez-Oliva A., Strappini A. C., Álvarez-Macías A., Mora-Medina P., et al. (2024). Tactile, auditory, and visual stimulation as sensory enrichment for dairy cattle. Animals 14, 1265. doi: 10.3390/ani14091265
Musinska J., Skalickova S., Nevrkla P., Kopec T., and Horky P. (2025). Unlocking potential, facing challenges: A review evaluating virtual fencing for sustainable cattle management. Livest. Sci. 295, 105693. doi: 10.1016/j.livsci.2025.105693
Nyamuryekung’e S., Cox A., Perea A., Estell R., Cibils A. F., Holland J. P., et al. (2023). Behavioral adaptations of nursing Brangus cows to virtual fencing: Insights from a training deployment phase. Front. Vet. Sci. 10. doi: 10.3389/fvets.2023.1170114
Olczak K., Penar W., Nowicki J., Magiera A., and Klocek C. (2023). The role of sound in livestock farming—selected aspects. Animals 13, 2307. doi: 10.3390/ani13142307
Perez-Flores M. C., Verschooten E., Lee J. H., Kim H. J., Joris P. X., and Yamoah E. N. (2022). Intrinsic mechanical sensitivity of mammalian auditory neurons as a contributor to sound-driven neural activity. Front. Cell. Neurosci. 16, 894247. doi: 10.7554/eLife.74948.sa2
Preisler H. K., Ager A. A., Johnson B. K., and Kie J. G. (2004). Modelling animal movements using stochastic differential equations. Environmetrics 15, 643–657. doi: 10.1002/env.636
Pšenka M., Šístková M., Mihina Š., and Gálík R.(2016).Frequency analysis of noise exposure of dairy cows in the process of milking. doi: 10.17221/4/2015-RAE
Schein M. W. and Fohrman M. H. (1955). Social dominance relationships in a herd of dairy cattle. Br. J. Anim. Behav. 3, 45–55. doi: 10.1016/S0950-5601(55)80012-3
Silva A. R., Lages W. S., and Chaimowicz L. (2009). Boids that see: Using self-occlusion for simulating large groups on GPUs. ACM Comput. Entertain 7, 51. doi: 10.1145/1658866.1658870
Simonsen P. A., Husted N. S., Clausen M., Spens A. M., Dyrholm R. M., Thaysen I. F., et al. (2024). Effects of social facilitation and introduction methods for cattle on virtual fence adaptation. Animals 14, 1456. doi: 10.3390/ani14101456
Sowell B. F., Mosley J. C., and Bowman J. G. P. (2000). Social behaviour of grazing beef cattle: Implications for management. J. Anim. Sci. 77, 1. doi: 10.2527/jas2000.00218812007700ES0021x
Stephen B., Dwyer C., Hyslop J., Bell M., Ross D., Kwong K. H., et al. (2011). Statistical interaction modelling of bovine herd behaviours. IEEE Trans. Syst. Man Cybern. C 41, 820–829. doi: 10.1109/TSMCC.2010.2073464
Sumpter D. J. (2006). The principles of collective animal behaviour. Philos. Trans. R. Soc Lond. B Biol. Sci. 361, 5–22. doi: 10.1098/rstb.2005.1733
Thompson R. F. (2009). Habituation: a history. Neurobiol. Learn. Mem 92, 127–134. doi: 10.1016/j.nlm.2008.07.011
Umstatter C., Tailleur C., Ross1 D., and Haskell M. J. (2009). “Could virtual fences work without electric shocks?,” in Precision Livestock Farming ‘09 (Wageningen, Netherlands: Wageningen Academic) 159–168. doi: 10.3920/9789086866632_020
Umstatter C., Brocklehurst S., Ross D. W., and Haskell M. J. (2013). Can the location of cattle be managed using broadcast audio cues? Appl. Anim. Behav. Sci. 147, 34–42. doi: 10.1016/j.applanim.2013.04.019
Vande Moere A. (2004). “Time-varying data visualization using information flocking boids,” in IEEE Symposium on Information Visualization. (Austin TX: IEEE Symposium on Information Visualization) 97–104. doi: 10.1109/INFVIS.2004.65
Varnon C. A., Martin A. L., and Abramson C. I. (2012). Conditioning methods for farm animals: A mini review. Uludag Univ. J. Fac. Vet. Med. 31, 1–10.
Verdon M., Hunt I., and Rawnsley R. (2024). Virtual fencing for pasture allocation. J. Dairy Sci. 107, 6161–6177. doi: 10.3168/jds.2023-24537
Verdon M. and Rawnsley R. (2020). The effects of dairy heifer age at training on rate of learning and retention of learning in a virtual fencing feed attractant trial. Front. Anim. Sci. 1. doi: 10.3389/fanim.2020.618070
Waynert D. F., Stookey J. M., Schwartzkopf-Genswein K. S., Watts J. M., and Waltz C. S.. (1999). The response of beef cattle to noise during handling. Appl. Anim. Behav. Sci. 62, 27–42. doi: 10.1016/S0168-1591(98)00211-1
Wilms L., Komainda M., Hamidi D., Riesch F., Horn J., and Isselstein J.. (2024). How do grazing beef and dairy cattle respond to virtual fences? A review. J. Anim. Sci. 102, skae108. doi: 10.1093/jas/skae108
Keywords: virtual fencing, cattle behavior, herd dynamics, agent-based modeling, learning and habituation
Citation: James H, Perez M, Adams H, Giordano J, Peck M and Erickson D (2025) Biologically informed algorithms for modeling cattle response to auditory cues and driving simulations in virtual fencing systems. Front. Anim. Sci. 6:1708415. doi: 10.3389/fanim.2025.1708415
Received: 18 September 2025; Accepted: 18 November 2025; Revised: 05 November 2025;
Published: 08 December 2025.
Edited by:
Joao H. C. Costa, University of Vermont, United StatesReviewed by:
Bradley Heins, University of Minnesota Twin Cities, United StatesRiccardo Primi, University of Tuscia, Italy
Copyright © 2025 James, Perez, Adams, Giordano, Peck and Erickson. This is an open-access article distributed under the terms of the Creative Commons Attribution License (CC BY). The use, distribution or reproduction in other forums is permitted, provided the original author(s) and the copyright owner(s) are credited and that the original publication in this journal is cited, in accordance with accepted academic practice. No use, distribution or reproduction is permitted which does not comply with these terms.
*Correspondence: David Erickson, ZGU1NEBjb3JuZWxsLmVkdQ==