 Mohammed-Farouk Bouaziz
 Pascale Marange
 Alexandre Voisin
- Universitè de Lorraine, CNRS, CRAN, F-54000 Nancy, France
This paper presents a ranking method of operating sequences based on the actual condition of complex systems. This objective is achieved using the health checkup concept and the multiattribute utility theory. Our contribution is the proposal of sequences ranking process using data and experts’ judgments. The ranking results in a decision-making element; it allows experts to have an objective and concise overall ranking to be used for decision making. A case study is presented based on an experimental platform; it allows us to compare two aggregation operators: the weighted mean and the Choquet integral.
Introduction
In the industrial field, system operating has become increasingly complex. This complexity arises from the following (Zio, 2009):
1 The increasing complexity of controlled systems (dimension, equipment number and heterogeneity, complexity of control, cohabitation of manual and automated equipment, etc.).
2 The difficulty to have a complete view of the system, i.e., mental representation by the plant operators.
3 The increase of imposed constraints (e.g., safety and environmental standards) and induced constraints (e.g., societal).
4 The difficulty for the operators and decision makers to take into consideration all the previous points as a whole.
With the growing consideration to economic, social, and environmental stakes, the safety of critical systems is at the heart of the concerns of specialists, government, and society. As such, it leads to becoming a major issue for both theoretical and applied research. According to the standard (ISO 13849–1:2015 (en)), security can be defined as the ability of an entity to prevent the occurrence, in given conditions, of critical or disastrous events. Therefore, when operating the system, it must be kept in a state in which the risk of human or material damage is limited to an acceptable level. Safety critical systems receive a particular attention since they represent a significant risk at the society level (Devaraj et al., 2020; Kumar et al., 2020; Maurya and Kumar, 2020). Safety critical systems emerge from the interaction of three poles (Tarride, 2013):
1 A complex technical system characterized by several interactions between its subsystems/components with physical couplings and feedbacks.
2 Human operators interacting with the system, in a given environment, with a synthetic vision influenced by several factors (rules, norms, etc.).
3 An environment in which the above two elements evolve and are influenced by.
Despite automation, complex system operating is largely based on human knowledge. This knowledge must consider the interaction of the complex system with its environment as shown in Figure 1. The system is decomposed into subsystems providing a set of functions down to equipment supporting the operation. A successful operating allows the complex system to perform its missions efficiently.
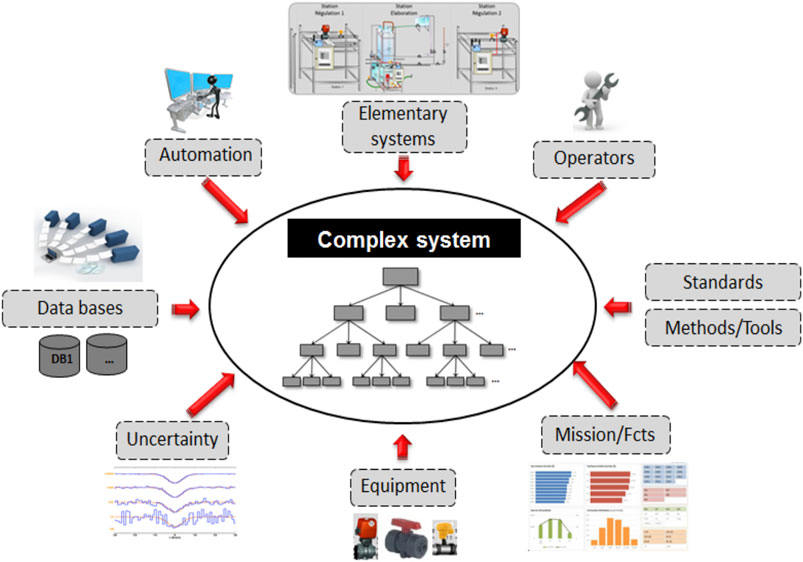
FIGURE 1. Complex and critical system context.
Usually, complex systems require the anticipation of the addressed mission by preparing and defining the operating sequences to be applied, i.e., the sequence of actions to be performed to fulfill the current mission. Such definition has to consider the suitable operating sequences that fulfill the requirement of system security and/or equipment availability. Nevertheless, such task is hardened by the use of huge amount of equipment for other production missions, for safety/maintenance and environment reasons leading to having several possibilities of equipment combination that allow the mission success. Hence, the operating sequence definition is carried out thanks to sequence generating methods at the design stage. Sequence generating methods use a model of the system in order to explore all the possible combinations of equipment state, that will lead to the success of the mission. Once the set of successful sequences is obtained, few of them, considered as the best choice with respect to expert knowledge, are selected and will be used to drive the complex system once in operation. However, in the sequence generation models, the state of the system and its equipment is binary, i.e., ON/OFF. While a sequence can be the best choice when its equipment is fully operating, it may not be the best once equipment is degrading. Furthermore, once in operation, among the set of suitable sequences, the experts must choose the best fitted one based on its knowledge, the actual conditions of the system, etc. Obviously, human experts cannot fully handle the consideration of tens, perhaps few hundreds, of equipment in a sequence neither the gradual performance drift due to equipment degradation. Hence, the motivation of this paper is to propose a ranking of operating sequences from the set of suitable sequences, according to the current state of the system, i.e., health of equipment, with respect to expert’s knowledge.
This paper is organized as follows: sections 2 and 3 are devoted respectively to the study context presentation, the objectives, and the problem statement. Section 4 proposes to introduce the ranking process. Section 5 presents an application of the proposed approach on a case study. Conclusion and perspectives finish this article.
Study Context
In this article, we consider a set of sequences that should be classified. These sequences are obtained offline or online, using approaches such as verification and validation where on a system model, a property is verified (Schnoebelen et al., 1999; Frey and Litz, 2000; Machado et al., 2006; Lahtinen et al., 2012; Goubali et al., 2016; Gouyon et al., 2020), or synthesis where the model respecting the constraints is obtained by calculation (Wonham and Ramadge, 1987; Ramadge and Wonham, 1989; Yeh and Chang, 2012; Zaytoon and Riera, 2017). How to obtain this set of sequences is not the subject of this paper. Here, we consider that this set contains only the sequence respecting dependability.
In this part, we present the ranking approach to integrate additional information for the sequence selection. While defining a mission, the expert must choose a particular operating sequence to perform from several acceptable sequences. This selection is based on the following:
1 Explicit knowledge: taken into account in the generation of acceptable sequences.
2 Implicit knowledge: for example, the decision criteria defined by the expert.
3 Synthetic knowledge: the representation of complex system by the expert. Indeed, the representation level of expert information is not the same as the sequence actions.
4 Incorrect knowledge: e.g., the plant representation by the expert can be false when the degradation compensation exists.
5 Subjective knowledge: e.g., two experts can select two different sequences.
Therefore, the approach proposed in this paper aims to help the expert in the selection based on the actual system state. The objective is, firstly, to provide to the expert a ranking of operating sequences based on a set of objective and concise overall information (Figure 2) and, secondly, to make explicit the sequence selection by the following:
1 The definition of the decision criteria.
2 The definition of the decision “rules.”
3 The definition of actual system state.
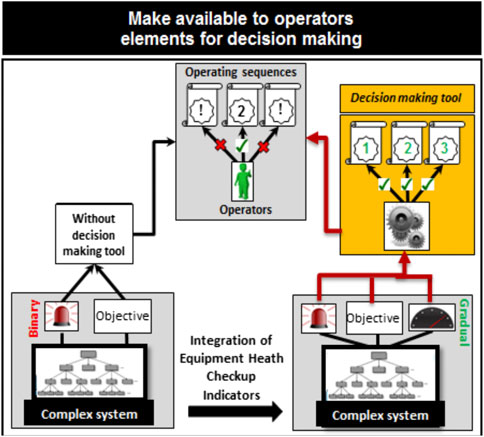
FIGURE 2. Decision-making context.
Our work is original because the approach integrates the following:
1 The equipment characteristics (heterogeneity, number, criticity, etc.).
2 The operational context in the definition of decision criteria (time, cost, performance, solicitation, etc.).
3 The actual equipment conditions (health monitoring).
Problem Statement
A sequence selection making consists of a ranking of the suitable operating sequences in order to aid the expert. This ranking must take into account the complexity of system operating. This process is based on the system representation through sequences properties and system health state. So, we use the framework of the multicriteria decision making and more specifically the multiattribute utility theory (MAUT). The health checkup provides the current complex state of the equipment of a system in the form of several indicators. These indicators are mapped, thanks to utility functions, on a commensurable scale allowing them to be aggregated. This section presents the concept of system health checkup and introduces the theory of multiattribute utility.
Health Checkup Concept
Health monitoring aims at following the current state of a system (Kalgren et al., 2006; Omri et al., 2020). The objective of this process is to obtain a representation of the system state and to provide an assessment of its condition/health (Racoceanu, 2006) including incipient degradation. The sensors data are collected to be transformed into indicators, e.g., degradation indicators showing normal or abnormal operating mode of the system according to a reference (Ribot, 2009; Bouaziz et al., 2013).
The concept of equipment health checkup has been addressed in the literature. Byington et al. (2004) indicate that the health checkup corresponds to the actual level of deviations compared to a normal state. Liu (2007) refers by the health of system/equipment its capability to perform the defined and expected function; therefore, health can be considered as the degree of required performance. Shin (2009) indicates that the performance of product/component is measured throughout its period of use, compared to design specifications, by the characterization of this performance degradation over time. Also, Kumar and Pecht (2010) refer to the fact that the context should be integrated within the parameters of health monitoring. Thus, the health vision is a complex concept reflecting functional aspect, dysfunctional aspect, and environmental aspect (Laloix, 2018; Dinh et al., 2020).
Abichou (2013) has proposed a generic representation of these aspects from a systemic representation in the form of health checkup later completed by Laloix (2018) (Figure 3). A health checkup is a set of three classes of indicators:
1 Functional (or performance) indicators: they monitor the function performed by the addressed component at all levels of the hierarchical structure of the system. These indicators are mainly focused on the representation of the function flows (material, energy, and information) and the function performances. We find in this second category in particular i) effectiveness indicators (ratio between results/objectives) and ii) efficiency indicators (ratio between results/resources).
2 Dysfunctional indicators: they are mainly related to the degradation mechanisms evolution. They can represent i) the degradation mechanism (e.g., leak, wear), where indicators are constructed from physical parameters, ii) the observable symptoms (e.g., vibration, temperature increase) and iii) the external degradation factors (e.g., system shocks, mechanical constraints).
3 Environmental indicators: these contextual indicators allow assessing the values taken by functional/dysfunctional indicators in relation to the conditions in which the system evolves. Hence, drift of functional/dysfunctional indicators can be put aside if resulting from operational and environmental conditions change and considered otherwise.
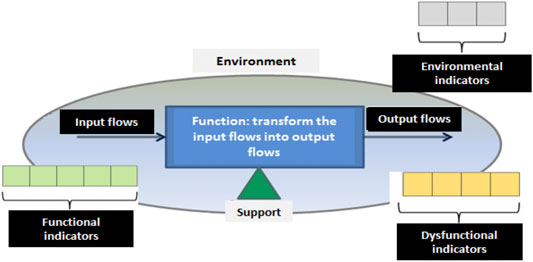
FIGURE 3. Health checkup associated systemic representation of a system.
The health checkup formalization of an component E is given by Abichou (2013):
where
Prognostics and Health Management approach (PHM) aims at providing support to a system including the monitoring of its real state, the detection of incipient fault, and prediction of impending degradation of a system during its life-cycle (Kalgren et al., 2006). It relies on some important processes such as data processing, diagnostics, prognostics, and decision aiding. Figure 4 presents a typical architecture of PHM and shows the links that exist between these steps and the health checkup. Note that this generic architecture can be adapted to the application needs. The first step involves extracting relevant indicators from a qualitative and quantitative data processing. These indicators can be used for diagnostics to detect, identify, and localize abnormalities; also they can be used for prognostics to estimate the fault evolution. Finally, the decision support step allows choosing an appropriate action plan by evaluating predefined criteria (cost, yield, etc.) (Ben-Daya et al., 2009).
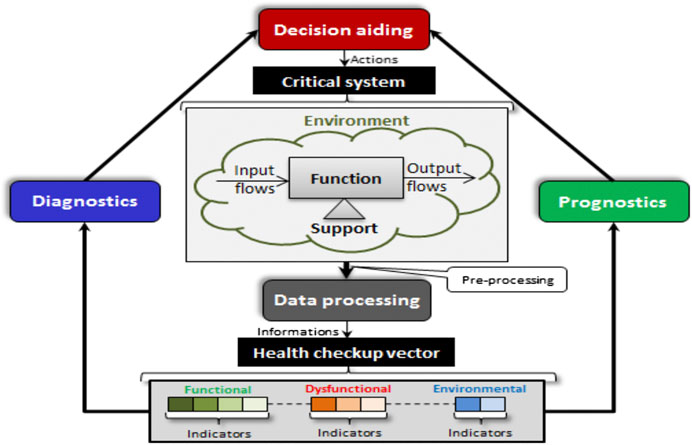
FIGURE 4. Generic architecture of PHM system.
In our work, we are particularly interested in the concept of decision aiding and our study is oriented toward methods and tools from the field of Multicriteria Decision Aiding (MCDA).
Multiattribute Utility Theory
The problem of sequence ranking is a multicriteria decision problem. For Grabisch and Perny (2007), the performance of each alternative has to be evaluated according to the relevant aspects of the problem; then a classification can be performed following their performances. So, it becomes a comparison problem since the alternatives must be compared 2 to 2 in order to obtain a complete ranking. This comparison is based on the alternative’s representation through criteria values according to the relevant aspects of the problem (Zopounidis and Doumpos, 2002). The difficulty lies in antinomic criteria that vary in opposite way. One classic example is the choice of a car according to its speed and its fuel consumption. Several multicriteria decision-making approaches exist. Among them, the most used are (Öztürk et al., 2005): PROMETHEE (Preference Ranking Organization Method for Enrichment Evaluations) (Mousavi and Lin, 2020), ELECTRE (ELimination Et Choix Traduisant la REalité, i.e,. elimination and choice expressing reality) (Mishra et al., 2020), AHP (Analytic Hierarchy Process) (Kubler at al., 2016; Liu et al., 2020), ANP (Analytic Network Process) (Chen et al., 2019), and MAUT (Multiattribute Utility Theory) (Dyer, 2005).
Recall that the objective is to classify a set of alternatives (sequences) on the basis of a multicriteria analysis. We use the framework of the MAUT theory, which is one of the most commonly used methods for decision support. We chose MAUT because we believe that taking into account the interaction between criteria is a necessary property in this type of application and a class of operators used in MAUT allows this. In the other methods mentioned above, only ANP and PROMETHEE allow this consideration. However, ANP is very complex to implement and PROMETHEE belongs to a set of methods whose properties are not compatible with our application.
So, according to the MAUT, the problem is formalized as follows. We aim to build a function
where
The function
Since our application requires the respect of the four conditions, the former approach has been preferred. The “aggregate and compare” approach also suffers limitations. Among them, Grabisch and Perny (2007) point out 1) the necessity to map the criteria on a common commensurable scale, 2) the conflicts between criteria and possible compensation, and 3) the amount of information requested to set the parameters of the models. Drawbacks 1) and 3) can be overcome since we have expert knowledge as well as operational data in order to provide sufficient information. Limitation 2) remains and cannot be overcome in the “aggregate and compare” approach. It classically happens when using a mean operator. But, using aggregation operator able to capture interaction between criteria allows mitigating this limitation. Nevertheless, such issue is of first importance when dealing with critical systems. Hence, the proposed approach aims at proposing a sequence ranking. The final decision to choose a particular sequence to be operated will remain in the hands of the system operator. The system operator will be able to balance between conflicting criteria and possible compensation. The proposed tool will help him to discard inadequate sequence when considering a huge number of equipment actions to be applied.
The formalization of this approach requires finding a numerical representation of preference, i.e., a function
If
where
A common semantic for decision criteria: the criteria are heterogeneous; for aggregation it is necessary to have the same semantic. It corresponds to a score or satisfaction degree.
A common scale and commensurability hypothesis: the commensurability ensures that the same utility level, on two different criteria, corresponds to the same satisfaction intensity.
A consequence of formulation of Eq. (4) is that all elements are comparable. This property may not stand. Indeed, some situations may be not comparable according to expert’s preference, i.e., neither
The aggregation function
with
1 the relative importance between criteria,
2 the tolerant or intolerant attitudes regarding some criteria,
3 the interactions between criteria
Finally, from Eq. 4, the sequence ranking turns into finding the functions
From Health Checkup to Multicriteria Decision
In this paper, we use the health checkup concept associated with the equipment of operating sequences in combination with MAUT. We propose to order these sequences (
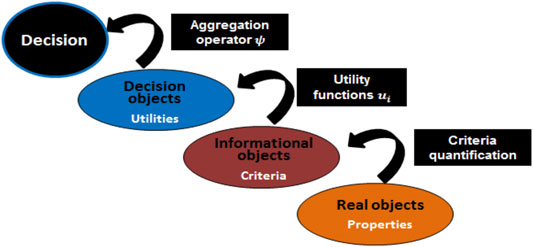
FIGURE 5. Information transformation in the proposed approach.
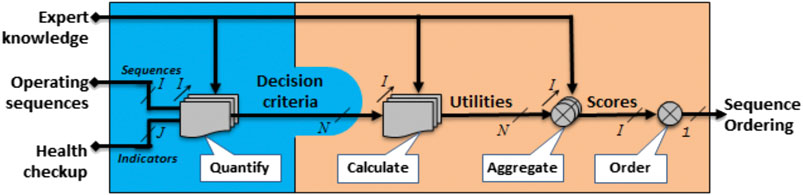
FIGURE 6. Ranking process.
The global score calculation is based on decisional objects described by a set of commensurable and semantically consistent criteria. These criteria are represented by utility functions (see Eq. 4). Hence for a particular sequence,
To get the
The criteria are developed from properties of real objects as the properties of a sequence
with
The last phases of the ranking process, i.e., Eq. 6 and Eq. 7, rely to the classical mathematical framework of MAUT. However, for the first step of quantification, i.e., Eq. 8, the sequence and equipment heterogeneity have to be tackled. In the next part, we present the steps of the ranking process.
Description of the Ranking Process
The ranking process of operating sequences is divided into four steps (Figure 6):
1 To quantify: a quantification model establishes the link between the sequence properties, health checkup indicators, and decision criteria.
2 To calculate: the decision criteria are mapped into utilities
To aggregate: an aggregation operator
3 To order: a ranking operator
4 The input operating sequences that belongs to the set of suitable regarding safety aspects.
5 All the input sequences perform the same mission (objective).
6 All the equipment of sequence contributes to the achievement of the mission.
7 The properties and health checkup indicators are available.
Decision Criteria Quantification
In the general case, quantification maps the operating sequences and equipment condition into decision criteria. The list of criteria is determined from experts’ judgment, in order to identify the main elements taken into account by the expert in his sequence selection (for example, time, cost, and performance indications). For each decision criterion, a mathematical function is calculated to combine the sequence properties and/or the equipment health checkup indicators of a sequence. A key point is to make the quantification step generic enough to be implemented for every operating sequence. Indeed, the sequences may have different number of actions with different components. The output of this step is the values of the
Utilities Calculation
A utility function represents the relation between numerical values of the criteria (for example, cost values) and a utility referential from zero (for rejected values) to one (for preferred values). These functions can be obtained by learning from historical data or from experts' knowledge (Grabisch, 2006). As we use expert’s knowledge, the second approach is chosen to define the
Aggregation
The aggregation mechanism merges information in a global value. In the general case, the aggregate score contributes to decision making from situations that may be contradictory. The aggregation operator
There are four main classes of aggregation operators (Beliakov et al., 2007): conjunctive, disjunctive, compromise, and hybrids. However, only compromise aggregation operators respect the idempotent property (see Eq. 5). The main compromise operators are arithmetic mean, weighted arithmetic mean, ordered weighted averaging, and fuzzy integral. This last family of aggregation operators takes into account interaction between criteria (Grabisch and Perny, 2007).
Aggregation allows synthesizing the utility values of the criteria in a global score. The choice of an aggregation operator depends on the application (Grabisch et al., 2011). For our application, we decide to compare the calculation results with two compromise operators: weighted arithmetic mean (WA) and the Choquet integral (CI). On one hand, WA operator has been selected since it is a standard operator known by everybody thanks to its widespread use and simplicity. Nevertheless, it cannot be used to model wide spectrum of decision maker preferences since it has intrinsic limitation (Grabish and Labreuche, 2010). On the other hand, CI operator is far less known but has given very good result in several domains and also from a theoretical point of view given raise to several extension (Dimuro at al., 2020). Furthermore, contrary to many aggregation operators, CI is able to handle interactions between criteria and is the only one, in its basic form, to handle homogeneous and heterogeneous interrelationships (Sun et al., 2018). Such interaction should be understood not as correlation between entries but as modeling the dependencies between the criteria thanks to the preference of the decision maker (Marichal, 2000a).
The WA operator associates a different weight with each criterion, and the sum of these weights is equal to 1. The formulation of the WA is given by:
The CI operator uses parameters which reflect the criteria weights and the interaction degree between these criteria. These parameters are represented in the form of capacity (or fuzzy measures) (Marichal, 2000b). The CI is defined by Murofushi and Sugeno (1991) as:
where
An analysis of the capacity can be carried out using the Shapley importance index and the interaction index (Marichal, 2000a). Shapley index takes into account the mean importance of a criterion in relation with its contributions for all capacity. In a similar manner, the interaction index quantifies the interaction between two criteria on all capacity.
Ranking
The last step of the ranking process aims at classifying the scores γ from the best to the lowest. Since the aggregation computes the scores γ on
Case Study: Application to CISPIa Critical Subsystem
Among Safety Critical Systems (SCS) (Diaz et al., 2020; Wang et al., 2017), we are interested in those related to the chemical or nuclear industry. In these industries, the problem of piloting amounts to choosing the best lineage according to several criteria of different natures. CISPI, a research platform of the CRAN (Centre de recherche en automatique de Nancy) scales down a subsystem of a power genetor plant. Figure 7 shows the operating subsystem which controls the liquid flow through the Ck, Cp, and Cs tanks. Note that the objective mission is to fill the storage tank Cs. This circuit is composed of 1) three routes: R1, R2,and R3 between the Cp and the Cs tanks, 2) two linear valves VR1 and VR3 to control the flow of R1 and R3, 3) solenoid valve VE2 to control the R2 flow, and 4) four manual valves VM1, VM2, VV2, and VM3.
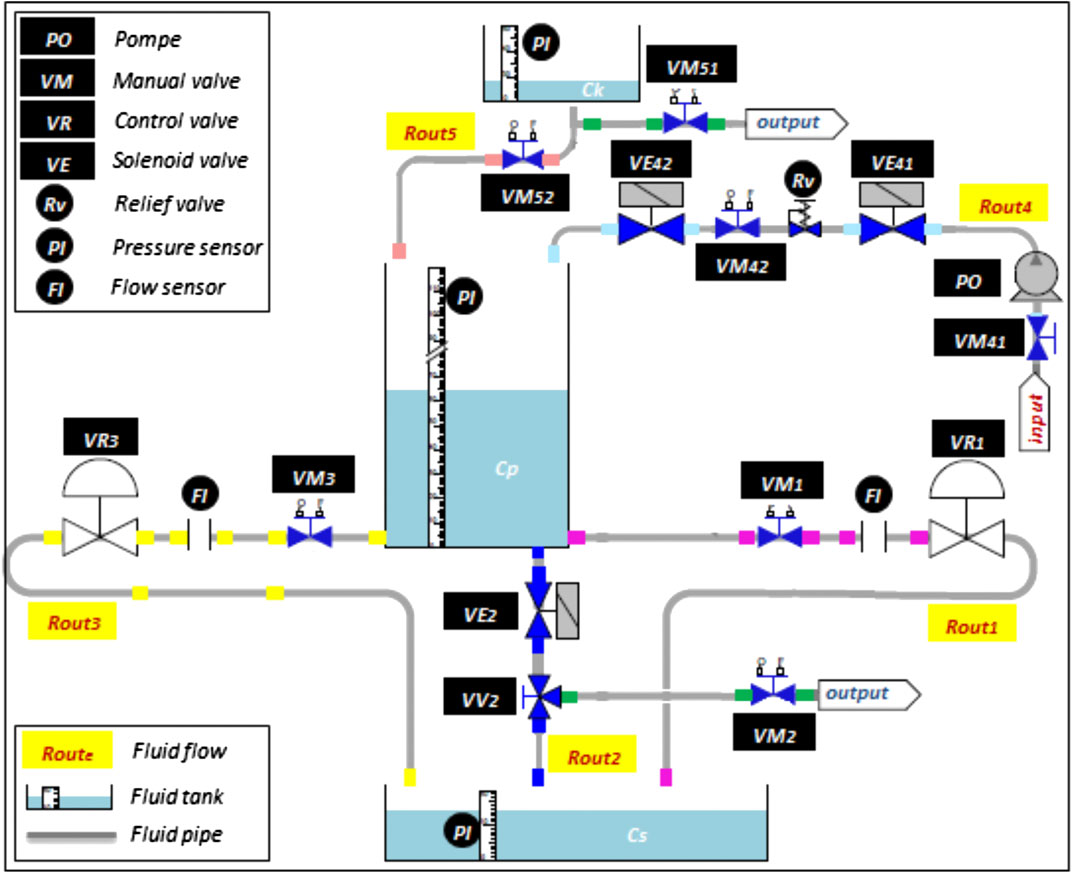
FIGURE 7. CISPI platform.
To ensure a sufficient level of liquid in the Cp tank, two additional routes are solicited R4 and R5. From an external input source, R4 allows filling the tank Cp through a pump PO, two solenoid valves VE41, VE42, and two manual valves VM41 and VM42. A relief valve Rv limits the internal pressure of R4 in order to protect equipment. R5 ensures the same mission as R4; it is associated with a storage tank Ck and controlled by two manual valves VM51 and VM52. Finally, CISPI is instrumented through pressure sensors PI and flow sensors FI.
For the CISPI installation (Figure 7), the elementary lineages are as follows (Clanché et al., 2010):
1 Lineage N°1: filling up with Cp tank and input source (R4 and R1/2/3)
2 Lineage N°2: filling up with Cp and Ck tanks (R5 and R1/2/3)
3 Lineage N°3: filling up with Cp, Ck tanks and input source (R4/5 and R1/2/3)
When performing a sequence, the system operator must handle several equipment and move between manual equipment with estimated execution times ETp (Table 1).
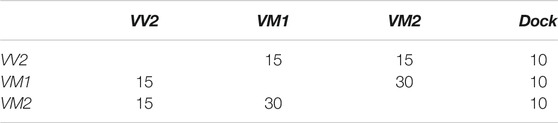
TABLE 1. Execution time (in time unit TU).
For the two routes of the subsystem, three sequences are defined for the target mission as follows:
1
2
3
where ┴ and ┬ stand for the valve opening and closing actions.
First of all, the criteria of Table 2 are considered. Note that each decision criterion combines the properties of the operating sequence and the health checkup of equipment. For example, Figure 8 shows respectively the execution time (in time unit UdT) and the pipe length (in length unit LU).
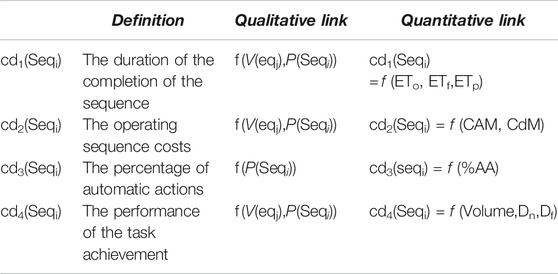
TABLE 2. Decision Criteria.
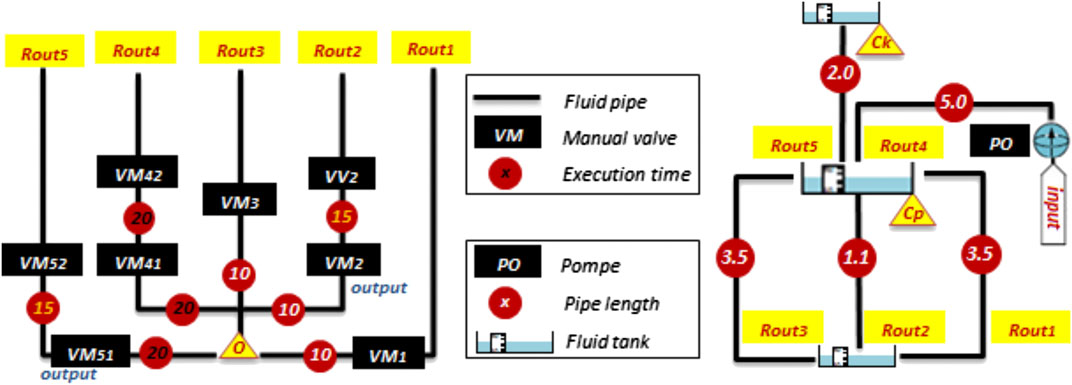
FIGURE 8. Execution time and pipe length.
Each sequence is characterized by a set of properties associated with the actions (manual/automatic) and the direct equipment (as valve, pump) or the structure equipment (as tanks and pipes).
In the proposed model, the equipment actual condition is taken into account, by health checkup
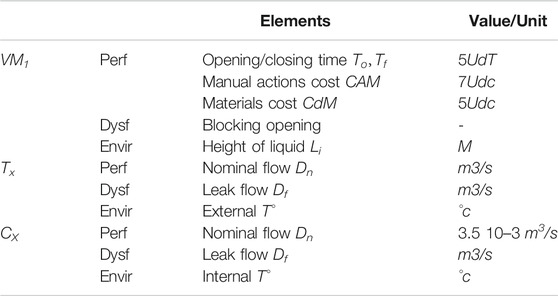
TABLE 3. Health checkup indicators.
For our academic example, we consider the following numerical value:
1 Tank surface: SCS = 0.16 m2; SCP = 0.49 m2
2 Height of the tank Cp: LCP = 0.80 m
3 Heights difference in the tank Cs: LCS = 0.20 m; volume to fill VMO = 0.2 * 0.49 = 0.098 m3
4 Length, diameter, and surface of the pipes: TL1 = 3.55 m; TL2 = 1.15 m; DT = 40*10–3 m; ST = 12.56*10–4 m2
5 Average speed: SaCP = 2*g*LCP/2 = 7.848 m/s; nominal flow: DnT = SaCP* DT = 9.89 *10–3 m3/s
6 Flight flow: Dn = 9.89 10–4 m3/s
7 Costs of manual actions and operating cost equipment (CAM; CdM) = (7; 5) UdC (cost unity)
Costs of automatic actions and operating cost equipment (CAA; CdM) = (1; 3) UdC
8 Opening/closing time of manual valve (2positions): ETo = ETf = 5UdT (Time unity)
9 Opening/closing time of manual valve (3positions): ETo = ETf = 7UdT
10 Opening/closing time of automatic valve: ETo = ETf = 3UdT
Note that the initial state corresponds to the plan shutdown; this allows us to assume the initial state of the operated equipment when defining the sequences. For this critical system, we assume also that even if equipment was initially closed, closing action must be verified. From the three lineages presented above, 21 operating sequences are defined. These sequences are assumed qualified from safety point of view and optimal (i.e., no useless action). The set of acceptable sequences are described in Table 4. We use “
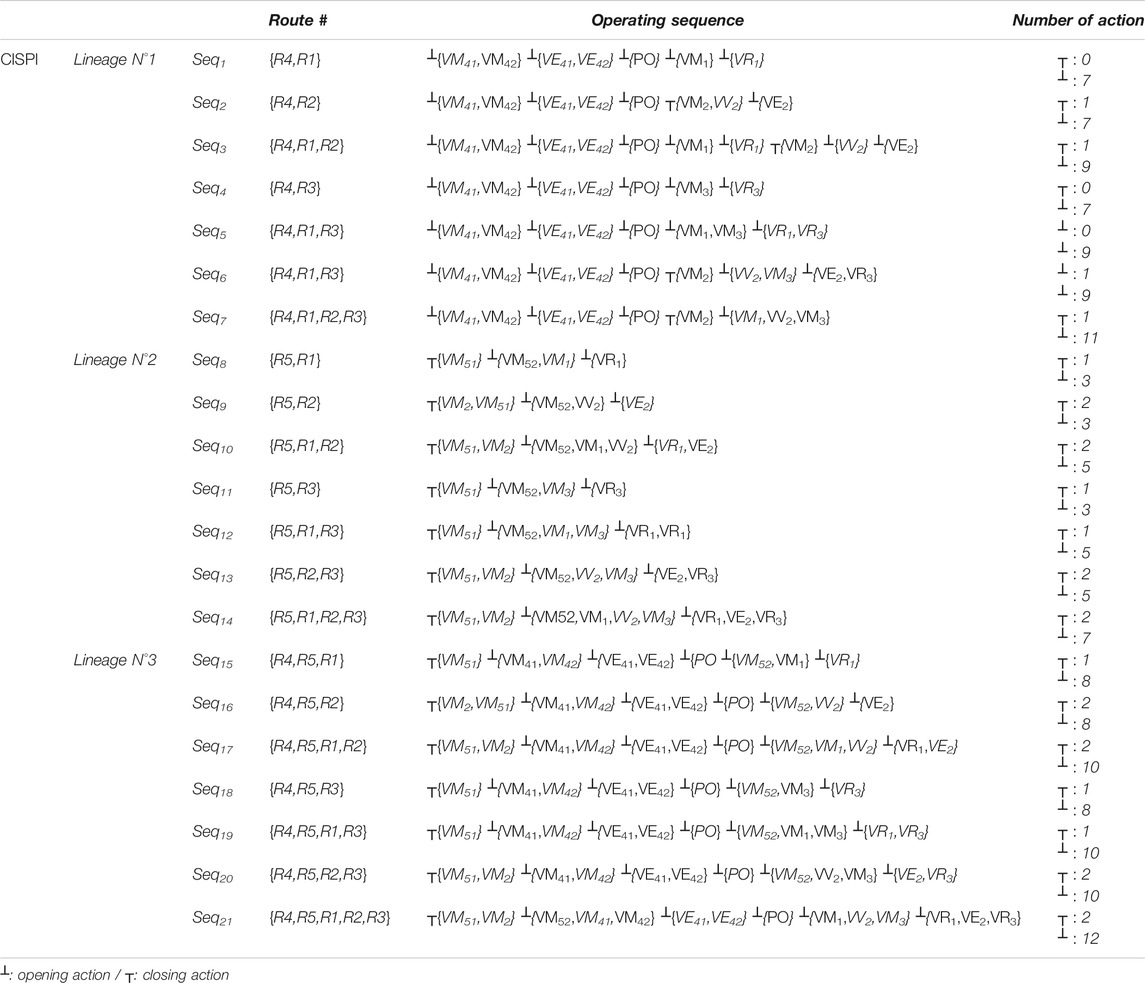
TABLE 4. Complete set of operation sequences.
Each sequence refers to a route leading to a set of operated equipment, sensors, and structure equipment. This equipment is assessed by the health checkup indicators. Thus, the sequence properties and health check up indicators are the parameters to choose a sequence to be performed.
Decision Criteria Quantification
For this study, criteria were defined for the ranking. Each decision criterion cd takes as argument either the sequence properties or the sequence properties and the health check up indicators of the equipment as follows (Table 4).
The time of the sequence achievement is calculated according to the opening/closing time
with
The second criterion takes into account the costs of manual and automatic actions (
with
The third criterion is the percentage of automated actions in the sequence. This criterion depends on the number of automatic actions:
with
Finally, the fourth criterion is the performance of the task achievement. This criterion is based on the tanks volumes VMO, lineage volumes VLg, nominal flows Dn, and leak flows Df for all equipment. We assume that the initial levels are sufficient to achieve the mission:
with
For each sequence, the value of each criterion must be calculated from the numerical values given. Obtaining the values of each criterion for the first sequence will be detailed, and the criteria values of the other two sequences will be given directly.
If we replace the numerical values of these parameters, we obtain the following results for the first sequence Seq1:
Now we replace the numerical values of these parameters. The criteria are calculated for some sequences and are shown in Table 5.
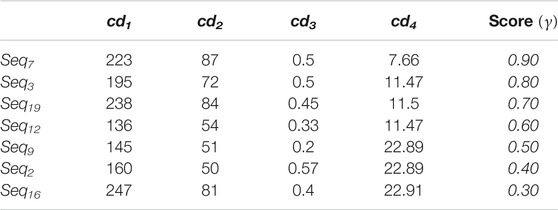
TABLE 5. Learning subset of sequences and score given by the expert.
Utilities Calculation
The definition of utility functions will enable to map the criteria on a commensurable scale. Higher levels of utility are associated with the preferred values. Figure 9 shows the proposed functions.
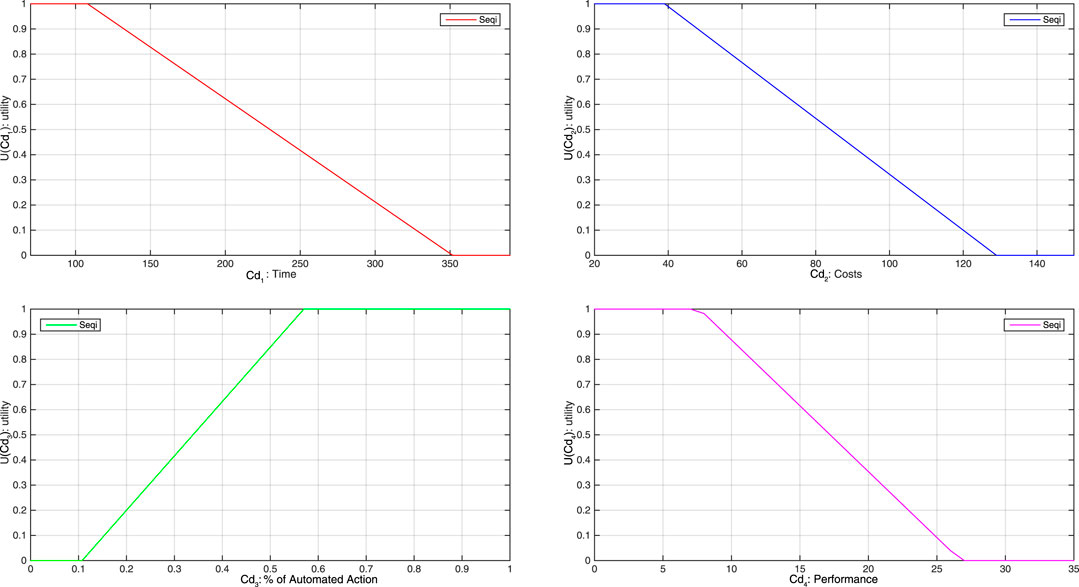
FIGURE 9. Utility functions.
The utility functions for each criterion are determined according to the following rule and considering the nominal state of the system. The minimum and maximum values of criteria are calculated considering all the operating sequences. The interval [0.2 1.0] is used for the utility of “nominal state” sequences. The use of these limit values is required since:
no criteria can have a better value (the system is designed to be the best solution in its nominal state); hence the maximum value of the utility, i.e., 1, is given to these values,
criteria may have worth values since when degrading, equipment may work in nonoptimal state but still good for the system operation. Hence, some nonzero utility values must be affected by these. That is why we use 0.2 utility value for the worth criteria values in order to calculate decision criteria with equipment health variations.
When operating in degraded scenario, criteria will take utility value of 0 showing not acceptable values.
Aggregation
The parameters of the aggregation operator have to be identified. A subset of sequences
With respect to his preferences, the expert gives each of them a global score. The set of alternatives and the expert’s score are presented in Table 5.
The coefficients of the weighted arithmetic mean (WA) are calculated from the learning data provided by the expert, i.e. presented in Table 5. We resolve the system of equations A*Wi = B, where A is the alternatives matrix

TABLE 6. Coefficients of the WA operator.
Using the Kappalab extension of GNU-R software (Grabisch et al., 2007), the capacity is identified from the same learning data, i.e. Table 5. Figure 10 shows the Shapley values. Shapley's values give the importance of a criterion in relation to its contributions to overall capacity. For example, performance (cd4) has the highest weight in relation to other criteria such as with WA. The second most important criterion, for the WA, is cd2: cost. Figure 11 presents the interaction indexes for the identified capacity of the CI. The interaction indices reflect the interaction between two criteria across the capacity. Thus, a positive value of the interaction between a pair of criteria (e.g., cd1, cd3) corresponds to the configuration where when the utilities of cd1 and cd3 have a significant value, the CI result is greater than the result of the sum of the individual contributions. We then speak of synergy between the criteria. For a negative value of the interaction (e.g., cd2, cd3), an opposite interpretation is done. We then speak of redundancy between the criteria. We notice a strong positive interaction between (cd3, cd4), and a weaker interaction between (cd1, cd2) and (cd1, cd2). For the negative interactions, there are some between (cd1, cd4), (cd2, cd3), and (cd2, cd4).
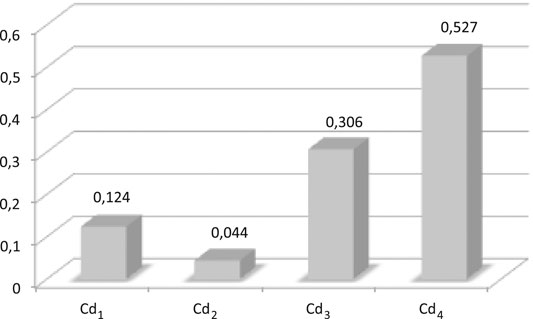
FIGURE 10. Shapley values for the CI operator.
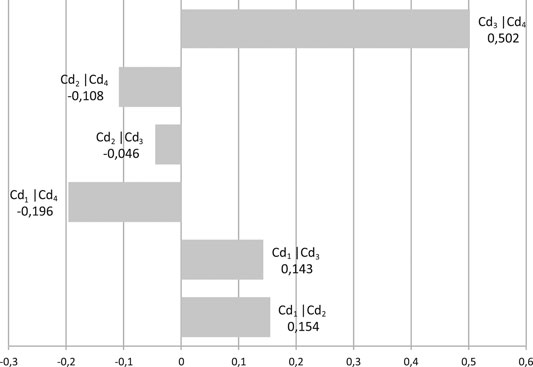
FIGURE 11. Interaction indexes for the CI operator.
Ranking (on the learning set)
The obtained aggregation scores and sequences ranking for the weighted arithmetic mean (WA) and the Choquet integral (CI) operators are given in Table 7 for the learning subset of sequences. The rankings between expert preference, CI operator, and WA operator are:
Despite the small number of sequences, only CI operators have the ability to handle them properly. Thanks to the scores computed by CI operator, ranking results are similar to the expert preferences while the WA operator is not able to catch the expert preferences (for instance, Seq12 and Seq2 are not properly ranked). This result might not be surprising since WA has intrinsic limitation (Grabish and Labreuche, 2010). Such difference reflects in the mean square error which equals 5.57.10−3 for the CI and 55.82.10−3 for WA.
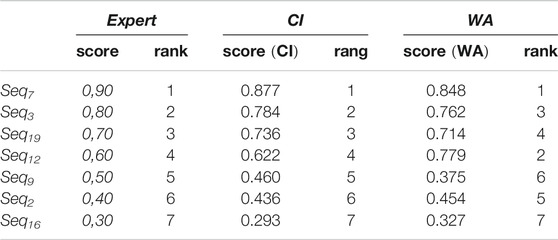
TABLE 7. Comparison of scores for the learning subset given by the expert, CI, and WA.
But since the aim of the approach is to use the health checkup that reflects the component real status, what happens when the health of the components degrades? The next section presents the analysis of the model through the comparison of several operating conditions regarding the health status of the equipment.
Scenario and Discussion
After checking the ranking on the learning set, look at the results on the complete set of sequences. Indeed, once the CI and WA parameters are learned, we can generalize the ranking to the whole set of sequences, i.e.,
Ranking the Complete Set of Sequences in Nominal Mode
Table 8 shows the scores and ranking of the whole set of sequences in nominal mode, i.e., without considering degradation of equipment. Both rankings exhibit different results. The CI operators show more gradualness of the scores over all sequences. On the contrary, for WA operator, there is a clear discrepancy between the scores of
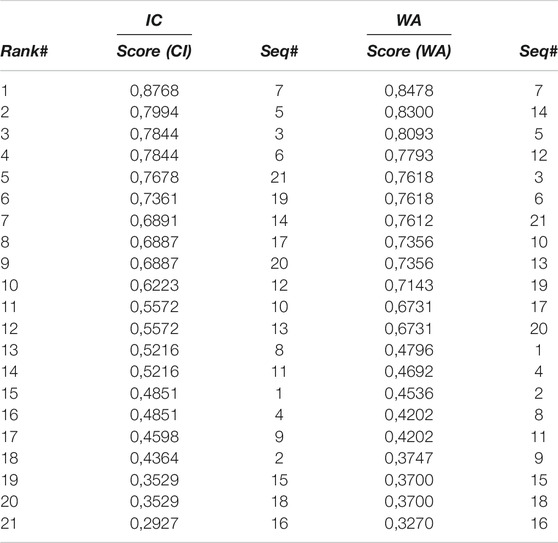
TABLE 8. Scores and ranking for the scenario in nominal mode for the CI and the WA operators.
We also note, for both CI and WA, that some sequences have identical scores (e.g., 3 and 6, 15, and 18). Since R1 and R3 are identical, it is obvious that sequences, in which one is replaced by the other, obtain equal scores.
Scenario #1: Low Deviation of Health Indicators
For this first degradation scenario, we simulated a slight variation in the opening and closing times of the VM1 manual equipment of the route R1. This degradation impacts only cd1. The new scores obtained for all the sequences are shown in Table 9.
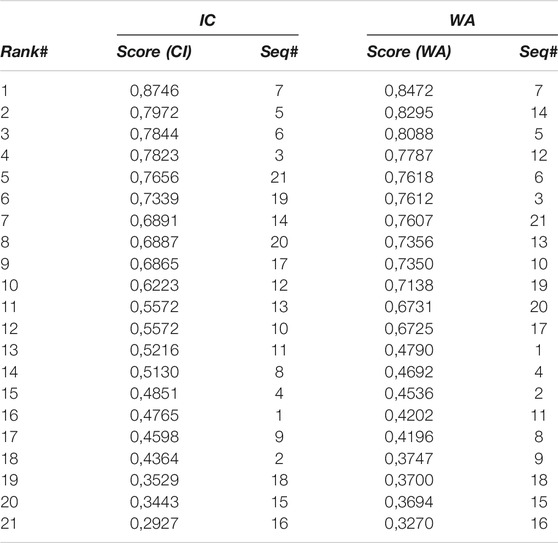
TABLE 9. Scores and ranking for the scenario #1 for the CI and the WA operators.
We obtain globally the same behavior as for the nominal scenario. We can note some changes in the ranking which are due to the fact that route R1 and route R3 are no longer equivalent. Thus, the scores obtained for the sequences using route R1 have slightly decreased. This decrease is normal since R1 equipment is degraded. The score must decrease. For example, for sequences
Scenario #2: Larger Deviation of Health Indicators
The second degradation scenario is intended to illustrate considering of a more serious degradation of the route R1. Thus, in addition to the first scenario degradation, we consider a leak at the level of the pipes Tx of route R1. This scenario thus consists in simulating not only a drop in the performance of the manual valve but also the malfunctioning of the pipes. Hence this scenario impacts cd1 and cd4. The new scores obtained for all the sequences are shown in Table 10. One can observe more significant changes in the order of the sequences. For instance,
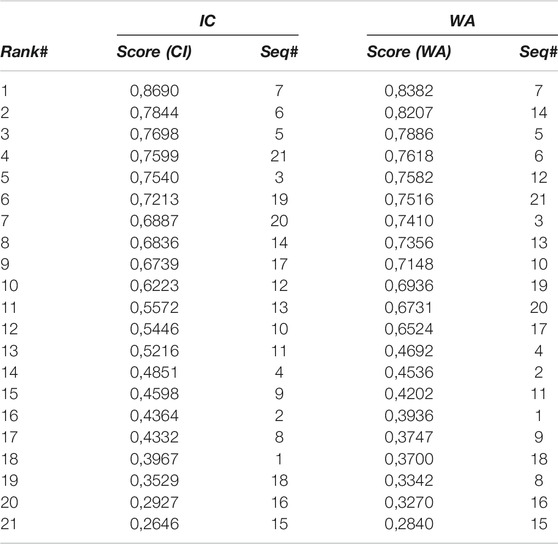
TABLE 10. Scores and ranking for the scenario #2 for the CI and the WA operators.
Moreover, thanks to other sequence score changes,
We also notice that, for the sequences with the lowest scores, i.e., the last eight sequences, the order is completely changed. The impact of a degradation is more important on the scores when they are low. The same behavior is also observed for the WA.
Finally, Table 11 presents the scores of the sequences whose scores changed due to scenario 1 and scenario 2 degradation. We compute some statistics as well on these scores. First the CI operator gives a wider range to the scores than WA and both maximum and minimum values are over and above those of WA for all scenarios. The mean of the IC is lower than the mean of WA while for the standard deviation, the reverse is true. From these statistics, we can conclude that the scores of the IC are more grouped than those of WA while the queue of the cluster, i.e., extreme values, is further for the IC than for WA.
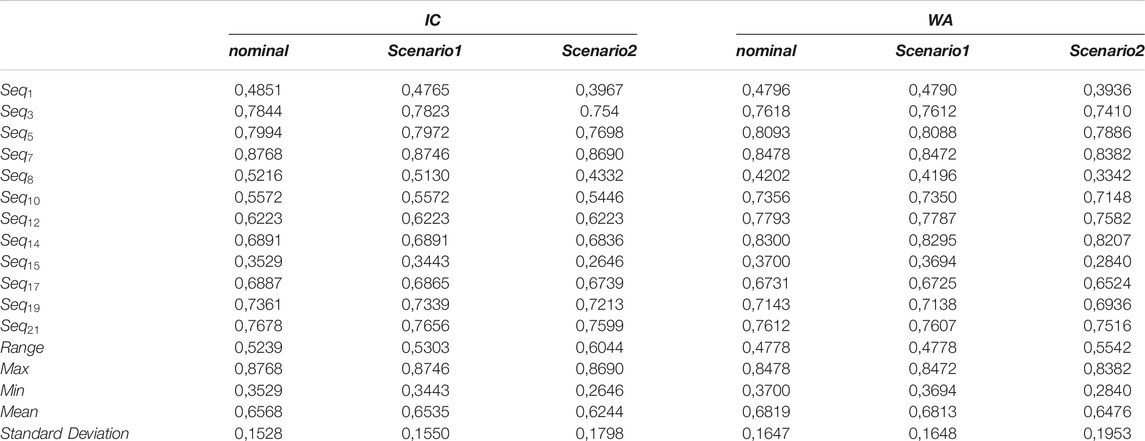
TABLE 11. Scores and ranking for both operators, CI and WA, for the three scenarios, i.e., nominal, #1 and #2, for the sequence including route 1.
Conclusion
This paper dealt with the problem of ranking operating sequences of a complex system. Indeed, operating sequence selection is performed using sequence generating method that does not consider the real state of the equipment. Such approaches are performed during the design phase of the critical system and lead to a set of few sequences to use during the operational phase. When a sequence has to be applied, one is selected among these few sequences thanks to the operating crew. The main drawback of such approach is mainly twofold. First, some sequences are ignored since they are discarded at the design phase. Second, humans can hardly consider tens, perhaps few hundreds, of equipment in a sequence neither the gradual performance drift due to equipment degradation. Both may lead to not selecting the optimal sequence to be applied. To overcome such issue, we propose an approach leveraging multiattribute utility theory with equipment health checkup. The main advantage of such approach is that it enables at the operating stage considering all the success sequences as well as all the equipment health in an objective way. In order to illustrate the performance of adopted tools, a case study is presented on the CISPI experimental platform.
This study presents the aggregation results obtained by the Choquet integral operator that allow ranking the operating sequences according to the expert’s preferences. This ranking is provided for different operating modes (nominal, deviation, and degradation) corresponding to different equipment health indicators. Our proposed approach has several advantages and shows potentialities in a complex industrial context. It allows also the formalization of knowledge and provides concise and overall information to expert. Moreover, this approach takes into consideration the heterogeneity, number, importance, solicitation, and actual condition of equipment in the decision making.
Future works will focus firstly on a comparative study between the results of the two methods presented in this paper and the ordered weighted averaging operator OWA (Filev and Yager, 1998). Beyond this comparison, the hierarchical aspect of health checkup should be integrated. Indeed, for complex systems, the health concept must be present at different abstraction levels and must reflect the existing relationships between these levels. Thirdly, we will apply this approach to other case studies (e.g., chemical complex processes) by considering several criteria associated with the system context with a more representative utility function. In addition, the utility functions learning aspect should be analyzed especially in the case of uncertain information.
Data Availability Statement
The datasets generated for this study are available on request to the corresponding author.
Author Contributions
M-FB was engineer and performed the application. PM provided the background and theoretical contribution on complex critical system sequence elicitation. AV provided the background and theoretical contribution on multicriteria decision making and Choquet integral. J-FP was coordinator of the project and supervised the work.
Funding
This works has been supported by the CONNECTION Cluster (https://www.edf.fr/groupe-edf/premier-electricien-mondial/activites/recherche-et-developpement/nos-projets-phares/cluster-connexion-le-controle-commande-du-futur), financed through the Investissements d’Avenir/Briques Génériques du Logiciel Embarqué.
Conflict of Interest
The authors declare that the research was conducted in the absence of any commercial or financial relationships that could be construed as a potential conflict of interest.
Abbreviations
CI, Choquet integral; CISPI, Safe and interactive operating of industrial processes; MAUT, Multiattribute utility theory; WA/OWA, Weighted arithmetic mean/Ordered weighted averaging operators
Footnotes
ahttp://safetech.cran.univ-lorraine.fr/
Nomenclature
Ai Actions
CAMj/CAAj Manual/Automatic actions costs
CdM Materials costs
cdi Decision criterion
CU/TU, Costs/Times unit
Cx/Tx, Fluid tanks/pipes
Dn/Df Nominal/leak flow
FIi/PIi, Flow/pressure sensors
To/Tf Opening/Closing time
Tp Execution time
VMO/VLg Tanks/Lineage volumes
VMi/VVi, Manual valves
VRi/VEi, Control/Solenoid valves
Wi Weights
┴ and ┬ valve opening and closing actions
References
Abichou, B. (2013). Contribution à la formalisation de bilans/états de santé multi-niveaux d’un système pour aider à la prise de décision en maintenance. PhD thesis. France (Europe): Université de Lorraine.
Sen, A. K. (1986). “The weak Borda effect is of little relevance to social choice theory,” in (Editors) K.J. Arrow, and M.D. Intrilligator Handbook of mathematical economics. (North-Holland: Elsevier Sciences Publishers), chapter. 22, 39, 79–89.
Arrow, K. J. (1951). Social choice and individual values. New York, NY: Cowles Foundations and Wiley, 192.
Beliakov, G., Pradera, A., and Calvo, T. (2007). Aggregation functions: a guide for practitioners. Heidelberg: Springer
Ben-Daya, M., Duffuaa, S. O., Raouf, A., Knezevic, J., and Ait-Kadi, D. (2009). Handbook of maintenance management and engineering. London: Springer.
Bouaziz, M. F., Zamaï, E., and Duvivier, F. (2013). Toward bayesian network methodology for predicting the equipment health factor of complex semiconductor systems. Int. J. Prod. Res. 51 (Issue 15), 4597–4617. doi:10.1080/00207543.2013.775525
Byington, C. S., Watson, M., and Edwards, D. (2004). “Dynamic signal analysis and neural network modeling for life prediction of flight control actuators,” in Proceedings of the American Helicopter Society 60th Annual ForumAHS. (Alexandria, VA).
Chen, Y., Jin, Q., Fang, H., Lei, H., Hu, J., Wu, Y., et al. (2019). Analytic network process: academic insights and perspectives analysis. J. Clean. Prod. 235, 1276–1294. doi:10.1016/j.jclepro.2019.07.016
Clanché, F., Gouyon, D., Dobre, D., Pétin, J. F., and Morel, G. (2010). “Plate-forme pour la conduite interactive et sûre,” in 3èmes Journées Démonstrateurs en Automatique. Angers, France: Communication dans un congrès, 9.
Devaraj, R., Sarkar, A., and Biswas, S. (2020). Optimal work-conserving scheduler synthesis for real-time sporadic tasks using supervisory control of timed discrete-event systems. J. Sched. 1–14. doi:10.1007/s10951-020-00669-0
Díaz, M., Soler, E., Llopis, L., and Trillo, J. (2020). Integrating blockchain in safety-critical systems: an application to the nuclear industry. IEEE Access 8, 190605–190619. doi:10.1109/ACCESS.2020.3032322
Dinh, D.-H., Do, P., and Benoit, I. (2020). Degradation modeling and reliability assessment for a multi-component system with structural dependence. Comput. Ind. Eng. 144, 106443. doi:10.1016/j.cie.2020.106443
Dyer, J. S. (2005). “MAUT–multiattribute utility theory,” in Multiple criteria decision analysis: state of the art surveys in operations research and management science. New York, NY: Springer, Vol. 78, 265–292.
Filev, D. P., and Yager, R. R. (1998). On the issue of obtaining OWA operator weights. Fuzzy Set Syst. 94 (2), 157–169. doi:10.1016/S0165-0114(96)00254-0
Frey, G., and Litz, L. (2000). “Formal methods in PLC programming,” in Proceedings of the IEEE international conference on systems, man, and cybernetics SMC’2000, Nashville, TN, October 8–11, 2000 (IEEE), 2431–2436.
Goubali, O., Girard, P., Guittet, L., Bignon, A., Kesraoui, D., Berruet, P., et al. (2016). “Designing functional specifications for complex systems,” in International conference on human-computer interaction, Toronto, Canada, July 2016 (Springer), 166–177.
Gouyon, D., Pétin, J.-F., Cochard, T., and Devic, C. (2020). Architecture assessment for safety critical plant operation using reachability analysis of timed automata. Reliab. Eng. Sys. Safety 199, 106923. doi:10.1016/j.ress.2020.106923
Dimuro, G. P., Fernández, J., Bedregal, B., Mesiar, R., Sanz, J. A., Lucca, G., et al. (2020). The state-of-art of the generalizations of the Choquet integral: from aggregation and pre-aggregation to ordered directionally monotone functions. Inf. Fusion 57, 27–43. doi:10.1016/j.inffus.2019.10.005
Grabisch, M. (2006). Evaluation subjective. Editors D. Bouyssou, D. Dubois, M. Pirlot, and H. Prade (Hermès, Paris: Concepts et - Mèthodes pour l’Aide à la Dècision), 175–232.
Grabisch, M., Kojadinovic, I., and Meyer, P. (2007). A review of methods for capacity identification in Choquet integral based multi-attribute utility theory Applications of the Kappalab R package. Eur. J. Operat. Res. 186, 766–785. 10.1016/j.ejor.2007.02.025
Grabisch, M., and Labreuche, C. (2010). A decade of application of the Choquet and Sugeno integrals in multi-criteria decision aid. Ann. Oper. Res. 175 (1), 247–286. doi:10.1007/s10288-007-0064-2
Grabisch, M., Marichal, J. L., Mesiar, R., and Pap, E. (2011). Aggregation functions: means. Inform. Sci. 181, 1–22. doi:10.1016/j.ins.2010.08.043
Grabisch, M., and Perny, P. (2007). “Agrégation multicritère,” in Utilisations de la logique floue. Editors B. Bouchon, and C. Marsala (France: Hermès), 29.
ISO 13849-1:2015(en) (2016). 2015 Safety of machinery–Safety-related parts of control systems–Part 1: general principles for design. PN-EN ISO, 13849–13851.
Kalgren, P., Byington, C., Roemer, M., and Watson, M. (2006). “Defining PHM, A lexical evolution of maintenance and logistics,” in IEEE Autotestcon2006 conference record, September 18–21, 2006 (Anaheim, California: IEEE), 353–358.
Kubler, S., Robert, J., Derigent, W., Voisin, A., and Le Traon, Y. (2016). A state-of the-art survey and testbed of fuzzy AHP (FAHP) applications. Expert Syst. Appl. 65, 398–422. doi:10.1016/j.eswa.2016.08.064
Kumar, S., and Pecht, M. (2010). Modeling approaches for prognostics and health management of electronics. Int. J. Perform. Eng. 6 (5), 467–476. 10.23940/ijpe.10.5.p467.mag
Kumar, P., Singh, L. K., and Chiranjeev, K. (2020). Performance evaluation of safety-critical systems of nuclear power plant systems. Nucl. Eng. Technol. 52 (3), 560–567. doi:10.1016/j.net.2019.08.018
Kowalewski, S., and Preuig, J. (1996). “Verification of sequential controllers with timing functions for chemical processes,” in 13th IFAC World Congress, San Francisco, USA, June 5–July 30, 1996, 419–424.
Lahtinen, J., Valkonen, J., Bj¨orkman, K., Frits, J., Niemel¨a, I., and Heljanko, K. (2012). Model checking of safety-critical software in the nuclear engineering domain. Reliab. Eng. Syst. Saf. 105, 104–113. doi:10.1016/j.ress.2012.03.021
Laloix, T. (2018). Machine health check methodology to help maintenance in operational condition: application to machine tool from its kinematic monitoring. PhD thesis. France: Université de Lorraine.
Liu, X. (2007). Machinery fault diagnostics based on fuzzy measure and fuzzy integral data fusion techniques. PhD thesis. Australie: Queensland University of Technology.
Liu, Y., Eckert, C. M., and Earl, C. (2020). A review of fuzzy AHP methods for decision-making with subjective judgments. Expert Syst. Appl. 161, 113738. doi:10.1016/j.eswa.2020.113738
Machado, J., Denis, B., Lesage, J. J., Faure, J. M., and Ferreira Da Silva, J. C. L. (2006). “Logic controllers dependability verification using a plant model,” in 3rd IFAC Workshop on Discrete-Event System Design DESDes’2006, Poland, Europe, September 26–28, 2006 (Poland: Rydzyna), 37–42.
Marichal, J.-L. (2000a). An axiomatic approach of the discrete Choquet integral as a tool to aggregate interacting criteria. IEEE Trans. Fuzzy Syst. 8 (6), 800–807. 10.1109/91.890347
Marichal, J. L. (2000b). On Choquet and Sugeno integrals as aggregation functions. Fuzzy Mesur. Integ. (40), 247–272.
Maurya, A., and Kumar, D. (2020). Divya. Reliability of safety critical systems: a state of the art review. Quality Reliab. Eng. Int. 36, 2547–2568. 10.1002/qre.2715
Mishra, A. R., Singh, R. K., and Motwani, D. (2020). Intuitionistic fuzzy divergence measure-based ELECTRE method for performance of cellular mobile telephone service providers. Neural Comput. Appl. 32, 3901–3921. doi:10.1007/s00521-018-3716-6
Mousavi, M. M., and Lin, J. (2020). The application of PROMETHEE multi-criteria decision aid in financial decision making: case of distress prediction models evaluation. Expert Syst. Appl. 159, 113438. doi:10.1016/j.eswa.2020.113438
Murofushi, T., and Sugeno, M. (1991). A theory of fuzzy measures. Representation, the Choquet integral and null sets. J. Math. Anal. Appl. 159, 532–549. doi:10.1016/0022-247X(91)90213-J
Omri, N., AL Masry, Z., and Mairot, N. (2020). Industrial data management strategy toward an SME-oriented PHM. J. Manuf. Syst. 56, 23–36. 10.1016/j.jmsy.2020.04.002
Öztürk, M., Tsoukiàs, A., and Vincke, P. (2005). “Preference modeling,” in Multiple criteria decision analysis: state of the art surveys. Editors M. Ehrgott, S. Greco, and J. Figueira (New York, NY: Springer-Verlag), 27–73.
Perny, P. (1992). Sur le non-respect de l’axiome d’indépendance dans les méthodes de type ELECTRE. Bruxelles: Cahiers du CERO, 34, 211–232.
Racoceanu, D. (2006). “Contribution à la surveillance des systèmes de production en utilisant les techniques de l’intelligence artificielle,” in Synthèse des activités de recherche et d’encadrement. France: Université de Franche-Comté de Besançon.
Ramadge, P. J., and Wonham, W. M. (1989). The control of discrete event systems. In Proceed. IEEE 77, 81–98. 10.1109/5.21072
Ribot, P. (2009). Vers l'intégration diagnostic/pronostic pour la maintenance des systèmes complexes. PhD thesis. France: Université Toulouse 3 Paul Sabatier.
Schnoebelen, P., Bérard, B., Bidoit, M., Laroussinie, F., and Petit, A. (1999). Vérification de logiciels : techniques et outils du model-checking. Paris: Vuibert, 197.
Shin, J. (2009). Decision support methods for closedloop conceptual design. PhD thesis. Suisse: Ecole Polytechnique Fédérale de Lausanne.
Sun, L., Dong, H., and Liu, A. X. (2018). Aggregation functions considering criteria interrelationships in fuzzy multi-criteria decision making: state-of-the-art. IEEE Access 6, 68104–68136. 10.1109/ACCESS.2018.2879741
Tarride, B. (2013). PWR physics, operation and safety-Management of accidental situations of the reactor system; Physique, fonctionnement et surete des REP-Maitrise des situations accidentelles du systeme reacteur.
Volker, N., and Kramer, B. J. (2002). Automated verification of function block-based industrial control systems. Sci. Comput. Program. 42 (1), 101–113. doi:10.1016/S0167-6423(01)00028-4
Wang, C.-J., Chen, Y.-C., Feng, S.-T., and Chang, C.-T. (2017). Automata-based operating procedure for abnormal situation management in batch processes. Comput. Chem. Eng. 97, 220–241. doi:10.1016/j.compchemeng.2016.11.042
Wonham, W. M., and Ramadge, P. J. (1987). On the supermall controllable sublanguage of a given language. SIAM J. Contr. Optim. (25), 637–659.
Yeh, M.-L., and Chang, C.-T. (2012). An automata-based approach to synthesize untimed operating procedures in batch chemical processes. Kor. J. Chem. Eng. 29 (5), 583–594. 10.1007/s11814-011-0227-x
Zaytoon, J., and Riera, B. (2017). Synthesis and implementation of logic controllers– a review. Annu. Rev. Contr. 43, 152–168. doi:10.1016/j.arcontrol.2017.03.004
Zio, E. (2009). Reliability engineering: old problems and new challenges. Reliab. Eng. Syst. Safety 94, 125–141. doi:10.1016/j.ress.2008.06.002
Keywords: decision making, sequences ranking process, health checkup, multiattribute utility theory, choquet intergral
Citation: Bouaziz M-F, Marange P, Voisin A and Petin J-F (2021) Control Sequence Ranking for Critical System Based on Health of Equipment Thanks to Choquet Integral. Front. Artif. Intell. 3:614853. doi: 10.3389/frai.2020.614853
Received: 07 October 2020; Accepted: 23 November 2020;
Published: 24 March 2021.
Edited by:
Zhen Zhang, Dalian University of Technology, ChinaReviewed by:
Yuan Gao, Dalian University of Technology, ChinaZhuolin Li, Dalian University of Technology, China
Copyright © 2021 Bouaziz, Marange, Voisin and Petin. This is an open-access article distributed under the terms of the Creative Commons Attribution License (CC BY). The use, distribution or reproduction in other forums is permitted, provided the original author(s) and the copyright owner(s) are credited and that the original publication in this journal is cited, in accordance with accepted academic practice. No use, distribution or reproduction is permitted which does not comply with these terms.
*Correspondence: Alexandre Voisin, YWxleGFuZHJlLnZvaXNpbkB1bml2LWxvcnJhaW5lLmZy