 Wei Li1
 Li Cao
 He Deng
- 1School of Electrical and Electronic Engineering, Wuhan Polytechnic University, Wuhan, China
- 2School of Computer Science and Technology, Wuhan University of Science and Technology, Wuhan, China
Introduction: Since optical coherence tomography angiography (OCTA) is non-invasive and non-contact, it is widely used in the study of retinal disease detection. As a key indicator for retinal disease detection, accurate segmentation of foveal avascular zone (FAZ) has an important impact on clinical application. Although the U-Net and its existing improvement methods have achieved good performance on FAZ segmentation, their generalization ability and segmentation accuracy can be further improved by exploring more effective improvement strategies.
Methods: We propose a novel improved method named Feature-location Attention U-Net (FLA-UNet) by introducing new designed feature-location attention blocks (FLABs) into U-Net and using a joint loss function. The FLAB consists of feature-aware blocks and location-aware blocks in parallel, and is embed into each decoder of U-Net to integrate more marginal information of FAZ and strengthen the connection between target region and boundary information. The joint loss function is composed of the cross-entropy loss (CE loss) function and the Dice coefficient loss (Dice loss) function, and by adjusting the weights of them, the performance of the network on boundary and internal segmentation can be comprehensively considered to improve its accuracy and robustness for FAZ segmentation.
Results: The qualitative and quantitative comparative experiments on the three datasets of OCTAGON, FAZID and OCTA-500 show that, our proposed FLA-UNet achieves better segmentation quality, and is superior to other existing state-of-the-art methods in terms of the MIoU, ACC and Dice coefficient.
Discussion: The proposed FLA-UNet can effectively improve the accuracy and robustness of FAZ segmentation in OCTA images by introducing feature-location attention blocks into U-Net and using a joint loss function. This has laid a solid theoretical foundation for its application in auxiliary diagnosis of fundus diseases.
1 Introduction
With the rapid development and popularization of medical imaging equipment, the imaging technology has been widely used in clinical practice, and become an indispensable auxiliary means to carry out disease diagnosis, surgical planning, prognosis assessment and so on. Optical coherence tomography angiography (OCTA) (Kashani et al., 2017) is a new non-invasive fundus imaging technology, which uses light interference to obtain vascular structure and blood flow information, and provide high resolution vascular imaging. In recent years, OCTA has been widely used in clinical diagnosis of various eye diseases, such as macular region disease, diabetic retinopathy, and retinal vascular obstruction. These eye diseases are related to the size and morphological changes of foveal avascular zone (FAZ) (Chui et al., 2012), which is surrounded by continuous capillary plexus of the retina, and does not have any capillary structure itself. It is an important area for the formation of fine visual function. The changes in its shape and surrounding capillary density reflect the degree of ischemia of the macula, and are closely related to retinal vascular diseases, such as diabetic retinopathy and retinal venous obstruction. For the three eye-related conditions, namely normal, diabetes and myopia (Balaji et al., 2020), diabetic eyes have a statistically significant increase in FAZ area compared to normal eyes. Similarly, the FAZ area increases and the blood vessel diameter decreases in myopia, especially in high myopia. Therefore, the changes in the area and morphology of FAZ can provide an important basis for clinical diagnosis of diabetes and myopia. The accurate segmentation of FAZ in OCTA images is crucial for diagnosis of fundus diseases.
In early days, many classical methods are proposed for FAZ segmentation. For example, the methods based on threshold segmentation (Liu et al., 2022), region growth (Ghassemi and Mirzadeh, 2007) and morphological operation (Yang et al., 2016) can be used to segment FAZ, by setting appropriate thresholds or using local features of images. However, these methods may have some limitations when dealing with complex image conditions. To further improve the segmentation performance, some methods based on traditional machine learning algorithms are proposed, such as Markov Random Fields (MRF) (Bourennane, 2010) and Support Vector Machine (SVM) (Alam et al., 2019), where hand-crafted features and traditional classifiers are used for segmentation. Nevertheless, the segmentation accuracy is usually limited by the selection of features and the capability of classifiers.
In recent years, with the development of deep learning technology, fundus image segmentation methods based on deep learning have achieved great success. A typical example is the segmentation method using U-Net (Ronneberger et al., 2015; Sherwani and Gopalakrishnan, 2024), which is a kind of full convolutional network with simple structure and beneficial effect. As this method processes the whole image in the same way and cannot give different attentions to different areas, various improvement methods based on U-Net are proposed later. The introduction of attention mechanism (Chen et al., 2022) in network models is one of the most effective ways, which can improve the accuracy and stability of segmentation by focusing on FAZ. These methods are often implemented by adding attention branches to models and adjusting the weights of features in channel and spatial dimensions, respectively. For instance, the channel attention branch can globally model the channels on feature maps and adjust the importance of each channel according to task requirements, to better express attention on FAZ. The spatial attention branch can consider the position relationship between pixels in spatial dimension to adjust the weight of each pixel in global feature maps, so as to accurately segment FAZ.
In addition to the improvement of the network structure, another improvement point is adopting a more appropriate loss function to optimize the model parameters, so as to improve the performance of the network model. For example, a hybrid loss function is used in DT-Net to improve the accuracy of retinal vessel segmentation (Jia et al., 2023), and a joint loss function is used in a multi-task segmentation framework for thyroid tumor segmentation (Yang et al., 2023).
Inspired by these strategies, it is very promising to obtain a novel method, by incorporating more effective attention mechanisms into U-Net, and using a more appropriate loss function that can further improve the accuracy of FAZ segmentation.
2 Related works
The methods for FAZ segmentation of OCTA images are mainly divided into classical methods, traditional machine learning methods and deep learning-based methods.
Among classical methods, the threshold segmentation (Liu et al., 2022) is a simple and commonly used method to segment FAZ based on pixel threshold. Each pixel is compared with a pre-defined threshold, and once the pixel value is greater than the threshold, it is marked as belonging to FAZ. Its segmentation result can be further optimized by subsequent morphological operations. The segmentation method based on region-growing (Ghassemi and Mirzadeh, 2007) utilizes the similarity between seed points and adjacent pixels, where a seed point is first selected, and then the FAZ is gradually expanded by comparing the similarity of adjacent pixels to the seed point. This method requires appropriate similarity measurement and seed point selection. The method based on morphological operation (Yang et al., 2016), such as corrosion, dilation, open and close operations, processes images to extract structures of interest, which achieves a good segmentation effect for objects with obvious morphological features. The frequency domain analysis method (Liu and Li, 2019) is to segment FAZ based on Fourier transform or wavelet transform equal frequency domain analysis technology, which can distinguish between vascular and non-vascular areas by extracting frequency information. The two-stage image processing method proposed by Díaz et al. (2019a) is based on FAZ positioning and contour extraction, which can handle detailed information well. Although these classical methods have made some progress, there are still limitations, such as inaccurate boundary due to poor image quality, confusion between FAZ and non-perfusion region, segmentation error when there is wrong layer projection, and cannot adapt well to complex image scenes and shapes.
In terms of traditional machine learning methods, the method proposed by Simó and Ves (2001) uses a statistical Bayesian segmentation for FAZ detection in digital retinal angiograms, which provides a global segmentation, i.e., veins, arteries and fovea are obtained simultaneously. The method proposed by Alam et al. (2019) employs an AI system containing an SVM classifier model and utilizes a hierarchical backward elimination technique to identify optimal-feature-combination for the best diagnostic accuracy and most efficient classification performance. Another method proposed by Bourennane (2010) first uses singular value decomposition (SVD) to improve signal to noise ratio, then applies MRF for FAZ segmentation, which achieves an encouraging result as a first approach for location and evolution of FAZ in retinal images. These machine learning-based methods on FAZ segmentation usually rely on hand-crafted features and prior knowledge, which are difficult to adapt to the complexity and diversity of FAZ, especially in the segmentation of low-quality images or diseased areas, and are prone to missegmentation or missing segmentation.
Among deep learning-based methods, U-Net (Ronneberger et al., 2015; Sherwani and Gopalakrishnan, 2024) is a landmark network structure for medical image segmentation, which is formed by concatenating feature maps of its encoder branch with feature maps of its decoder branch via skip connections. Subsequently, a variety of improved networks based on this structure are proposed. MED-Net proposed by Guo et al. (2018) is the first deep neural network used for avascular zone detection in OCTA images, which consists of encoders and decoders with multi-scale blocks to capture features at different scales. An automatic superficial FAZ segmentation and quantification method proposed by Guo et al. (2019) to classify each pixel into superficial FAZ or non-superficial FAZ class. Subsequent applied largest connected-region extraction and hole-filling to fine-tune the automatic segmentation results. Another customized encoder-decoder network incorporates a boundary alignment strategy with boundary supervision proposed by Guo et al. (2021) to automatically segment the superficial FAZ. BSDA-Net proposed by Lin et al. (2021) uses boundary regression and distance graph reconstruction of two auxiliary branches to improve the performance of the main branch. A lightweight U-Net proposed by Li et al. (2020) is used to perform fast and robust FAZ segmentation. A segmentation network leveraging optical density and disease features ODDF-Net is proposed by Yang et al. (2024) for the simultaneous 2D segmentation of RC, RA, RV, and FAZ in 3D OCTA, which can learn the relationship between retinal diseases and the disrupted vascular structures, facilitating multi-object structure extraction. A multistage dual-branch image projection network (DIPN) is proposed by Liu et al. (2025) to learn feature information in B-scan images to assist geographic atrophy segmentation and FAZ segmentation. At present, these deep learning-based methods on FAZ segmentation still faces the problems of insufficient segmentation accuracy and limited generalization ability, and still needs to be further improved.
In order to further improve the accuracy of FAZ segmentation while maintaining good generalization ability, we propose a novel improved method named FLA-UNet by incorporating feature attention and location attention into U-Net and using a joint loss function. The main contributions of this paper are as follows:
1. An innovative feature-location attention block (FLAB) is designed by using a feature-aware block and a location-aware block in parallel for each feature map, where the feature-aware block can be used to adjust the weight of each feature map and enhance the expression ability of network, while the location-aware block can obtain the global statistics of each feature map and better retain texture features and background information of FAZ.
2. A novel improved method based on U-Net for FAZ segmentation is proposed by embedding a FLAB into each decoder of U-Net to integrate more marginal information of FAZ and strengthen the connection between target region and boundary information, and using a joint loss function consisting of the cross-entropy loss (CE loss) function and the Dice coefficient loss (Dice loss) function to realize the optimization of the whole continuity of image and the boundary recovery.
3. A series of qualitative and quantitative comparative experiments on the three datasets of OCTAGON, FAZID and OCTA-500 are implemented to show the superiority of our method over other existing state-of-the-art methods in terms of visual segmentation effect and the MIoU, ACC and Dice coefficients.
3 Proposed method
Typically, for a basic U-Net structure used for object segmentation, the encoded low-level feature maps are concatenated with the corresponding high-level feature maps from the decoder branch, so the beneficial semantic information and redundant information are simultaneously input to its next layer, which may affect the segmentation accuracy of network. This problem can be solved by adding appropriate attention blocks into the main network. Besides, since the CE loss function used in U-Net is only concerned with the prediction result at pixel level, the generated segmentation boundary may be discontinuous or jagged. This problem can be solved by combining it with the Dice loss function, which is used to measure overlap in segmentation tasks and tends to produce smoother segmentation boundaries, to form a compound loss function to optimize the network model parameters for FAZ segmentation.
3.1 Improved network structure
The novel improved network for FAZ segmentation is designed by embedding an innovative FLAB into each decoder of U-Net, as shown in Figure 1. In the encoder branch, five encoders are used to extract features of the input image. Each encoder contains two identical convolution blocks, and each of which consists of a 3 × 3 convolution layer, a batch normalization (BN) layer, and a ReLU activation layer. Between every two encoders, a max pooling operation is used to implement downsampling, and eventually, the spatial dimension is halved by setting the value of stride length to 2 and the number of channels doubles by setting the number of output channels to twice the number of input channels. In the decoder branch, four decoders use the feature maps of encoders to progressively obtain the segmentation result. Each decoder contains a skip connection block, a FLAB, and two identical convolution blocks, each of which is the same as in its corresponding encoder. Between every two decoders (or the last encoder and the first decoder), the bilinear interpolation is used to implement upsampling, where low-resolution feature maps are upsampled to the same resolution as the encoder stage for feature fusion, which can accelerate the training speed of model and make the marginal contour clearer. In each skip connection block, the upsampled feature maps from the previous decoder (or the last encoder) are concatenated with the encoded feature maps from the encoder at current layer, and the concatenated feature maps are input into the corresponding FLAB. In each FLAB, the concatenated feature maps are processed to obtain more detailed features. Finally, the segmentation result is obtained by performing a 1 × 1 convolution operation on the output of the last level decoder, followed by using a Softmax function.
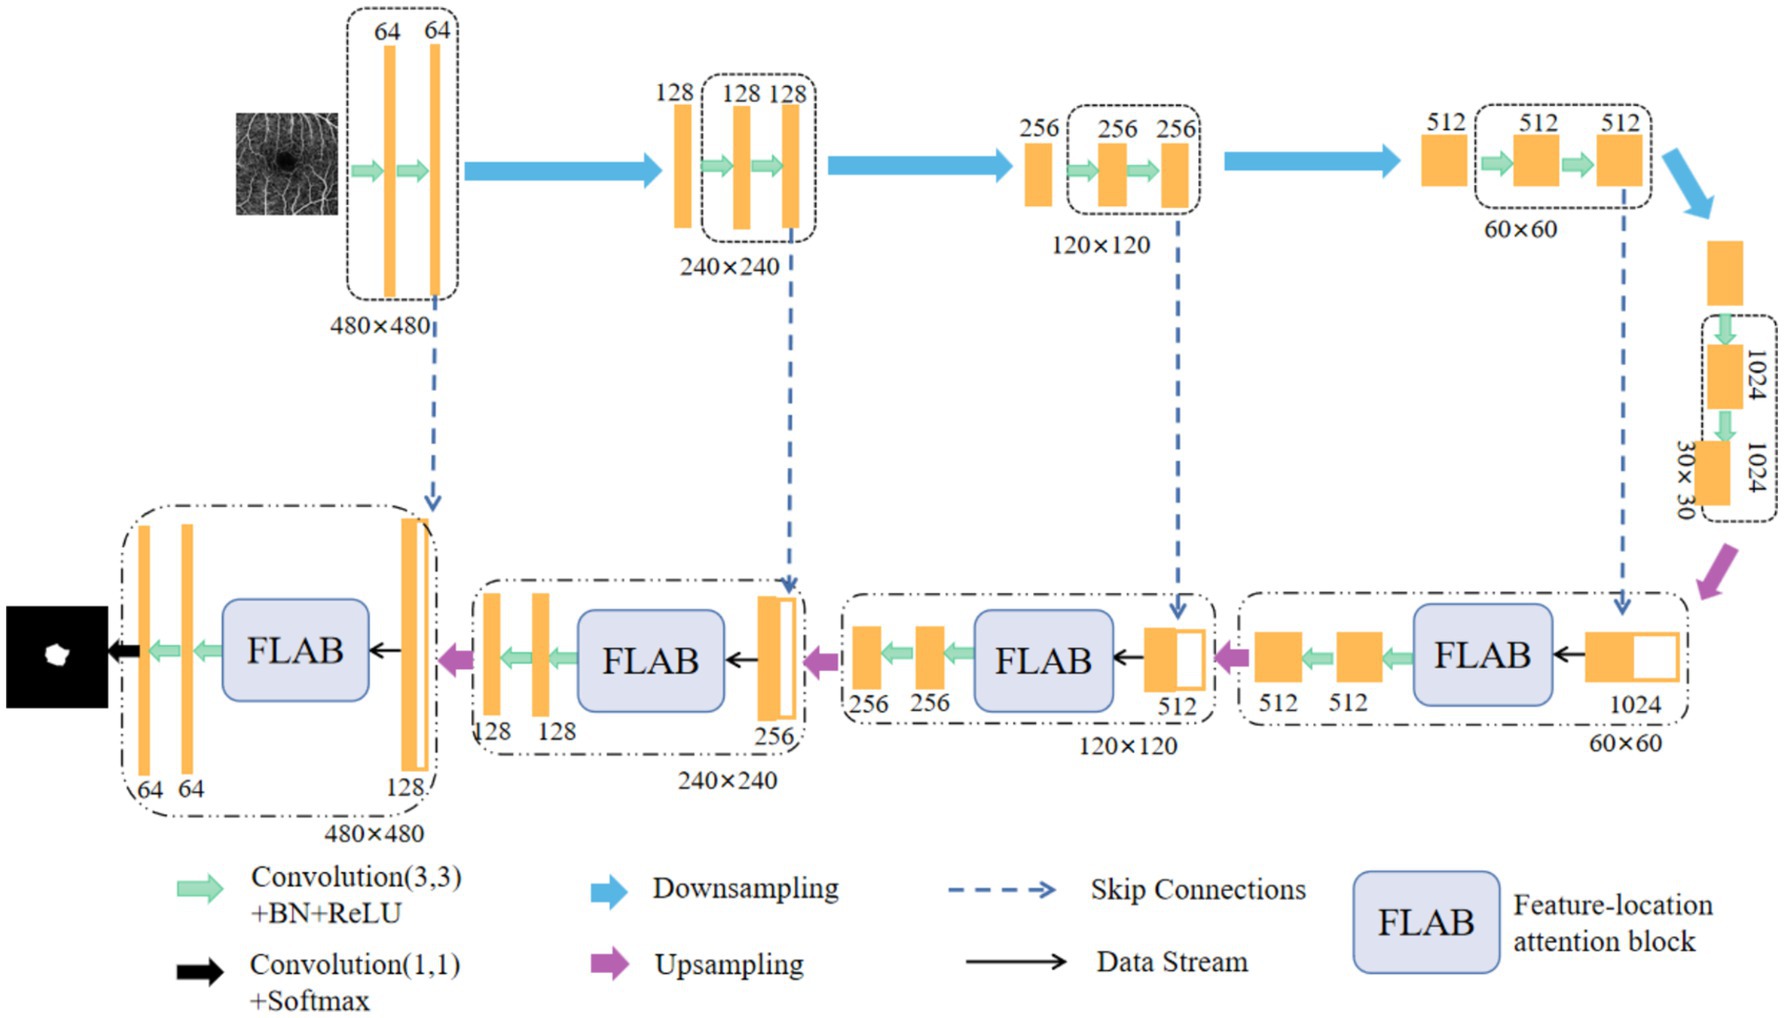
Figure 1. Schematic representation of our improved network structure, which is formed by embedding a FLAB into each decoder of U-Net.
3.2 Feature-location attention block
For the concatenated feature maps F ∈ℝH × W × C, a FLAB contains C attention modules to process C feature maps separately, each attention module consists of a feature-aware block and a location-aware block in parallel, as shown in Figure 2. For channel i (i ∈1, …, C), firstly, the feature weight WFi ∈ℝH × W × 1 and location weight WLi ∈ℝH × W × 1 is calculated simultaneously to, respectively, represent the important features in channel and different spatial positions. Then, WFi and WLi are fused together through a simple addition operation to ensure information interaction. Finally, the fused feature map is activated by a Sigmoid function and multiplied with the concatenated feature map in channel i to obtain an updated feature map with enhanced feature and location information. The updated feature maps from C channels are processed by performing a 3 × 3 convolution operation and halving the number of channels to serve as input of the subsequent convolution block.
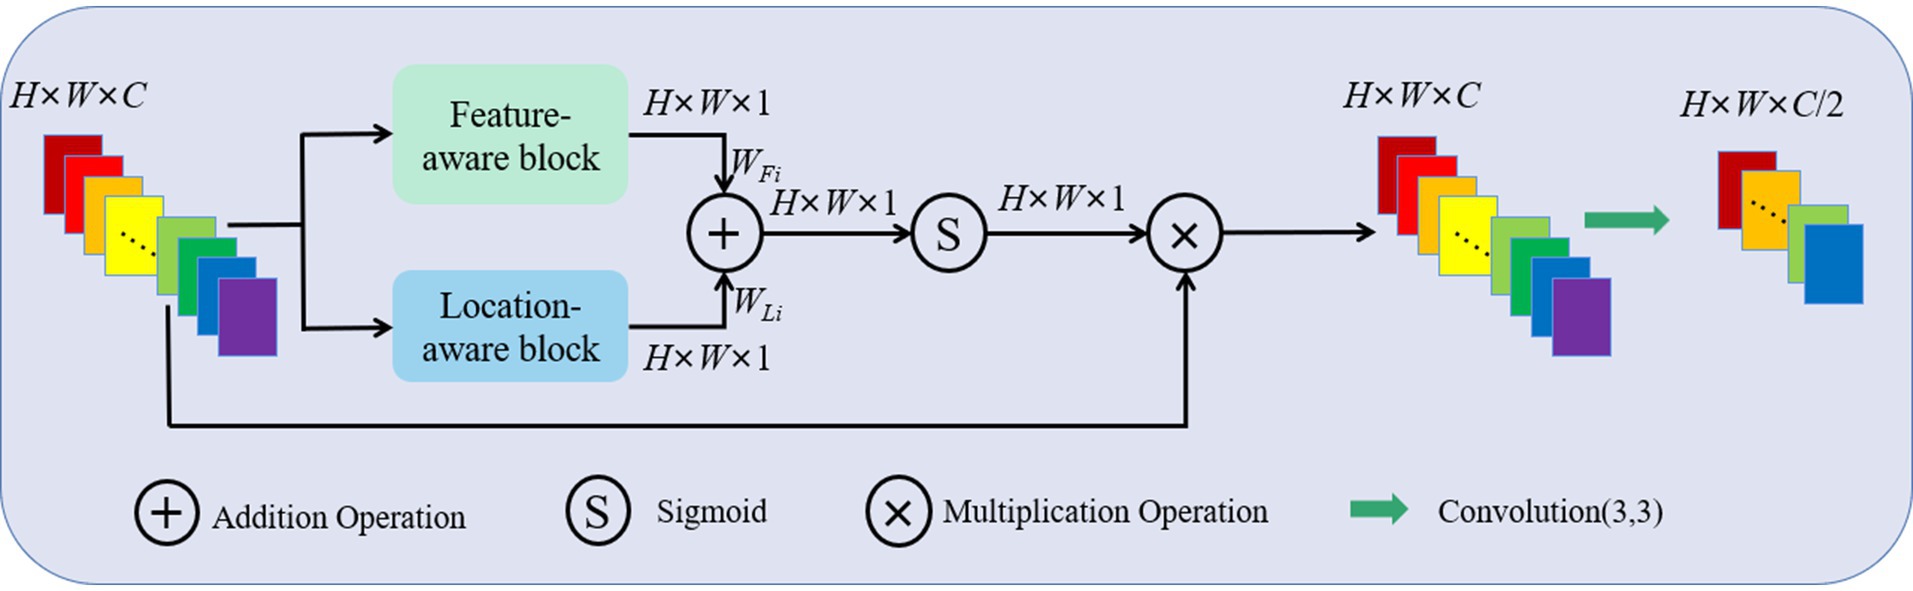
Figure 2. Schematic representation of a FLAB, which mainly consists of a feature-aware block and a location-aware block in parallel.
For the concatenated feature map Fi ∈ℝH × W × 1 in channel i, firstly, an average pooling and max pooling operation is separately performed in the feature-aware block to produce the feature maps FAvg∈ℝH × W × 1 and FMax∈ℝH × W × 1. Then, FAvg and FMax are concatenated to preserve the texture and marginal features of the image. Finally, the feature map sequentially passes through a 1 × 1 convolution layer, a ReLU activation layer and a 1 × 1 convolution layer to generate the feature weight WFi ∈ℝH × W × 1. Its form is shown in Equation 1.
In the location-aware block, an average pooling and max pooling operation is separately performed on the concatenated feature map Fi ∈ℝH × W × 1 in channel i, and the corresponding feature maps FAvg∈ℝH × W × 1 and FMax∈ℝH × W × 1 are concatenated similarly. Then, the feature map passes through a 7 × 7 convolution layer to capture the contextual information on location. The output of the convolution layer is the location weight WLi ∈ℝH × W × 1. Its form is shown in Equation 2.
Finally, WFi and WLi are fused together through a simple addition operation to ensure information interaction, as shown in Equation 3.
3.3 Model optimization and implementation details
In order to optimize the parameters of improved network model for FAZ segmentation, the joint loss function LJloss (Jia et al., 2023; Yang et al., 2023) is adopted, which includes the CE loss function LCE and the Dice loss function LDice, as shown in Equation 4.
Where, w1 and w2 are the weight coefficients, LCE is used to promote the improved model to learn more accurate classification information and improve its generalization ability, while LDice is used to help it learn more accurate boundary segmentation information, so as to improve the segmentation accuracy. By combining these two loss functions, the robustness of the model and the accuracy of segmentation can be enhanced.
According to the experimental results, w1 is set to 0.8 and w2 is set to 0.2. LCE and LDice can be expressed by the following Equations 5 and 6.
Where, y is the true label, representing the category of the sample, p is the prediction probability that the sample belongs to the positive class; X represents the positive pixel set in the prediction segmentation image and Y represents the positive pixel set in the real segmentation image, |X| and |Y| respectively indicate the size of the pixel set, while |X ∩ Y| represents the intersection size of two-pixel sets.
The proposed FLA-UNet is implemented with Pytorch framework using the NVIDIA A40 on Ubuntu, which has 48 GB memory and 19.5 TFLOPs. The Adam optimizer is used with a learning rate of 0.01, and the model is trained for 200 epochs with a batch size of 8. Each original image is cropped to a size of 480 × 480 for model training. The ratio between the training set and testing set is 7:3. Each dataset is trained three times, and the final model is determined to be the model that has the optimal value of the selected performance metrics on the testing set.
4 Experiments and results
4.1 Datasets and evaluation metrics
In order to verify the performance of the proposed FLA-UNet, three public datasets OCTAGON (Díaz et al., 2019b), FAZID (Agarwal et al., 2020) and OCTA-500 (Li et al., 2020) with high image quality are selected, and their details are listed in Table 1. OCTAGON contains 213 OCTA images with a resolution of 320 × 320, 144 of which are normal with a field of view (FOV) size of 6 × 6 mm2, and 69 of which are diabetic with a FOV size of 3 × 3 mm2. FAZID consists of 304 OCTA images with a resolution of 420 × 420, 88 of which are normal, 109 of which are myopic and 107 of which are diabetic. All of these OCTA images in FAZID have a FOV size of 6 × 6 mm2. For OCTA-500, only three states of images are selected, which are normal, myopic and diabetic. These images are divided into two sub-datasets based on different resolutions and FOV sizes. In the sub-dataset with a resolution of 400 × 400 and a FOV size of 6 × 6 mm2, there are 169 OCTA images, 91 of which are normal, 43 of which are myopic and 35 of which are diabetic. While in the sub-dataset with a resolution of 304 × 304 and a FOV size of 3 × 3 mm2, there are 195 OCTA images, 160 of which are normal, only 6 of which are myopic and 29 of which are diabetic. The corresponding sample images are shown in Figure 3.
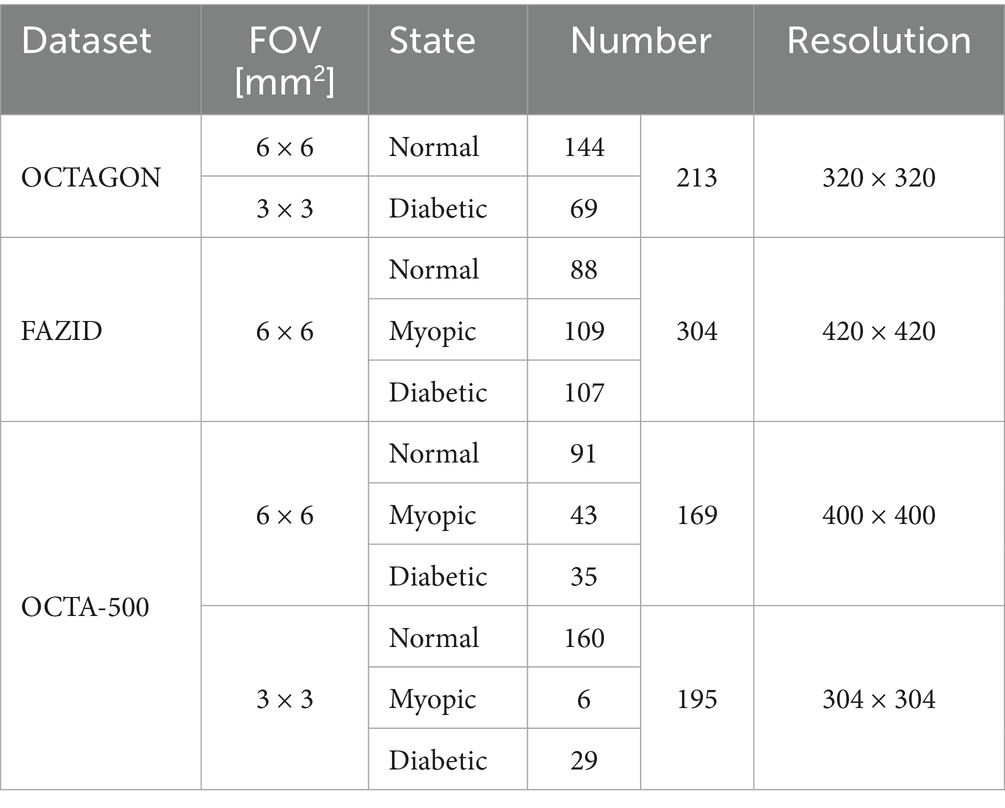
Table 1. The details of three selected datasets.
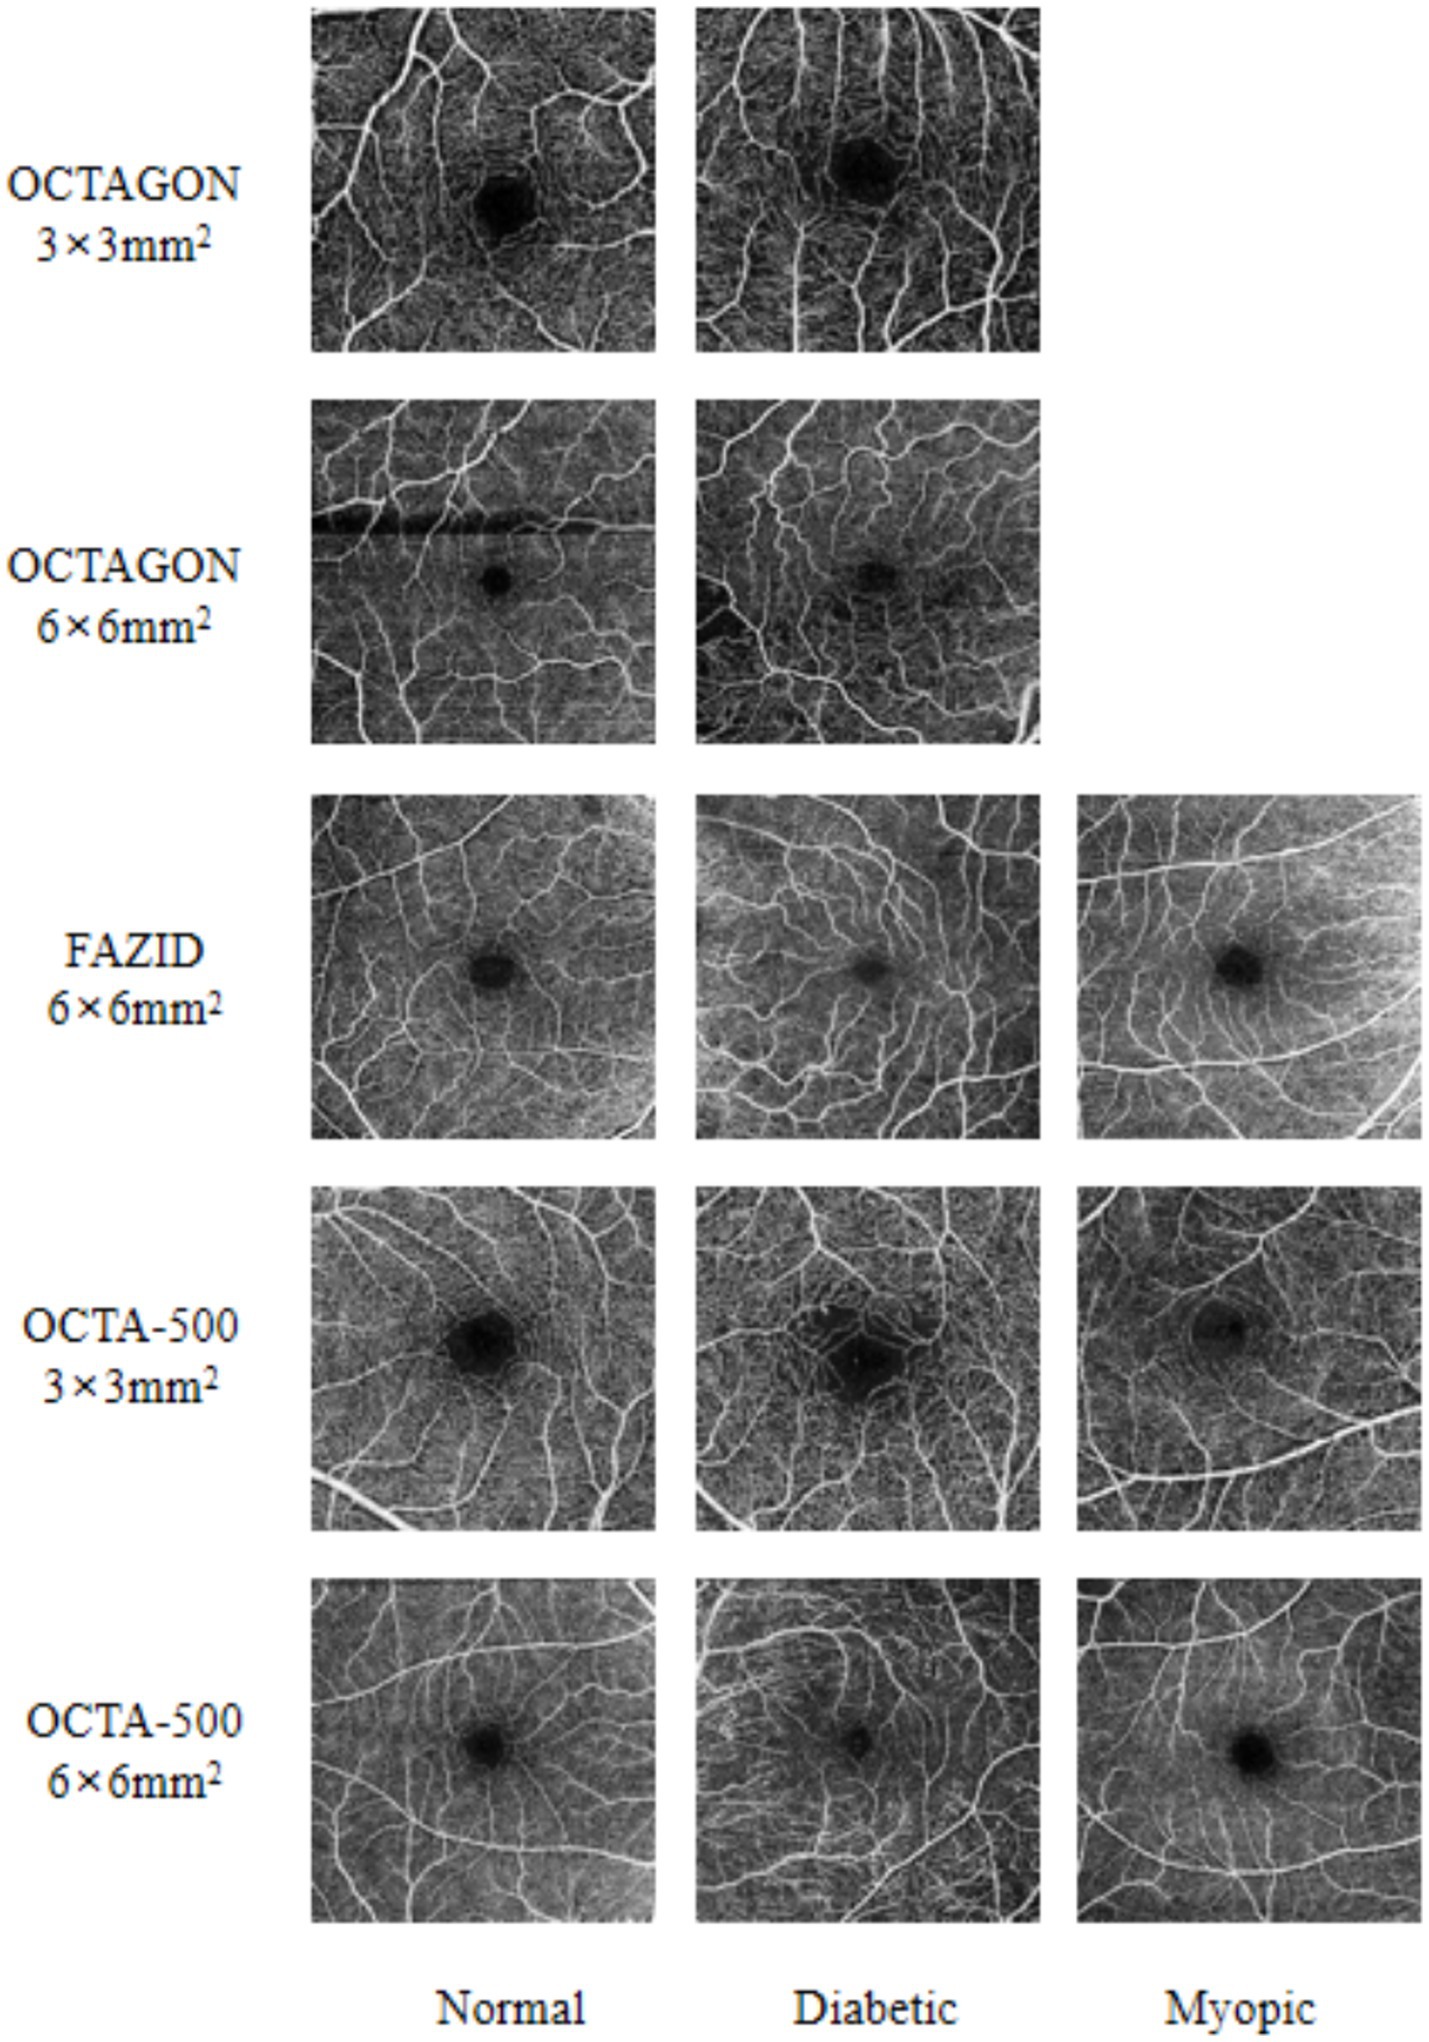
Figure 3. Some sample images from three selected datasets. The FAZ state is listed at the bottom of each column. On the left side of each row of images, the dataset where the picture is located and the field of view are marked.
The quantitative evaluation metrics used for FAZ segmentation are Mean Intersection over Union (MIoU), Accuracy (ACC) and Dice coefficient (Dice), which are defined in Equations 6–9.
Where TP, TN, FP and FN represent the numbers of true positive, true negative, false positive and false negative pixels respectively, k represents the number of segmentation categories, which is set to 1.
4.2 Qualitative comparison results
The comparative experiments with the existing state-of-the-art methods (Ronneberger et al., 2015; Gu et al., 2019; Mou et al., 2021; Zhou et al., 2020; Huang et al., 2020; Li et al., 2020; Hu et al., 2022; Li et al., 2022) are carried out to prove the superiority of our proposed method.
The segmentation results of some examples using the existing representative methods [including the U-Net (Ronneberger et al., 2015), CE-Net (Gu et al., 2019), CS2-Net (Mou et al., 2021), U-Net++ (Zhou et al., 2020) and U-Net3 + (Huang et al., 2020)] and our method are shown in Figure 4. We can see that U-Net just roughly segment the outline of FAZ, it is difficult for the basic U-Net to accurately segment the FAZ with irregular contours for myopic and diabetic patients. Despite the good segmentation result on the sample image from OCTAGON, where some sharp regions are also well segmented, CE-Net cannot segment the outline of FAZ well on the sample images from OCTA-500. The similar segmentation effect appears in CS2-Net. For U-Net++ and U-Net3+, the outlines of FAZ are affected by blood vessels, resulting in imprecise segmentation. Compared with the above segmentation results, our results have clearer outlines or margins, and are more similar to GT.
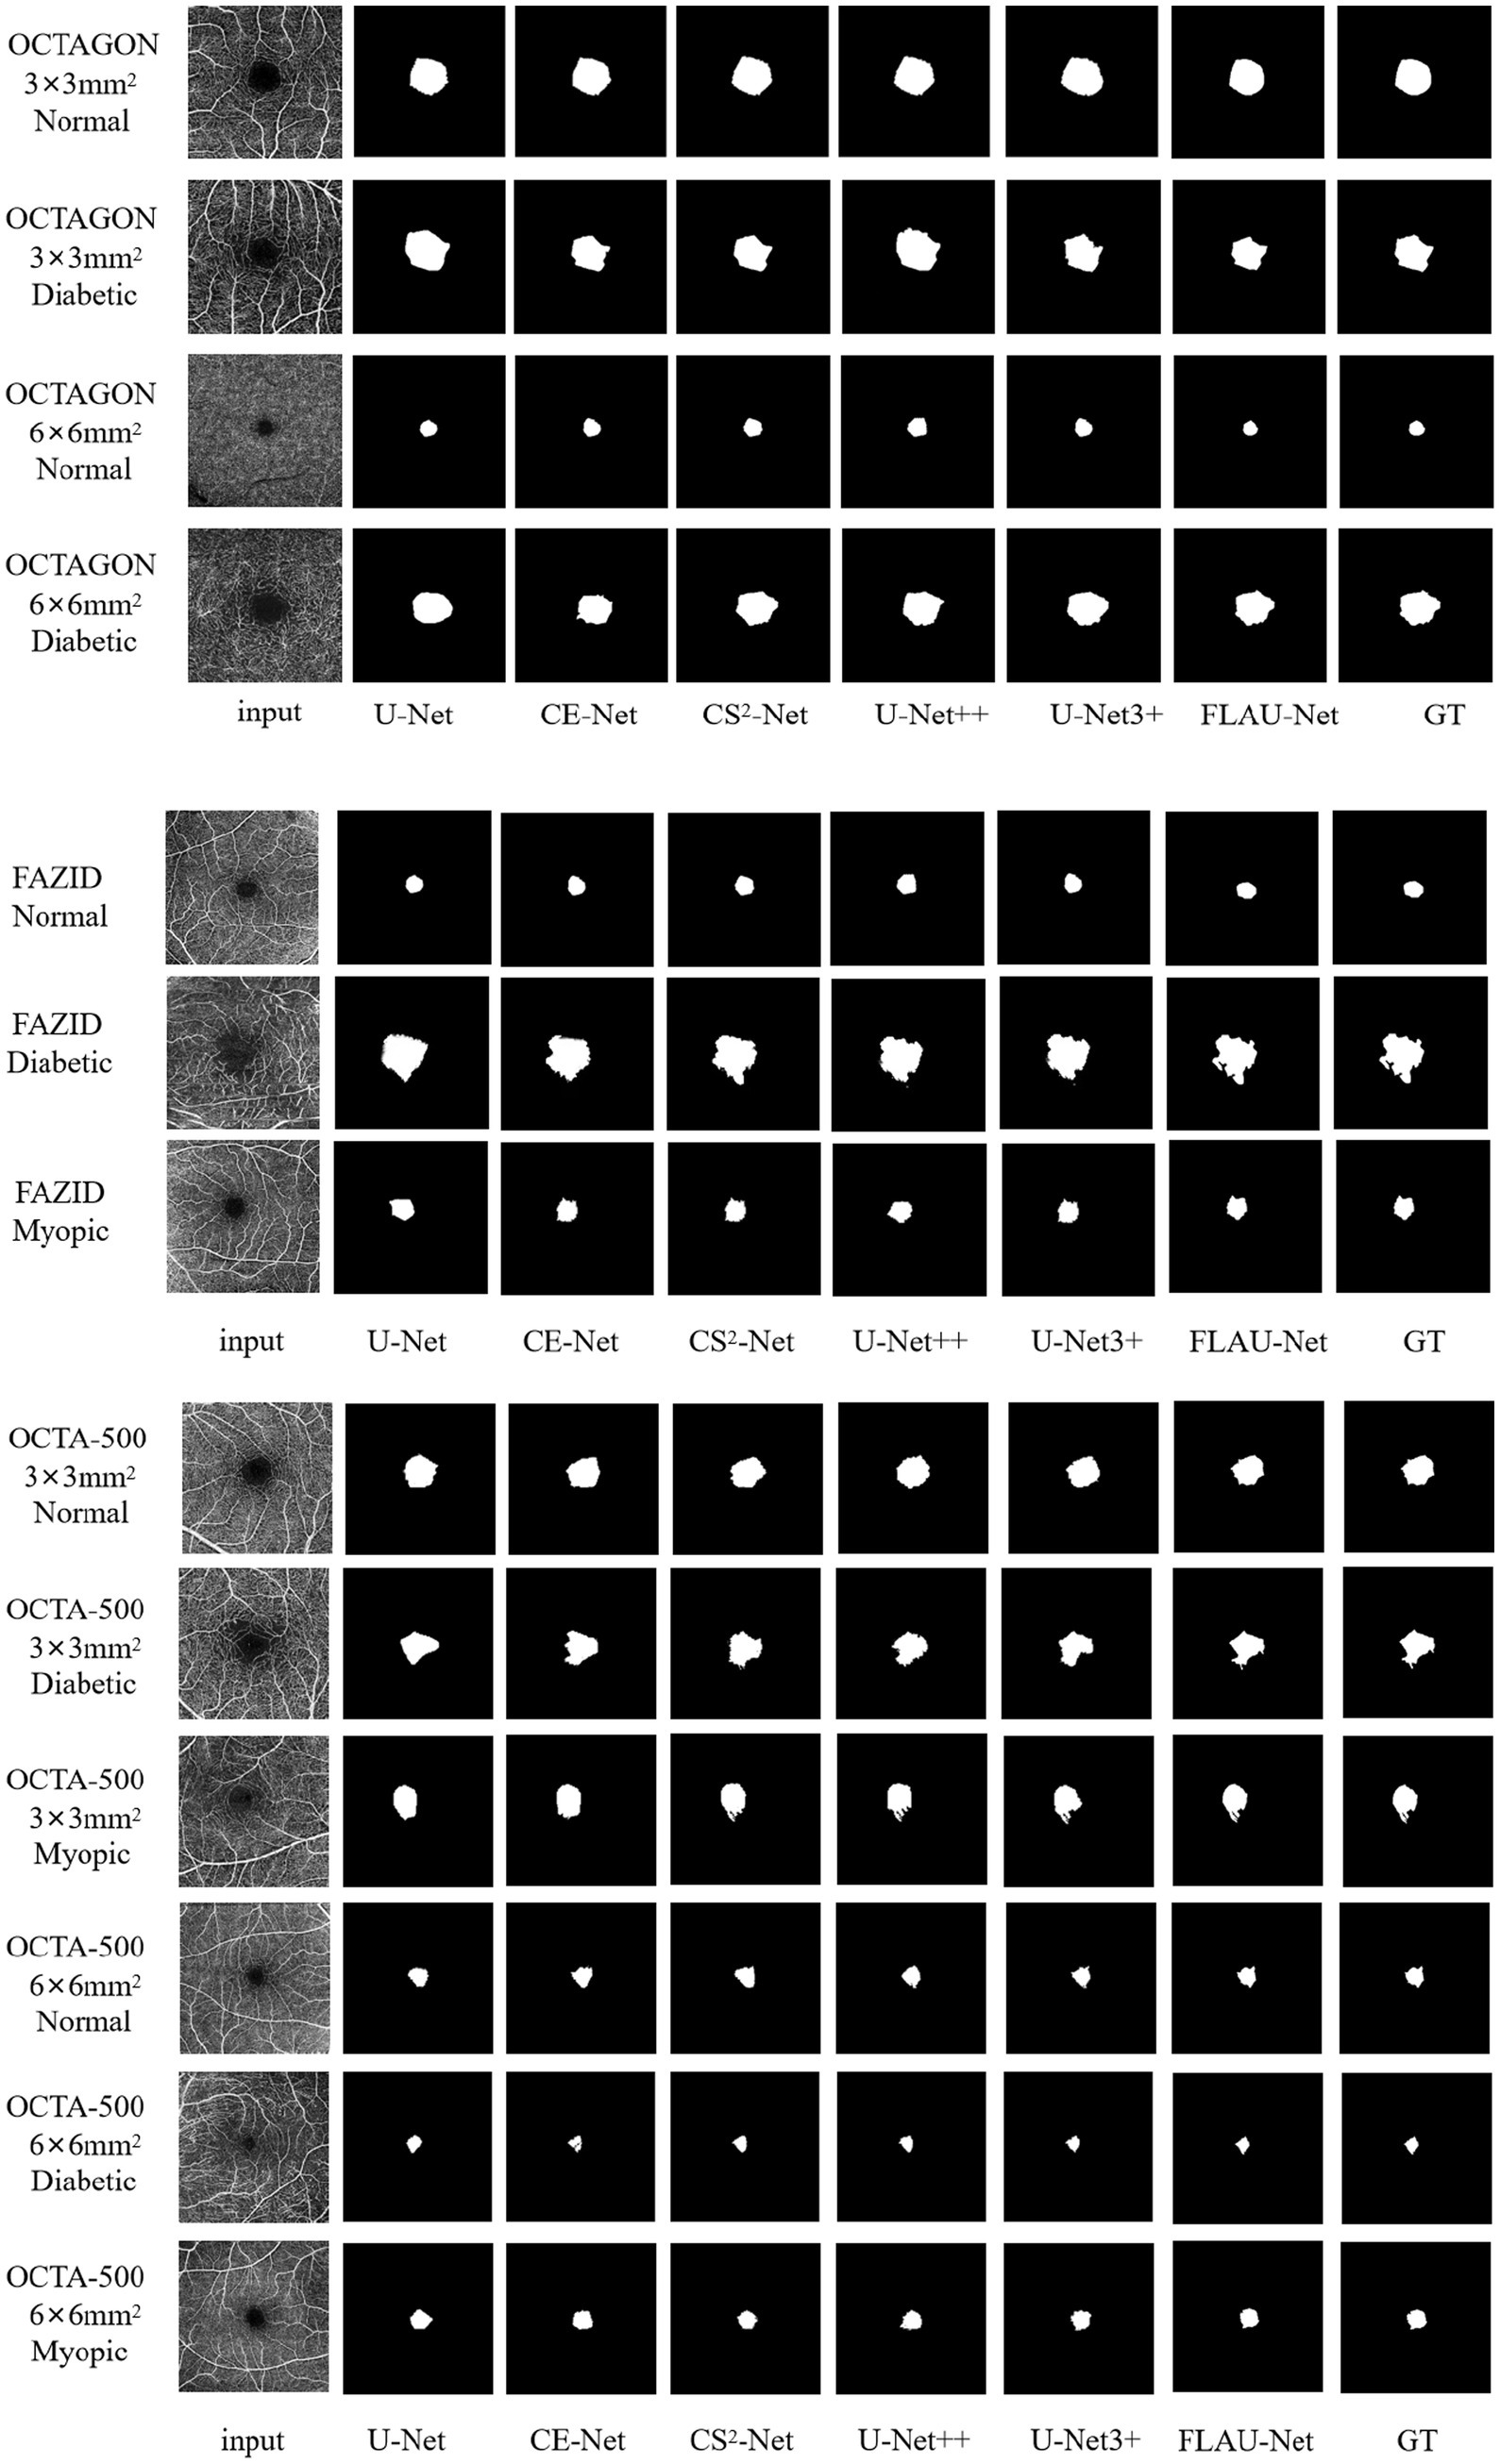
Figure 4. Qualitative comparison of segmentation results using different methods. The left-most and right-most columns, respectively, correspond to the input images and their given GT images. The name at the bottom of each column (except for the left-most and right-most columns) refers to the used segmentation method. On the left side of each row of images, the dataset where the picture is located, the field of view and the FAZ state are marked.
4.3 Quantitative comparison results
The quantitative comparison results with the existing representative methods on OCTAGON, FAZID and OCTA-500 are shown in Table 2. We can see from Table 2, our method achieves the best segmentation performance on the first two datasets. The MIoU, ACC and Dice of our method on OCTAGON (3 × 3) is, respectively, 1.23, 1.51 and 0.8% higher than results of the suboptimal method. Similarly, the MIoU, ACC and Dice of our method on FAZID is, respectively, 0.55, 2.93 and 1.19% higher than results of the suboptimal method. Although the ACC of our method on OCTAGON (6 × 6) is 1.56% lower than that of U-Net3+, its MIoU and Dice is, respectively, 2.63 and 1.54% higher. On OCTA500 (3 × 3), although both the MIoU and Dice of our method are lower than those of U-Net3+, the differences are small and the ACC of our method is still the highest. On OCTA500 (6 × 6), in spite of the slightly lower MIoU than the result of U-Net++, our method still achieves the highest ACC, and its Dice is 4.17% higher than that of the suboptimal method.
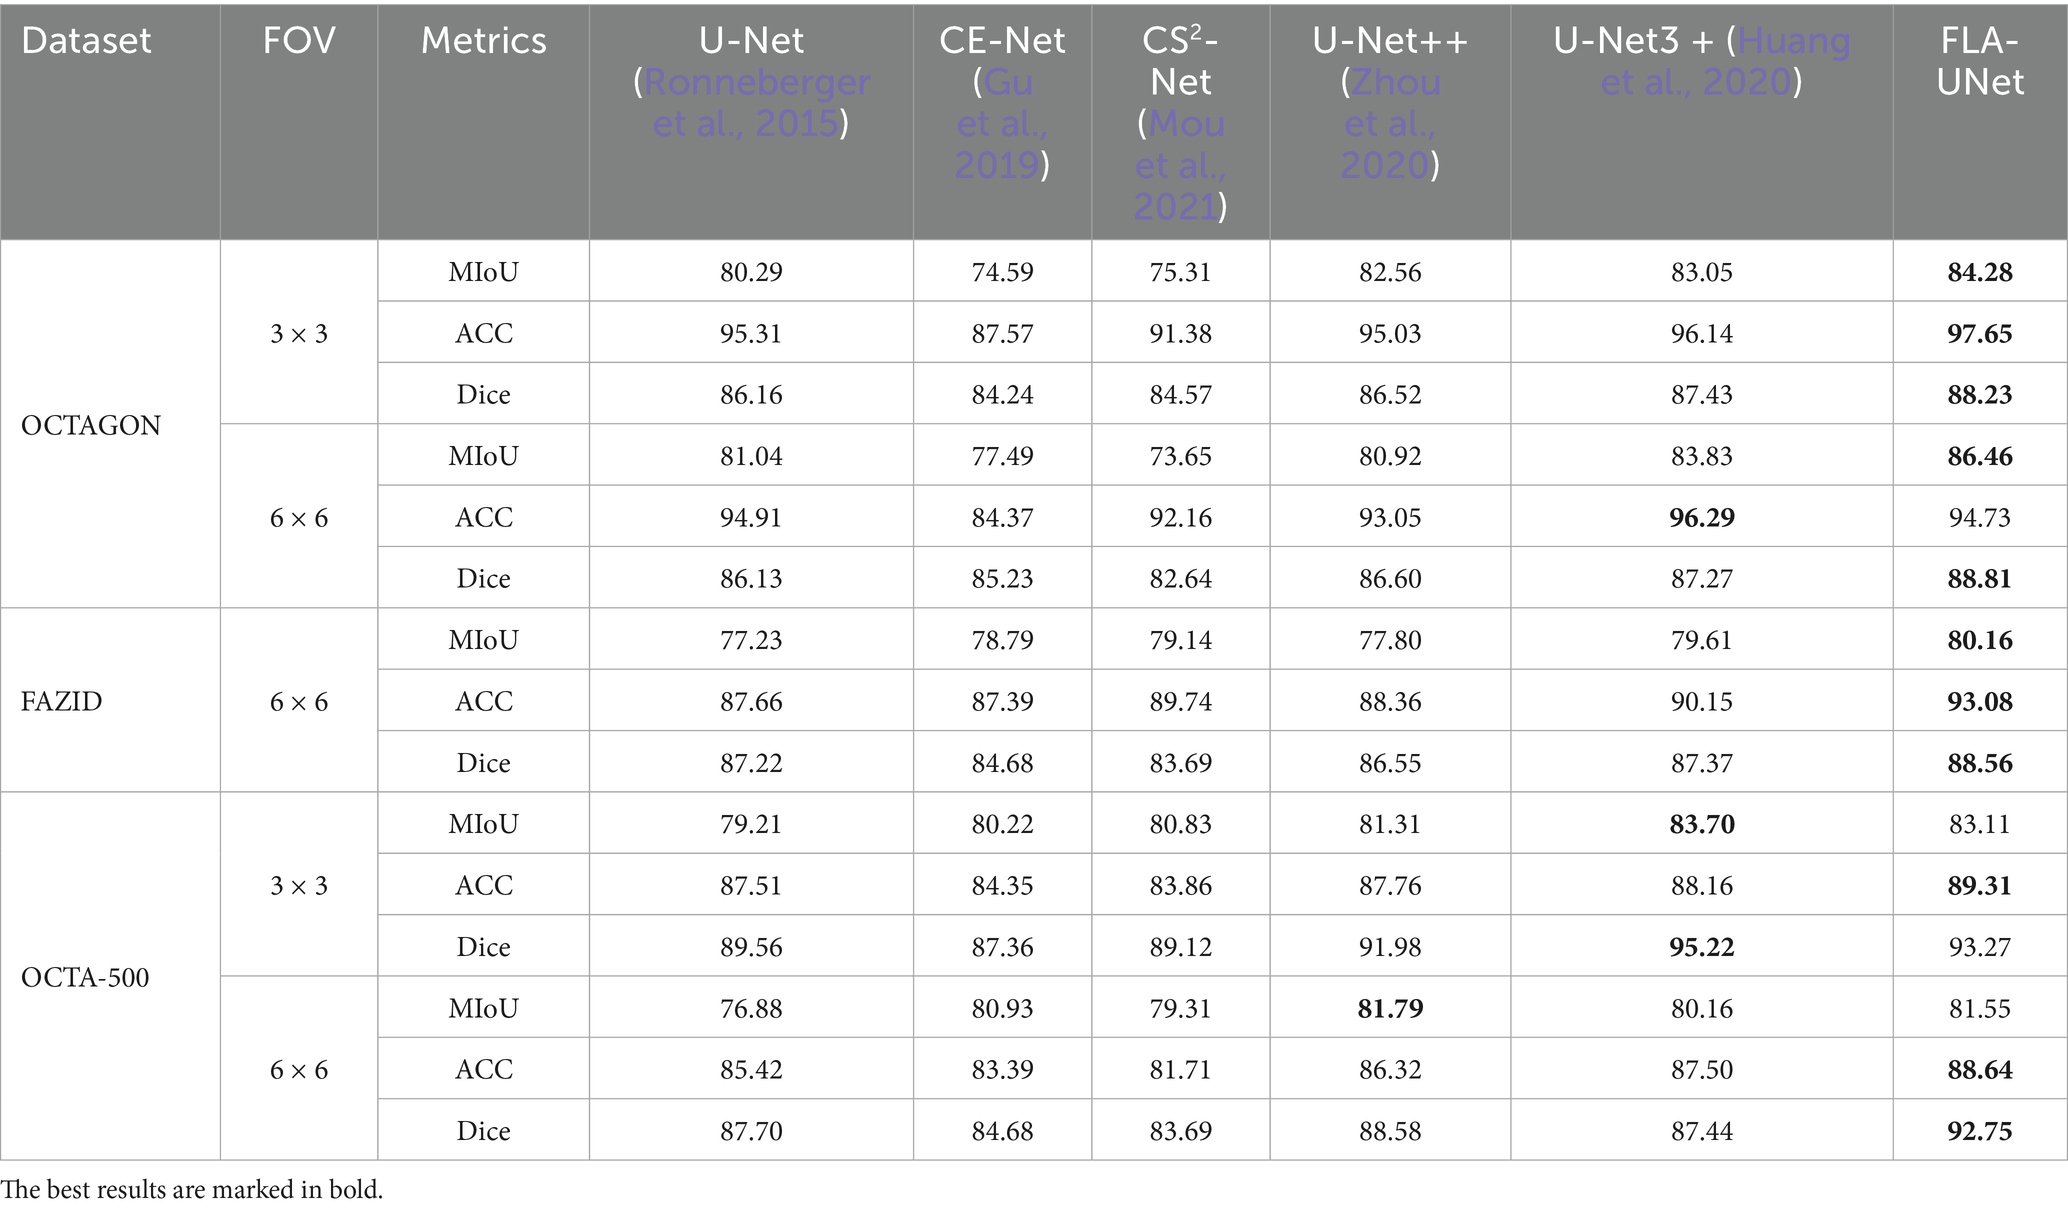
Table 2. Quantitative comparisons with the existing representative methods for FAZ segmentation.
In order to further demonstrate the superiority of our proposed method, we select some recent methods [including Automatic segmentation (Li et al., 2020), Joint-Seg (Hu et al., 2022), and RPS-Net (Li et al., 2022)] for comparison. Due to its universality and importance in medical image segmentation task, the Dice is selected as the indicator for further comparison. The comparison results on OCTAGON and OCTA-500 (6 × 6) are shown in Table 3. As can be seen from Table 3, our method achieves the highest Dice on all three datasets, which confirms its superiority over the selected recent methods.
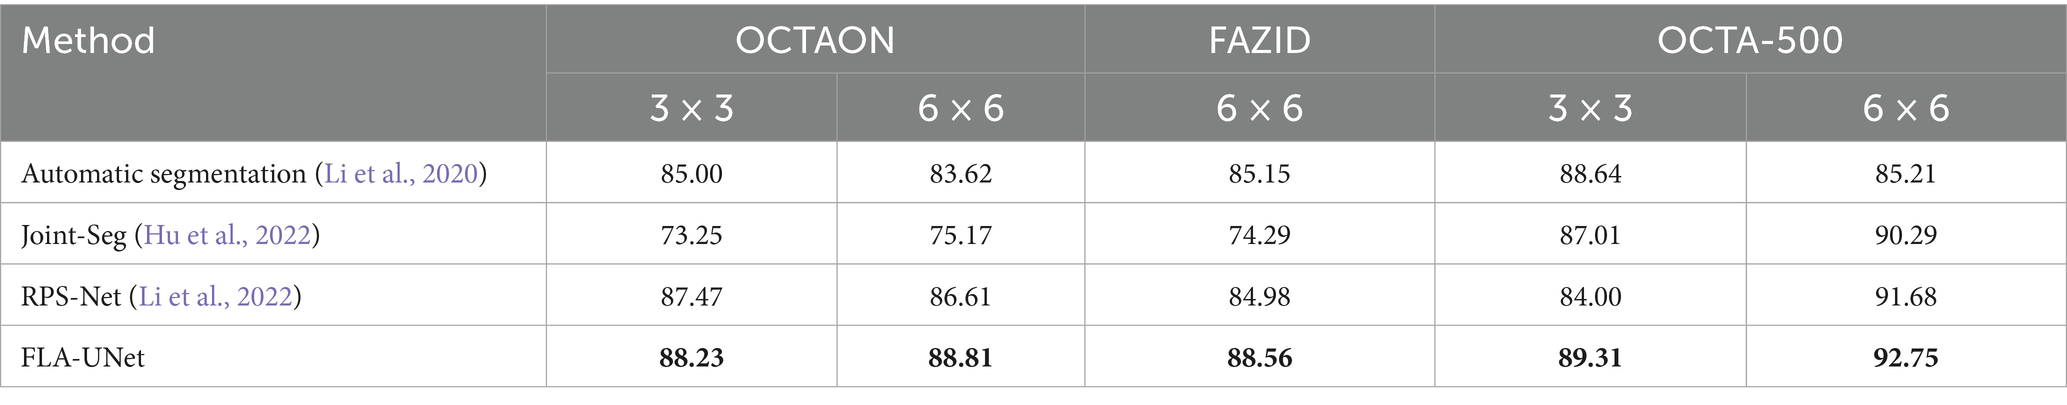
Table 3. The Dice coefficients of quantitative comparisons with the recent methods for FAZ segmentation.
4.4 Ablation studies
To demonstrate the effectiveness of FLABs and joint loss function used in our proposed method for FAZ segmentation, a series of ablation experiments are conducted. The results of quantitative comparisons for different ablation methods on three datasets are shown in Table 4.
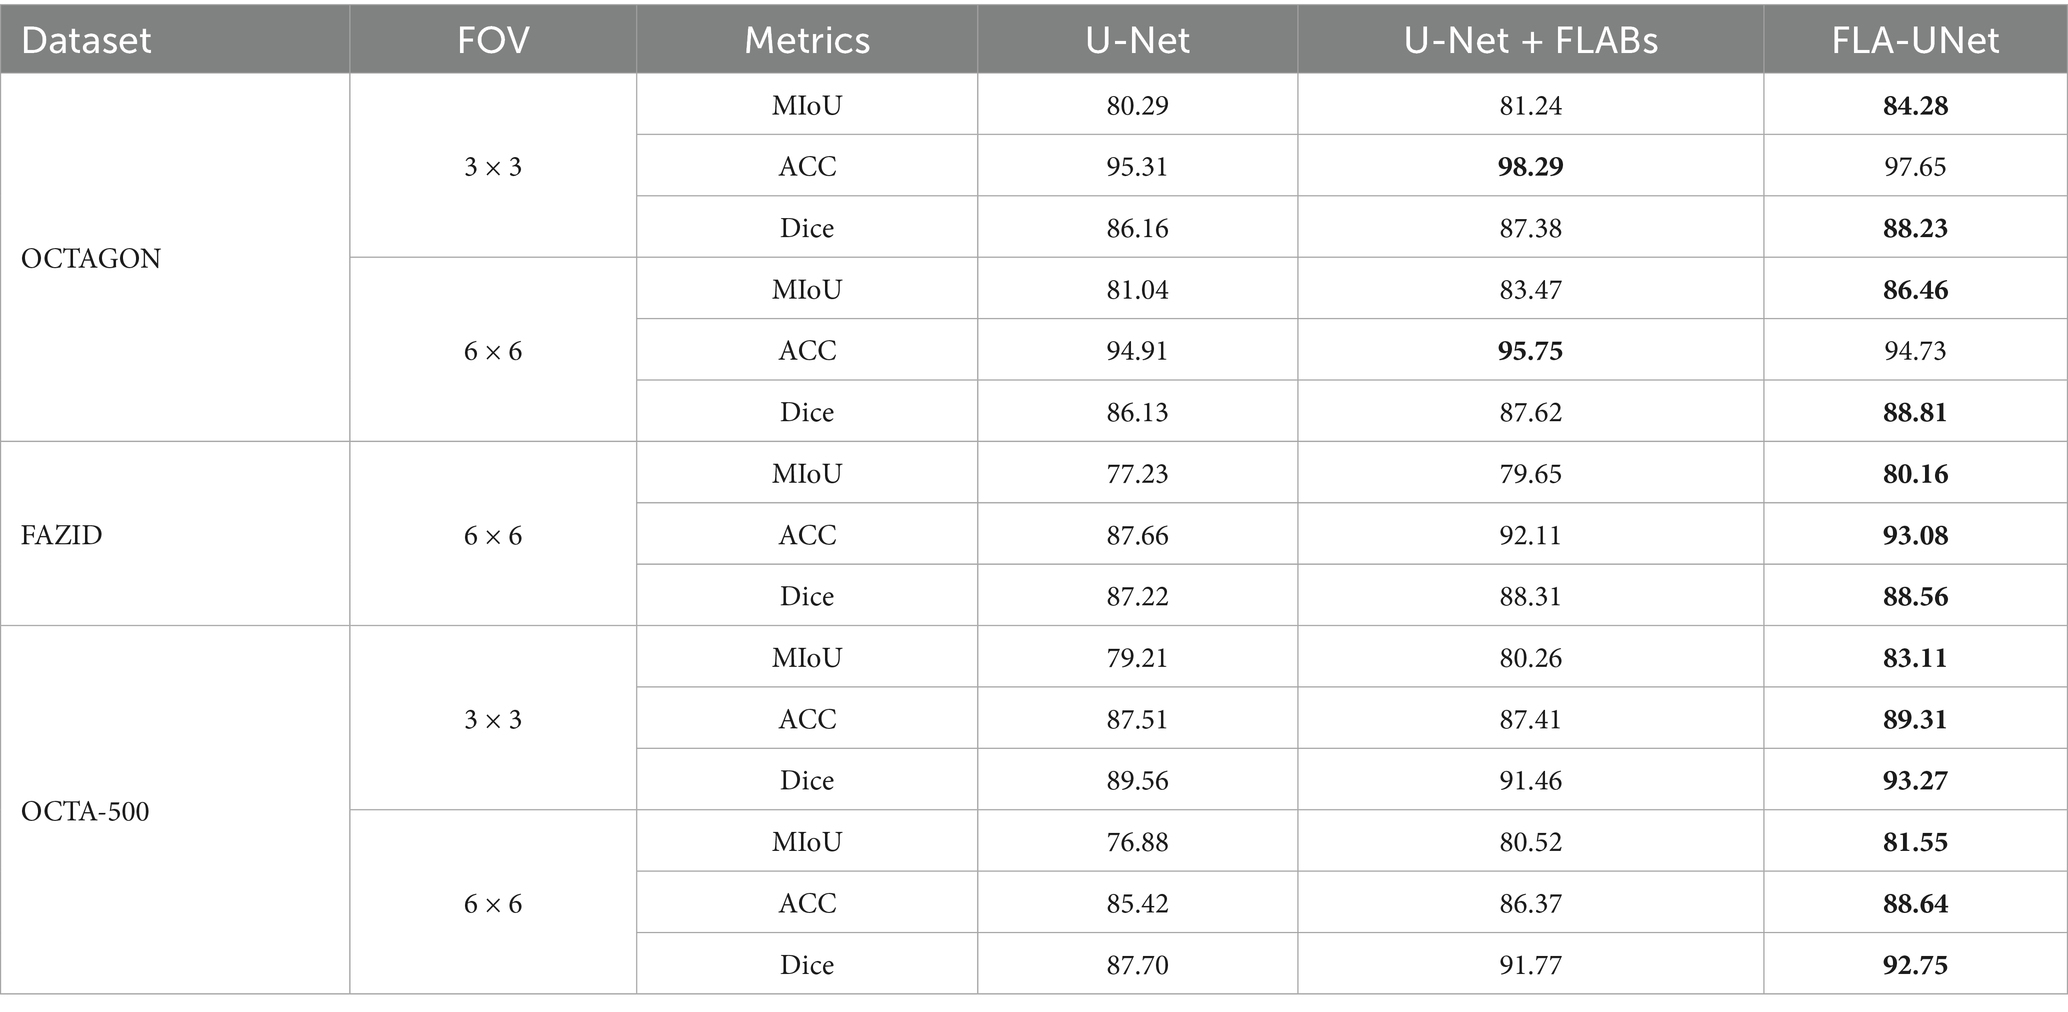
Table 4. Quantitative results of different ablation methods for FAZ segmentation.
As can be seen from Table 4, when FLABs are added in U-Net, the MIoU, ACC and Dice are improved in most cases. This proves that the strategy of introducing FLABs into U-Net is effective. When we further use the joint loss function to adjust the influence of the CE loss function and the Dice loss function, the MIoU, ACC and Dice are further improved in comparison with U-Net + FLABs in most cases. In terms of MIoU and Dice, our proposed FLA-UNet achieves the best performance on three datasets. Although the ACC of our proposed FLA-UNet is not the best on OCTAGON, it achieves the highest values on other two datasets. This proves that the strategy of using the joint loss function also helps to improve the segmentation accuracy.
Based on the above analysis, we can confirm that FLABs and joint loss function are effective, and without them, the model’s segmentation accuracy will deteriorate.
5 Conclusion
In this paper, a novel improved method named FLA-UNet is proposed for FAZ segmentation in OCTA images. On the basis of U-Net, by embedding an innovative FLAB into each decoder, the FAZ boundaries are accurately predicted; and by using the joint loss function, the optimization of the whole continuity of an image and its boundary recovery are realized. The effectiveness of FLABs and joint loss function used in FLA-UNet is verified by a series of ablation experiments conducted on OCTAGON, FAZID and OCTA-500. The quantitative comparisons with the existing representative methods on the three datasets show that our proposed FLA-UNet is superior to other methods, in most cases in terms of the MIoU, ACC and Dice coefficient. Accordingly, their qualitative comparison results also confirm this point. In addition, further quantitative comparisons with some recent methods also demonstrate the superiority of our proposed FLA-UNet. It is worth noting that since the OCTA images may be affected by eye movement, improper device parameter setting or ocular lesions of patients, which leads to blur, motion artifacts and occlusion in the images, the input images may have poor quality, as shown in the left-most column in Figure 5. Although our proposed FLA-UNet can segment FAZ to a certain extent, there is still a significant difference between the segmentation results and their GT values, which will lead to some problems in clinical application. In further work, we will try to perform data preprocessing on the input image to enhance the edge contrast between FAZ and its background, to improve the accuracy and reliability of segmentation. Furthermore, the optimization and adjustment of the loss function will also be attempted, such as introducing different train losses commonly used for non-medical applications (Sherwani et al., 2020), to enhance the robustness and generalization of the model. It is believed that, the optimization and application of our proposed FLA-UNet for FAZ segmentation will improve the accuracy of auxiliary diagnosis of fundus diseases.
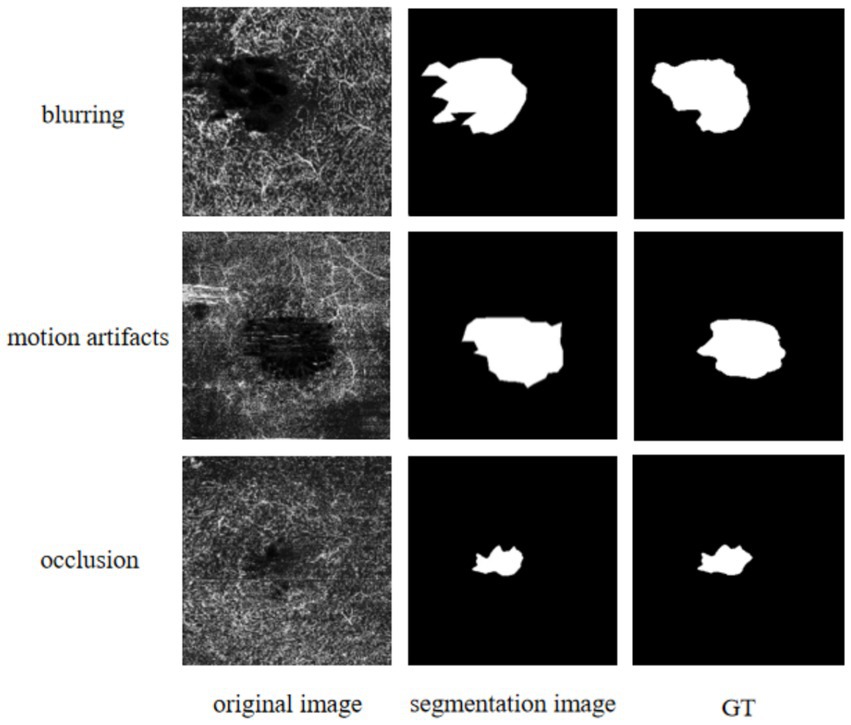
Figure 5. Qualitative results using our proposed FLA-UNet. The left-most column from top to bottom corresponds to the input images, respectively, under the conditions of blur, motion artifacts and occlusion. The middle column refers to the segmentation results using our proposed FLA-UNet. The right-most column refers to their given GT images from OCTAGON.
Data availability statement
Publicly available datasets were analyzed in this study. This data can be found at: https://ieee-dataport.org/open-access/octa-500. The source code is available at: https://github.com/LiCao-WHPU/FLA-UNet.
Author contributions
WL: Conceptualization, Data curation, Methodology, Software, Writing – original draft. LC: Conceptualization, Funding acquisition, Methodology, Writing – review & editing. HD: Conceptualization, Funding acquisition, Methodology, Writing – review & editing.
Funding
The author(s) declare that financial support was received for the research and/or publication of this article. This work was funded by Research Funding of Wuhan Polytechnic University No. 2023RZ036.
Conflict of interest
The authors declare that the research was conducted in the absence of any commercial or financial relationships that could be construed as a potential conflict of interest.
Publisher’s note
All claims expressed in this article are solely those of the authors and do not necessarily represent those of their affiliated organizations, or those of the publisher, the editors and the reviewers. Any product that may be evaluated in this article, or claim that may be made by its manufacturer, is not guaranteed or endorsed by the publisher.
References
Agarwal, A., Balaji, J. J., Raman, R., and Lakshminarayanan, V. (2020). The foveal avascular zone image database (FAZID). Conference on applications of digital image processing.
Alam, M., Le, D., and Lim, J. I. (2019). Supervised machine learning based multi-task artificial intelligence classification of retinopathies. J. Clin. Med. 8:872. doi: 10.3390/jcm8060872
Balaji, J. J., Agarwal, A., Raman, R., and Lakshminarayanan, V. (2020). Comparison of foveal avascular zone in diabetic retinopathy, high myopia, and normal fundus images. Ophthalmic Technologies XXX.
Bourennane, A. H. A. R. C. (2010). Detection of the foveal avascular zone on retinal angiograms using Markov random fields. Digit. Signal Process. 20, 149–154. doi: 10.1016/j.dsp.2009.06.005
Chen, Z., Lan, H., and Meng, Y.. (2022). FAZ-BV: a diabetic macular ischemia grading framework combining Faz attention network and blood vessel enhancement filters. IEEE International Conference on Acoustics, Speech and Signal Processing (ICASSP).
Chui, T. Y. P., Zhong, Z., and Song, H. (2012). Foveal avascular zone and its relationship to foveal pit shape. Optom. Vis. Sci. 89, 602–610. doi: 10.1097/OPX.0b013e3182504227
Díaz, M., De, M. J., Novo, J., and Ortega, M. (2019a). Automatic wide field registration and mosaicking of OCTA images using vascularity information. 23rd international conference on knowledge-based and intelligent information & engineering systems, 159, 505–513.
Díaz, M., Novo, J., Cutrín, P., Gómez-Ulla, F., Penedo, M. G., and Ortega, M. (2019b). Automatic segmentation of the foveal avascular zone in ophthalmological OCT-A images. PLoS One 14:e0212364. doi: 10.1371/journal.pone.0212364
Ghassemi, F., and Mirzadeh, M. (2007). Automated segmentation of the foveal avascular zone in angiograms using region growing. Comput. Biol. Med. 37, 70–75.
Gu, Z. A., Cheng, J., and Fu, H. Z. (2019). CE-net: context encoder network for 2D medical image segmentation. IEEE Trans. Med. Imaging 38, 2281–2292. doi: 10.1109/TMI.2019.2903562
Guo, Y., Wang, J., Jia, Y., Huang, D., and Camino, A. (2018). Med-net, a neural network for automated detection of avascular area in OCT angiography. Biomed. Opt. Express 9, 5147–5158. doi: 10.1364/BOE.9.005147
Guo, M., Zhao, M., Cheong, A. M., Corvi, F., Chen, X., Chen, S., et al. (2021). Can deep learning improve the automatic segmentation of deep foveal avascular zone in optical coherence tomography angiography? Biomed. Signal Process. Control 66:102456. doi: 10.1016/j.bspc.2021.102456
Guo, M., Zhao, M., Cheong, A. M., Dai, H., Lam, A. K., and Zhou, Y. (2019). Automatic quantification of superficial foveal avascular zone in optical coherence tomography angiography implemented with deep learning. Vis. Comput. Ind. Biomed. Art 2:9. doi: 10.1186/s42492-019-0031-8
Hu, K., Jiang, S., and Zhang, Y. (2022). Joint-seg: treat foveal avascular zone and retinal vessel segmentation in OCTA images as a joint task. IEEE Trans. Instrum. Meas. 71, 1–13. doi: 10.1109/TIM.2022.3193188
Huang, H., Lin, L, Tong, R., Hu, H., and Wu, J. (2020). U-net 3+: a full-scale connected U-net for medical image segmentation. International Conference on Acoustics, Speech and Signal Processing (ICASSP).
Jia, W., Ma, S., Geng, P., and Sun, Y. (2023). DT-net: joint dual-input transformer and CNN for retinal vessel segmentation. Comput. Mater. Contin. 76, 3393–3411. doi: 10.32604/cmc.2023.040091
Kashani, A. H., Chen, C. L., and Gahm, J. K. (2017). Optical coherence tomography angiography: a comprehensive review of current methods and clinical applications. Prog. Retin. Eye Res. 60, 66–100. doi: 10.1016/j.preteyeres.2017.07.002
Li, M., Chen, Y., Ji, Z., Xie, K., and Li, S. (2020). Image projection network: 3D to 2D image segmentation in octa images. IEEE Trans. Med. Imaging 39, 3343–3354. doi: 10.1109/TMI.2020.2992244
Li, M., Huang, K., Xu, Q., Yang, J., Zhang, Y., Ji, Z., et al. (2020). OCTA-500: a retinal dataset for optical coherence tomography angiography study. Med. Image Anal. 93:103092. doi: 10.1016/j.media.2024.103092
Li, W. S., Zhang, H. C., and Li, F. Y. (2022). RPS-net: an effective retinal image projection segmentation network for retinal vessels and foveal avascular zone based on OCTA data. Med. Phys. 49, 3830–3844. doi: 10.1002/mp.15608
Lin, L., Wang, Z., Wu, J., Huang, Y., Lyu, J., and Cheng, P. (2021). BSDA-Net: a boundary shape and distance aware joint learning framework for segmenting and classifying OCTA images. In The 24th International Conference on Medical Image Computing and Computer Assisted Intervention (MICCAI), Strasbourg, France, 27th September to 1st October.
Liu, H., and Li, M. (2019). Automated segmentation of foveal avascular zone in optical coherence tomography angiography images using sparse deep learning. J. Biomed. Opt. 24, 1–10.
Liu, X., Li, J., Zhang, Y., and Yao, J. (2025). Dual-branch image projection network for geographic atrophy segmentation in retinal OCT images. Sci. Rep. 15:6535. doi: 10.1038/s41598-025-90709-6
Liu, J., Yan, S., Lu, N., Yang, D., Fan, C., and Lv, H. (2022). Automatic segmentation of foveal avascular zone based on adaptive watershed algorithm in retinal optical coherence tomography angiography images. J. Innov. Opt. Health Sci. 15:13. doi: 10.1142/S1793545822420019
Mou, L., Zhao, Y., Fu, H., Liu, Y., Cheng, J., Zheng, Y., et al. (2021). CS2-Net: deep learning segmentation of curvilinear structures in medical imaging. Med. Image Anal. 67:101874. doi: 10.1016/j.media.2020.101874
Ronneberger, O., Fischer, P., and Brox, T. (2015). U-net: Convolutional networks for biomedical image segmentation. Medical Image Computing and Computer Assisted Intervention, Springer, Cham 9351, 234–241.
Sherwani, M. K., and Gopalakrishnan, S. (2024). A systematic literature review: deep learning techniques for synthetic medical image generation and their applications in radiotherapy. Front. Radiol. 4:1385742. doi: 10.3389/fradi.2024.1385742
Sherwani, M.K., Zaffino, P., Bruno, P., Spadea, M.F., and Calimeri, F. (2020). Evaluating the impact of training loss on MR to synthetic CT conversion. International conference on machine learning, optimization, and data science. LOD. Lecture Notes in Computer Science, Springer, Cham 12565.
Simó, A., and Ves, E. D. (2001). Segmentation of macular fluorescein angiographies. A statistical approach. Pattern Recogn. 34, 795–809. doi: 10.1016/S0031-3203(00)00032-7
Yang, C., Fan, J., Bai, Y., Li, Y., Xiao, Q., Li, Z., et al. (2024). ODDF-net: multi-object segmentation in 3D retinal OCTA using optical density and disease features. Knowl.-Based Syst. 306:112704. doi: 10.1016/j.knosys.2024.112704
Yang, D., Li, Y., and Yu, J. (2023). Multi-task thyroid tumor segmentation based on the joint loss function. Biomed. Signal process. Control 79:104249. doi: 10.1016/j.bspc.2022.104249
Yang, Z. K., Qu,, Yu, W. H., Xiao,, Zhang,, and Dong, F. (2016). A morphological study of the foveal avascular zone in patients with diabetes mellitus using optical coherence tomography angiography. Graefes Arch. Clin. Exp. Ophthalmol. 254, 873–879. doi: 10.1007/s00417-015-3143-7
Keywords: optical coherence tomography angiography (OCTA), foveal avascular zone (FAZ) segmentation, feature-location attention, joint loss function, U-Net
Citation: Li W, Cao L and Deng H (2025) FLA-UNet: feature-location attention U-Net for foveal avascular zone segmentation in OCTA images. Front. Artif. Intell. 8:1463233. doi: 10.3389/frai.2025.1463233
Edited by:
Rizwan Qureshi, Hamad bin Khalifa University, QatarReviewed by:
Moiz Khan Sherwani, University of Copenhagen, DenmarkSharmeen Tole, Institute of Chemical Technology, India
Muhammad Ammar Khawer, Hong Kong Metropolitan University, Hong Kong SAR, China
Copyright © 2025 Li, Cao and Deng. This is an open-access article distributed under the terms of the Creative Commons Attribution License (CC BY). The use, distribution or reproduction in other forums is permitted, provided the original author(s) and the copyright owner(s) are credited and that the original publication in this journal is cited, in accordance with accepted academic practice. No use, distribution or reproduction is permitted which does not comply with these terms.
*Correspondence: Li Cao, MTI1OTFAd2hwdS5lZHUuY24=