 Singaraju Ramya†
 R. I. Minu*†
- Department of Computing Technologies, School of Computing, SRM Institute of Science and Technology, Chennai, India
In recent years, Oral Squamous Cell Carcinoma (OSCC) has been a common tumor in the orofacial region, affecting areas such as the teeth, jaw, and temporomandibular joint. OSCC is classified into three grades: “well-differentiated, moderately differentiated, and poorly differentiated,” with a high morbidity and mortality rate among patients. Several existing methods, such as AlexNet, CNN, U-Net, and V-Net, have been used for OSCC classification. However, these methods face limitations, including low ACC, poor comparability, insufficient data collection, and prolonged training times. To address these limitations, we introduce a novel Deep Transformer Encoder-Assisted Dilated Convolution with Global Attention (DeTr-DiGAtt) model for OSCC classification. To enhance the dataset and mitigate over-fitting, a GAN model is employed for data augmentation. Additionally, an Adaptive Bilateral Filter (Ad-BF) is used to improve image quality and remove undesirable noise. For accurate identification of the affected region, an Improved Multi-Encoder Residual Squeeze U-Net (Imp-MuRs-Unet) model is utilized for segmentation. The DeTr-DiGAtt model is then applied to classify different OSCC grading levels. Furthermore, an Adaptive Grey Lag Goose Optimization Algorithm (Ad-GreLop) is used for hyperparameter tuning. The proposed method achieves an accuracy (ACC) of 98.59%, a Dice score of 97.97%, and an Intersection over Union (IoU) of 98.08%.
1 Introduction
Oral Squamous Cell Carcinoma (OSCC) is one of the most prevalent malignancies affecting the oral cavity and remains a major cause of morbidity and mortality worldwide. Despite advances in diagnostic tools, the prognosis of OSCC patients continues to depend largely on the stage and grade of the disease at the time of detection (Chu et al., 2021). Early and accurate identification of tumor grade is therefore crucial for guiding treatment strategies and improving survival outcomes.
Traditional histopathological diagnosis, while effective, relies heavily on the expertise of pathologists and is prone to inter-observer variability, leading to inconsistencies in classification (Sukegawa et al., 2023). With the growing volume of biopsy samples, manual examination has become increasingly challenging, often resulting in delays and diagnostic inaccuracies (Yoshizawa et al., 2022). These challenges highlight the need for automated, reliable systems that can assist clinicians in achieving more consistent and efficient diagnostic outcomes.
In recent years, deep learning (DL) has emerged as a powerful tool in medical image analysis, enabling significant progress in cancer detection, segmentation, and classification. Several studies have explored CNN-based and transformer-based approaches for OSCC and related cancers. For instance, Wako et al. (2022) applied transfer learning (TL) with CNNs for margin classification of squamous cell carcinoma, reporting strong performance but noting reduced accuracy in the absence of hybrid models. Alanazi et al. (2022) introduced an intelligent DL-enabled OSCC detection framework combining NasNet features with a deep belief network, achieving promising accuracy but limited generalization to unseen data. Similarly, Albalawi et al. (2024) employed EfficientNet B3 for OSCC classification on histopathological images, though performance was constrained by dataset size. Peng et al. (2024) investigated various TL models such as Inception v4, ShuffleNet V2, and ResNet 50 for Oral Epithelial Dysplasia (OED) grading, but accuracy improvements remained modest. Das et al. (2024) developed an ensemble model combining CNN classifiers, achieving 97.88% accuracy, though their work was restricted to binary classification. Beyond histopathology, Flügge et al. (2023) utilized transformers for OSCC detection in clinical photographs, while Li et al. (2024) combined MRI-based transformers with radiomics for early- and late-stage OSCC detection.
Collectively, these studies demonstrate the potential of deep learning for OSCC analysis. However, challenges such as limited datasets, over fitting, computational inefficiency (Deif et al., 2022), absence of hybrid approaches, and poor real-time applicability persist. Moreover, most existing works focus on binary classification rather than multi-class grading (Ananthakrishnan et al., 2023), which is critical for clinical decision-making.
Motivated by these gaps, this work introduces a robust hybrid framework for OSCC classification and grading from histopathological images (Yang et al., 2022). The proposed approach incorporates GAN-based augmentation to address data scarcity, adaptive filtering for noise removal, an improved multi-encoder residual squeeze U-Net for segmentation, and a transformer encoder-assisted dilated convolution with global attention (DeTr-DiGAtt) for classification (Ahmad et al., 2023). Additionally, hyperparameters are optimized using the Adaptive Grey Lag Goose Optimization algorithm to enhance model efficiency. The results demonstrate that the proposed method not only achieves higher accuracy but also improves generalization, thereby reducing diagnostic subjectivity and supporting clinicians with a reliable decision-support tool (Rahman et al., 2022; Lin and Chen, 2022).
2 Proposed methodology
The proposed methodology is designed to achieve accurate classification and grading of Oral Squamous Cell Carcinoma (OSCC) from histopathological images through a structured multi-stage pipeline (Panigrahi et al., 2023; Das et al., 2023). First, data augmentation is performed using Generative Adversarial Networks (GANs) to address the challenge of limited and imbalanced datasets. The images are then pre-processed through resizing, normalization, and color standardization to ensure consistency across the dataset (Fatapour et al., 2023). In the next stage, segmentation is carried out using advanced deep learning-based architectures to isolate tumor regions and enhance relevant features (Haq et al., 2023; Mohan et al., 2023). Following segmentation, discriminative features are extracted using statistical and texture-based descriptors, which capture both local and global image characteristics. Finally, classification models—including hybrid deep learning networks and optimized transformers—are applied to categorize the images into normal, tumor, and graded OSCC classes (Meer et al., 2025; Dhanya et al., 2024; Kumar et al., 2024). This systematic approach enhances diagnostic accuracy while overcoming challenges related to data scarcity, intra-class variability, and complex tissue structures.
2.1 Data augmentation
GAN-based data augmentation (Zhang et al., 2022) can be used to reduce overfitting problems and obtain reliable improvements from the proposed method. GANs are useful for diversifying datasets by generating new models. Where and represent the generator and a discriminator, which is defined as following Equation 1.
Where represents the probability distribution of data variables , represents the value function, represents noise variables and and represents fake samples that are generated from the random noise (Ghaznavi et al., 2024; Suiçmez, 2025). This has significantly augmented the overall sample count in the dataset using the GAN model (Figure 1).
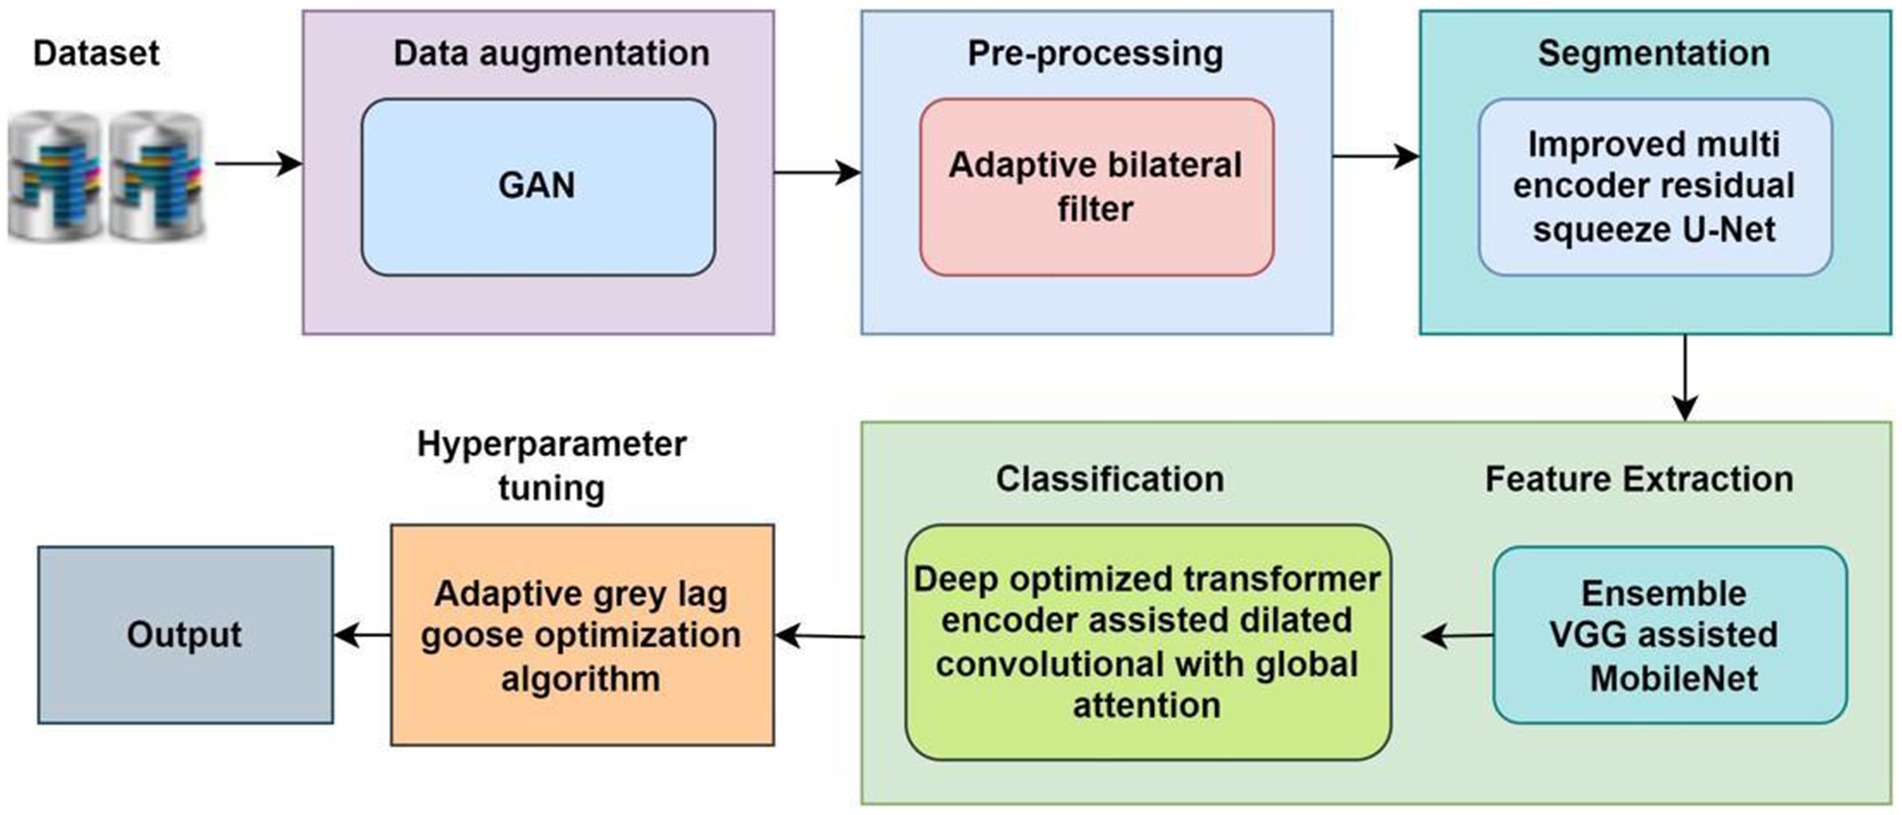
Figure 1. Overall flow diagram.
2.2 Pre-processing
Traditional filters such as median filters and Gaussian filters have some limitations, including low-quality images and high noise. To overcome these limitations, the new method uses an adaptive bilateral filter (Bedi et al., 2024). The adaptive bilateral filter effectively removes noise from the input image defined by the following Equation 2.
Where represent the range of image, represent the width of the image, represents the center of pixel window, and represents the standard derivation of the domain. This model has been effectively de-noised the image.
2.3 Segmentation using improved multi-encoder residual squeeze U-net model
The existing segmentation methods had some limitations, such as overtime duration, blurred image quality, and insufficient edges (Abuhayi et al., 2024; Islam et al., 2024). To overcome those existing limitations, introduce Figure 2 which is shown as a novel improved multi-encoder residual squeeze U-Net model.
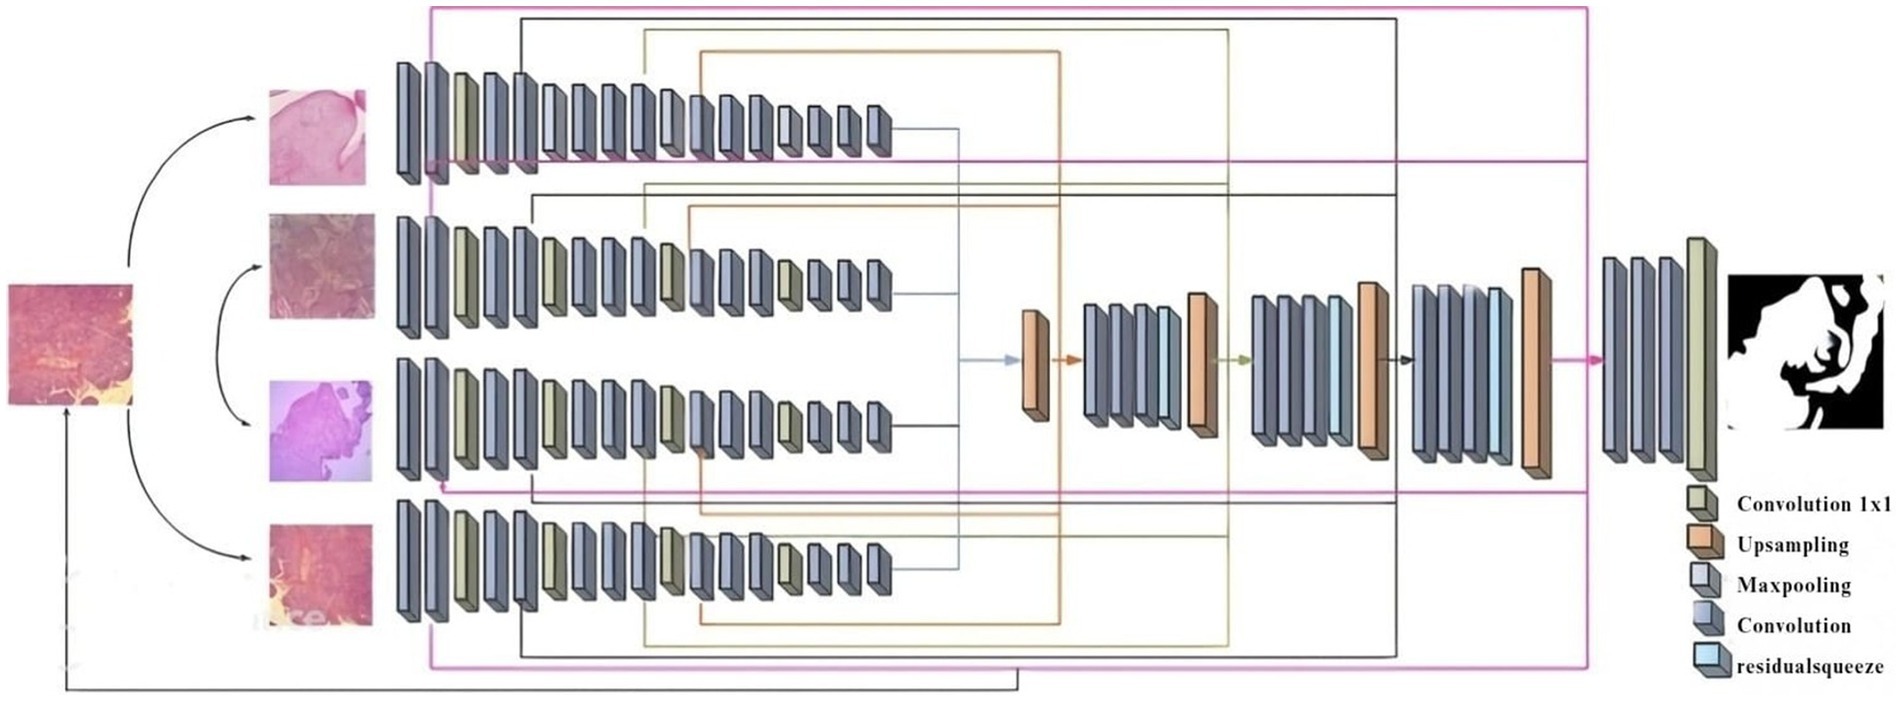
Figure 2. Diagram for Imp-MuRs-Unet.
The multi-encoder (Wang et al., 2022) input feature map, convolution layer is assed to each upsampling to obtain essential information of 1D channel attention map and a 2D spatial attention map. It can be define as following Equations 3, 4.
Where represent the element-wise multiplication, and represent the spatial and the channel attention map, which is calculated by following Equations 5, 6.
Where and represent the maximum and average pooling, represent the multi-layer of perceptron, represent the operation of convolution with filter size.
2.3.1 Encoder
The input feature map Processed through the multi-encoder to generate a one-dimensional feature map of a predefined length. The encoder includes M layer of multi-layer perceptron (MLP) and multi-head attention (MHA). Here encode the location information by directly adding learnable level embedding to the feature map. To construct the encoder’s input sequence as Equation 7 follows:
The output of the MHA is then switched with the residual connection through an MLP block, which is defined as following Equation 8.
Where represent the output of the layer and represent the normalization operator.
2.3.2 Decoder
For better ischemia stroke segmentation, skip-connectors are connected to decoder parallels with low-level features. The decoder system of the U-Net framework uses the Squeeze and-Excitation (SE) module (Suiçmez, 2025) to optimize the combination of “high-level and low-level characteristics.” The squeeze operation is achieved global average ensemble compress global spatial information into a single channel representation, which is calculated as following Equation 9.
Where represent the input, represent the data after squeeze operation, represent the squeeze function, and denote the width and height of the feature map. For Excitation Layer, here consider and is the Weights of the first and second fully correlated layer, ReLU activation function. Excitation Layer are define as following Equation 10:
Convolution is coupled with a residual connection, which retains valuable information from previous layers and helps reduce possible information loss during processing. It can be address vanishing and exploding gradients problems. It can calculated as following Equations 11, 12.
Where represent the residual function, and represent the I/o of the residual unit, represent the identity mapping function. With the suggested method, the picture has been divided well.
2.4 Feature extraction using ensemble VGG assisted Mobile Net model
The Mobile VGG framework is built using deep separable curves. Existing methods such as ResNet, InceptionNet, and so on had some limitations, such as complex textural features, size, and shape for feature extraction. To overcome that limitation, introduce a novel VGG-Mob. The VGG (Albalawi et al., 2024) network was built with very small convolutional filters for image recognition. VGG 16 structure follows convolution and pooling layer. It contains Hierarchical Deep Features like Edge, Texture, Shape, Tumor Clustering, Color Intensity shown in Figure 3.
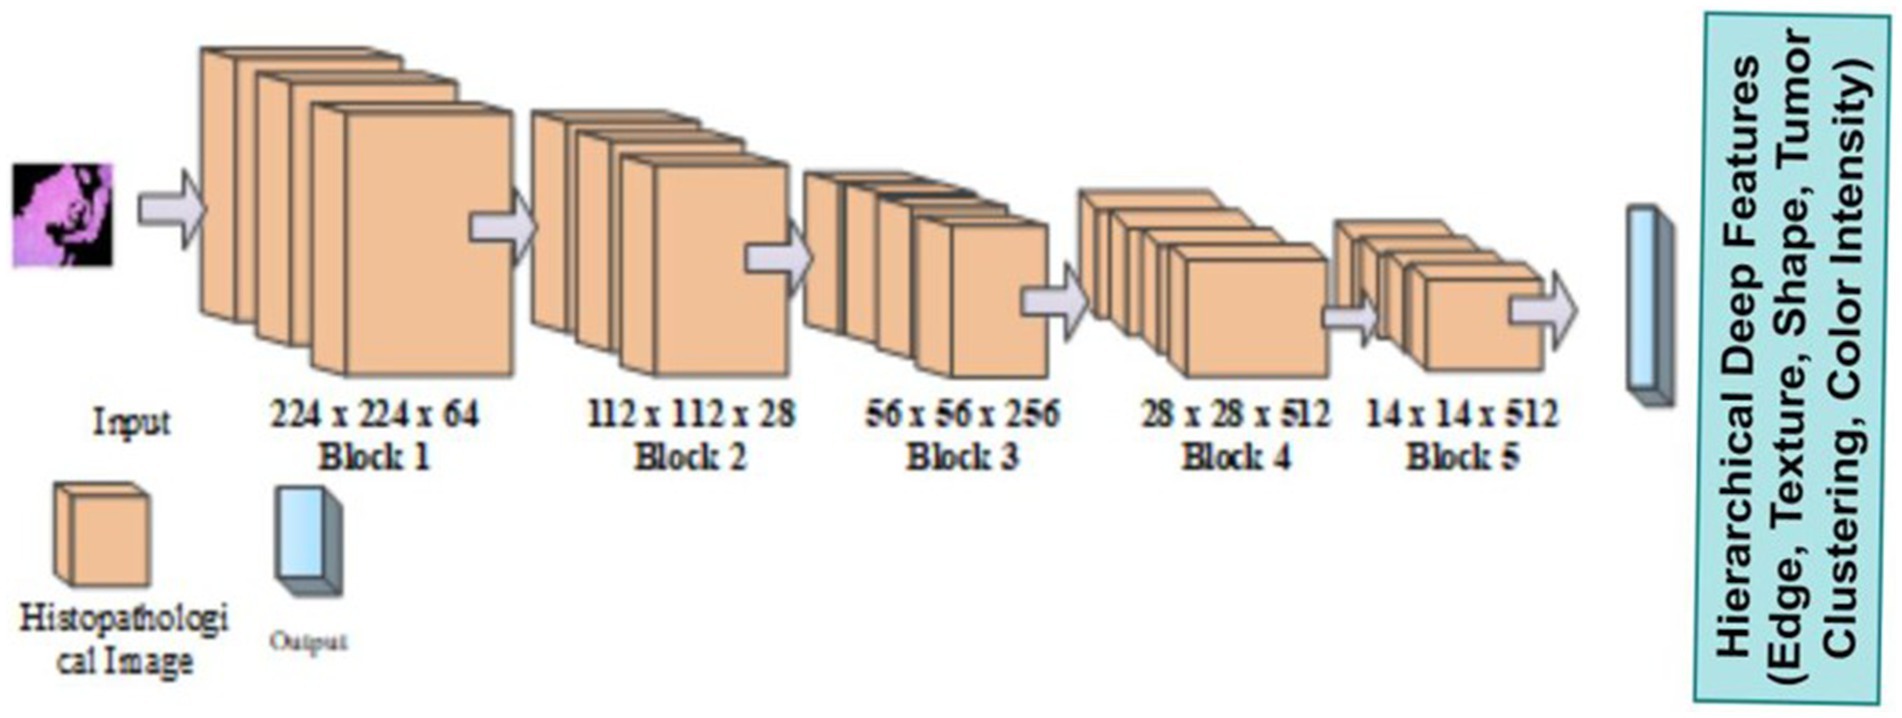
Figure 3. Architecture of VGG.
It is built with three fully connected layers. The first and second layers are ReLU, and the third is Soft max-activated. Images can be obtained with an input layer of 224 × 224 pixels and this format has 16 layers and 138 Millions of parameters. MobileNetV2’s Ochoa-Ornelas et al. (2025) efficient architecture improves the model’s capacity to capture feature inter-class differences, making it highly suitable for clinical image analysis that relies on common visual features. Figure 4 shows the architecture of Mobile Net.
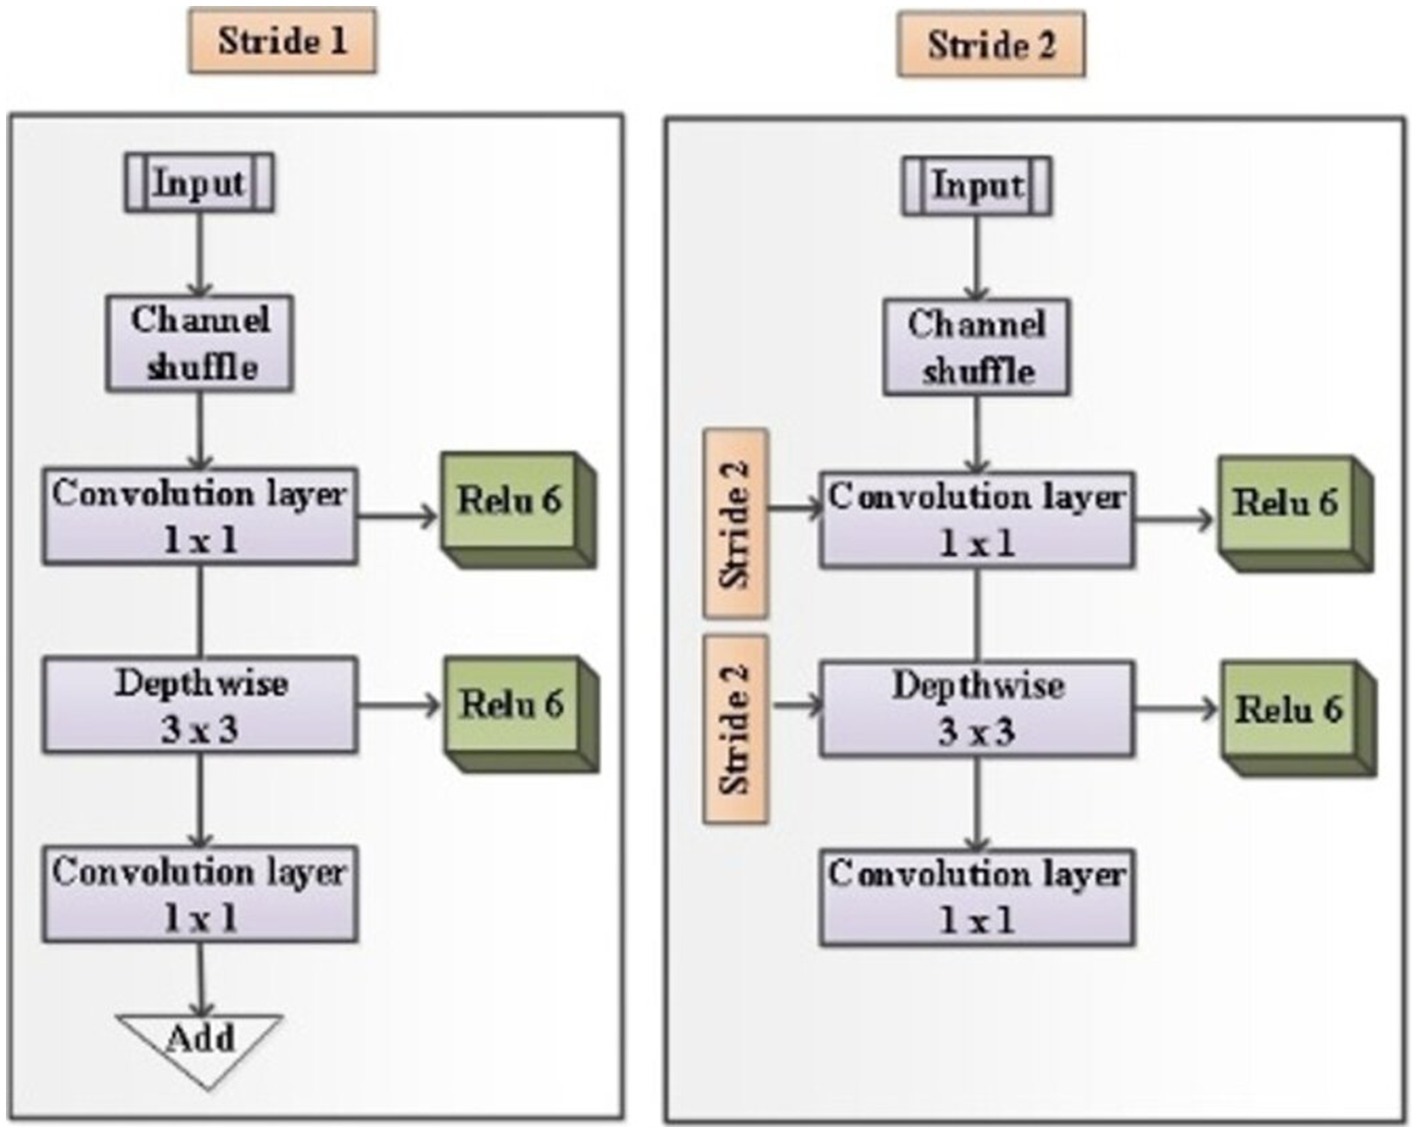
Figure 4. Architecture of Mobile Net.
That has included several other pivotal architectural innovations like Depthwise Separable Convolutions, Inverted Residuals and Linear Bottlenecks, and ReLU6 Activation Function. In Depthwise Separable Convolutions, the operation separates the common basic convolution into two layers like depthwise convolution and point-wise convolution, which convolve the input channels individually and sum these filtered output images to create new level features. It can be represented as the following Equations 13, 14.
Where represent the depthwise convolution kernel, and represent “the input and output feature map,” and represent the dimensions of the kernel. Then weight parameter and shows the final output after point-wise convolution. MobileNetV2 uses inverse residuals in I/P thin moderate layers and extended intermediate of layers. Linear bottlenecks prevent nonlinearities such as ReLU information loss. Which can be defined as the following Equation 15.
Where represent the projection matrix, represent the matrix of expansion. MobileNetV2 uses the ReLU6 activation function to reduce the size error and prevent information loss in low-PRE calculation, which is defined as the following Equation 16.
Where input tensor. Using the VGG-Mob model, the suggested method was able to successfully extract the feature.
2.5 Classification using deep optimized transformer encoder assisted dilated convolutional with global attention
Several methods have been developed for OSCC grade classes, but the existing methods have some limitations, such as overfitting, class imbalance problems, and overtime duration. To overcome those problems, introduce a Novel DeTr-DiGAtt. Figure 5 shows the architecture of the deep novel DeTr-DiGAtt.
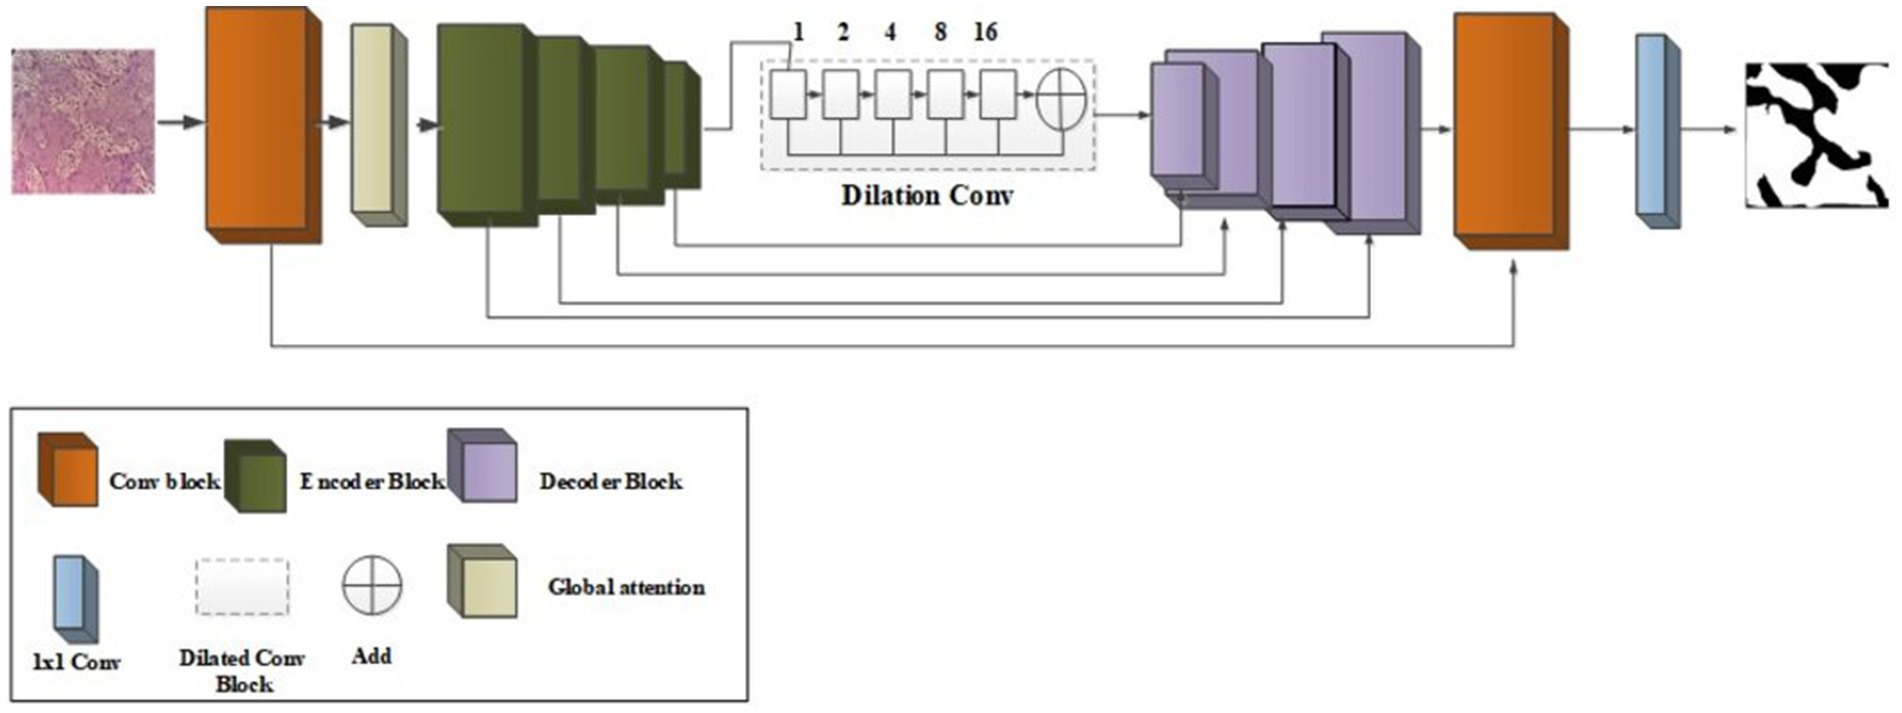
Figure 5. Architecture of DeTr-DiGAtt.
The input to the transformer encoder (Gao et al., 2022) consists of two modules namely multi-head self-focusing (MSA) and MLP modules, which is calculated according to the following Equations 17, 18.
Where and MLP, Two layers utilize the GELU activation function for non-linearity, while Layer Normalization (LN) is applied to each sample. It is computed using the following Equation 19:
Where represent the mean derivation of feature, represent the sample, represent the standard derivation of feature, represent the element-wise dot operation, and represent the learnable parameters of affine transformation. A dilated convolution layer is introduced to extract the high-level and fine low-level semantic information features. Dilated convolution layers have been shown to be a good alternative to segmentation tasks and pooling layers with significant improvement in ACC. In the expanded CNN, they use a pooling layer to control over-fitting and maintain in-variance, which is help reduces the spatial resolution information. It is Equation 20 given as following:
Where represent the filter with length and width, represent the output of dilated convolution represent the input of dilated convolution and represent the parameter of dilated rate. The traditional convolutional get kernel size receptive field. Then two dilated convolutions get and kernel size receptive field. It can shows expand the respective field without loss of feature resolution. Global attention is a mechanism that calculates the attention weight of all elements of the input sequence. It was used to global context and capture long-range dependencies to gather the complex structure of images. It can be defined as following Equations 21, 22:
Where , map the input feature to get the channel weight feature map , represent the intermediate map feature, represent the spatial weight feature map multiplied with and represent the output feature map. Then represent the multiplication between pixels. Then , and represent the height, width and number of channels of the feature map. Finally, the classifier model has been carefully tuned for hyperparameters; however, the current optimization techniques, like Grey Wolf Optimizer, Particle Swarm Optimization, and Satin Bowerbird Optimizer, have certain drawbacks, e.g., complex structures, decreased effectiveness, vulnerability to capture, and higher computational complexity. In order to overcome such concern, suggest a novel Ad-GreLop. Greylag Goose Optimization (GGO) approach (Elshewey et al., 2025) is a meta-heuristic optimization method that mimics the feeding pattern of Greylag geese and adjusts their locations to determine the optimal solution. Exploration stage in the GGO approach gives top priority to determining promising areas in the search space while avoiding stagnation both in location and inner goals by progressing towards an optimum solution. The GGO re-evaluates agent placements based on specific calculations and maximizes these locations as depicted below Equation 23.
Where and represent the updating vector, represents the agent’s position at , represent the leader’s position. Then and represents the three randomly chosen search agents, which is used to upgrade agent locations. It can be defined as the following Equations 24, 25.
Where and represents the upgraded in the range of [0, 2]. Then represents the number of maximum iterations, represents the iteration number. Progressing toward the best optimal solution is define as the following Equations 26–28.
Where , , , and represents the updates vector and , and represent the anticipated position of the prey based on three sentry solutions. GGO periodically rotates leadership among individuals in the population to prevent stagnation. It can be define as following Equation 29.
Where represents the goose position in the population at iteration, represent the leader position and represent the randomly chosen position from the population and represent the random factor in [0, 1]. Then chaotic function has been add to update the grey lag goose optimization algorithm represent the chaotic function in the range [0, 1]. It can be define as the following Equations 30, 31:
Where represent the chaotic index sequence and represent the number of element. In fitness function, the model’s ability to identify entire negative or positive case instances, which is calculated as the following Equation 32.
Where represent the true positive, represents the true negative, represent the false positive and represent the false negative. Algorithm 1 represents the Pseudocode for Ad-GreLop.
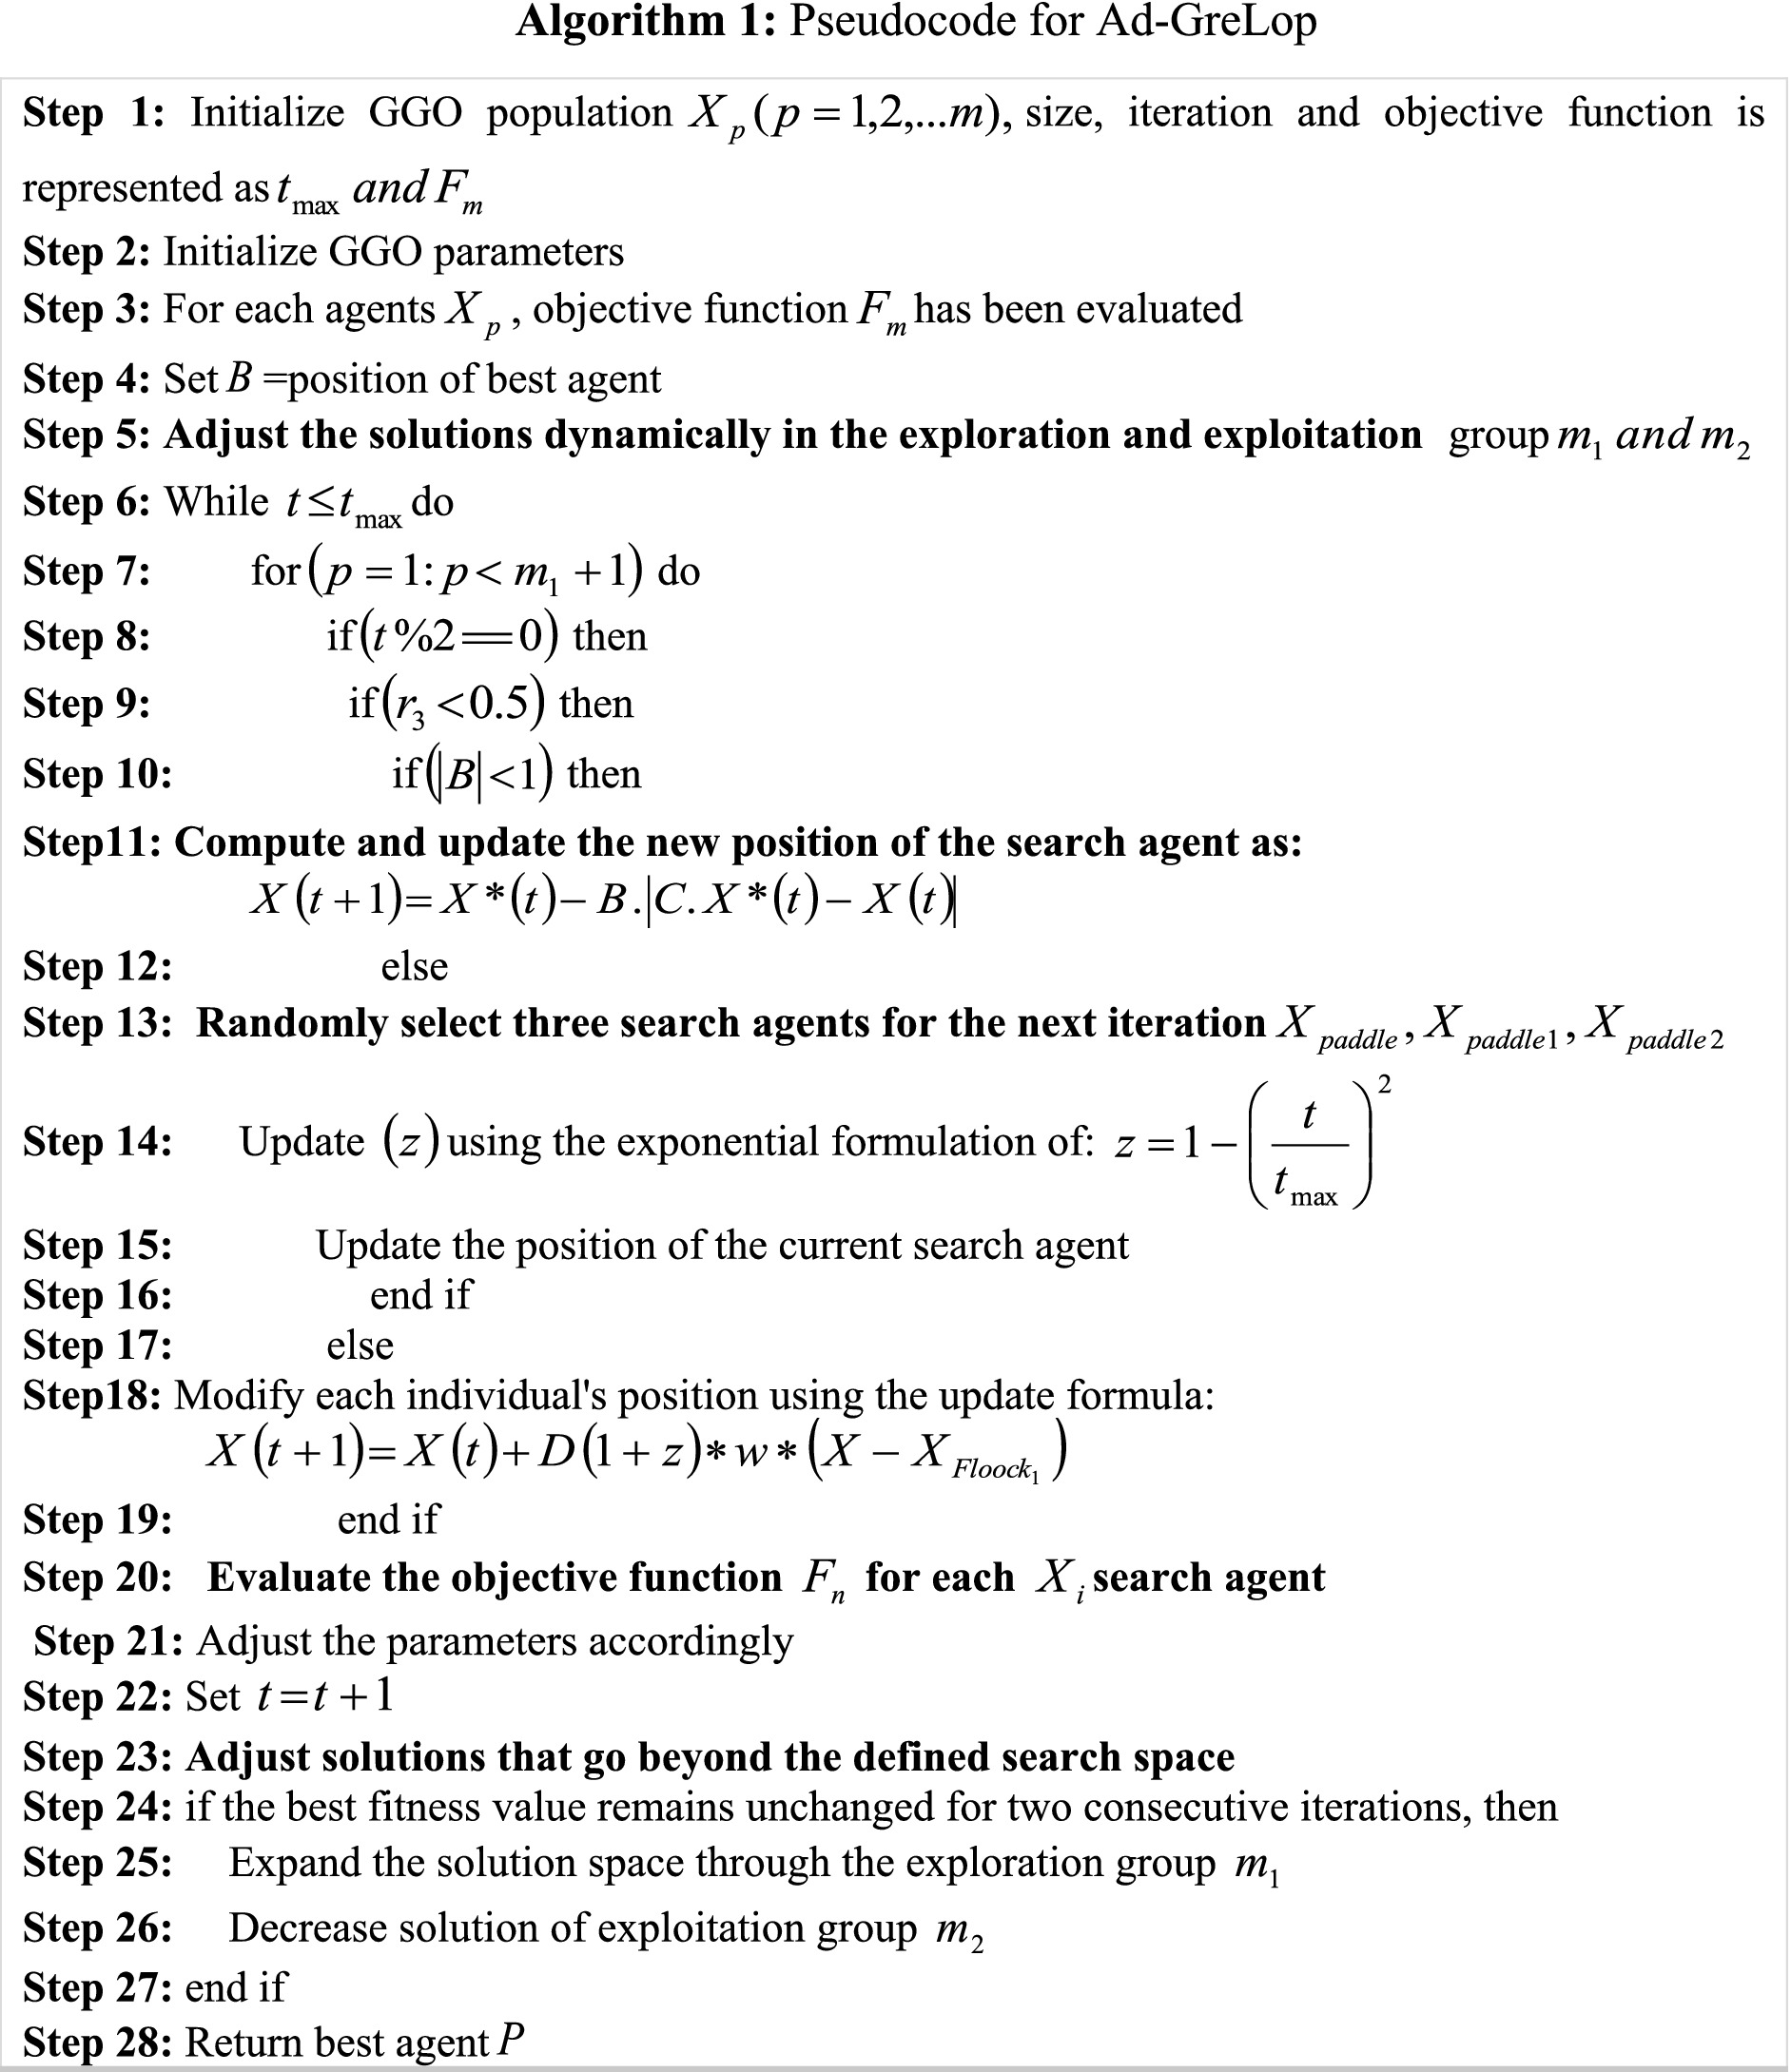
ALGORITHM 1. Pseudocode for Ad-GreLop.
The suggested technique has been successfully categorised with DeTr-DiGAtt and the Adaptive Grey Lag Goose Optimization Algorithm.
3 Result and discussion
The proposed methodology is compared with other existing methodologies are “ResNet, Inception Net, Xception Net, AlexNet, U-Net, V-Net, SegNet along with VGG16 and ResNet. The proposed method has been evaluated using its dataset. Afterwards, some performance evaluation measures like ACC, PRE, recall, F1 score, specificity, and dice score were utilized for OSCC classification (Table 1).
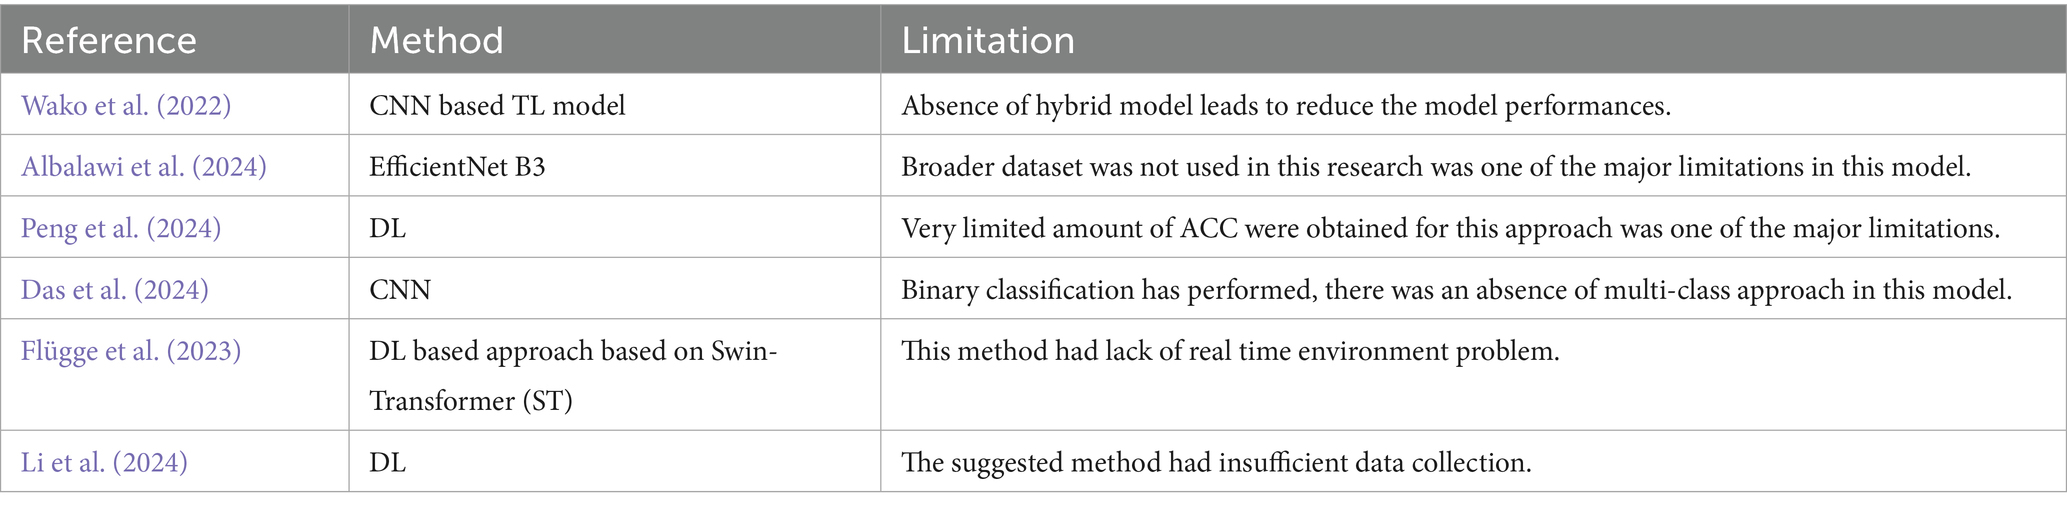
Table 1. Existing methods analysis.
3.1 Dataset description
The dataset was collected from vishnu dental college Bhimavaram, AP, contains 34 moderately differentiated samples, 11 poorly differentiated samples, and 35 well-differentiated sample images. Before augmentation, the dataset included 34 moderate, 11 poor, and 34 well-differentiated sample images. After augmentation, the dataset was expanded to 204 moderate, 66 poor, and 204 well-differentiated sample images. In Table 2 shows all grading images of segmented and processed. The efficacy of hyperparameter optimization for the suggested methodology encompasses the following primary parameters: a dropout rate of 0.5, ReLU activation function, global average pooling enabled, a learning rate of 0.001, a patch size of 32, and 300 training epochs. All these settings were optimized to enhance the ACC and efficiency of the OSCC classification model. Ethical clearance number for Real Time Dataset 8,758/IEC/2023.
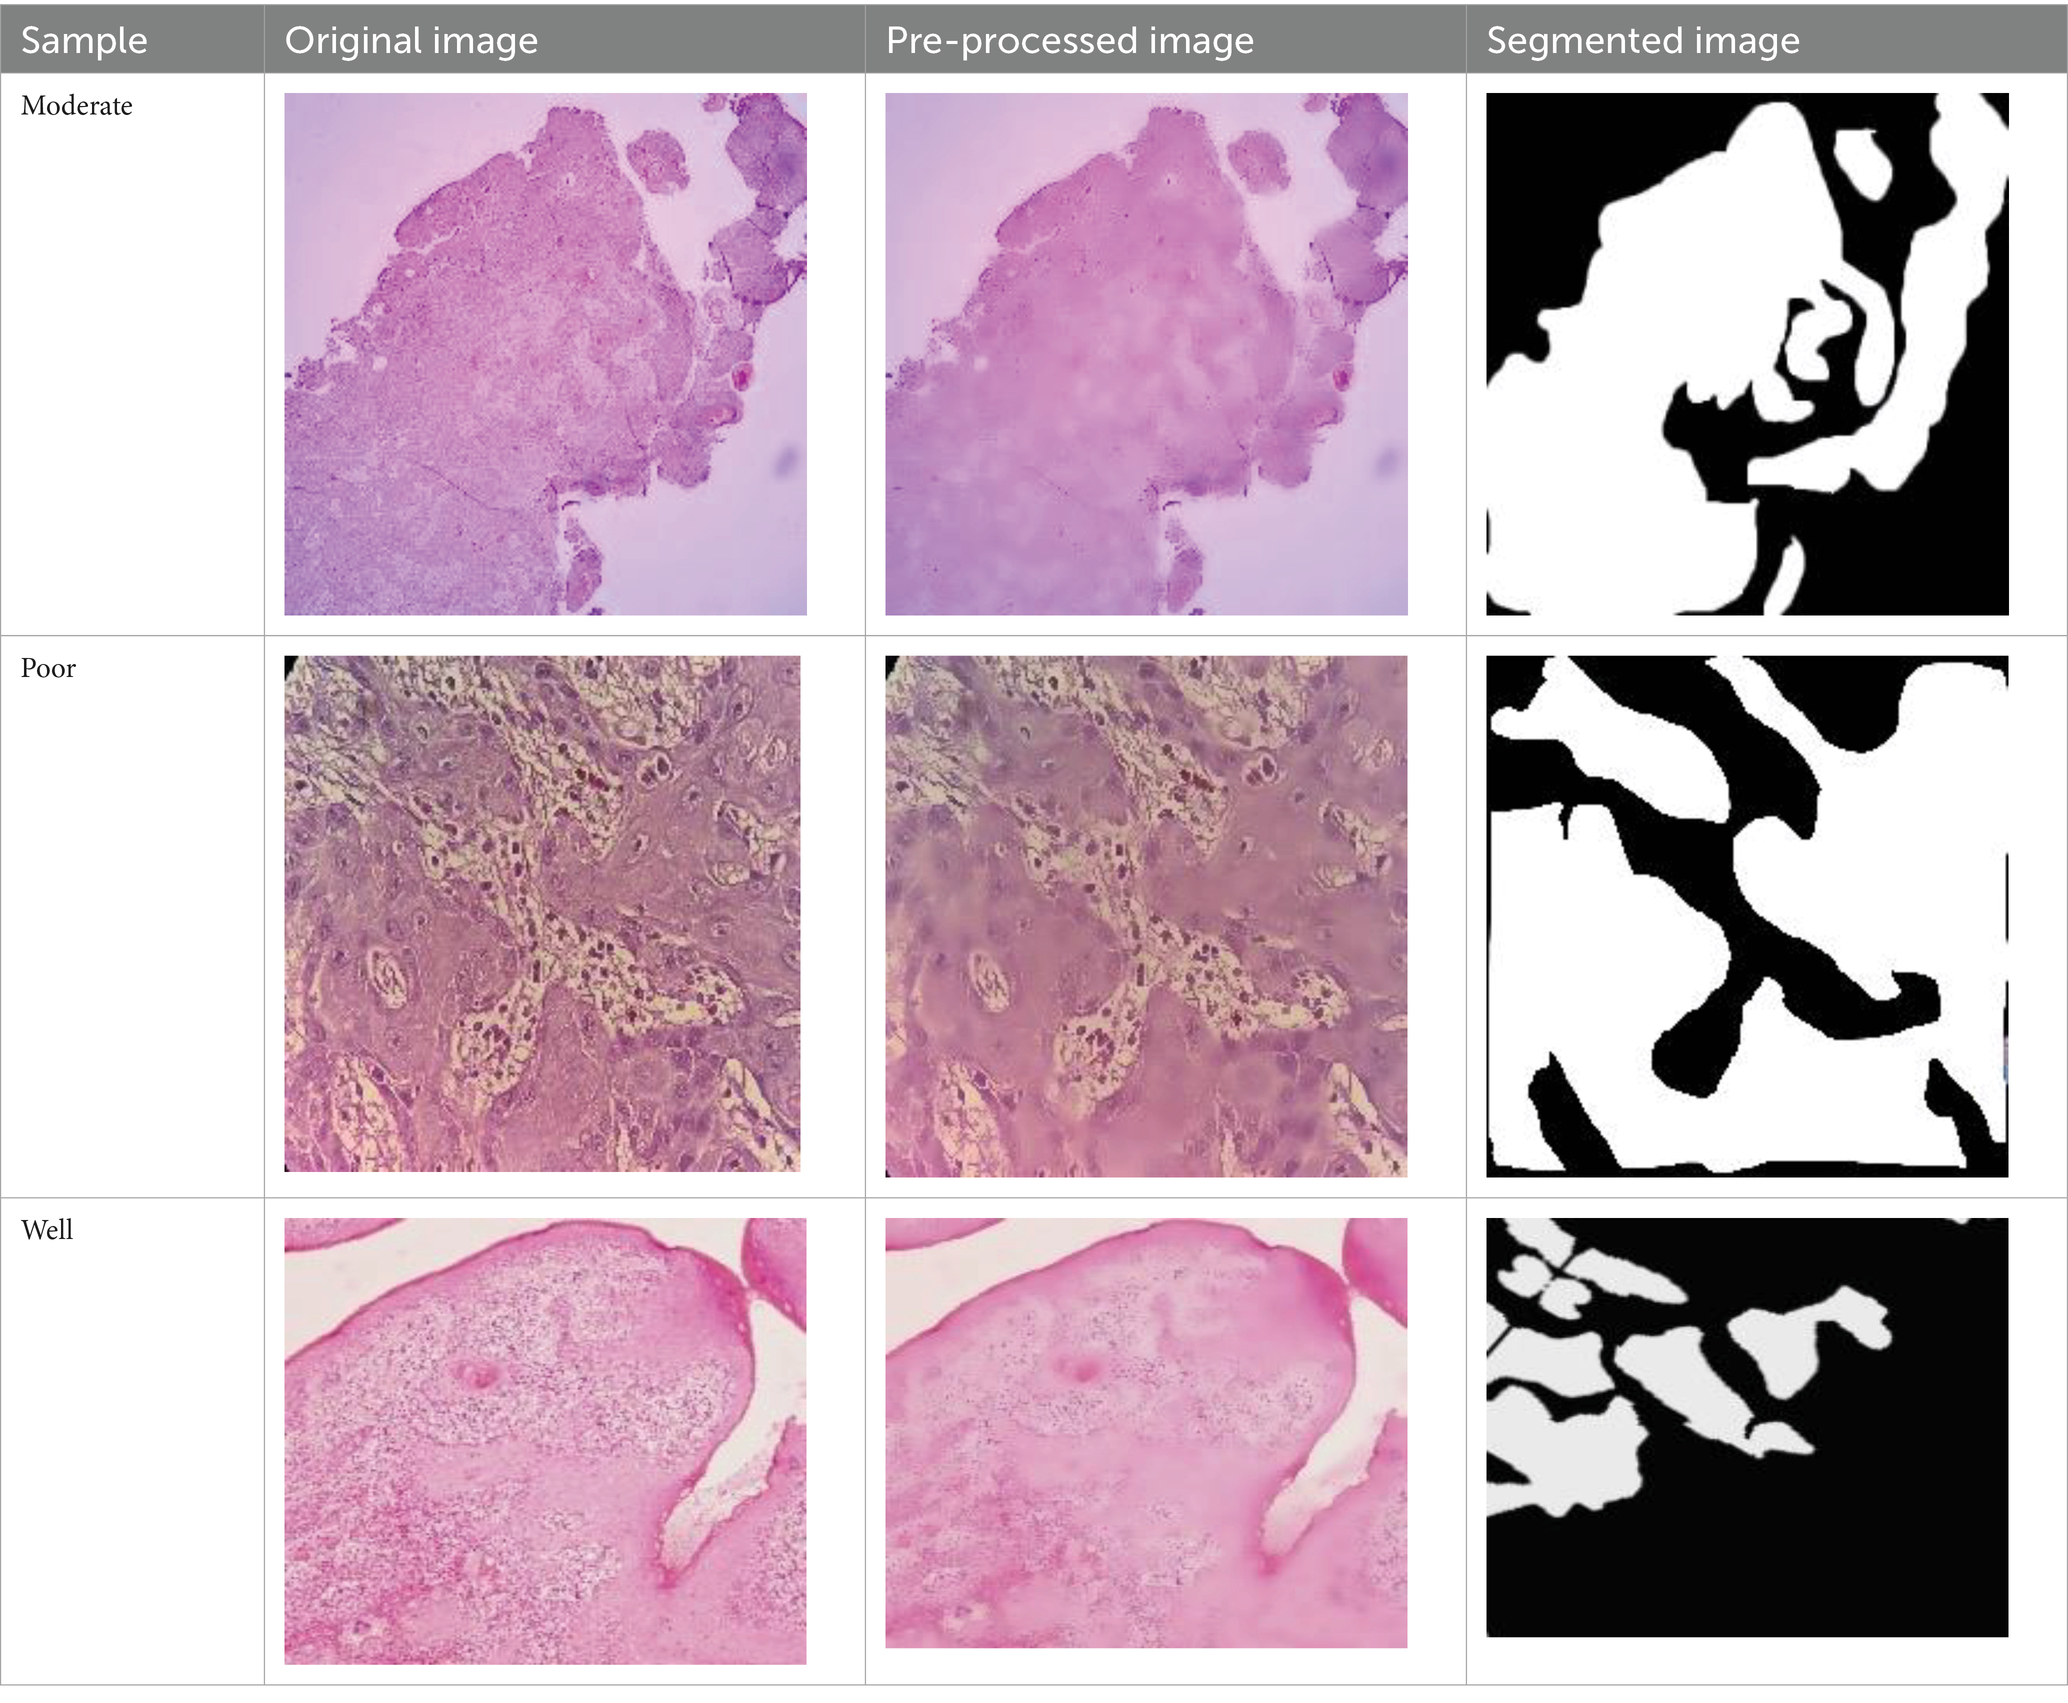
Table 2. Sample of input, pre-processed and segmented images.
3.1.1 Performance analysis of segmentation
Figure 6 illustrates the comparative performance of the proposed hybrid segmentation approach with existing methods. In Figure 6A, the proposed method achieves an IoU of 98.08%, outperforming U-Net + ResNet (92.20%) and VGG16 + U-Net (90.72%). This demonstrates the stronger generalization capability of the proposed model compared to prior approaches, which often struggled with segmentation quality. Similarly, Figure 6B compares Dice coefficients, where the proposed method attains a Dice score of 97.97%, significantly higher than U-Net (87.24%) and SegNet (84.41%). These results highlight the ability of the proposed model to overcome limitations of earlier methods, such as low-quality segmentation and reduced accuracy.
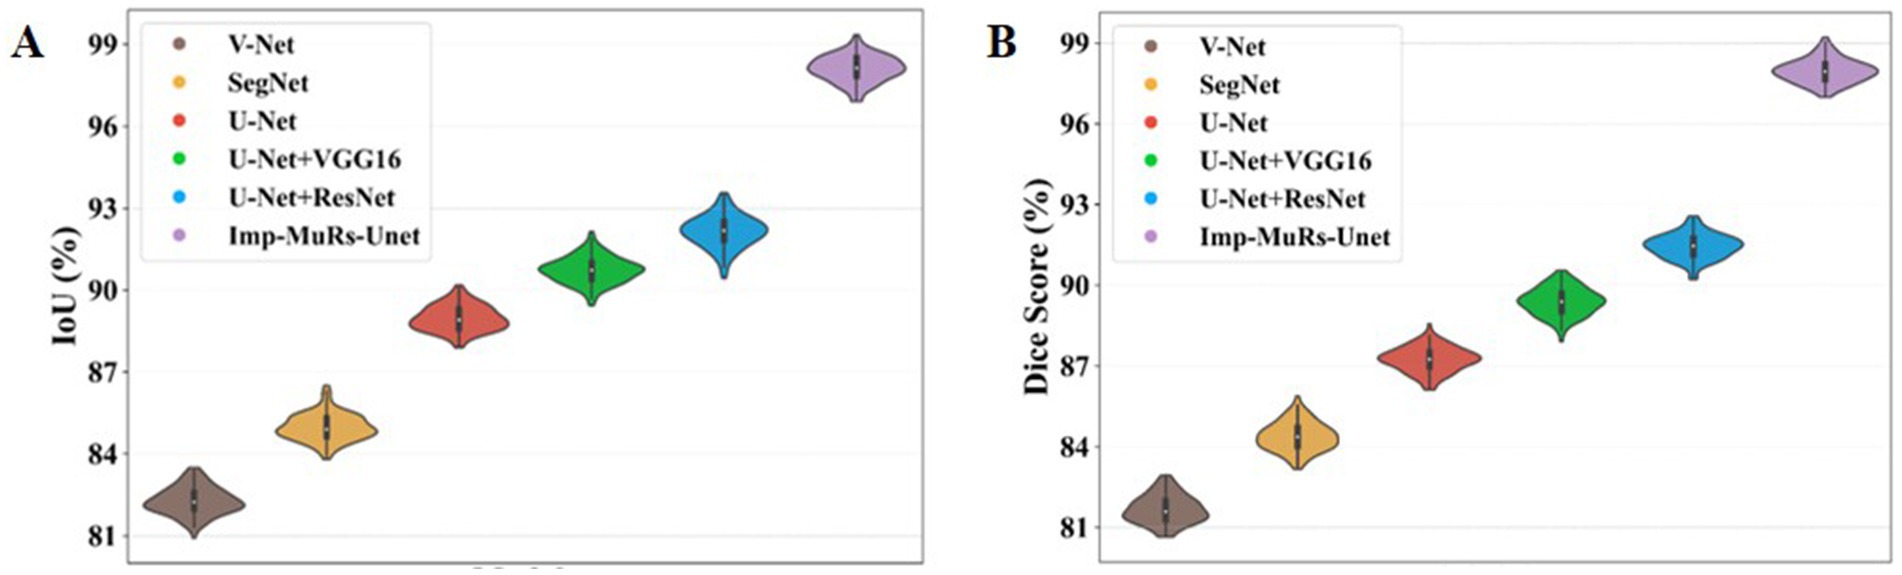
Figure 6. (A,B) Performance analysis of IoU and dice score.
Figure 7 presents the mean Intersection-over-Union (mIoU) analysis. The proposed approach achieves an mIoU exceeding 97.01%, while V-Net and U-Net record comparatively lower values of 81.69% and 88.39%, respectively. This indicates that existing segmentation models often face challenges such as increased complexity, limited applicability, and dependency on large annotated datasets. In contrast, the proposed method consistently delivers superior segmentation performance across different evaluation metrics. A consolidated comparison of these results is further provided in Table 3, emphasizing the robustness of the proposed approach.
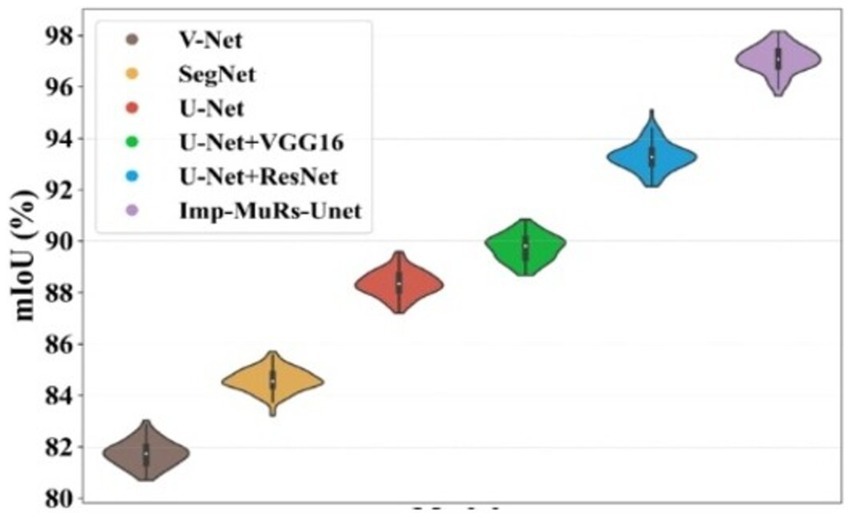
Figure 7. Performance analysis of mIoU.
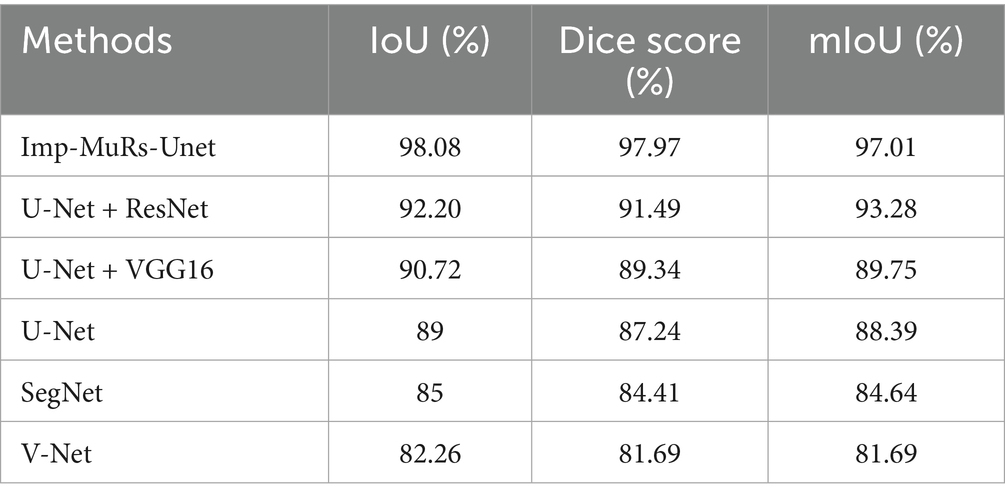
Table 3. Segmentation analysis for proposed method.
3.1.2 Performance analysis for classification
This section provides a comparison of the suggested methodology with several contemporary techniques. Figure 8 illustrates the performance of ACC and PRE.
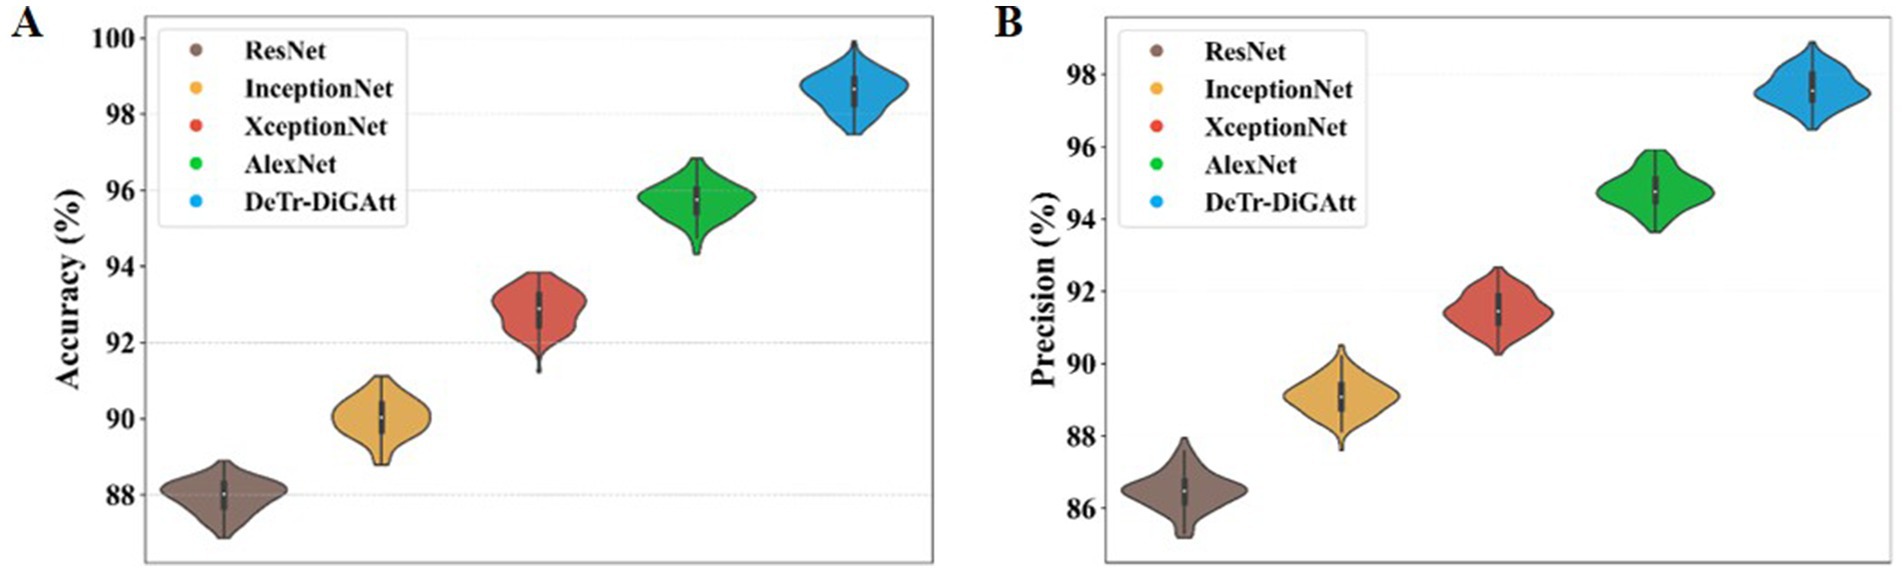
Figure 8. (A,B) Performance analysis of ACC and precision.
Figure 8 presents the classification performance of the proposed method compared to existing models. In Figure 8A, the proposed strategy achieves an accuracy (ACC) of 98.59%, outperforming AlexNet (95.74%) and XceptionNet (92.91%). This confirms the superior classification ability of the proposed method, while earlier techniques such as AlexNet also exhibited longer computational times. Figure 8B illustrates the precision (PRE) values, where the proposed approach attains 97.53%, significantly higher than XceptionNet (91.35%) and InceptionNet (89.13%). The lower accuracy and precision of InceptionNet highlight its increased complexity and reduced effectiveness in OSCC classification.
Figure 9 evaluates additional performance metrics of Recall and F1-score. As shown in Figure 9A, the proposed method achieves a recall value of 98.45%, whereas AlexNet and InceptionNet obtain only 89.76% and 95.35%, respectively. This improvement demonstrates the ability of the proposed approach to handle class imbalance issues that hindered prior models. Figure 9B shows F1-score comparisons, where the proposed method records 97.99%, clearly surpassing InceptionNet (89.44%) and ResNet (86.98%). The higher F1-score indicates the robustness of the proposed model in minimizing both false positives and false negatives, thereby improving the detection of OSCC cases.
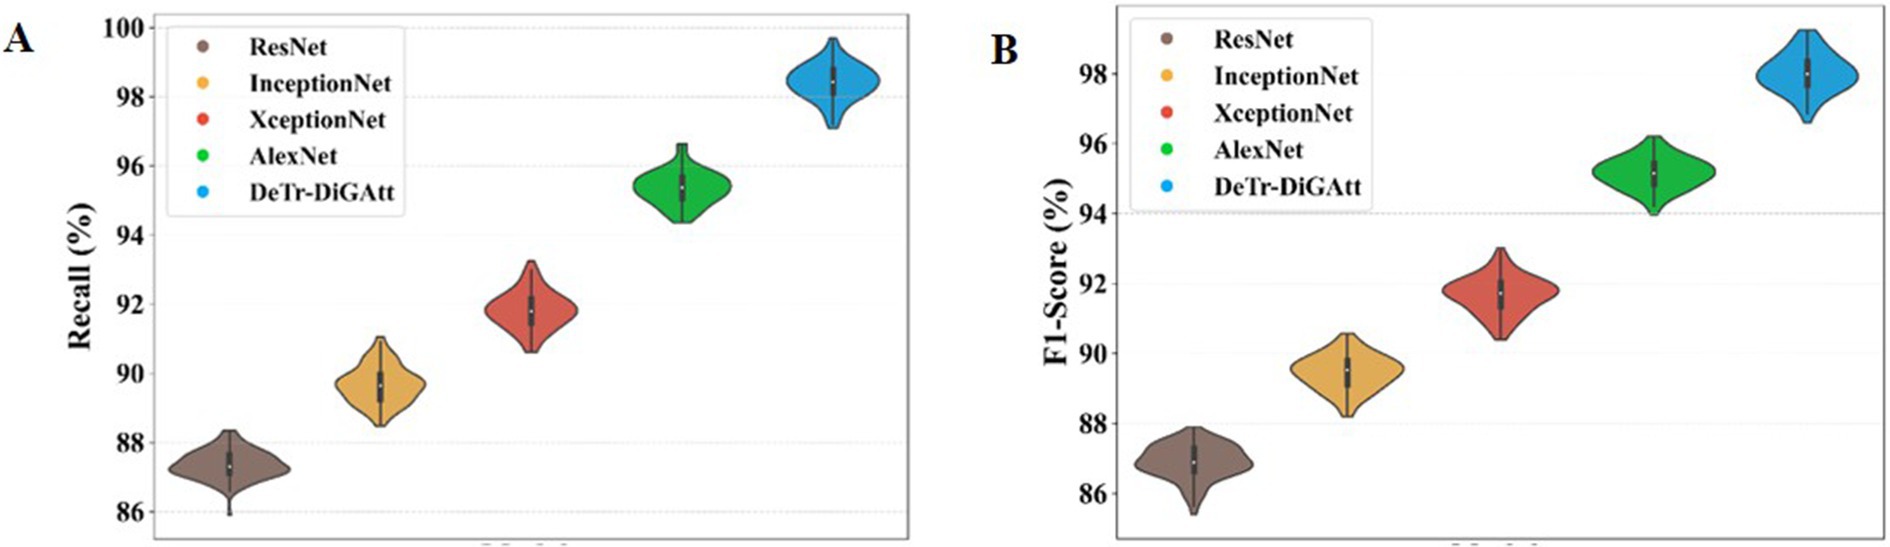
Figure 9. (A,B) Performance of recall and F1- score for proposed method.
Figure 10 highlights the specificity analysis. The proposed method achieves a specificity of 98.96%, which is higher than AlexNet (95.41%) and XceptionNet (92.07%). This demonstrates the enhanced ability of the proposed approach to correctly identify negative cases, reducing misclassification rates and providing more reliable predictions. Prior models often suffered from class imbalance, reducing their specificity and overall classification stability. Figure 11 presents the training and testing performance across epochs. In Figure 11A, the proposed model achieves near-perfect accuracy for both training and testing after approximately 300 epochs, reflecting its strong generalization ability. Figure 11B shows that both training and testing loss values remain below 1 within the same epoch range, confirming the stability and efficiency of the learning process.
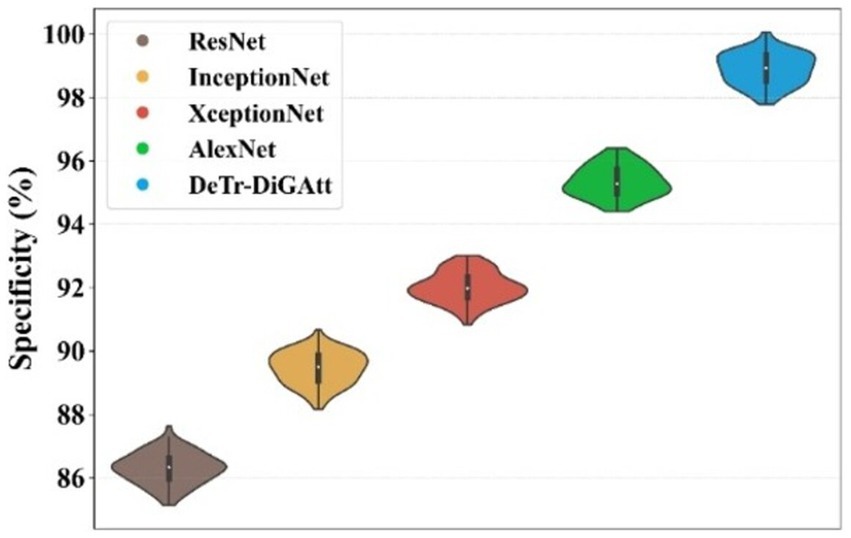
Figure 10. Performance analysis of specificity.
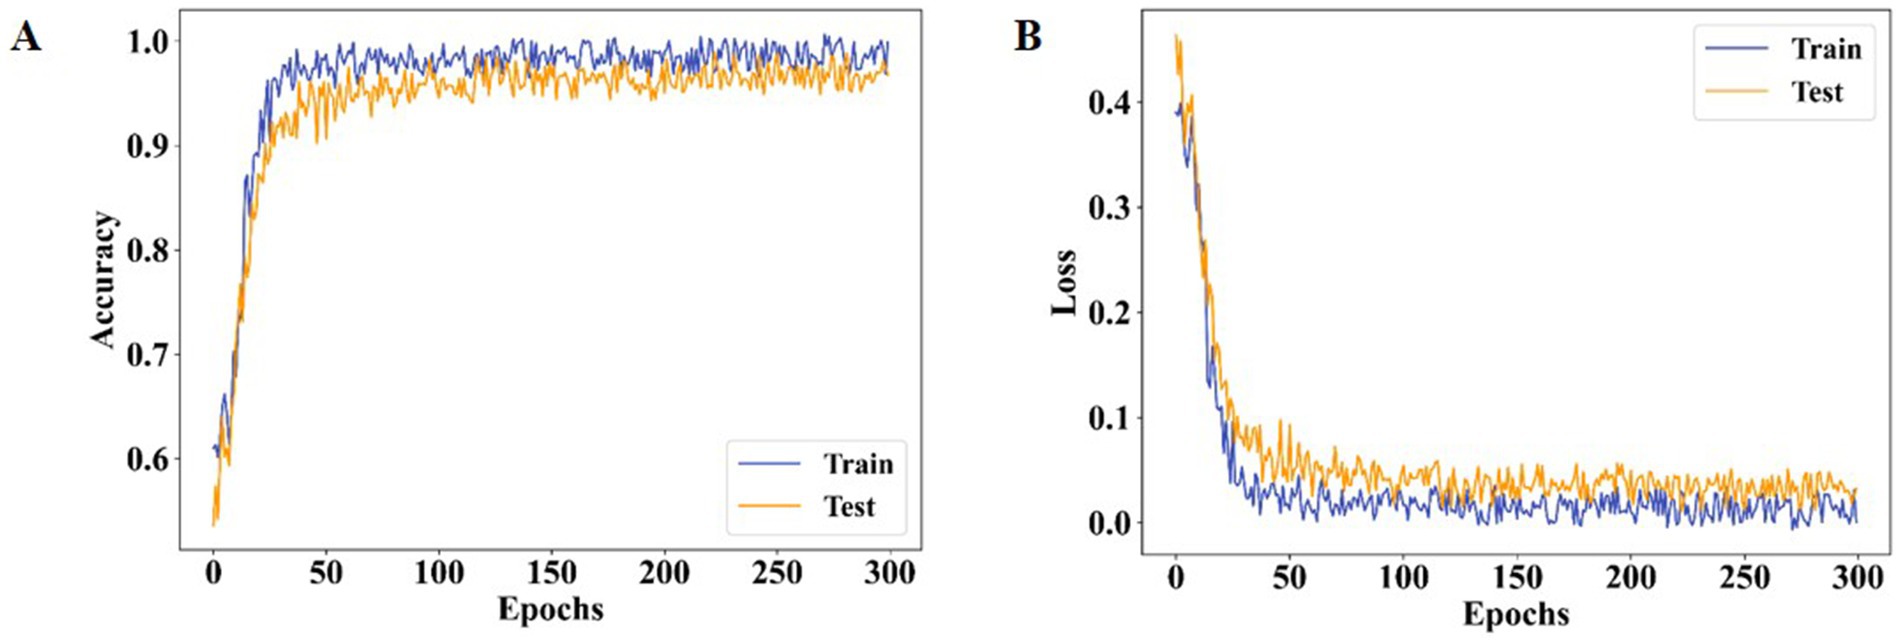
Figure 11. Performance analysis of both training and testing (A) ACC and (B) loss for proposed method.
Figure 12 provides the confusion matrix for the three-class classification task. The distribution clearly indicates that the proposed method minimizes misclassifications across all OSCC grades, supporting its robustness and practical applicability for accurate disease classification.
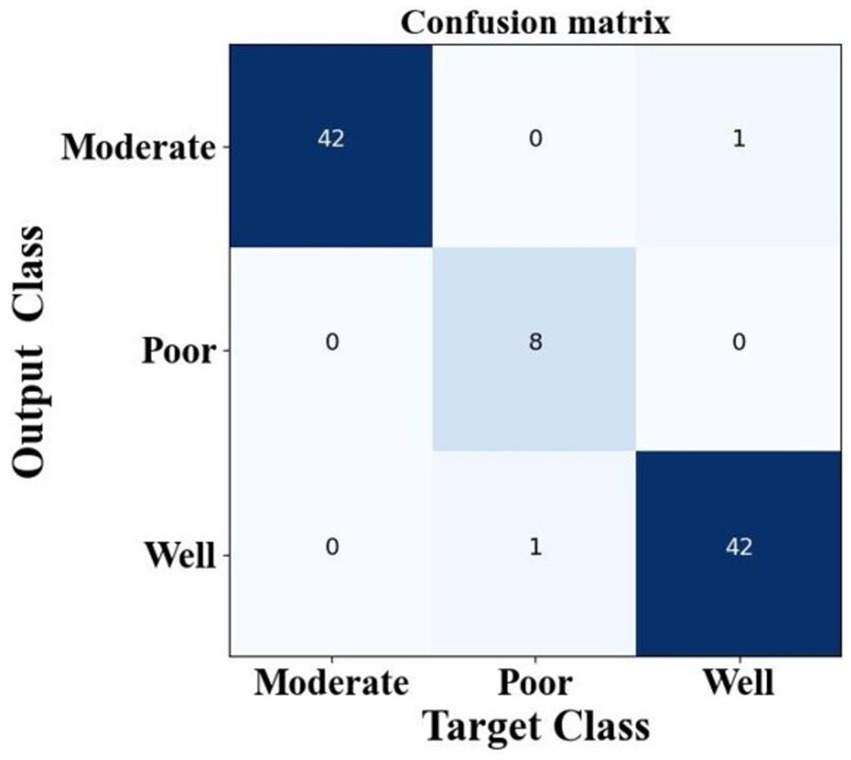
Figure 12. Performance analysis of confusion matrix of proposed method.
To ensure that the observed performance improvements are not due to chance, the proposed model was evaluated using 5-fold cross-validation. Additionally, a paired t-test was conducted between the proposed model and baseline methods. The improvements in IoU, ACC, F1-score, and specificity were found to be statistically significant (p < 0.05). This confirms that the high scores achieved by the proposed method represent true performance gains rather than random variations or dataset bias.
To identified the target classes such as well, moderate, and poor, which help to improve the OSCC Grading Classification. The method has been obtaining total target class samples of moderate at 42 samples, poor at eight samples, and well at 42 samples. The proposed method obtains a moderate target class of 41 samples, a poor target class obtains eight samples and well obtains 41 samples. The suggested design has been acquiring superior target classification samples, hence enhancing the performance of the present model. The suggested classification performance indicators provide superior results relative to other techniques. Table 4 presents the categorization performance results of the study.
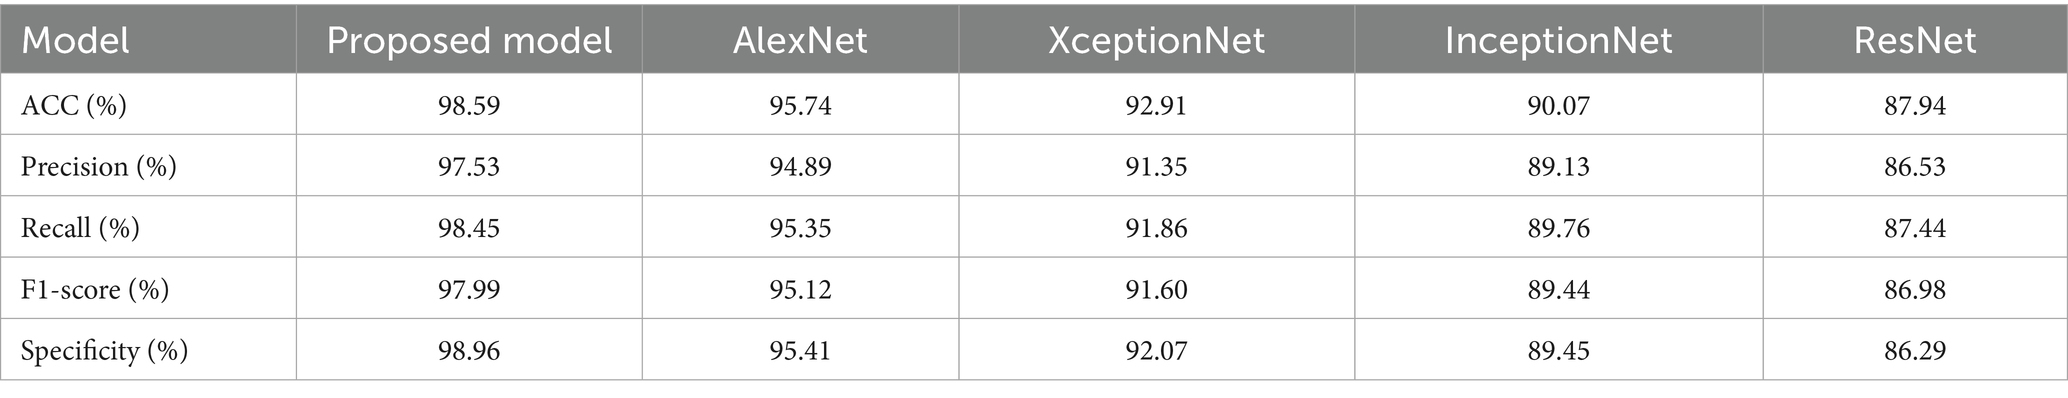
Table 4. Performance classification of proposed method.
Here a comprehensive discussion was provided on OSCC Grading Classification. The proposed compared with multiple methods for analyzing the better classification. Traditional methods have some limitations, such as handling large volumes of image data, lack of availability and generality during segmentation, poor contrast, and so on. To overcome that limitation, introduce a novel DeTr-DiGAtt for OSCC classification. The proposed method used the GAN model to control the overfitting problems. The imp-MuRs-Unet method was used to identify affected regions accurately for segmentation.
4 Conclusion
This study presents a unique DeTr-DiGAtt model for the categorisation of OSCC. The proposal involves collecting the input picture using its dataset. The GAN model was used for the data augmentation mechanism. The ad-BF method was used in the Pre-processing stage. After reprocessing, Imp-MuRs-Unet was used for segmentation. Then VGG-Mob model was used for feature extraction. The deTr-DiGAtt method was used for classification. Ad-GreLop was used to optimize for fine tune parameters in the classifier model. This available method has ACC, PRE, recall, dice score, and IoM of 98.59%, 97.53%, 98.45%, 97.97%, and 98.08%. In future work, explainable techniques will be added to improve the ACC of OSCC classification more effectively.
Data availability statement
The original contributions presented in the study are included in the article/supplementary material, further inquiries can be directed to the corresponding author.
Ethics statement
Ethical approval was not required for the studies on humans in accordance with the local legislation and institutional requirements because only commercially available established cell lines were used.
Author contributions
SR: Conceptualization, Validation, Writing – original draft. RM: Supervision, Writing – review & editing.
Funding
The author(s) declare that no financial support was received for the research and/or publication of this article.
Acknowledgments
We appreciate the hard work of all the pathologists who participated in our study.
Conflict of interest
The authors declare that the research was conducted in the absence of any commercial or financial relationships that could be construed as a potential conflict of interest.
Generative AI statement
The authors declare that no Gen AI was used in the creation of this manuscript.
Any alternative text (alt text) provided alongside figures in this article has been generated by Frontiers with the support of artificial intelligence and reasonable efforts have been made to ensure accuracy, including review by the authors wherever possible. If you identify any issues, please contact us.
Publisher’s note
All claims expressed in this article are solely those of the authors and do not necessarily represent those of their affiliated organizations, or those of the publisher, the editors and the reviewers. Any product that may be evaluated in this article, or claim that may be made by its manufacturer, is not guaranteed or endorsed by the publisher.
References
Abuhayi, B. M., Bezabh, Y. A., and Ayalew, A. M. (2024). Lumbar disease classification using an Involutional neural based VGG nets (INVGG). IEEE Access 12, 27518–27529. doi: 10.1109/ACCESS.2024.3367774
Ahmad, M., Irfan, M. A., Sadique, U., Haq, I. U., Jan, A., Khattak, M. I., et al. (2023). Multi-method analysis of histopathological image for early diagnosis of oral squamous cell carcinoma using deep learning and hybrid techniques. Cancer 15:5247. doi: 10.3390/cancers15215247
Alanazi, A. A., Khayyat, M. M., Khayyat, M. M., Elamin Elnaim, B. M., and Abdel-Khalek, S. (2022). Intelligent deep learning enabled oral squamous cell carcinoma detection and classification using biomedical images. Comput. Intell. Neurosci. 2022, 1–11. doi: 10.1155/2022/7643967
Albalawi, E., Thakur, A., Ramakrishna, M. T., Bhatia Khan, S., SankaraNarayanan, S., Almarri, B., et al. (2024). Oral squamous cell carcinoma detection using EfficientNet on histopathological images. Front. Med. 10:1349336. doi: 10.3389/fmed.2023.1349336
Ananthakrishnan, B., Shaik, A., Kumar, S., Narendran, S. O., Mattu, K., and Kavitha, M. S. (2023). Automated detection and classification of oral squamous cell carcinoma using deep neural networks. Diagnostics 13:918. doi: 10.3390/diagnostics13050918
Bedi, P., Goyal, S. B., Rajawat, A. S., and Kumar, M. (2024). An integrated adaptive bilateral filter-based framework and attention residual U-net for detecting polycystic ovary syndrome. Decis. Anal. J. 10:100366. doi: 10.1016/j.dajour.2023.100366
Chu, C. S., Lee, N. P., Ho, J. W., Choi, S. W., and Thomson, P. J. (2021). Deep learning for clinical image analyses in oral squamous cell carcinoma: a review. JAMA Otolaryngol. Head Neck Surg. 147, 893–900. doi: 10.1001/jamaoto.2021.2028
Das, M., Dash, R., and Mishra, S. K. (2023). Automatic detection of oral squamous cell carcinoma from histopathological images of oral mucosa using deep convolutional neural network. Int. J. Environ. Res. Public Health 20:2131. doi: 10.3390/ijerph20032131
Das, M., Dash, R., Mishra, S. K., and Dalai, A. K. (2024). An ensemble deep learning model for oral squamous cell carcinoma detection using histopathological image analysis. IEEE Access 12, 127185–127197. doi: 10.1109/ACCESS.2024.3450444
Deif, M. A., Attar, H., Amer, A., Elhaty, I. A., Khosravi, M. R., and Solyman, A. A. (2022). Diagnosis of oral squamous cell carcinoma using deep neural networks and binary particle swarm optimization on histopathological images: an AIoMT approach. Comput. Intell. Neurosci. 2022:6364102. doi: 10.1155/2022/6364102
Dhanya, K., Prasad, D. V. V., and Lokeswari, Y. V. (2024). Detection of oral squamous cell carcinoma using pre-trained deep learning models. Exp. Oncol. 46, 119–128. doi: 10.15407/exp-oncology.2024.02.119
Elshewey, A. M., Abed, A. H., Khafaga, D. S., Alhussan, A. A., Eid, M. M., and El-Kenawy, E. S. M. (2025). Enhancing heart disease classification based on Greylag goose optimization algorithm and long short-term memory. Sci. Rep. 15:1277. doi: 10.1038/s41598-024-83592-0
Fatapour, Y., Abiri, A., Kuan, E. C., and Brody, J. P. (2023). Development of a machine learning model to predict recurrence of oral tongue squamous cell carcinoma. Cancer 15:2769. doi: 10.3390/cancers15102769
Flügge, T., Gaudin, R., Sabatakakis, A., Tröltzsch, D., Heiland, M., van Nistelrooij, N., et al. (2023). Detection of oral squamous cell carcinoma in clinical photographs using a vision transformer. Sci. Rep. 13:2296. doi: 10.1038/s41598-023-29204-9
Gao, J., Gong, M., and Li, X. (2022). Congested crowd instance localization with dilated convolutional swin transformer. Neurocomputing 513, 94–103. doi: 10.1016/j.neucom.2022.09.113
Ghaznavi, A., Rychtáriková, R., Císař, P., Ziaei, M. M., and Štys, D. (2024). Symmetry breaking in the U-net: hybrid deep-learning multi-class segmentation of HeLa cells in reflected light microscopy images. Symmetry 16:227. doi: 10.3390/sym16020227
Haq, I. U., Ahmed, M., Assam, M., Ghadi, Y. Y., and Algarni, A. (2023). Unveiling the future of oral squamous cell carcinoma diagnosis: an innovative hybrid AI approach for accurate histopathological image analysis. IEEE Access 11, 118281–118290. doi: 10.1109/ACCESS.2023.3326152
Islam, S., Mahmud, M. Z., Alve, S. R., and Chowdhury, M. M. U. (2024). Deep learning approach for enhancing oral squamous cell carcinoma with LIME explainable AI technique. arXiv. doi: 10.48550/arXiv.2411.14184
Kumar, K. V., Palakurthy, S., Balijadaddanala, S. H., Pappula, S. R., and Lavudya, A. K. (2024). Early detection and diagnosis of oral cancer using deep neural network. J. Comput. Allied Intell. 2, 22–34.
Li, W., Li, Y., Gao, S., Huang, N., Kojima, I., Kusama, T., et al. (2024). Integrating lipid metabolite analysis with MRI-based transformer and radiomics for early and late stage prediction of oral squamous cell carcinoma. BMC Cancer 24:795. doi: 10.1186/s12885-024-12533-x
Lin, Y. C., and Chen, B. S. (2022). Identifying drug targets of oral squamous cell carcinoma through a systems biology method and genome-wide microarray data for drug discovery by deep learning and drug design specifications. Int. J. Mol. Sci. 23:10409. doi: 10.3390/ijms231810409
Meer, M., Khan, M. A., Jabeen, K., Alzahrani, A. I., Alalwan, N., Shabaz, M., et al. (2025). Deep convolutional neural networks information fusion and improved whale optimization algorithm based smart oral squamous cell carcinoma classification framework using histopathological images. Expert. Syst. 42:e13536. doi: 10.1111/exsy.13536
Mohan, R., Rama, A., Raja, R. K., Shaik, M. R., Khan, M., Shaik, B., et al. (2023). OralNet: fused optimal deep features framework for oral squamous cell carcinoma detection. Biomolecules 13:1090. doi: 10.3390/biom13071090
Ochoa-Ornelas, R., Gudiño-Ochoa, A., García-Rodríguez, J. A., and Uribe-Toscano, S. (2025). Enhancing early lung cancer detection with MobileNet: a comprehensive transfer learning approach. Franklin Open 10:100222. doi: 10.1016/j.fraope.2025.100222
Panigrahi, S., Nanda, B. S., Bhuyan, R., Kumar, K., Ghosh, S., and Swarnkar, T. (2023). Classifying histopathological images of oral squamous cell carcinoma using deep transfer learning. Heliyon 9:e13444. doi: 10.1016/j.heliyon.2023.e13444
Peng, J., Xu, Z., Dan, H., Li, J., Wang, J., Luo, X., et al. (2024). Oral epithelial dysplasia detection and grading in oral leukoplakia using deep learning. BMC Oral Health 24:434. doi: 10.1186/s12903-024-04191-z
Rahman, A. U., Alqahtani, A., Aldhafferi, N., Nasir, M. U., Khan, M. F., Khan, M. A., et al. (2022). Histopathologic oral cancer prediction using oral squamous cell carcinoma biopsy empowered with transfer learning. Sensors 22:3833. doi: 10.3390/s22103833
Suiçmez, Ç. (2025). Defect segmentation of magnetic tiles with the novel Ardise-U-net. Trans. Electromagn. Spect. 4, 7–21. doi: 10.5281/zenodo.14634587
Sukegawa, S., Ono, S., Tanaka, F., Inoue, Y., Hara, T., Yoshii, K., et al. (2023). Effectiveness of deep learning classifiers in histopathological diagnosis of oral squamous cell carcinoma by pathologists. Sci. Rep. 13:11676. doi: 10.1038/s41598-023-38343
Wako, B. D., Dese, K., Ulfata, R. E., Nigatu, T. A., Turunbedu, S. K., and Kwa, T. (2022). Squamous cell carcinoma of skin cancer margin classification from digital histopathology images using deep learning. Cancer Control 29:10732748221132528. doi: 10.1177/10732748221132528
Wang, J., Wang, S., and Liang, W. (2022). Metrans: multi-encoder transformer for ischemic stroke segmentation. Electron. Lett. 58, 340–342. doi: 10.1049/ell2.12444
Yang, S. Y., Li, S. H., Liu, J. L., Sun, X. Q., Cen, Y. Y., Ren, R. Y., et al. (2022). Histopathology-based diagnosis of oral squamous cell carcinoma using deep learning. J. Dent. Res. 101, 1321–1327. doi: 10.1177/00220345221089858
Yoshizawa, K., Ando, H., Kimura, Y., Kawashiri, S., Yokomichi, H., Moroi, A., et al. (2022). Automatic discrimination of Yamamoto-Kohama classification by machine learning approach for invasive pattern of oral squamous cell carcinoma using digital microscopic images: a retrospective study. Oral Surg. Oral Med. Oral Pathol. Oral Radiol. 133, 441–452. doi: 10.1016/j.oooo.2021.10.004
Zhang, J., Tian, H., Wang, P., Tansey, K., Zhang, S., and Li, H. (2022). Improving wheat yield estimates using data augmentation models and remotely sensed biophysical indices within deep neural networks in the Guanzhong plain, PR China. Comput. Electron. Agric. 192:106616. doi: 10.1016/j.compag.2021.106616
Keywords: GAN model, adaptive bilateral filter, U-net model, dilated convolutional, Grey lag goose optimization algorithm and global attention
Citation: Ramya S and Minu RI (2025) Oral squamous cell carcinoma grading classification using deep transformer encoder assisted dilated convolution with global attention. Front. Artif. Intell. 8:1575427. doi: 10.3389/frai.2025.1575427
Edited by:
Liping Zhang, Harvard Medical School, United StatesReviewed by:
Liviu Steier, University of Pennsylvania, United StatesShufeng Sun, National Institutes of Health (NIH), United States
Copyright © 2025 Ramya and Minu. This is an open-access article distributed under the terms of the Creative Commons Attribution License (CC BY). The use, distribution or reproduction in other forums is permitted, provided the original author(s) and the copyright owner(s) are credited and that the original publication in this journal is cited, in accordance with accepted academic practice. No use, distribution or reproduction is permitted which does not comply with these terms.
*Correspondence: R. I. Minu, cl9pX21pbnVAeWFob28uY28uaW4=
†ORCID: Singaraju Ramya, orcid.org/0009-0005-9595-5735
R. I. Minu, orcid.org/0000-0002-1236-646X