 ShengJie Wang
 Jian Wang*
- International Sakharov Environmental Institute, Belarusian State University, Minsk, Belarus
Malignant melanoma is the deadliest skin cancer, yet its early dermoscopic presentation closely mimics benign melanocytic nevi. Conventional visual or dermoscopic screening therefore suffers from high miss rates and generates excessive biopsies. In this study we focus on Chinese East-Asian patients and introduce a reversed-exclusion strategy—classifying “benign first, exclude malignancy”: lesions that fully meet benign nevus criteria are deemed low-risk; all others are flagged as high-risk. Building on the real-time detector YOLOv10, we incorporate three medical-oriented upgrades: (i) a PP-LCNet backbone to preserve sub-3 mm textures; (ii) a Multiscale Contextual Attention (MCA) neck to enhance cross-scale aggregation; and (iii) a Shape-IoU loss that jointly optimises position, scale, and curvature. The model was trained on a multi-centre dermoscopic dataset from three tertiary hospitals in mainland China (2,040 benign nevi) and independently tested on 365 biopsy-proven melanomas collected at the same medical institution but drawn from a demographically distinct patient cohort, achieving a detection mAP@0.5 of 97.69% for benign lesions and a melanoma false-negative rate (FNR) of only 0.27%. By delivering high-confidence benign identification followed by malignant exclusion, the proposed model offers a high-precision, low-risk pathway for early melanoma screening in Chinese clinical settings. It can markedly reduce unnecessary biopsies while keeping the miss rate below the clinical safety ceiling of 0.5%, thus preserving the life-saving window afforded by early detection.
1 Introduction
Malignant melanoma is the deadliest form of skin cancer; when it is diagnosed early, the 5-year survival rate rises from 23% in advanced disease to 99% (Thomas et al., 1998; Whited et al., 1997). Nevertheless, on dermoscopic images early melanomas closely mimic benign melanocytic nevi, so conventional visual inspection or dermoscopy carries a substantial risk of missed diagnosis (Dinnes et al., 2018). Benign nevi are usually symmetrical, uniformly pigmented and sharply demarcated (Lallas et al., 2012); in contrast, even in-situ melanomas reveal subtle asymmetry or focal disruption of the pigment network (Dinnes et al., 2018; Carrera et al., 2017b). Non-melanocytic lesions such as seborrhoeic keratosis and haemangioma display readily distinguishable features, and consequently their clinical confusion rate with melanoma is far lower (Carrera et al., 2017a; Stell et al., 2007). This quasi-mutual exclusivity implies that lesions strictly meeting benign criteria can almost rule out melanoma, whereas any departure from those rules should be regarded as high-risk and sent for biopsy.
The three principal clinical pathways—naked-eye or dermoscopic assessment, periodic imaging follow-up, and surgical biopsy—each have limitations. Large studies show that the ABCDE rule and the seven-point checklist deliver only 65 –80% sensitivity, with inter-observer agreement κ < 0.4 (Thomas et al., 1998; Whited et al., 1997), and comprehensive skin screening is constrained by time and workforce. Dermoscopy can raise sensitivity by a further 10 –27% (Dinnes et al., 2018), yet early lesions are often “feature-poor” (Lallas et al., 2012); differences in operator training can produce specificity gaps of ~20 percentage-points (Carrera et al., 2017a), and specificity for non-pigmented lesions remains insufficient, leading to frequent unnecessary biopsies (Carrera et al., 2017b). Biopsy with histopathology—though the diagnostic gold standard—causes scarring and financial burden, and secondary wide excision is required in up to 22% of cases (Stell et al., 2007). Novel non-invasive technologies such as reflectance confocal microscopy achieve ~93% sensitivity and ~76% specificity in large cohorts (Stevenson et al., 2013), but devices cost tens of thousands of US dollars and a single examination may take 10 min (Stevenson et al., 2013); optical coherence tomography demands > 180 scans for novice competence, with systems priced at USD 50000–100,000 (Van Loo et al., 2020; Ferris and Harris, 2012). The quest to combine high sensitivity with an extremely low miss rate therefore remains clinically urgent.
Although deep convolutional networks have advanced medical image analysis, four key bottlenecks impede their direct application to early melanoma detection. First, morphological overlap yields limited separability of high-resolution features (Hunziker et al., 2023). Second, public datasets are dominated by nevus images, inducing class imbalance and model bias (Akash et al., 2023). Third, the pronounced heterogeneity of melanoma morphology necessitates deeper networks and larger receptive fields, raising computational cost and over-fitting risk (Shen et al., 2021; Alzamili and Ruhaiyem, 2025). Fourth, the coarse granularity of pathological labels makes it hard to learn reliable links between malignant behavior and imaging appearance, heightening misclassification of inflammatory or keratotic lesions (Naseri and Safaei, 2025).
To address these challenges, we propose a “benign-first” inverse-exclusion strategy. Instead of directly trying to detect “malignant” lesions, the model first identifies melanocytic nevi with high confidence if they fully meet benign criteria — symmetry, uniform pigmentation, and sharply defined borders. Any lesion that fails to meet one of these rules is placed in the high-risk category and sent for biopsy. Because early melanoma growth inevitably disrupts at least one of the benign features, this approach naturally suppresses false negatives and enables high-sensitivity screening that adheres to strict clinical safety thresholds. Within the YOLOv10 framework, we incorporate three key enhancements: a lightweight PP-LCNet backbone to preserve sub-3 mm nevus texture, a Multiscale Contextual Attention (MCA) module to capture local irregularities, and a Shape-IoU loss to jointly optimize aspect ratio, centroid position, and border curvature. The model will declare a lesion “melanocytic nevus” only if it fully meets all criteria of symmetry, uniform color, and smooth borders; otherwise, it is flagged as high-risk and referred for biopsy (this workflow is illustrated in Figure 1).
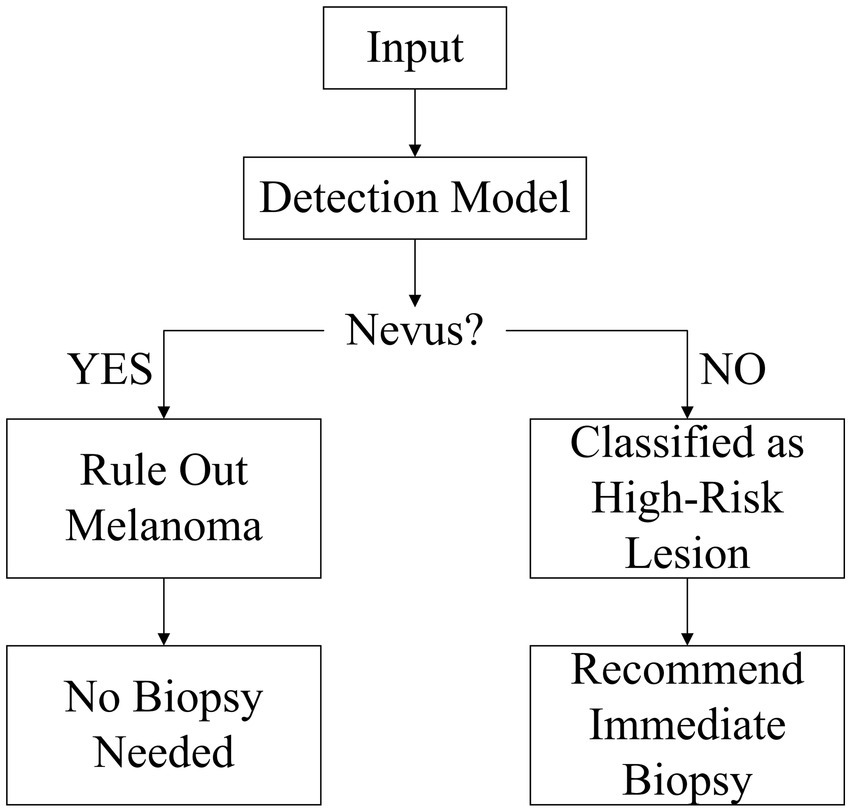
Figure 1. Reverse-exclusion logic diagram for melanoma.
This high-confidence, benign-first workflow strikes a new balance between efficiency and safety, offering a practical technological pathway for early melanoma screening.
2 Related work
Early automated melanoma detection relied on handcrafted features such as colour histograms and grey-level co-occurrence matrices; these techniques had limited power for lesions with fuzzy borders, irregular shapes or minute early foci, yielding missed-diagnosis rates of 25 –30% (Almubarak et al., 2017). Even the clinically ubiquitous ABCDE or seven-point scales can show miss rates above 40% when the symmetry index falls below 1.5 (Tsao et al., 2015), with strong operator-dependent variability. The advent of deep learning greatly improved overall accuracy: in the ISIC 2017 challenge, ResNet-based CNNs achieved a mean classification accuracy of 83.7% (Codella et al., 2017), marking a milestone in image pattern recognition. Nonetheless, dataset bias and the scarcity of early lesions persist. In ISIC 2020, histopathology-confirmed melanomas account for only 1.8% of images, leaving models largely untrained on in-situ disease (Rotemberg et al., 2021). A more advanced Vision Transformer reached 92.79% accuracy in multiclass skin-disease classification, yet its melanoma recall remained below 60% (Flosdorf et al., 2024). Clinical studies show that high-quality AI assistance markedly improves diagnostic performance for less-experienced physicians, whereas immature systems may mislead clinicians at all levels (Tschandl et al., 2020), underscoring the need for reliable and interpretable algorithms.
At the detection-framework level, YOLOv10 provides a real-time, high-precision baseline through two-stage dynamic label assignment and a decoupled detection head: official experiments report a 2.8-percentage-point gain in mAP@0.5–0.95 and a further 3.4-point gain for small-object AP (Wang A. et al., 2024); on the Roboflow mole-test the false-negative rate (FNR) fell from 7.6% to 4.1% (Wang A. et al., 2024). Mobile-device tests also showed a 2.3-point rise in binary-classification F1 (Liutkus et al., 2023). Yet the overall FNR still exceeds the clinical safety threshold of 0.5% (Esteva et al., 2017). The root causes are threefold: eight-fold down-sampling leaves nevi < 3 mm represented by only 1–3 pixels, with recall around 68%; a fixed-scale PANet limits small-nevus mAP to roughly 75%; and CIoU is insensitive to curved borders, giving an average 12-point IoU deficit relative to pathology masks, which further dilutes confidence and produces a cascade of low recall and high FNR.
Clinicopathological studies confirm the morphological stability of benign nevi: in biaxial measurements of 56 lesions, 96.4% had bilateral symmetry distances ≤ 0.1 mm (Flotte and Lamberti, 1992); among 209 images, 99.0% showed RGB colour variance < 0.10 (Seidenari et al., 2005); and in 296 cases, 99.3% exhibited edge-gradient values > 0.80 (Fikrle and Pizinger, 2007). Deviations sharply raise malignant risk: in a cohort of 237 followed lesions, those with symmetry or colour heterogeneity had a melanoma positivity rate of 31.6%, odds ratio = 5.7 (95% CI 3.2–9.1) (Arumi-Uria et al., 2003). Conversely, among 430 nevi meeting strict CASH criteria, none transformed over five years, giving an NPV of 100% (95% CI 99.0–100.0%) (Henning et al., 2007). These statistics underpin the strategy of “high-precision benign identification leading to malignant exclusion”.
In summary, neither traditional handcrafted methods nor current deep models can simultaneously deliver the high sensitivity and ultra-low miss rate required for early melanoma detection. YOLOv10’s dynamic matching and decoupled head form a solid base for small-lesion detection, but shallow-layer resolution, cross-scale semantic fusion and boundary regression remain bottlenecks for lowering FNR. Future work must iterate on high-resolution backbones, dynamic multiscale attention and shape-aware loss functions to meet the stringent clinical target of “FNR ≤ 0.5%” in early screening.
3 Methodology
3.1 Melanocytic nevus detection model based on improved YOLOv10
3.1.1 Analysis of YOLOv10 baseline structure and limitations in medical detection accuracy
As an end-to-end detection framework, YOLOv10 adopts the classical three-stage Backbone–Neck–Head architecture (see Figure 2).
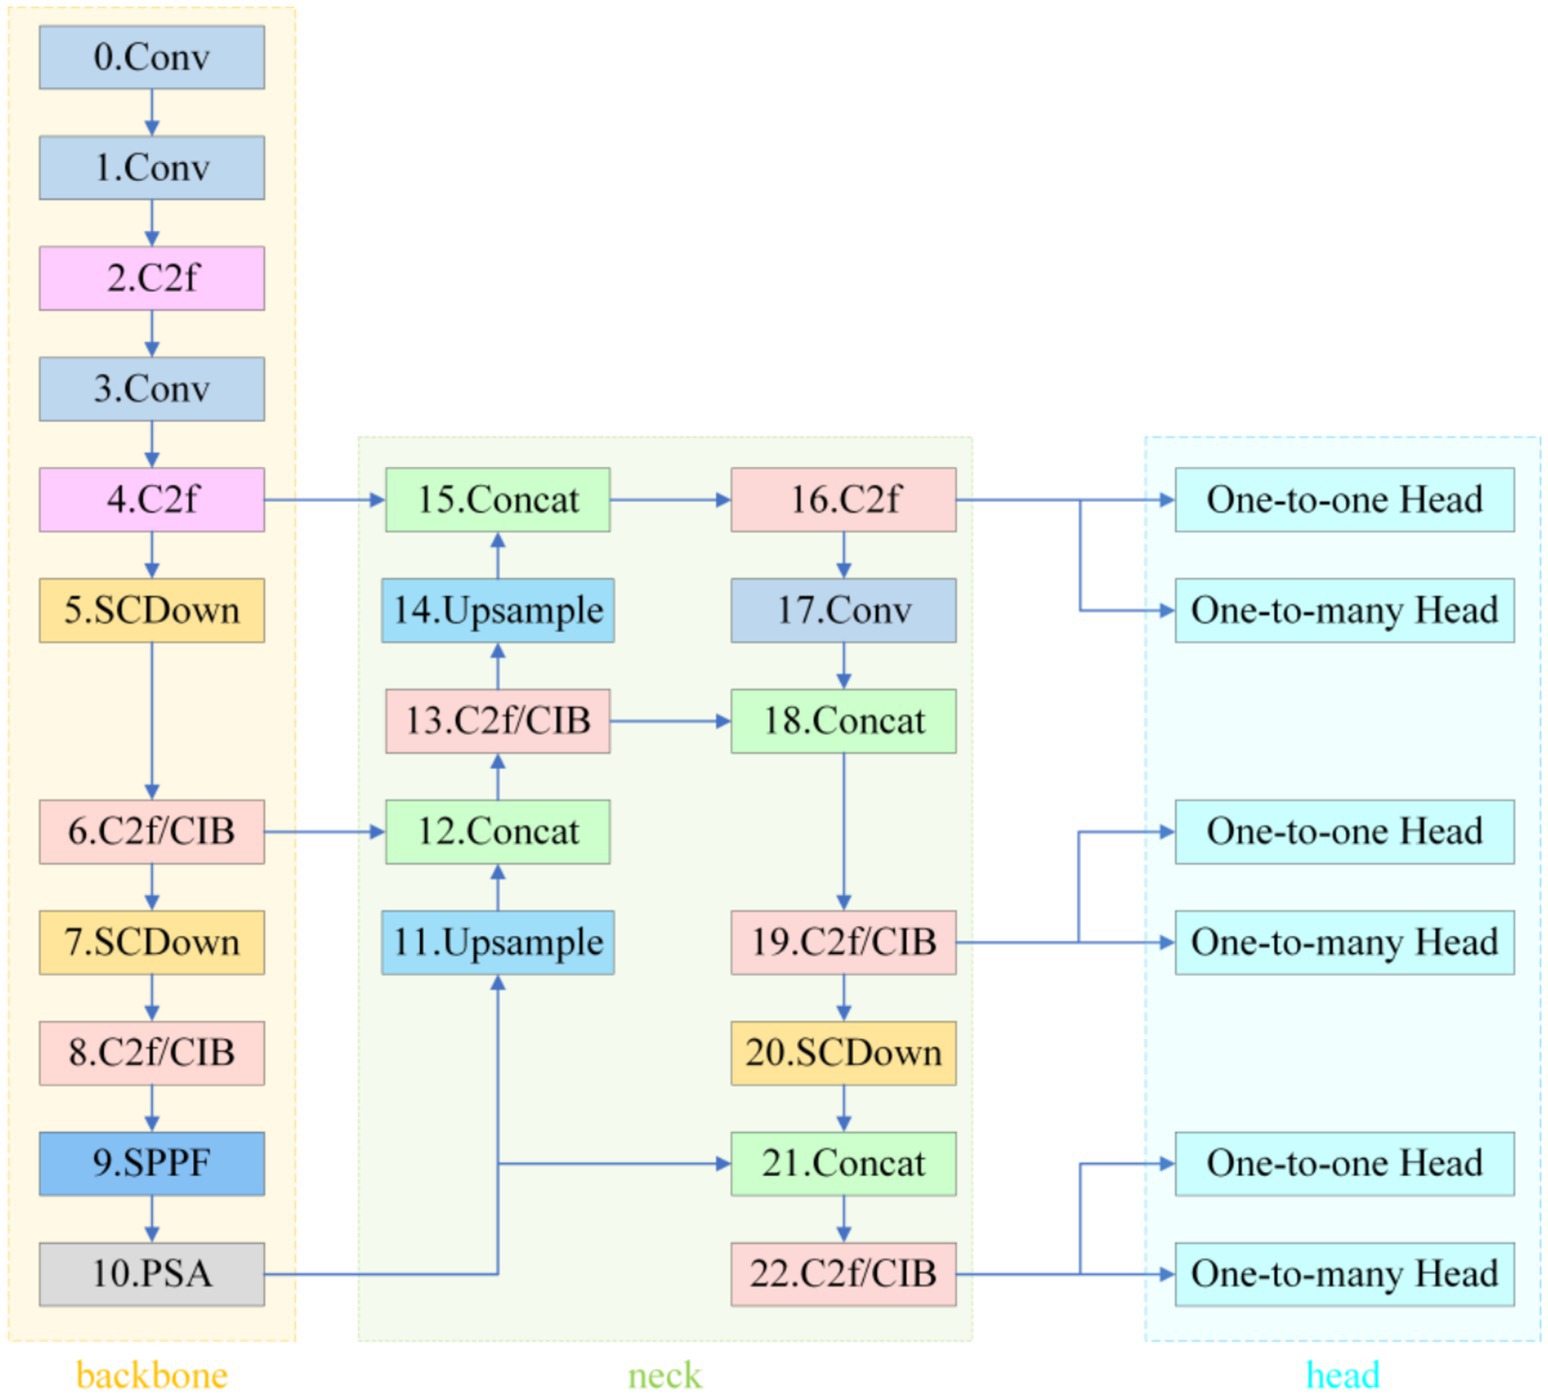
Figure 2. YOLOv10.
The backbone, CSPDarknet-Tiny, completes 8 × spatial down-sampling in its first two stages and enlarges the receptive field with SPPF and PSA modules; however, this early compression leaves micro-nevi (< 3 mm) occupying only 1–3 pixels on the feature maps, erasing fine pigment patterns. In a study of 59,090 dermoscopic images, Liutkus et al. reported an average recall of just 68.0% for such lesions (Wang A. et al., 2024).
In the Neck, the fixed three-level pyramid inherited from PANet merges scales through repeated up-sampling and concatenation but lacks an adaptive receptive-field mechanism for multi-scale coexisting lesions, limiting the mAP@0.5 for small nevi to 75.0% (Wang A. et al., 2024) and thus constraining high-confidence “benign-first” screening. The decoupled head combines SimOTA and Task-Aligned Assigner to ease gradient coupling, yet the regression branch relies on the default CIoU loss; CIoU is insensitive to curved edges and degenerates to IoU as a prediction box nears its ground truth (Cai et al., 2023). Rectangular boxes therefore fit circular or mildly curved lesions much worse than shape-sensitive losses (Nguyen et al., 2022). Empirically, the average IoU (or mAP) gap between predictions and pathological annotations reaches 10–12 percentage points (Ye et al., 2024), further depressing classification confidence and heightening miss-detection risk (Annadatha et al., 2022).
In summary, YOLOv10 exhibits three critical bottlenecks in melanocytic nevus detection: insufficient shallow-layer resolution, rigid cross-scale modeling, and morphologically inaccurate boundary regression.
3.1.2 Medical adaptation of lightweight backbone network PP-LCNet
To compensate for CSPDarknet-Tiny’s excessive compression of shallow textures in micro-nevi (< 3 mm), this study replaces the YOLOv10 backbone with PP-LCNet (see Figure 3).
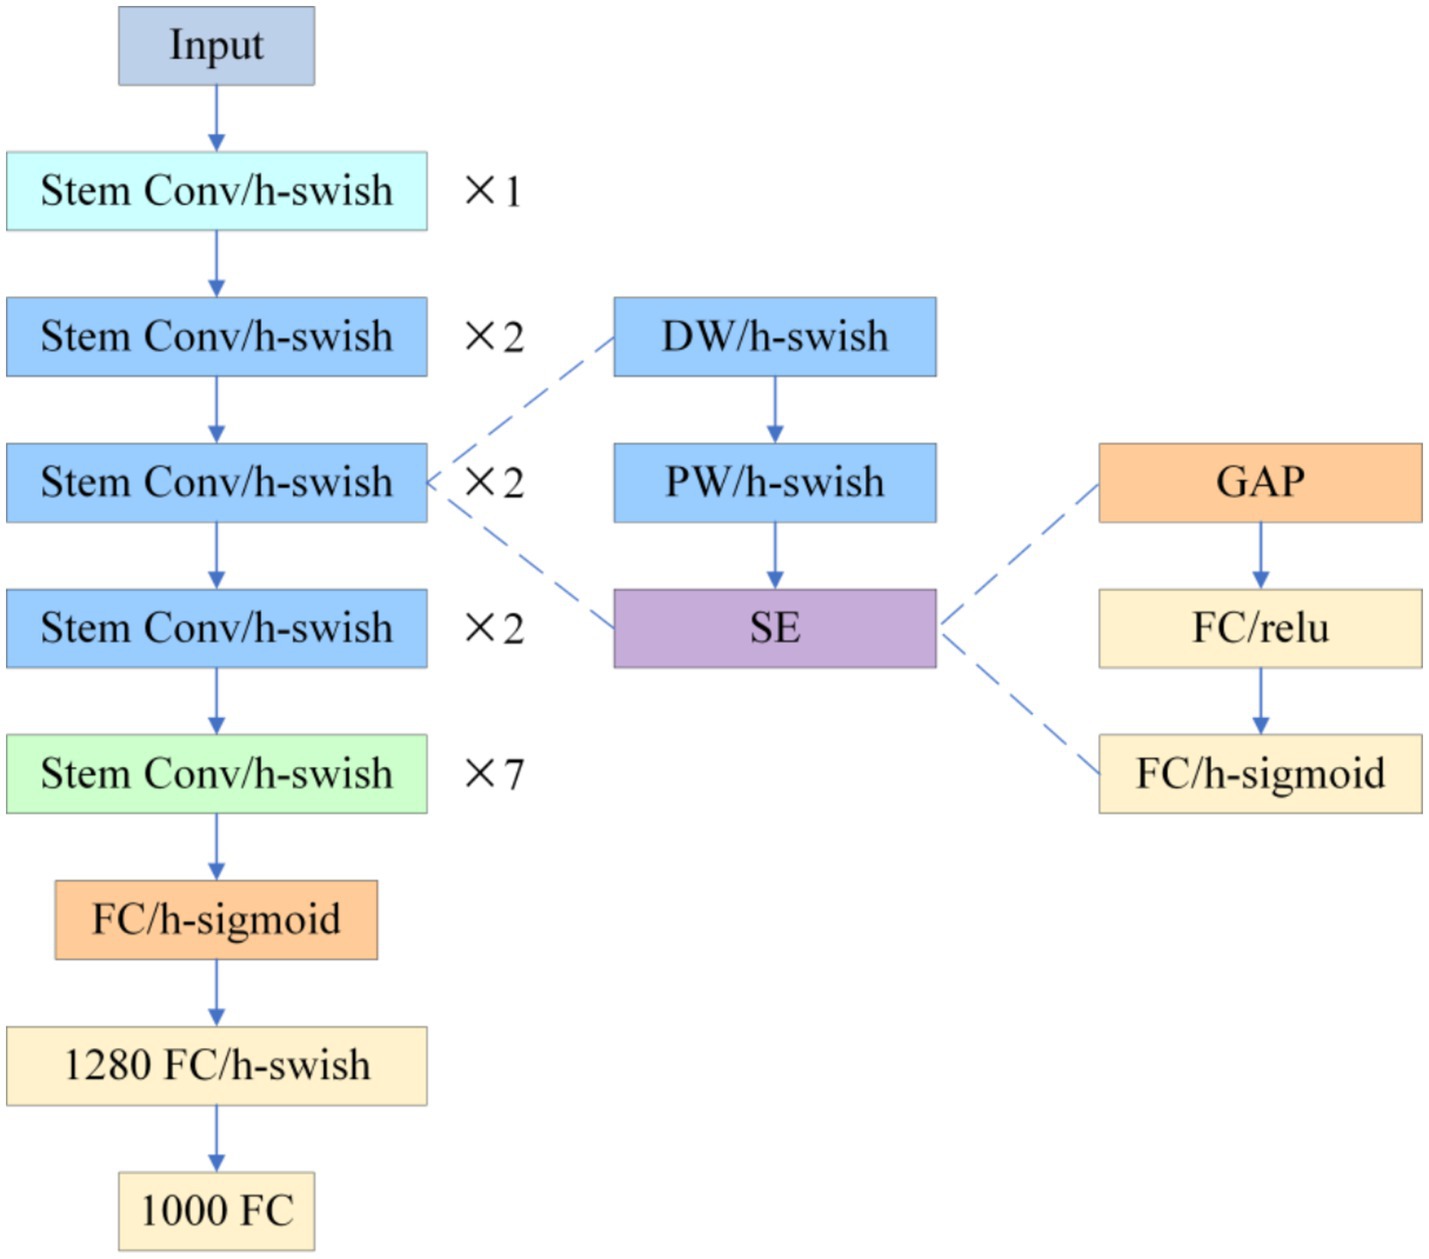
Figure 3. PP-LCNet.
The network begins with a Stem Conv and multi-stage depthwise-separable convolutions, appends a stack of 5 × 5 large-kernel convolutions at the tail, employs H-Swish activation and Squeeze-and-Excitation (SE) throughout, and inserts a 1 × 1 convolution with 1,280 channels after global average pooling to reinforce global aggregation. Experiments show that switching ReLU to H-Swish alone increases ImageNet-1 k Top-1 accuracy from 55.58 to 58.18%; adding SE lifts it to 59.91%, and the combination of 5 × 5 kernels with the high-dimensional 1 × 1 convolution pushes accuracy to 63.14%, clearly outperforming MobileNetV2 (53.21%) and ShuffleNetV2 (53.73%) at comparable scales (Cui et al., 2021). When transferred to dermoscopic analysis, PP-LCNet’s heightened sensitivity to faint pigment networks and blurred boundaries markedly lowers micro-nevus miss rates and improves boundary discrimination, delivering higher-confidence support for the subsequent “benign-first, malignancy-exclusion” workflow without a significant increase in computational cost.
3.1.3 Medical adaptation of lightweight backbone network PP-LCNet
To remedy the limited contextual parsing of micro-nevi caused by PANet’s fixed-scale fusion, we replace the entire attention branch in YOLOv10’s neck with a Multidimensional Collaborative Attention (MCA) module (see Figure 4).
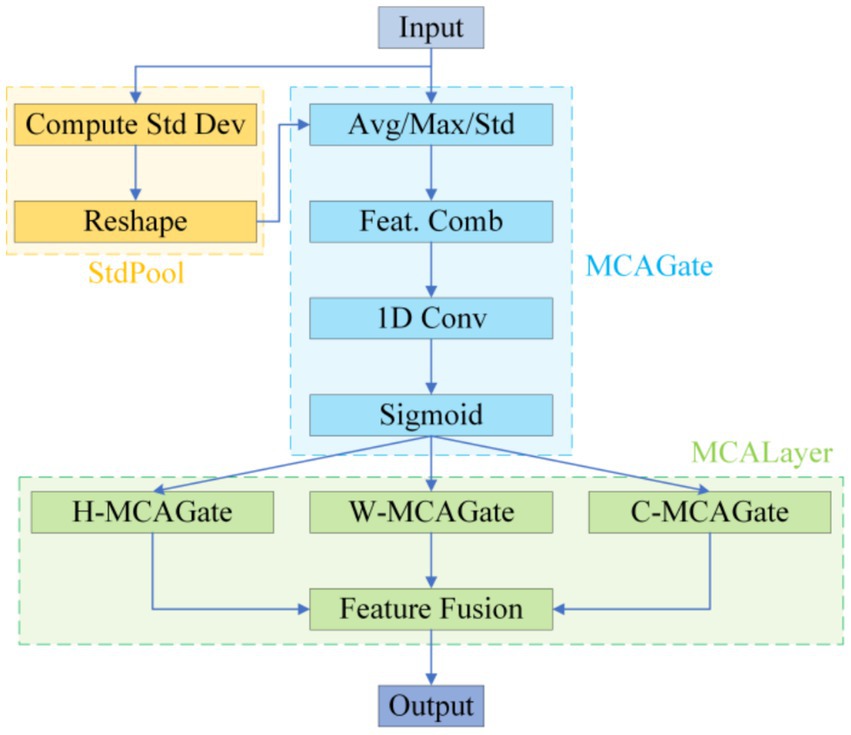
Figure 4. MCA structure diagram.
MCA begins by applying average, standard-deviation and max pooling to the input features in parallel, using the three statistics to construct a complementary brightness–texture–extremum background. During the “squeeze” phase, learnable weights dynamically balance the contributions of average and standard-deviation pooling, while the “excitation” phase substitutes the SE-MLP reduction with 1 × k grouped convolutions to prevent channel-information mismatch; this strategy yields a 1.8 –2.6% Top-1 accuracy gain on ImageNet-1 k (Yu et al., 2023). The module then models attention independently along channel, width and height dimensions, averages the Sigmoid-normalised weights to suppress single-branch noise amplification, and thus simultaneously answers “where to look” and “what to look for” (see Figure 5).
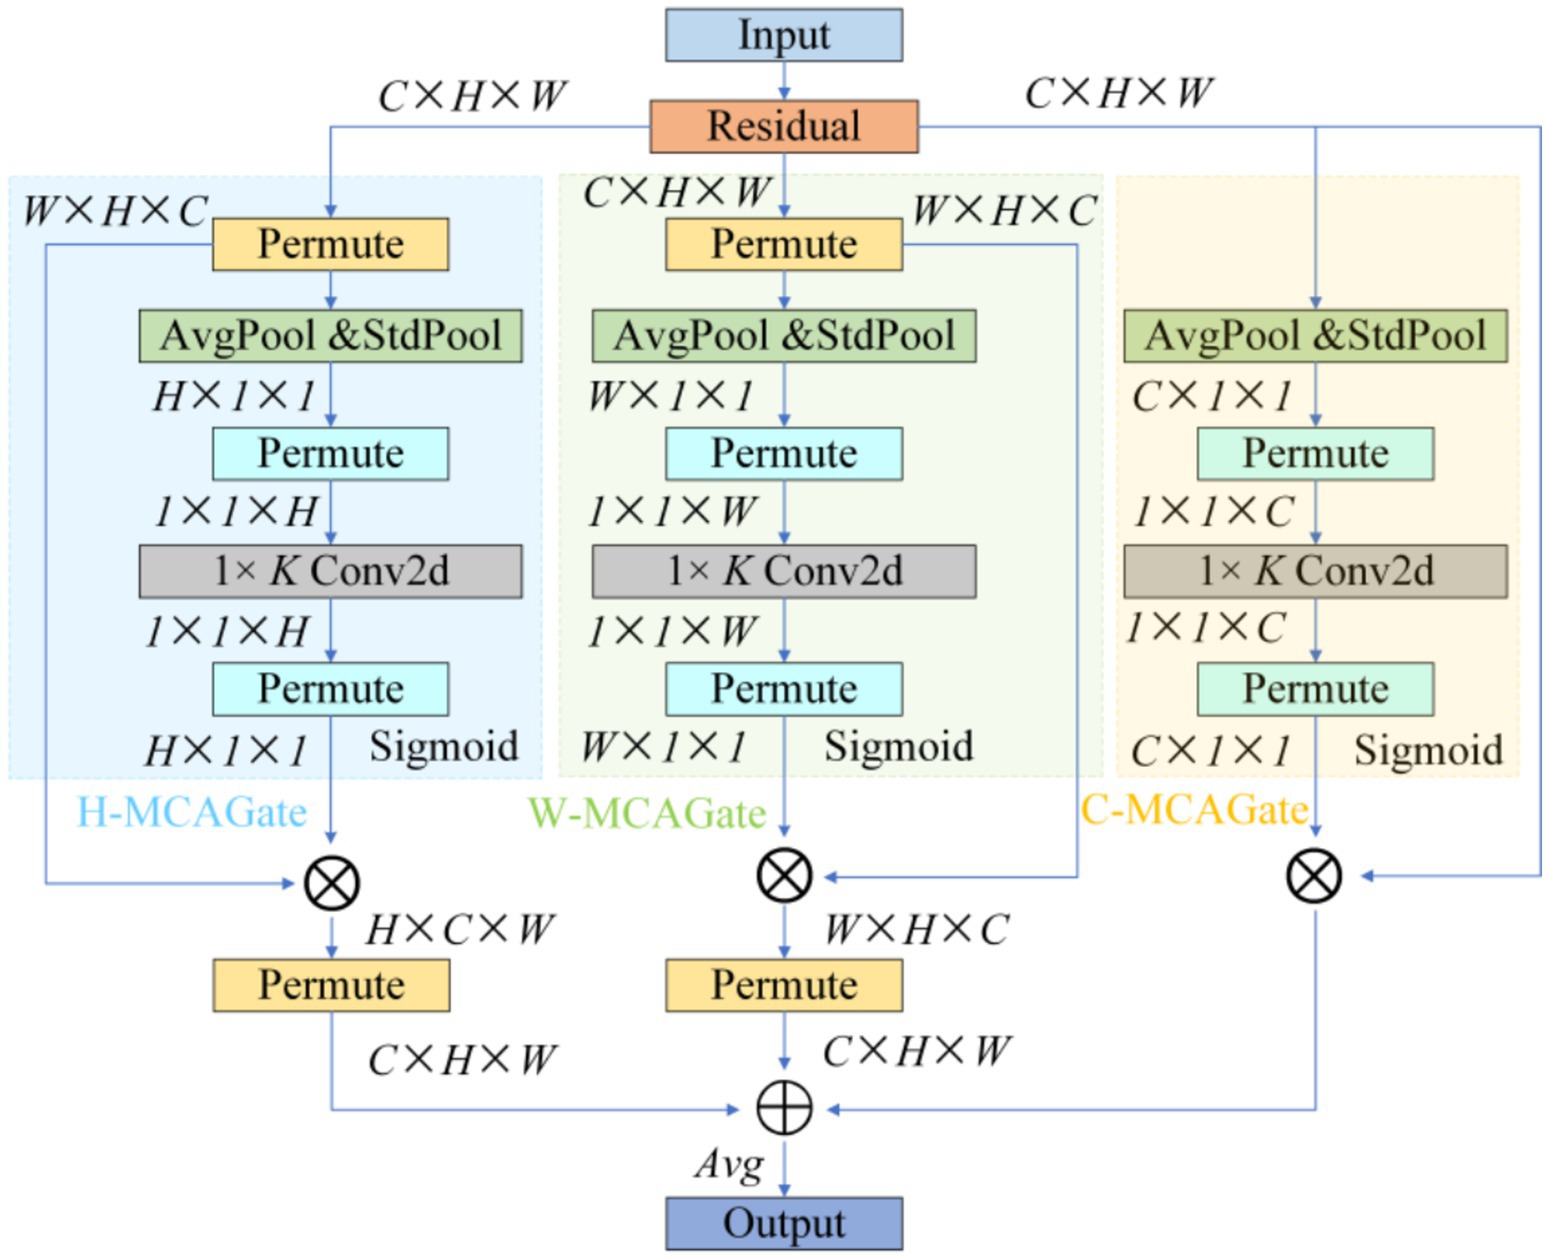
Figure 5. MCA layer.
This “multi-pooling context – adaptive fusion – three-dimensional collaboration” scheme markedly increases sensitivity to < 3 mm, low-contrast lesions, lowers the miss rate for small nevi, and delivers the precision needed to support the subsequent “benign-first, malignancy-exclusion” screening framework (Yu et al., 2023).
3.1.4 Medical adaptability improvement of shape-sensitive loss function shape-IoU
The default CIoU regression in YOLOv10 is insensitive to curved or mildly convex edges, yielding an average 12-percentage-point IoU gap between predicted boxes and pathological ground truth and thus degrading classification confidence while elevating miss risk (Zhang and Zhang, 2023). We therefore introduce Shape-IoU, which replaces a purely overlap-based metric with a three-factor model—similarity, shape deviation, and scale sensitivity. While retaining IoU as the structural-consistency baseline, Shape-IoU adds horizontal and vertical weights ww and hh to capture width-to-height proportionality, and normalises the centre–distance penalty by the convex-hull diagonal so that “centre offset” is scaled to lesion size. An additional shape-difference term Ωshape applies an exponentially decaying weight to width–height discrepancies, enforcing tighter fits for targets with regular boundaries and stable aspect ratios (e.g., benign nevi). This loss suppresses “large-box dominance,” lowers the chance that slightly misaligned early melanomas are labelled benign, and markedly improves localisation accuracy to meet the clinical low-miss-rate requirement.
The specific formula (Equations 1–7) be derived from Figure 6.
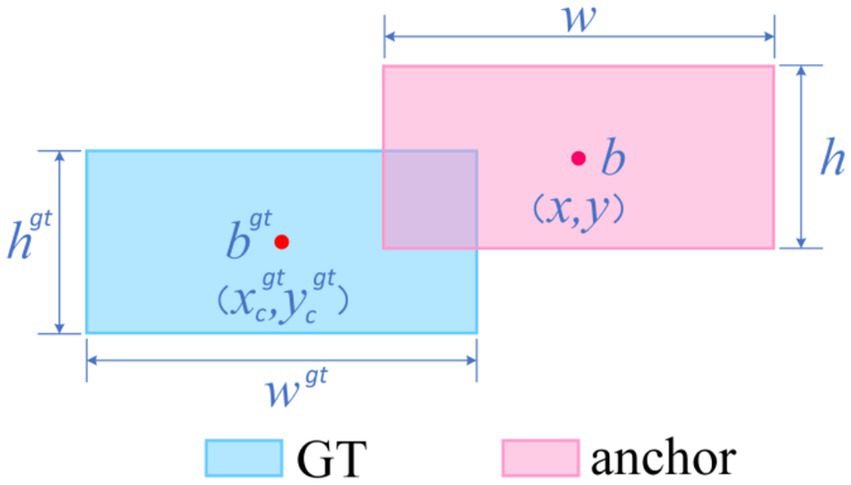
Figure 6. Shape-IoU loss function formula inference diagram.
Where, scale is the scale factor reflecting the target’s actual size in the dataset; and are the horizontal and vertical weighting coefficients, respectively, whose values are closely related to the width-height shape of the ground truth (GT) box. Based on this definition, the corresponding bounding box regression loss function can be formulated as:
The specific logic is illustrated in Figure 7.
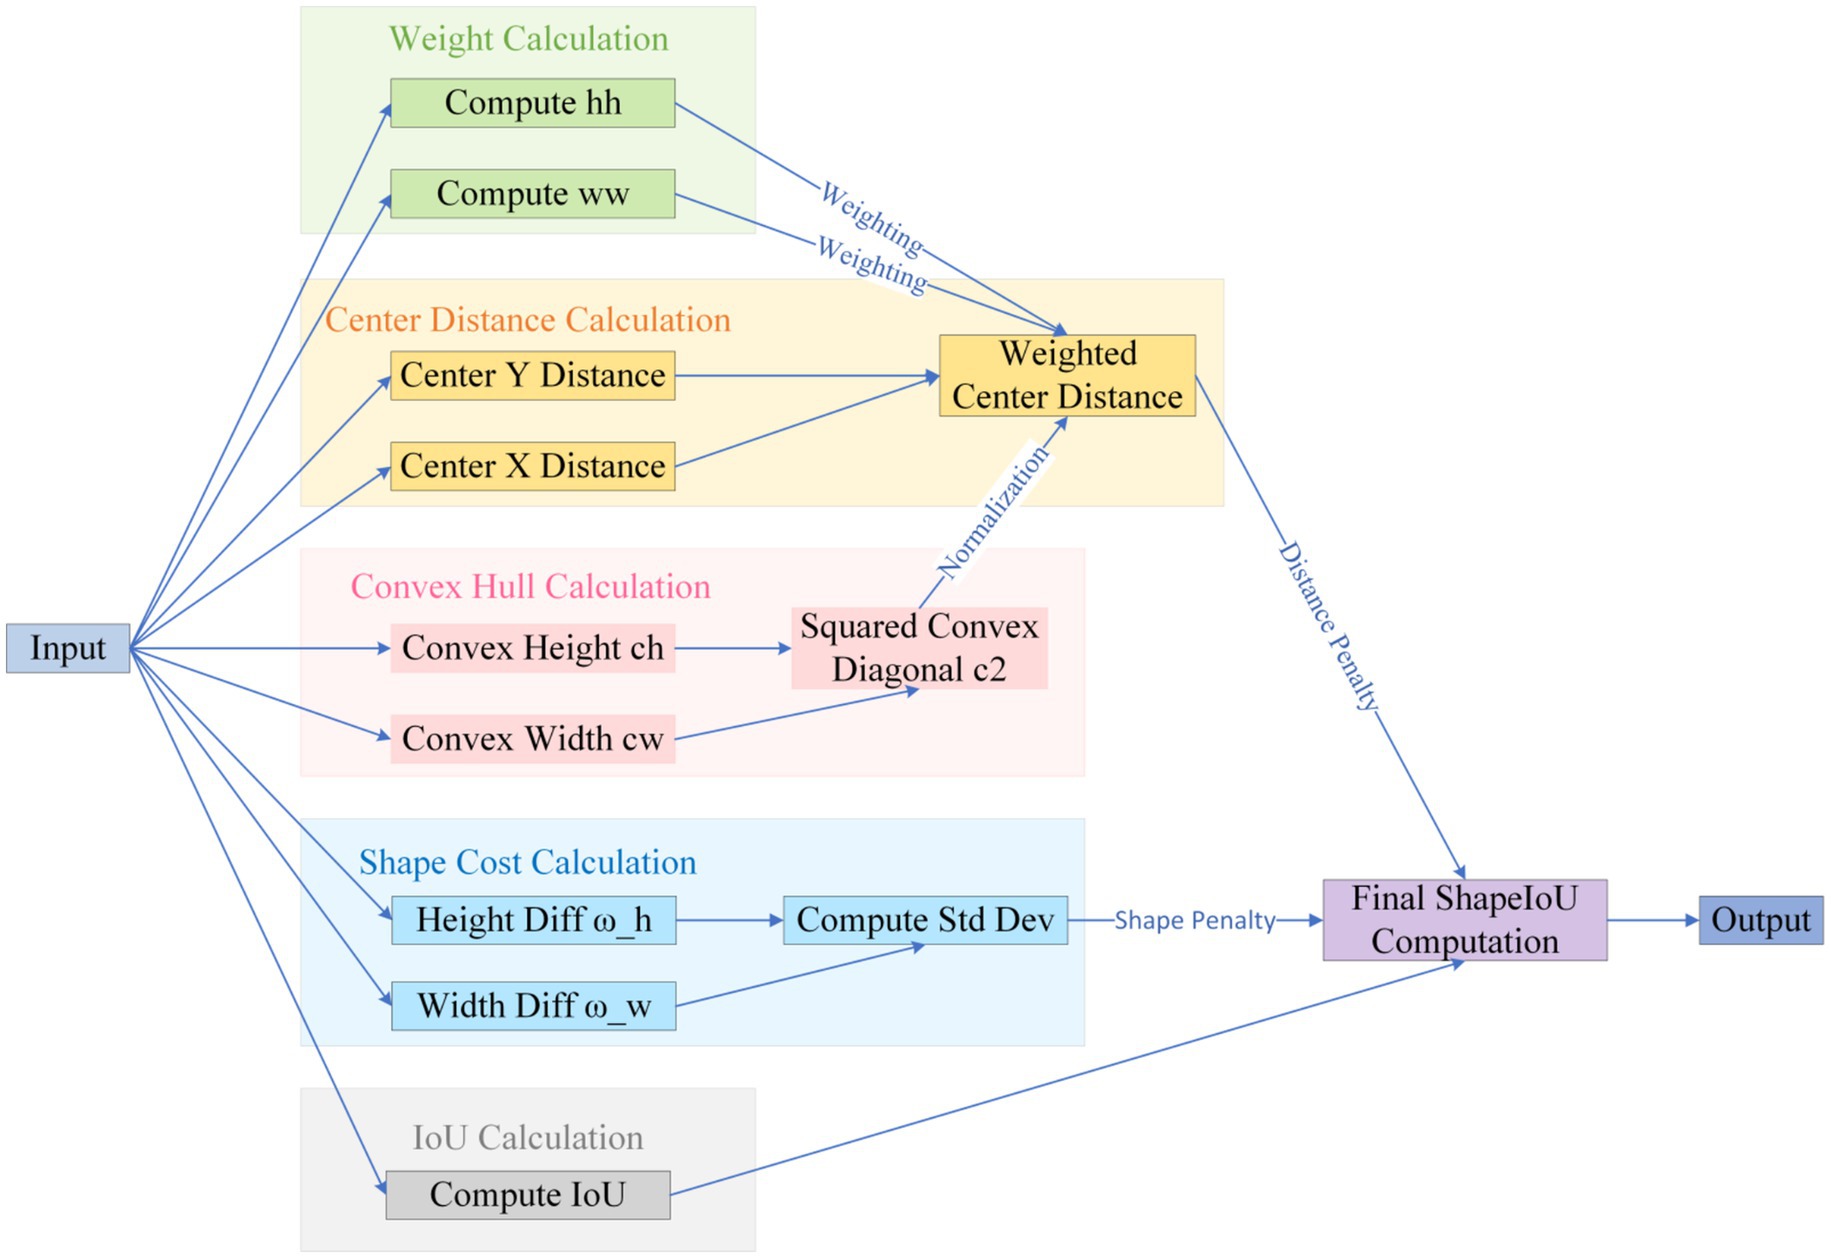
Figure 7. Shape-IoU logic diagram.
In summary, Shape-IoU simultaneously addresses positional, scale, and shape discrepancies, overcoming the insensitivity of generic IoU-series losses to arc-shaped boundaries in medical imaging. This approach is expected to enhance the synergistic accuracy of localization and classification.
3.1.5 Overall model architecture
The improved detection network retains YOLOv10’s single-stage end-to-end framework but sequentially integrates precision-enhancing modules tailored for melanocytic nevus characteristics across three critical layers—backbone, neck, and detection head—forming a high-resolution information chain from shallow to deep levels. The specific network structure is shown in Figure 8.

Figure 8. YOLOv10 + PP-LCNet+MCA + shapIoU overall structure.
The internal information flow is divided into three segments—texture fidelity, multiscale aggregation, and shape-sensitive regression—progressively resolving the original model’s detection bottlenecks for small nevus targets.
3.1.5.1 Stage 1: texture fidelity
A 640 × 640 px dermoscopic image enters the PP-LCNet-based backbone. Starting with a 3 × 3/2 Stem Conv to open a high-resolution channel, the backbone sequentially stacks seven groups of depthwise separable convolutions. The first four groups remain at 1/4 and 1/8 resolutions, preserving pixel-level textures of nevi smaller than 3 mm in diameter. After outputting 1/16 and 1/32 feature layers, the backbone expands the receptive field via 5 × 5 SPPF and recalibrates global channels using SE-PSA. This yields three complementary multiscale feature maps: P3 (1/8), P4 (1/16), and P5 (1/32).
3.1.5.2 Stage 2: multiscale aggregation
The three feature maps enter the modified PANet. The network first upsamples P5 by 2 × and concatenates it with P4, generating P4′ after C2f fusion. P4′ is then upsampled and concatenated with P3 to produce P3′. Concurrently, P3′ and P4′ are downsampled via 3 × 3/2 SCDown to deeper layers, enhancing semantic density to form P4″ and P5″. Before these nodes (P3′, P4″, P5″), the system inserts Multiscale Contextual Attention (MCA) layers. MCA first performs parallel average pooling and standard deviation pooling on input features to encode luminance and texture dispersion. It then independently computes attention weights across channel, width, and height branches, dynamically mapping them to the 0–1 range via Sigmoid. The three-dimensionally weighted features—denoted as M-P3, M-P4, M-P5—carry context representations optimized for small, low-contrast lesions.
3.1.5.3 Stage 3: shape-sensitive regression
The calibrated features are fed into the decoupled v10Detect Head. While retaining YOLOv10’s three-branch structure, the detection head replaces CIoU with Shape-IoU for boundary regression. The new loss introduces scale weights, center distance penalties, and aspect ratio difference terms alongside IoU, providing steeper gradient feedback for arc-shaped or mildly curved boundaries. During training, “one-to-one” and “one-to-many” dual-branch label assignments operate in parallel. During inference, only the one-to-one branch is retained, directly outputting final detection boxes and class confidences from M-P3, M-P4, and M-P5 scales without relying on NMS post-processing.
3.2 Multicenter dataset construction
3.2.1 Data sources and image annotation standards
The primary training data for this study were collected from three tertiary Grade-A hospitals under the same medical institution, ensuring horizontal consistency in imaging protocols and equipment parameters. The geographic and temporal distribution of the three hospital branches is as follows Table 1.
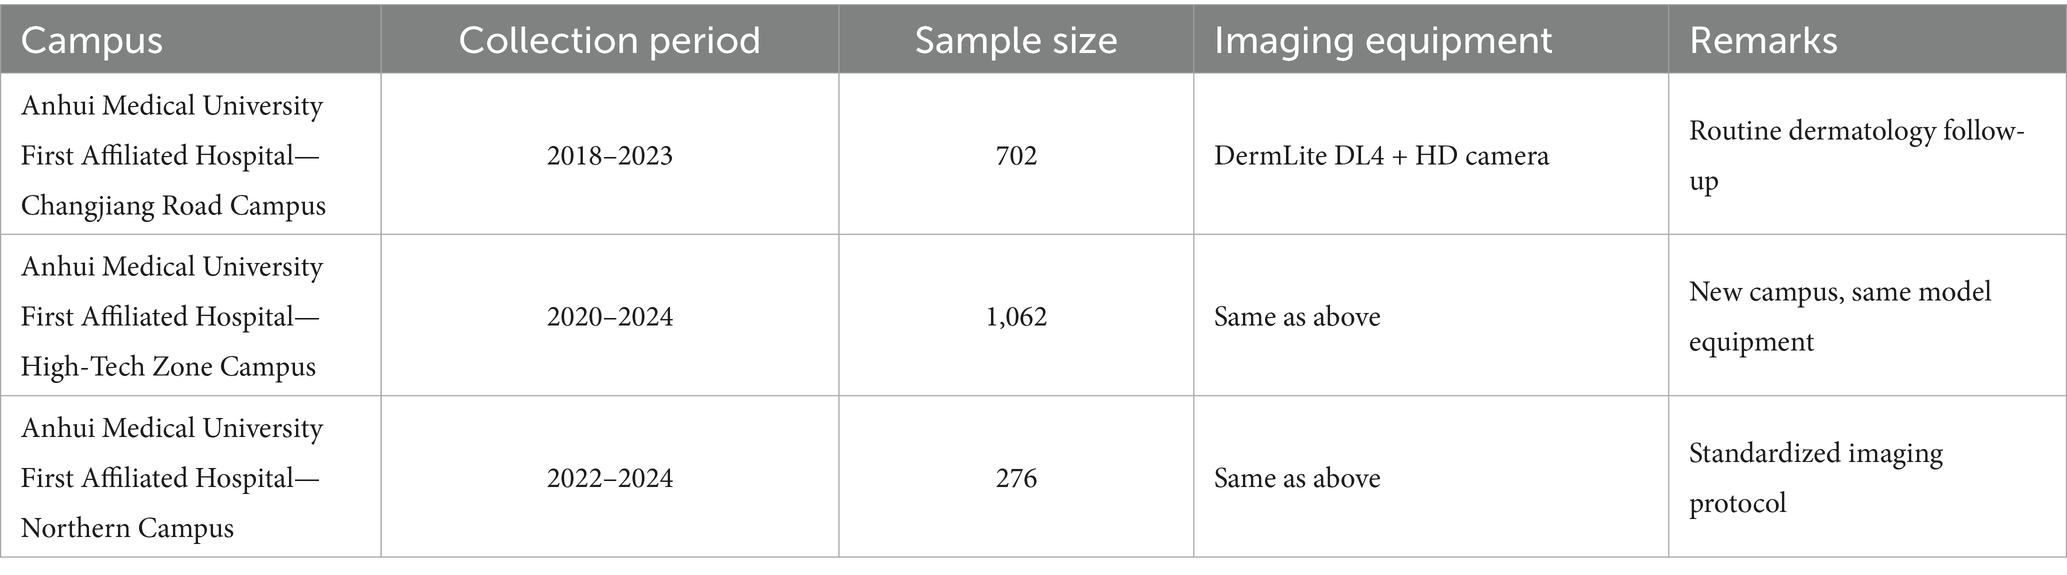
Table 1. Data sources.
A total of 2,040 dermoscopic images were confirmed as benign melanocytic nevi through clinical examination.
Sample images from the main dataset are shown in Figure 9.
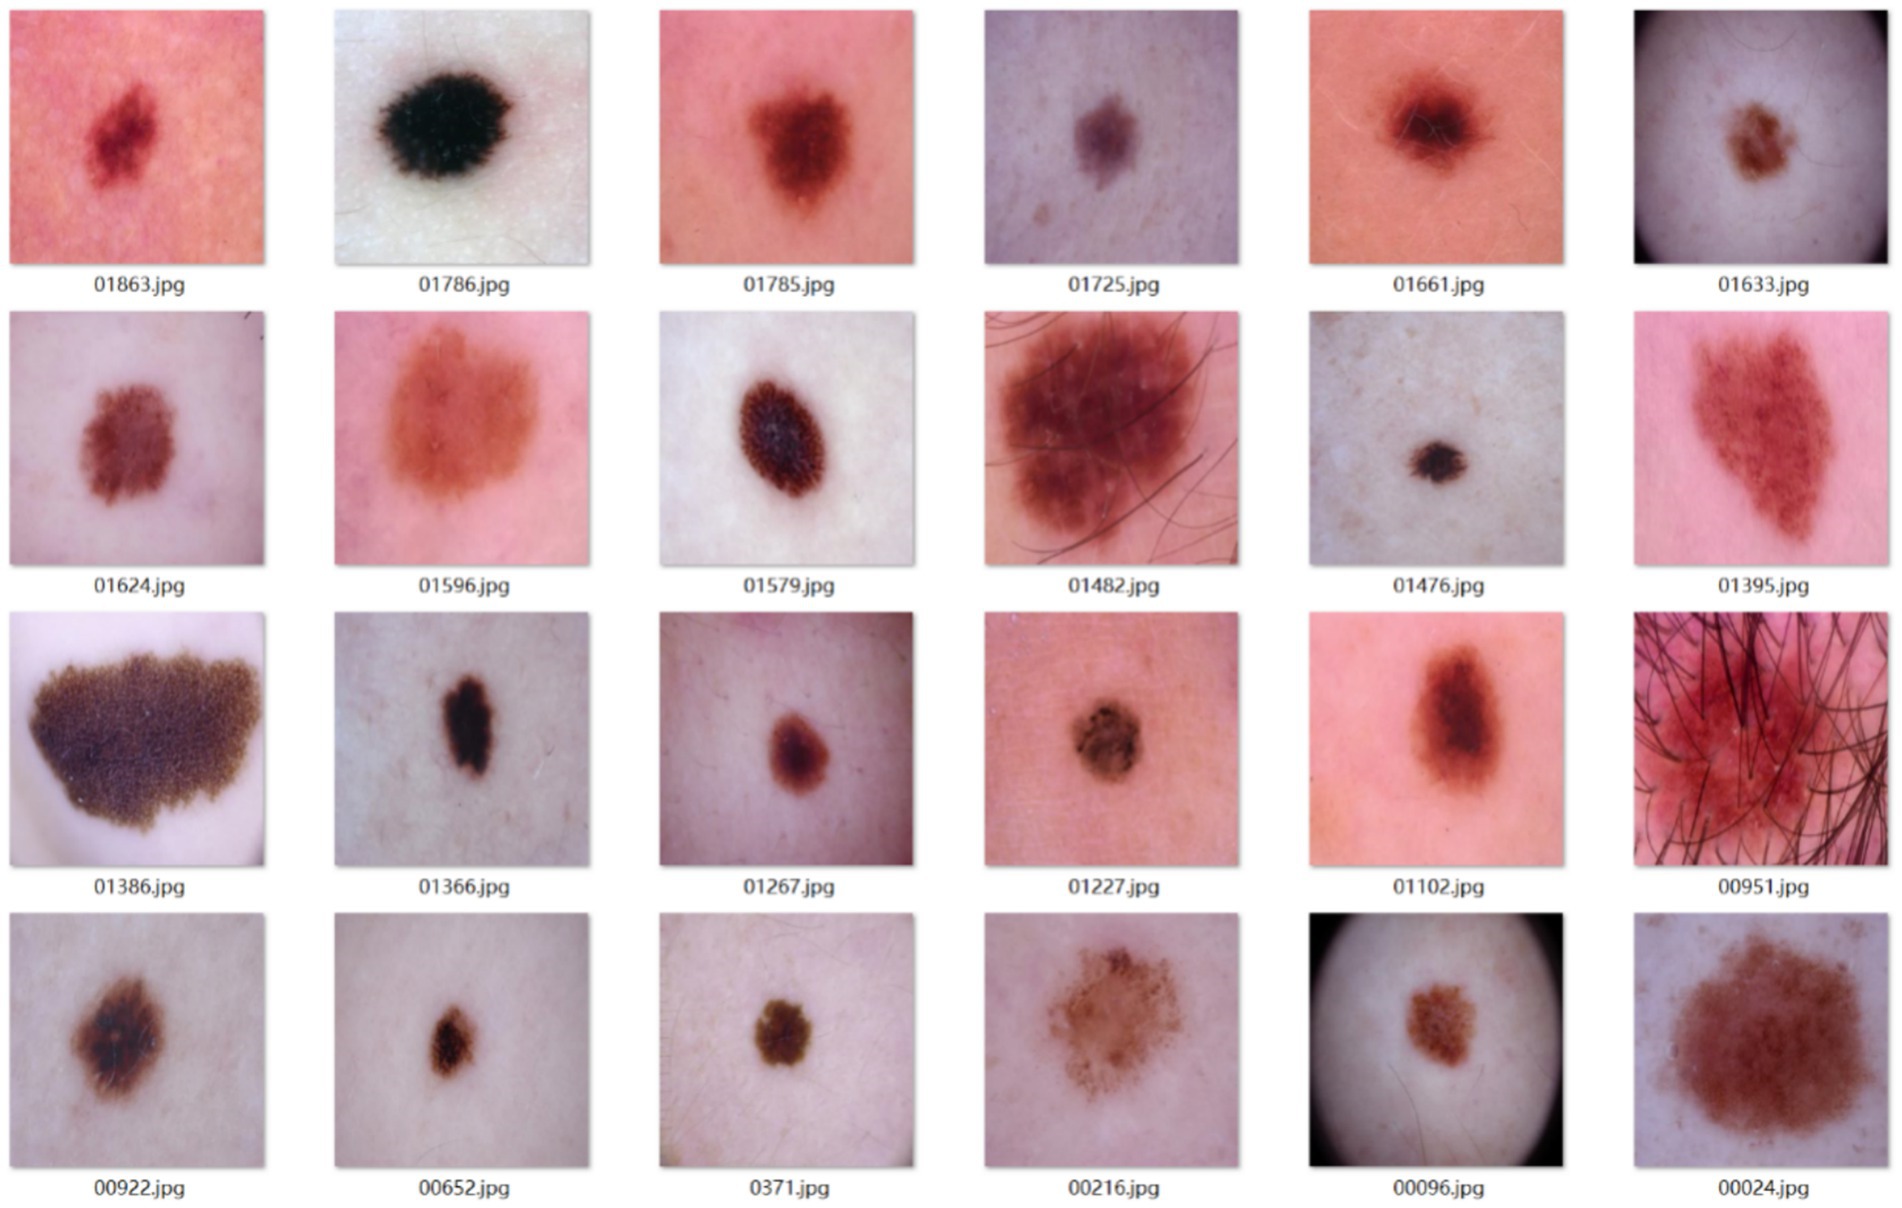
Figure 9. Example images of the melanocytic nevi dataset.
Given that nevus lesions are not routinely biopsied in standard clinical care, the gold standard for this dataset was established through a clinical double-blind assessment with expert adjudication protocol. All patient-identifiable data were rigorously scrubbed from the collected records, including:
1. Initial screening and acquisition: patients underwent standardized imaging using 10–20 × polarized dermoscopy during outpatient visits or follow-ups, adhering to institutional protocols. Images with glare or focal plane deviations were immediately reacquired.
2. Double-blind evaluation: two dermatologists with attending physician or higher qualifications independently interpreted anonymized images. They applied ABCD scoring and benign nevus morphological criteria (symmetry, color homogeneity, sharp borders) to classify lesions as “nevus” or “non-melanocytic nevus”.
3. Expert arbitration: discrepant evaluations were reviewed by a third senior specialist (associate chief physician or above). Images unresolved by arbitration were excluded.
4. Quality control: retained images met strict criteria: clear focus, uniform illumination, and no significant artifacts.
Through this workflow, the study constructed a main dataset of 2,040 fully benign melanocytic nevi, providing reliable imaging and labeling foundations for training the “high-confidence nevus identification → inverse melanoma exclusion” model.
3.2.2 External test set construction
To independently validate the inverse exclusion model’s reliability on malignant lesions, this study separately constructed an external test set containing exclusively early-stage melanomas.
Sample images from the external test set are shown in Figure 10.
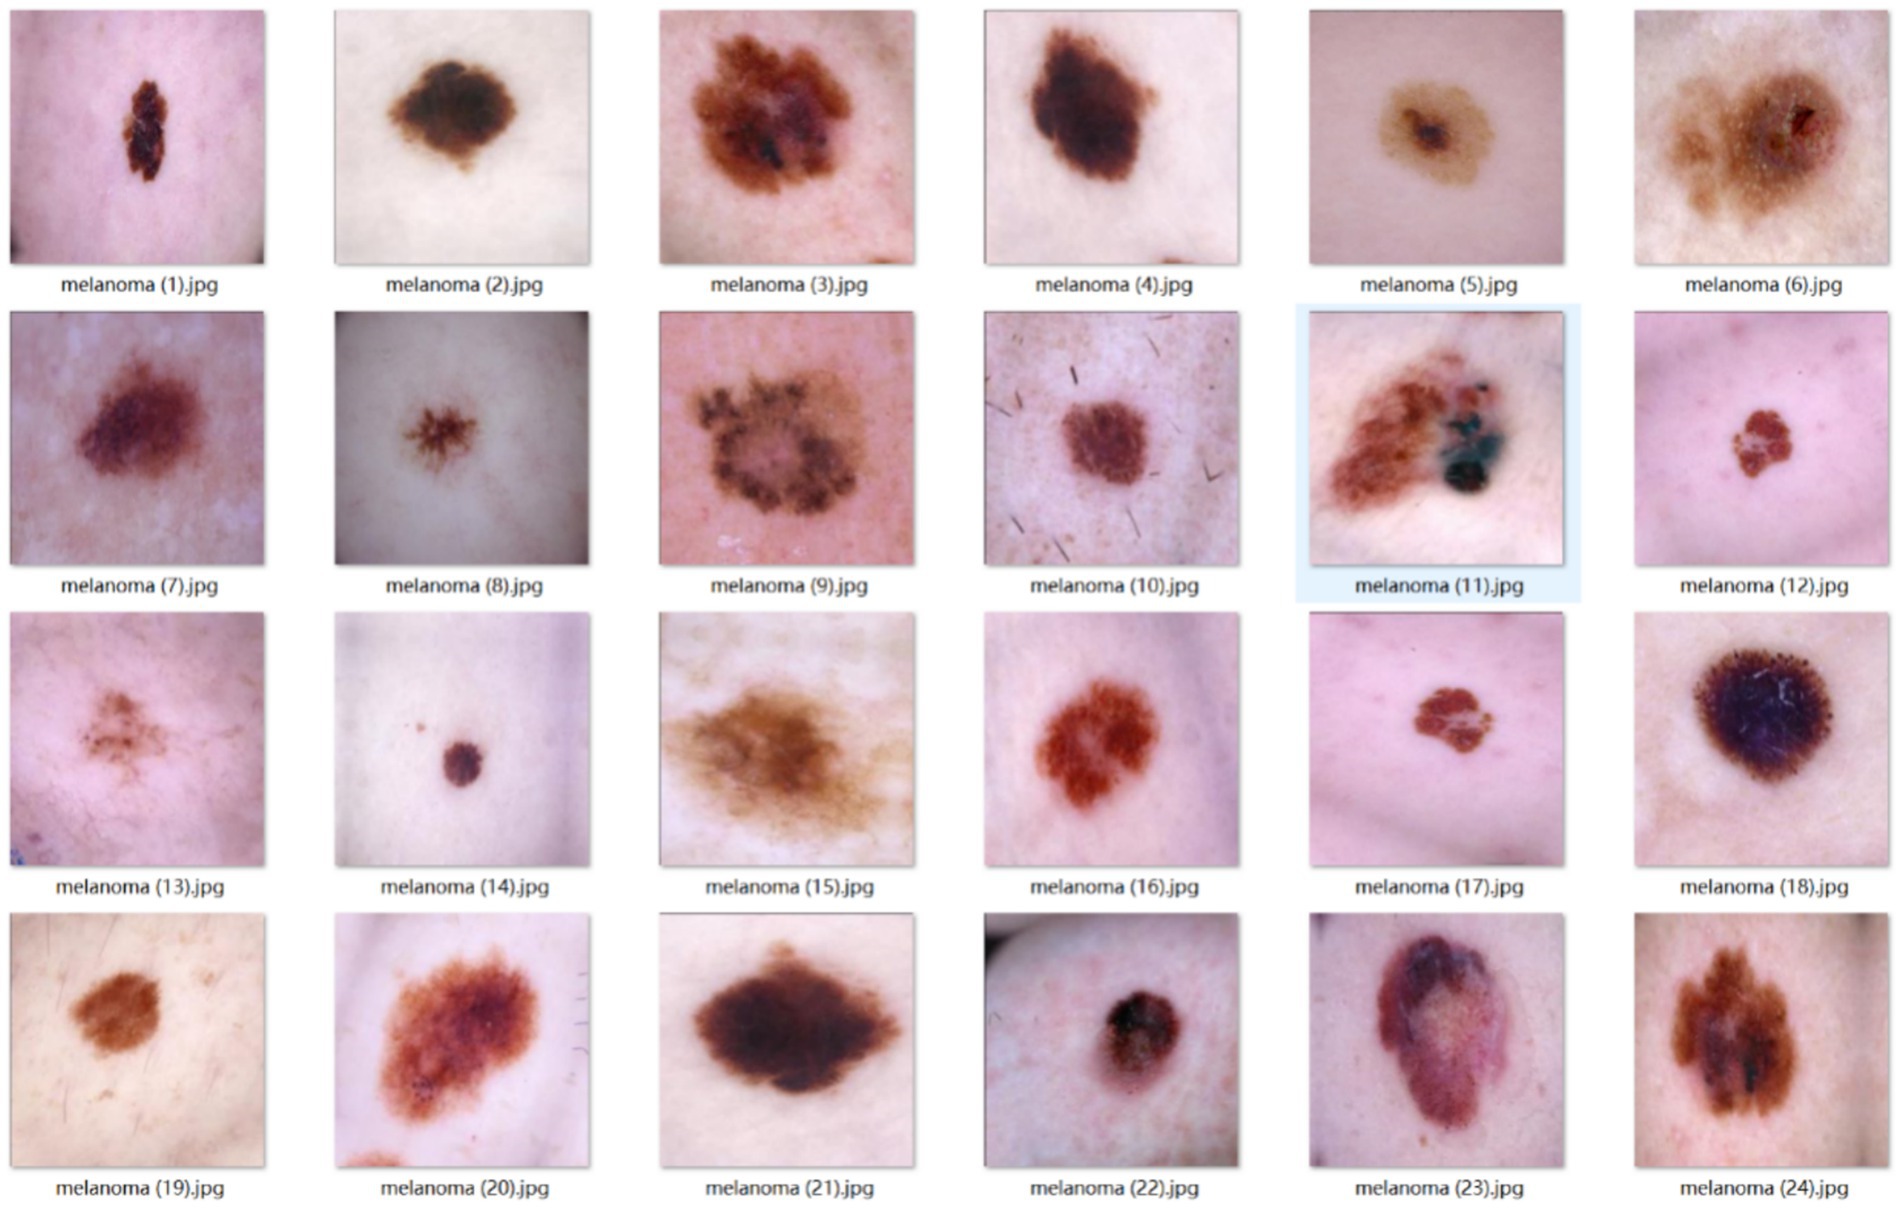
Figure 10. Early-stage melanoma dataset example images.
The dataset was collected and selected according to the following rationale:
First, all images originate from the same sources as the main benign-nevus dataset, ensuring identical imaging equipment, acquisition protocols, and time span. This eliminates cross-device bias and guarantees that malignant and benign images share the same temporal context.
Second, every case satisfies the pathological gold standard. Only images from lesions surgically excised or biopsied and definitively diagnosed as “melanoma” in the pathology report are included. Any image lacking biopsy confirmation or based solely on clinical judgment is excluded to avoid label-related evaluation bias.
Finally, all patient identifiers were removed. Every record was fully anonymized and renumbered in random order, ensuring strict data privacy.
After this screening, 365 dermoscopic images of biopsy-positive melanomas were compiled. They serve exclusively as an independent test set after model training and are not used in any training or hyper-parameter tuning. This design directly evaluates whether, within the inverse-exclusion workflow, the model can correctly classify every malignant lesion as “non-melanocytic nevus,” thereby verifying that the false-negative rate (FNR) meets the clinically acceptable threshold.
3.2.3 Participant skin phototype and hair-occlusion characteristics
All 2,405 dermoscopic images (2,040 benign nevi; 365 melanomas) were obtained from a Chinese East-Asian cohort. Two board-certified dermatologists independently assessed Fitzpatrick skin type, hair-occlusion grade, and anatomical site under double-blind conditions; disagreements were adjudicated by a third expert (Cohen’s κ = 0.92). Hair interference was first screened with the DullRazor algorithm and then manually reviewed. Only images meeting UQI > 0.95 and NIQE < 5.0 were retained. Table 2 summarises the dataset.
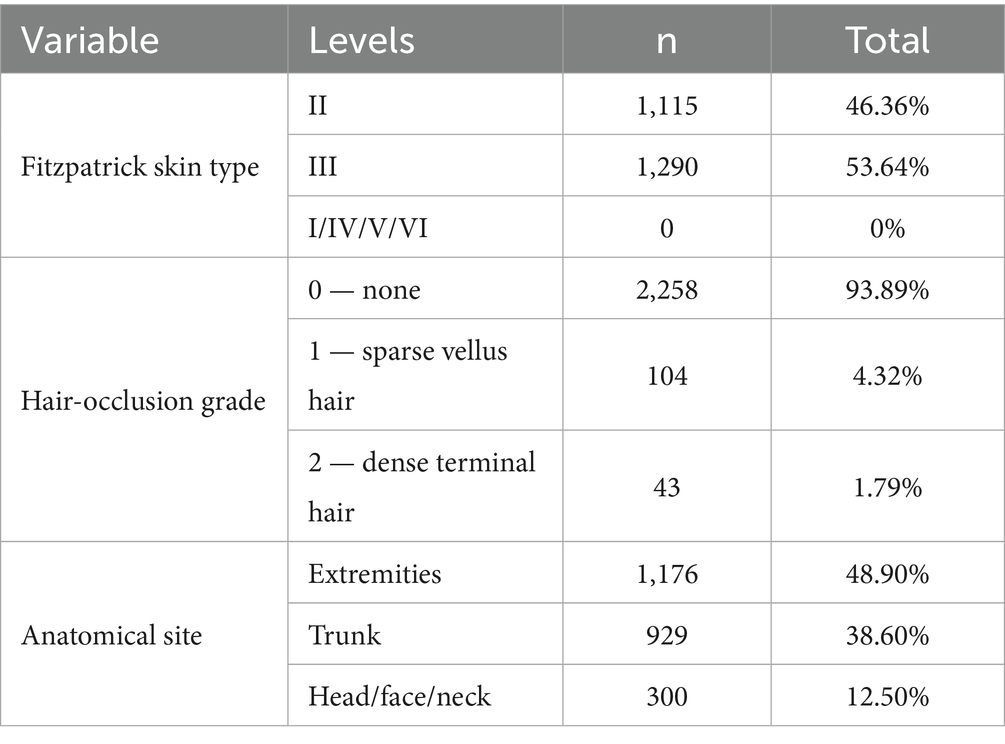
Table 2. Population characteristics of the dermoscopic dataset.
Skin phototypes are concentrated in Fitzpatrick types II–III. Total hair occlusion accounts for only 6.11%, with dense terminal hair representing less than 1.79%, suggesting negligible interference with image quality or feature extraction. Although 17 anatomical sites are represented, the study targets the dermoscopic phenotype of early melanoma; site information was recorded solely to ensure balanced sampling. Owing to the ethnic homogeneity, narrow skin-type range, minimal hair interference, and uniform site distribution, additional stratification of the dataset was not required. However, this uniformity implies that the dataset—and any models trained on it—are presently applicable only to East-Asian populations with Fitzpatrick II–III skin types; external validation across diverse skin tones and ethnic backgrounds will be essential before broader clinical deployment.
3.3 Experimental design and environment configuration
This chapter assesses the enhanced model (YOLOv10 + PP-LCNet + MCA + Shape-IoU) with ablation and comparative experiments: individual modules are removed sequentially to gauge their standalone impact, after which the complete model is benchmarked against the baseline to confirm aggregate gains. Each experiment alters only one module and is executed under identical hardware, software, and hyper-parameter settings to guarantee trustworthy conclusions.
3.3.1 Definition of evaluation metrics
This section evaluates model performance with a unified threshold and multiple metrics. A detection is labeled positive when its confidence is ≥ 0.5; it counts as a true positive (TP) only if the predicted box has IoU ≥ 0.5 with the ground-truth box and the class is correct, otherwise it is a mis-detection. The primary metric is mAP@0.5, supplemented by mAP@0.95, precision, recall, model size (Wsz, MB), and inference Latency (ms). Here, mAP@0.5 is the mean of class-wise average precision (AP) at IoU = 0.5, while mAP@0.95 is the mean AP computed from IoU 0.50 to 0.95 in 0.05 steps, reflecting bounding-box localization accuracy (Song and Wang, 2025). The 0.5 confidence threshold balances higher precision with adequate recall, providing a comprehensive measure of melanocytic-nevus detection performance.
3.3.2 Experimental environment configuration and training process
A single high-performance GPU server was used for hardware infrastructure, with computational and storage resources meeting the requirements for 640 × 640 pixel input at batch size 64 (Table 3).

Table 3. Experimental hardware configuration.
The software stack was standardized on Ubuntu 20.04 + Python 3.9 + CUDA 10.1 + PyTorch 1.10.1. Core dependencies are listed in Table 4.
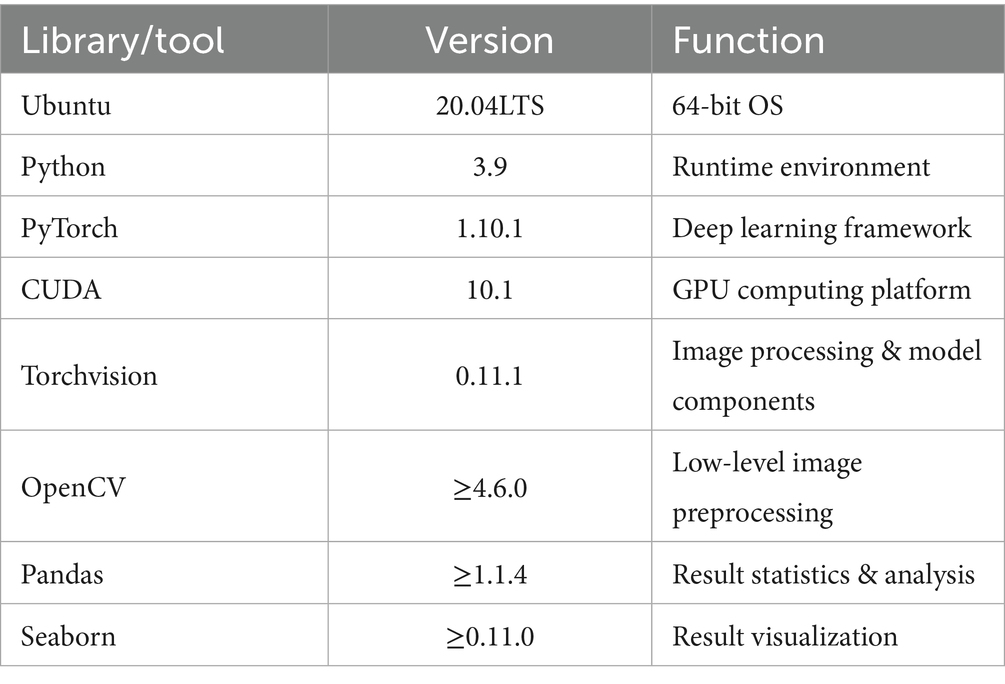
Table 4. Core software and library versions.
All ablation and comparative models adhered to the unified hyperparameter baseline in Table 5, ensuring performance variations originated solely from network architecture differences.
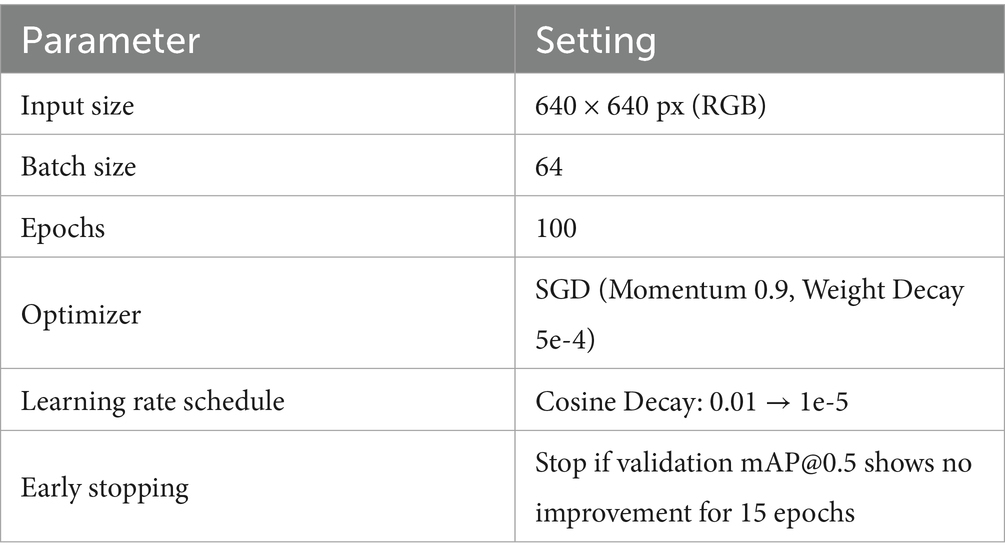
Table 5. Training parameter baseline.
The complete training and evaluation process is as follows:
(1) Data preparation
The main dataset (2,040 nevus images) was split into training (1,836) and validation (204) sets at a 9:1 ratio by patient ID.
Pixel values were normalized to [0, 1], followed by channel-wise standardization using ImageNet mean (0.485, 0.456, 0.406) and standard deviation (0.229, 0.224, 0.225) (Krizhevsky et al., 2017).
(2) Online data augmentation
Training-phase augmentations included geometric, photometric, noise, and occlusion categories, as shown in Table 6.
(3) Training process
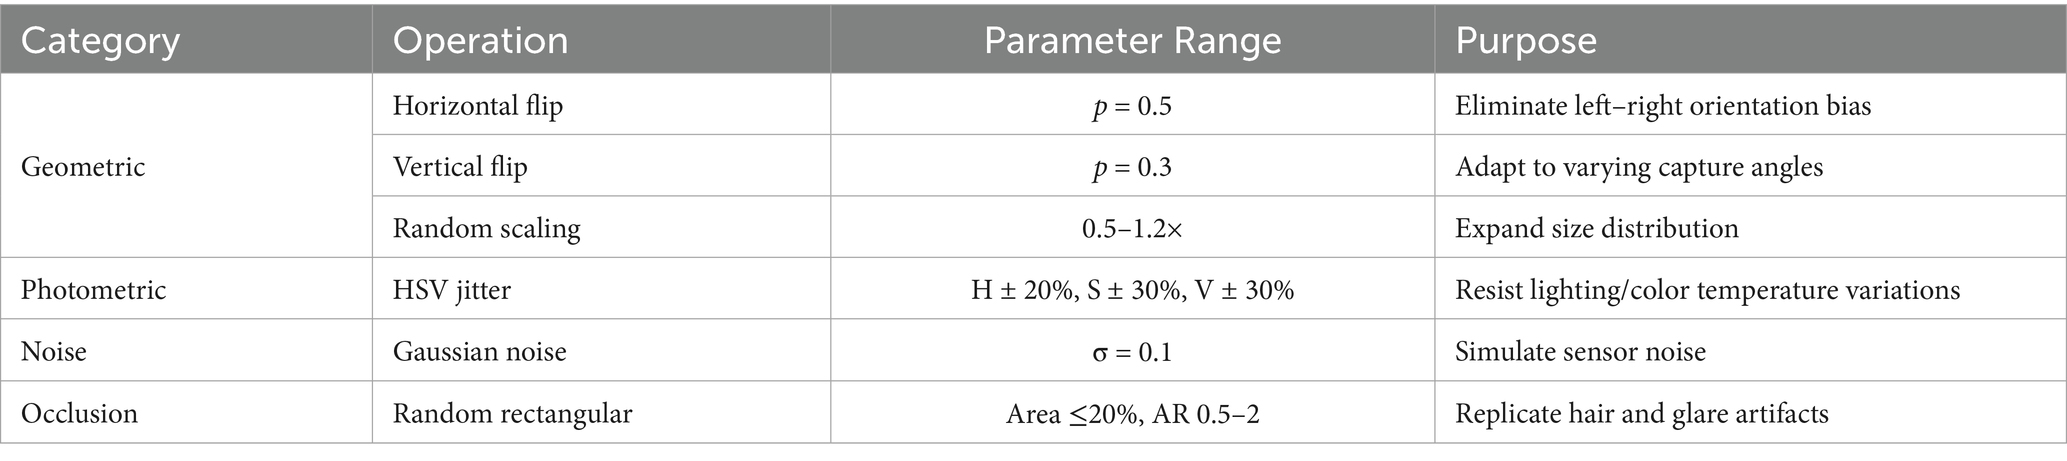
Table 6. Data augmentation method.
Models were trained for 100 epochs using hyperparameters from Table 5.
Validation set mAP@0.5 was evaluated every 5 epochs; training halted early if no improvement occurred over 15 epochs.
(5) Inference and evaluation
Images underwent standardization and aspect-ratio-preserving padding without random perturbations.
A unified confidence threshold of 0.5 was applied; YOLO series disabled NMS to maintain end-to-end properties, while SSD retained default NMS.
The checkpoint with highest validation mAP@0.5 was selected as the final model for Chapter 6 results reporting.
This workflow ensured full alignment across hardware, software, data augmentation, and hyperparameters, establishing a strict and reproducible experimental baseline for subsequent ablation and comparative studies.
3.3.3 Ablation experiment design
To isolate the independent contributions of the PP-LCNet backbone, MCA attention mechanism, and Shape-IoU loss function to model performance, five ablation experiments were designed by incrementally integrating improvement modules.
Table 7 presents the model combination schemes for the ablation study, where only a single module is introduced at a time to isolate its impact.
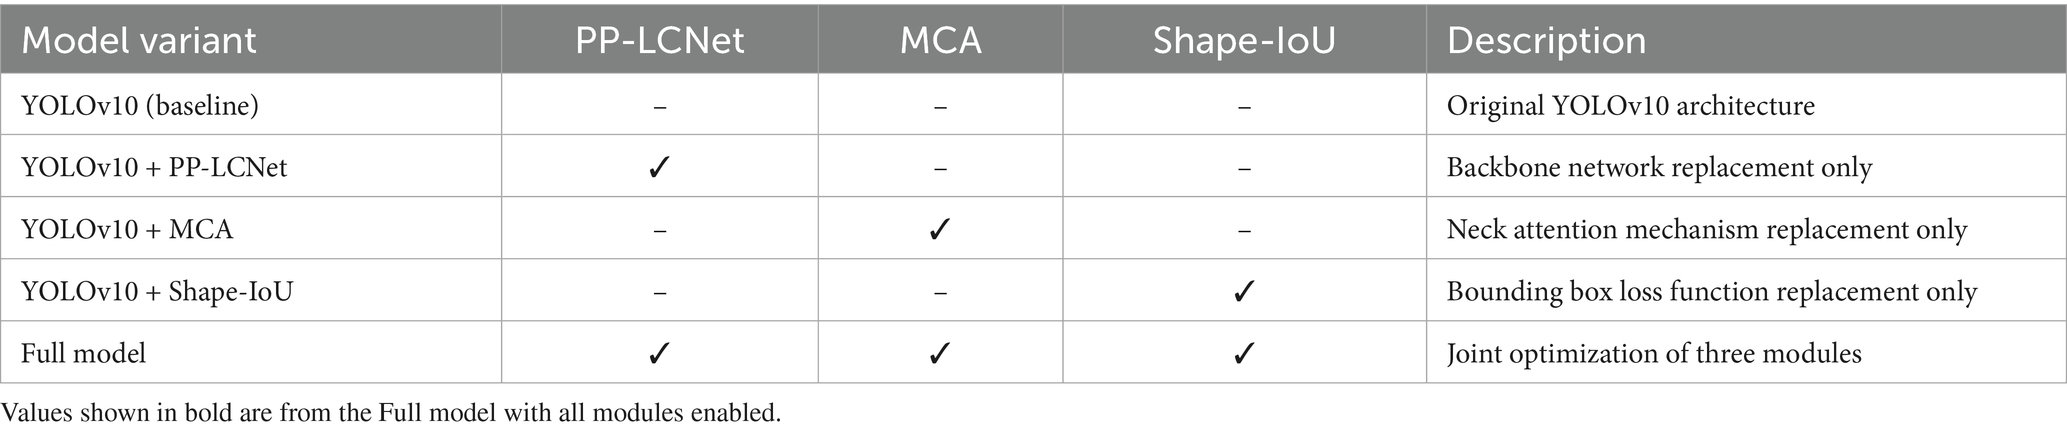
Table 7. Ablation experiment module configuration.
The ablation experiments followed these design principles:
1. Variable isolation: only one improvement module was introduced per experiment to prevent multivariate coupling and attribution ambiguity;
2. Data partitioning: complete separation between training and validation sets to eliminate data leakage risks;
3. Hyperparameter freezing: learning rate, batch size, and other parameters strictly aligned with baseline models, with modifications limited to target modules.
3.3.4 Comparative experiment design
To validate the competitiveness of the improved model against existing object detection methods, six mainstream detection models were selected as baseline comparisons.
Table 8 lists the models and configurations used in comparative experiments.
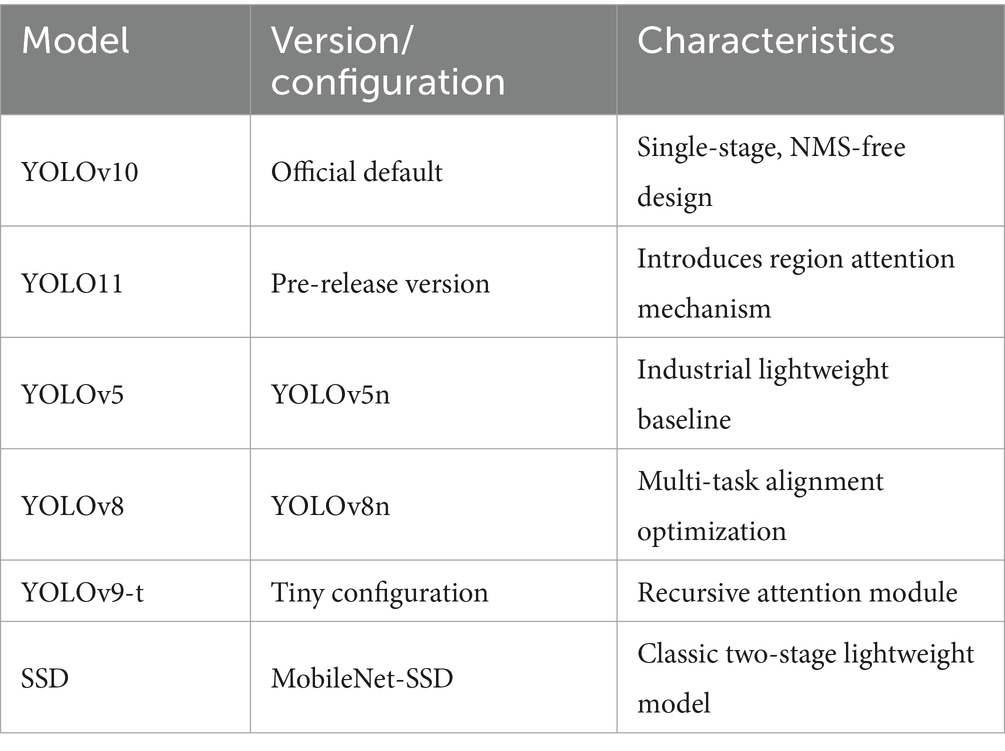
Table 8. Ablation experiment module configuration.
To validate the universality of the proposed improvements, the comparative experiments encompass both longitudinal iterations within the YOLO series and cross-paradigm evaluations with two-stage frameworks. The YOLO family—including YOLOv5 with lightweight CSPNet (Do, 2021), YOLOv8 with task-aligned dynamic assigners (Sohan et al., 2024), YOLOv9-t with recursive gated convolution for feature reuse (Wang C. Y. et al., 2024), and YOLO11 with spatial-channel dual-dimensional dynamic modeling (Khanam and Hussain, 2024)—forms a generational sequence of single-stage detectors that directly parallels our multiscale contextual modeling strategy, establishing a methodological dialogue. SSD, as a representative two-stage detector, highlights the limitations of anchor-based mechanisms and NMS post-processing in heterogeneous lesion scenarios, where anchor presets may lead to matching errors (Liu et al., 2016), thus serving as a critical benchmark to assess the medical adaptability of anchor-free single-stage frameworks. All models were evaluated under strict patient-level data isolation, standardized input resolution (bilinear interpolation + zero-padding to preserve aspect ratios), and identical optimization settings, ensuring that outcome differences purely reflect algorithmic variations.
4 Results
4.1 Ablation experiments revealing module contributions
To comprehensively evaluate the specific contributions of each improved module to model performance, this study systematically analyzes performance differences between the YOLOv10 baseline model and its variants through ablation experiments.
Example detection results are shown in Figure 11.
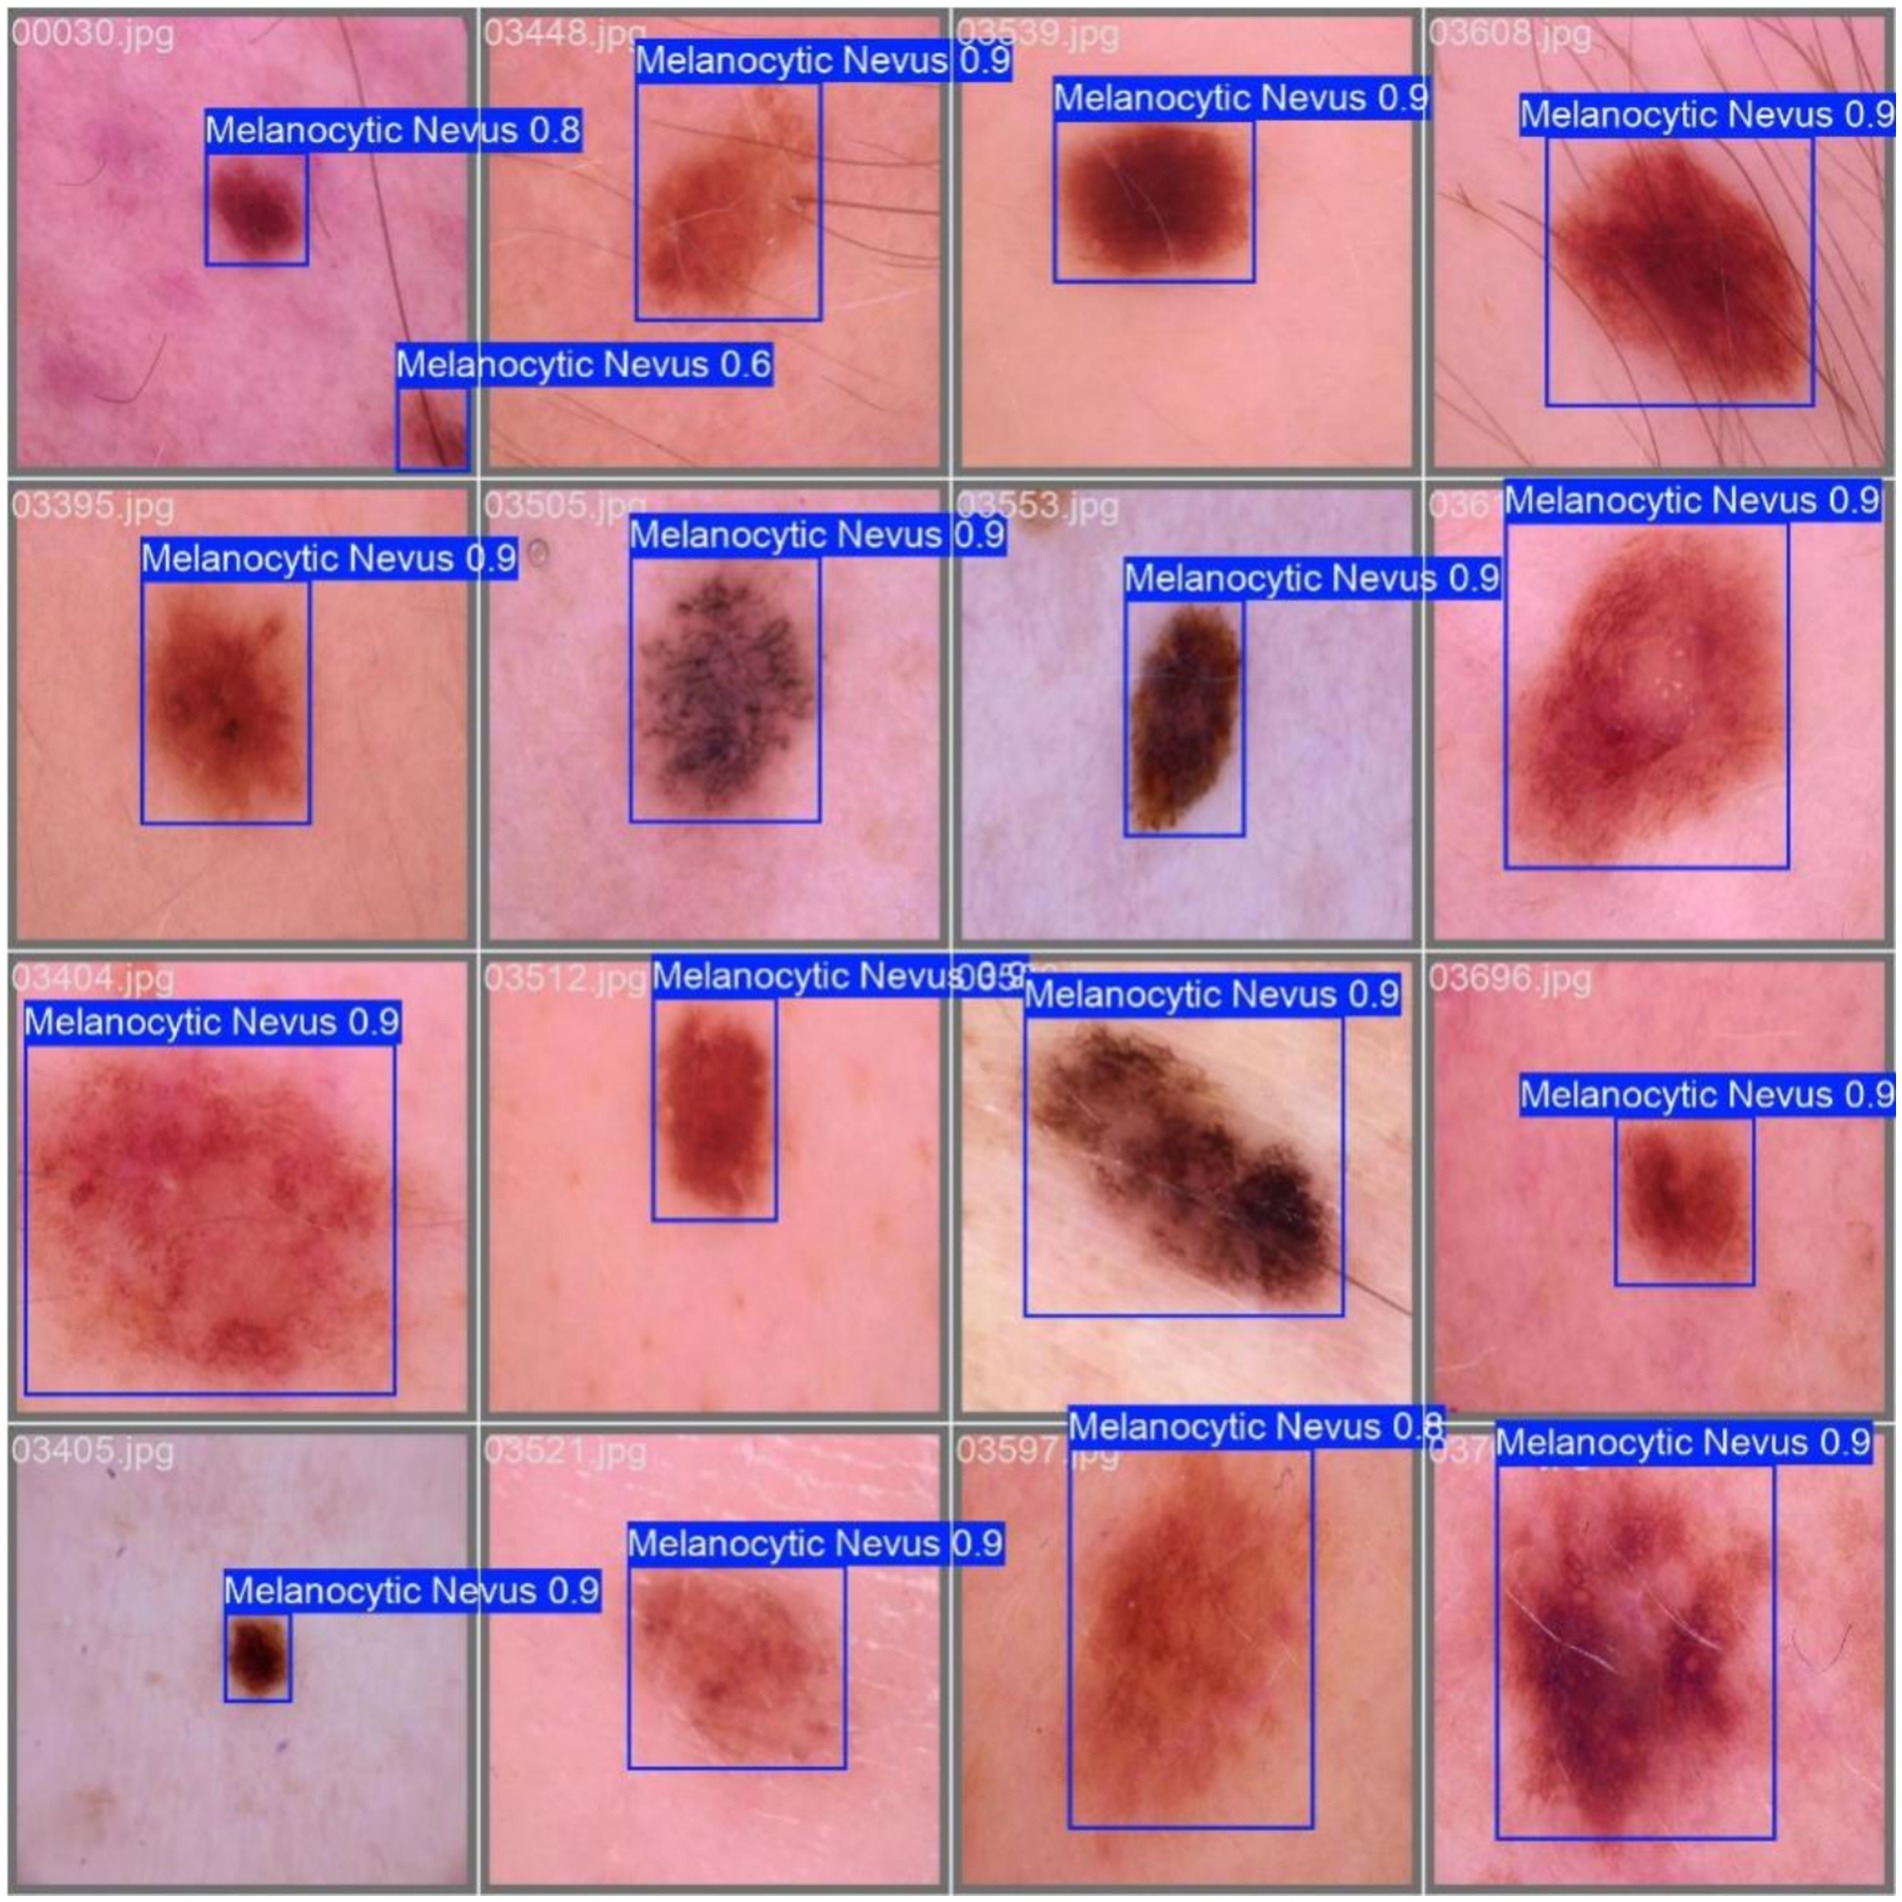
Figure 11. Example detection results.
Using mAP@0.5 (mean average precision at IoU threshold 0.5) as the core evaluation metric, supplemented by mAP@0.95, Precision (P), Recall (R), model size (Wsz, MB), and inference Latency (ms) we provide a holistic analysis of model performance.
Table 9 presents the performance results of all models.
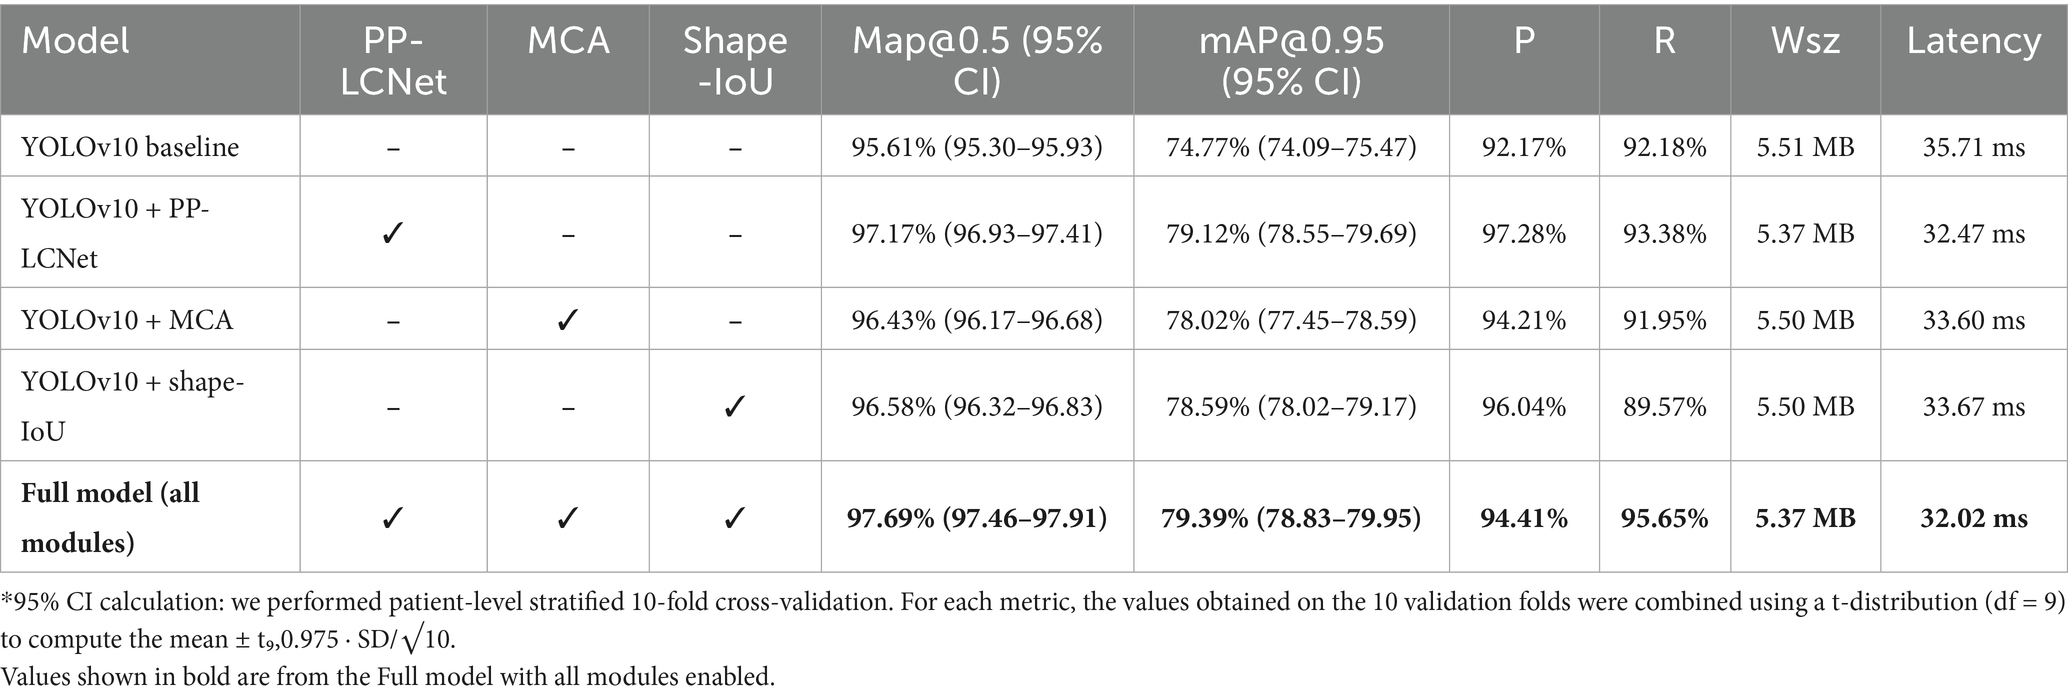
Table 9. Ablation experiment results.
Ablation experiments demonstrate that every module substantially boosts performance. Replacing the backbone with PP-LCNet raises mAP@0.5 from 95.61 to 97.17%, mAP@0.95 to 79.12%, and yields Precision/Recall of 97.28%/93.38%. Introducing the MCA module lifts mAP@0.5 to 96.43%, with Precision 94.21% and Recall 91.95%, proving especially effective for multi-scale targets. Adopting Shape-IoU increases mAP@0.5 and mAP@0.95 to 96.58% and 78.59%, respectively, with Precision 96.04%, evidencing markedly improved boundary fitting. When all three modules are combined, the model achieves an mAP@0.5 of 97.69%—a 2.08-percentage-point gain over the baseline—while mAP@0.95 reaches 79.39% and Precision/Recall balance at 94.41%/95.65%, validating the complementary benefits of PP-LCNet’s feature extraction, MCA’s multi-scale perception, and Shape-IoU’s shape-sensitive regression.
Across all variants the model footprint remains tightly bounded (5.37–5.51 MB), indicating that each module’s parameters are largely offset by PP-LCNet’s channel-sparsity and weight-sharing design. Crucially, inference latency stays below 35 ms on Jetson NX (≈ 29 FPS), with the full model even reaching 32.02 ms—the fastest of all ablation settings despite its highest accuracy. This “performance-for-free” profile means the complete configuration delivers the best trade-off for edge/mobile deployment: it meets real-time thresholds (> 25 FPS), fits comfortably within 8 MB flash budgets, and preserves thermal headroom for continuous operation. If power constraints tighten further, the PP-LCNet-only variant (32.47 ms) offers a graceful fallback with minimal accuracy sacrifice.
4.2 Comparative experiments validating model superiority
To validate the superiority of the proposed improved model over existing models, comparative experiments were designed, covering multiple classical object detection models including different versions of the YOLO series (YOLOv10, YOLOv11, YOLOv5, YOLOv8, YOLOv9-t) and the traditional SSD (Single Shot MultiBox Detector). The experimental results are shown in Table 10, where each comparative model is evaluated based on mAP@0.5, mAP@0.95, Precision, and Recall, with mAP@0.5 being the core evaluation metric.
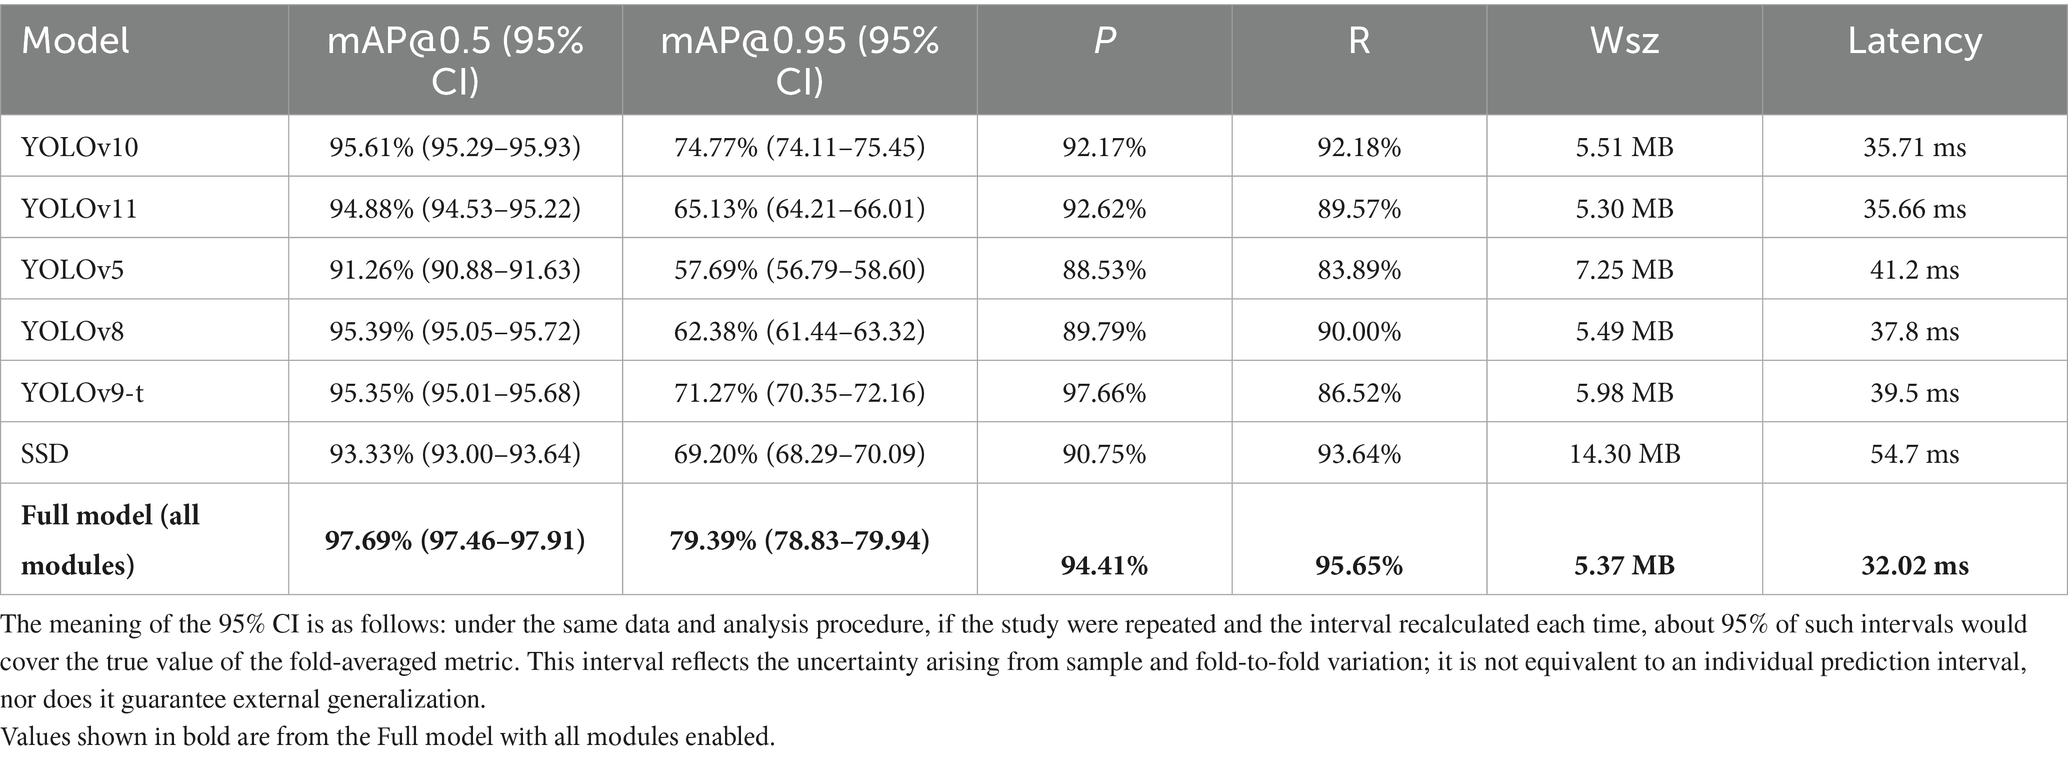
Table 10. Ablation experiment results.
Comparative results show that baseline YOLOv10 outperforms all other models in melanocytic nevus detection. For example, its mAP@0.5 is 0.73 percentage points higher than that of YOLOv11, with a better precision–recall balance. It exceeds YOLOv5 by 4.35% in mAP@0.5 and 17.08% in mAP@0.95, indicating a clear advantage on small-lesion detection. YOLOv10’s mAP@0.5 is 0.22% higher than YOLOv8’s, reflecting superior fine-grained feature extraction. Although YOLOv10’s precision (92.17%) is slightly below YOLOv9-t’s (97.66%), YOLOv10 achieves higher recall and mAP@0.5. Finally, YOLOv10’s mAP@0.5 is 2.28% higher than SSD’s, underscoring the benefits of an anchor-free framework.
At 5.37 MB in size and 32 ms latency (≈ 31 FPS), the full YOLOv10 variant is both the lightest and the fastest model tested. By contrast, the other models are either heavier (for example, SSD is 14 MB) or slower (YOLOv5 requires 41 ms per image), confirming YOLOv10’s suitability for real-time, on-device screening.
4.3 Model robustness analysis
Model robustness is crucial to ensure reliable high-precision performance in melanocytic nevus detection. Performance metrics are illustrated in Figure 12.
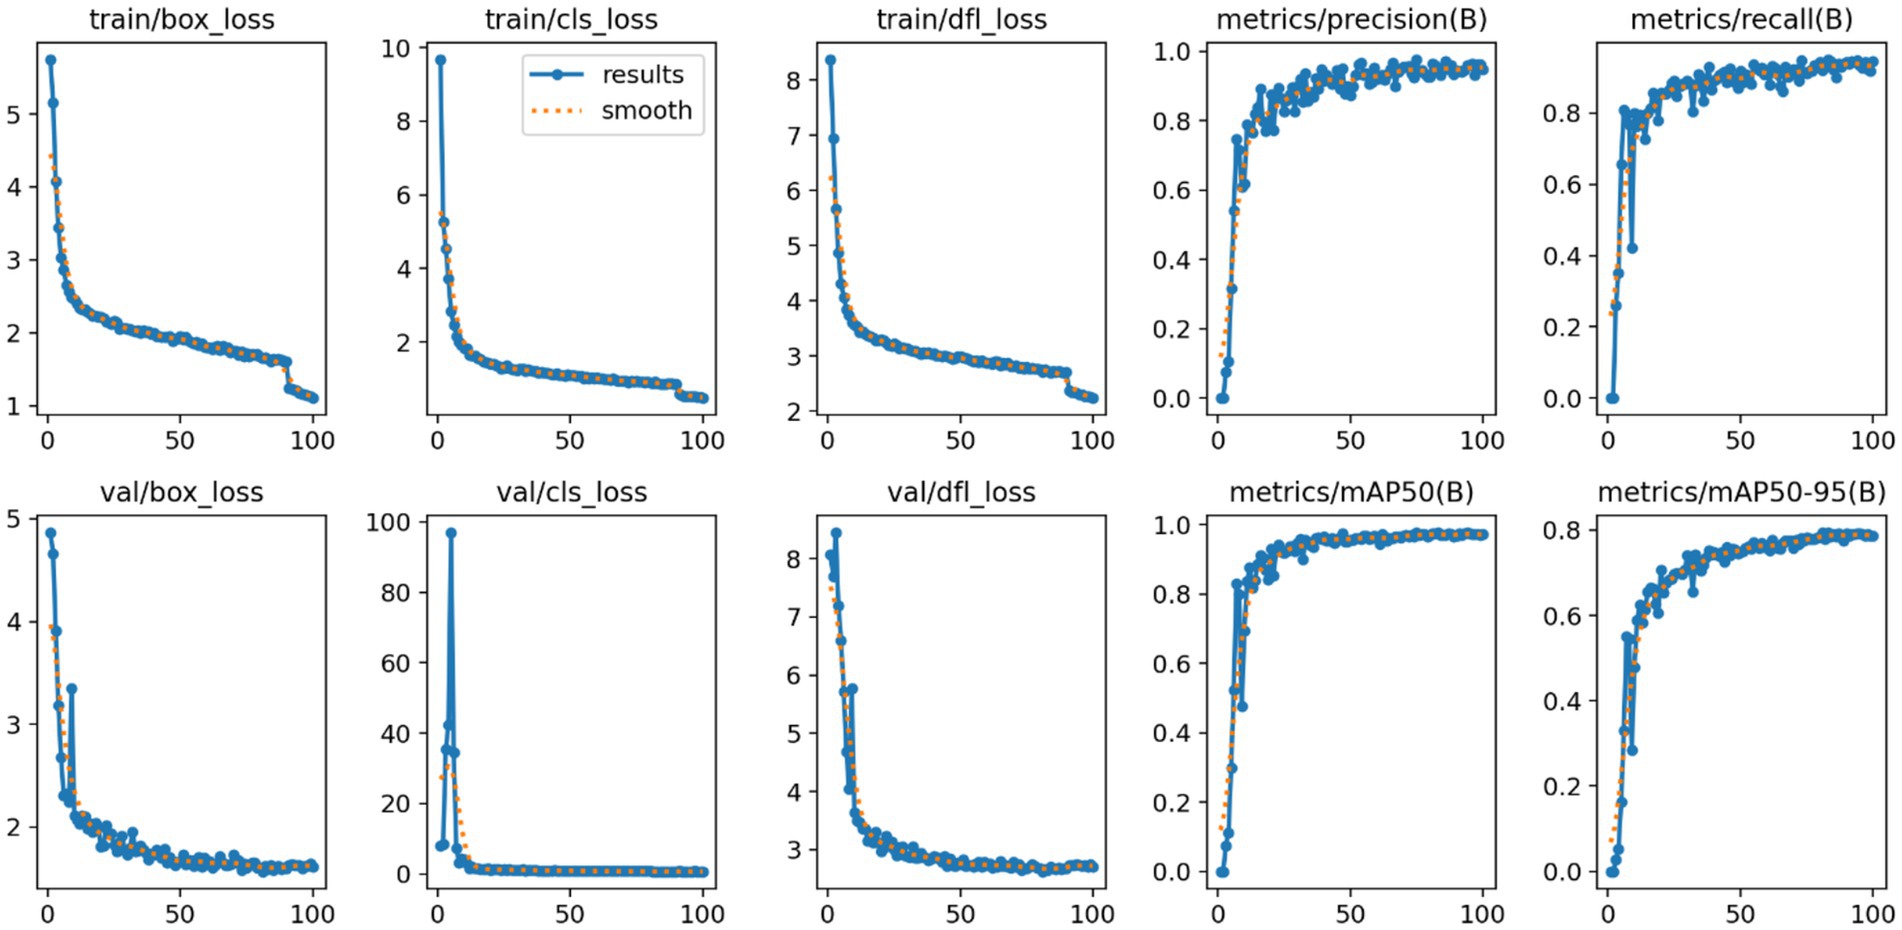
Figure 12. Trends of loss functions and detection performance metrics.
We analyzed the model’s loss function curves during training. As shown in Figure 12, the box_loss, cls_loss, and dfl_loss values dropped rapidly in the early epochs and then leveled off at low values. The validation-set loss curves showed a similar decline and closely mirrored the training-set curves, with only minimal differences. This indicates that no significant overfitting or underfitting occurred. Such rapid, stable convergence demonstrates the effectiveness of the model’s optimization process.
Trends in the Precision and Recall metrics further demonstrate the model’s robustness. As shown in Figure 12, Precision rose quickly in the initial training stages and then stabilized above 0.95 with very little fluctuation. Similarly, Recall improved rapidly and plateaued at a level above 0.90. The fact that both metrics remained consistently high indicates that the model effectively detects most melanocytic nevi (high recall) while rarely misclassifying benign lesions as malignant (high precision). These outcomes verify the model’s stable performance and reliability in practical use.
Additionally, the mean Average Precision metrics (mAP@0.5 and mAP@0.5–0.95) showed a similarly stable pattern. As illustrated in Figure 12, mAP@0.5 climbed quickly at the start and then reached a high plateau at roughly 0.98 with minimal fluctuation. The stricter mAP@0.5–0.95 metric also rose steadily and eventually leveled off around 0.80. These observations confirm that the model maintains high localization accuracy even under more stringent IoU thresholds, reinforcing its overall robustness and precise boundary fitting capability.
In summary, the loss curves and evaluation metrics highlight the model’s robust, high-level performance in detecting melanocytic nevi. This stable and reliable performance provides a critical technical foundation for implementing the reverse-exclusion melanoma strategy in clinical practice.
5 Clinical reverse exclusion validation
This chapter aims to validate the effectiveness and reliability of the reverse exclusion strategy-based model in melanoma screening.
5.1 Research objective and logical premise
This chapter evaluates the clinical safety of the proposed “melanocytic nevus recognition + reverse exclusion” strategy. Since the model exclusively identifies the benign feature “melanocytic nevus,” the screening logic follows:
If the model classifies a case as “melanocytic nevus,” it is deemed “low-risk” and biopsy is not recommended.
Otherwise, the case is categorized as “non-nevus” and classified as high-risk, requiring further intervention.
Under this framework, the definition of false negative (FN) is inverted: “misidentifying melanoma as melanocytic nevus” (erroneously classifying malignant as benign), which carries significant clinical risks.
Therefore, false negative rate (FNR) serves as the core evaluation metric to determine whether this reverse exclusion strategy meets sufficient safety criteria (i.e., FNR ≤ 0.5%).
5.2 Model detection process
The experiment utilizes the independent external test set constructed in Chapter 4, comprising 365 dermoscopic images of melanoma confirmed by biopsy, with no melanocytic nevi or other benign lesions, ensuring unambiguous classification.
All images undergo standardized normalization and are processed through the improved model for inference. The model exclusively detects the “melanocytic nevus” category:
Detection bounding boxes indicate “melanocytic nevus” classification.
Absence of bounding boxes indicates “non-melanocytic nevus” classification.
5.3 Research objective and logical premise
According to the clinical inverse exclusion definition, the false negative rate (FNR) is calculated as Equation 8 (Bossuyt et al., 2003):
where, FN (false negative): misclassifying melanoma as melanocytic nevus (i.e., labeling malignancy as benign); TP (true positive): correctly classifying melanoma as “non-melanocytic nevus” (i.e., identifying high-risk lesions).
5.4 Experimental results
Among the 365 melanoma samples, the model failed to detect melanocytic nevus in 364 cases (TN), while misclassifying 1 case as nevus (FN) with a detection confidence of 0.5. The misclassified sample is shown in Figure 13
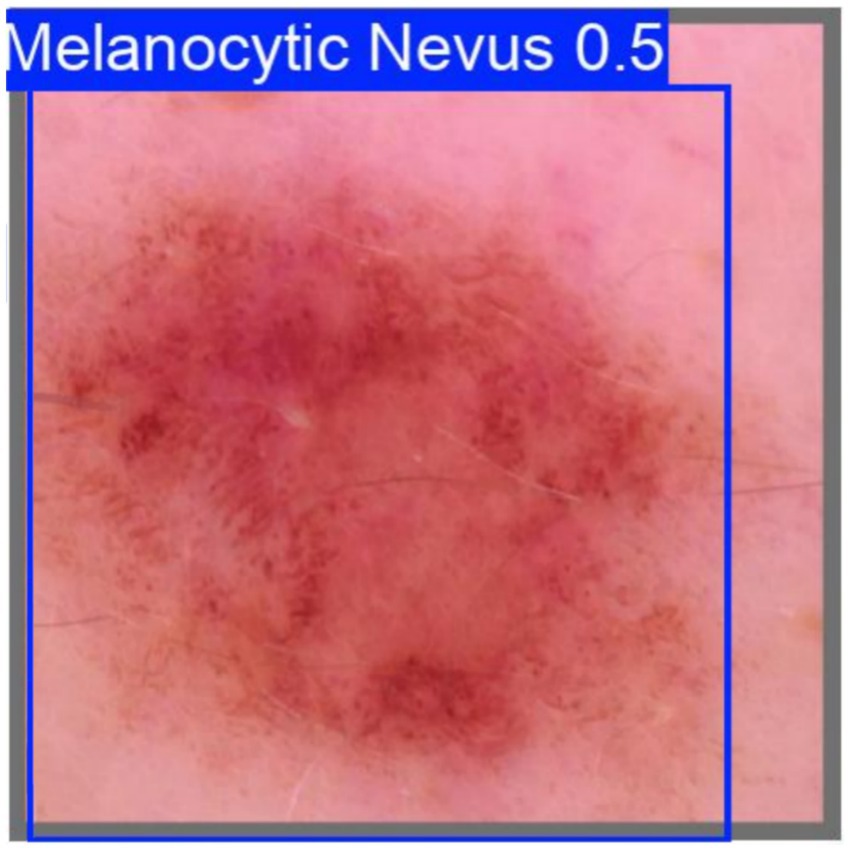
Figure 13. Misclassified sample.
Table 11 shows the test statistics.
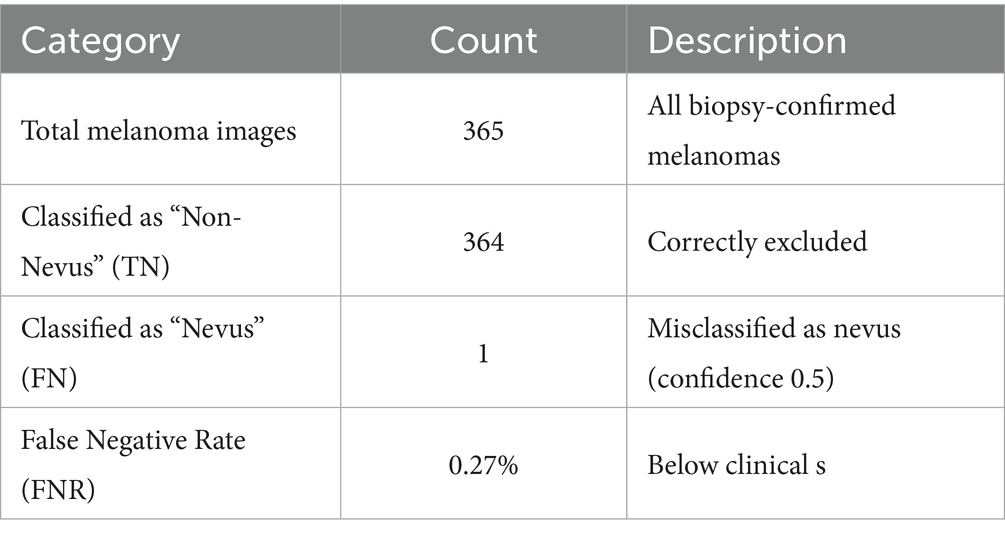
Table 11. Inverse detection statistics on melanoma dataset.
5.5 Morphological analysis of the misclassified lesion
The dermoscopic image mislabelled by the network as a benign melanocytic naevus exhibits several geometric and topological hallmarks of early melanoma that escape the current model.
The binary mask was thinned using the Zhang–Suen algorithm, and the resulting skeleton (lime) is super-imposed on the dermoscopic image (see Figure 14). High branch density and numerous terminal nodes indicate irregular peripheral outgrowth and suggest satellite invasion beyond the main tumour mass.
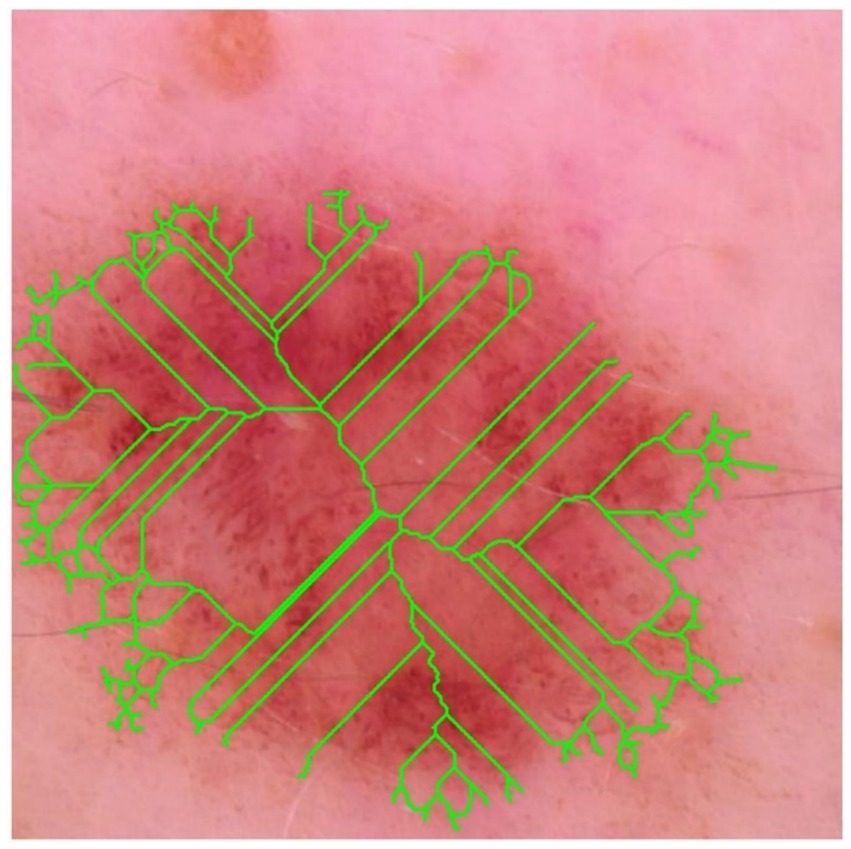
Figure 14. Skeleton overlay.
The scale-resolved spectrum in Figure 15 refines this observation: between 16 px and 64 px the local fractal dimension stays in the 1.92–1.95 range, while beyond 128 px it abruptly approaches 2.0. These twin plateaux indicate the coexistence of coarse lobular bulges and fine spiculate structures, an architectural pattern frequently reported in early invasive melanoma.
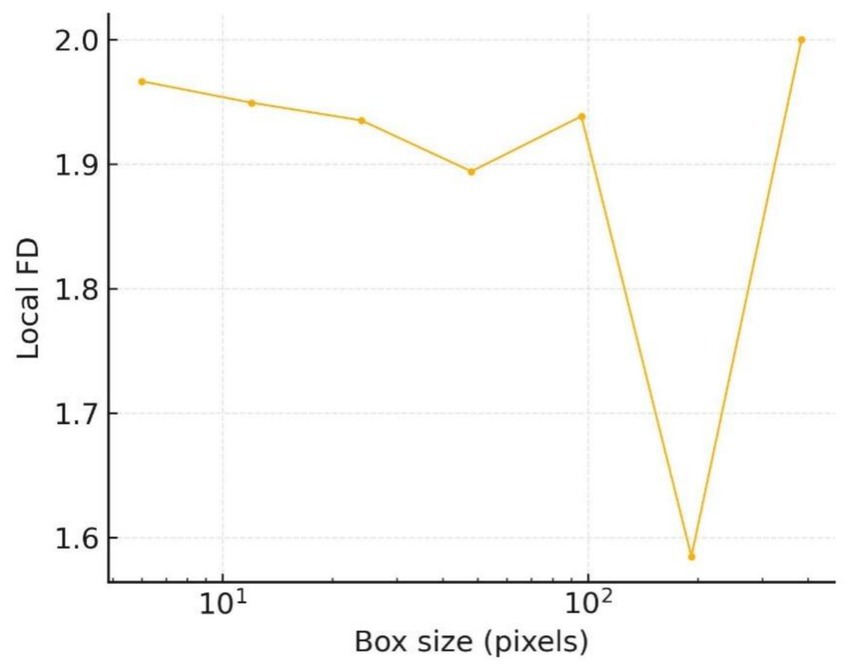
Figure 15. Local FD spectrum.
Shape frequency analysis supports this conclusion. The elliptic Fourier magnitude spectrum in Figure 16 decays only slowly up to the 20th harmonic; every component above the third harmonic exceeds 10−2, whereas benign contours typically fall one to two orders of magnitude below that threshold. The preserved high-frequency power confirms the abundance of micro-indentations already visible in the raw outline.
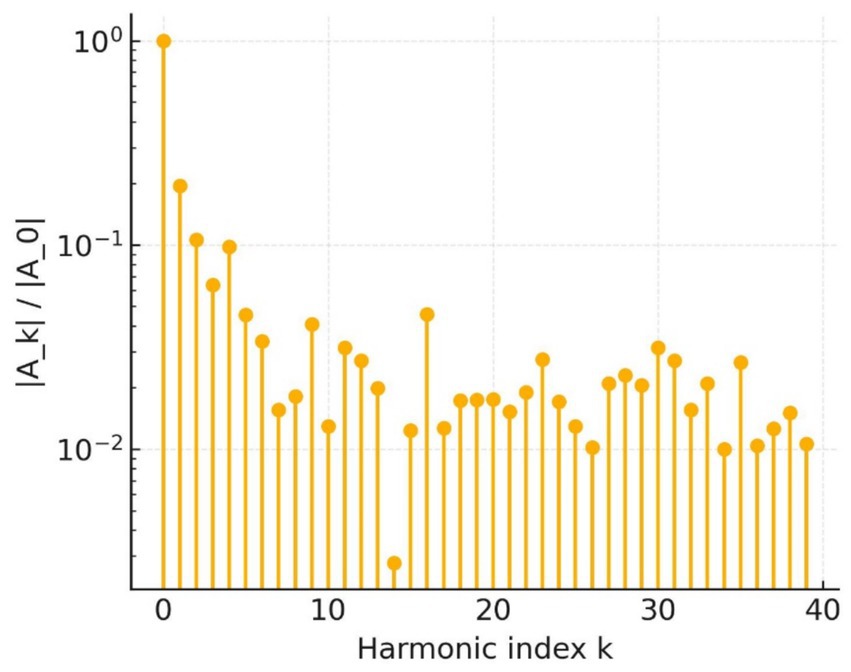
Figure 16. EFD magnitude.
Geometric symmetry is equally compromised. The polar radial-distance trace (Figure 17) oscillates by roughly 32% of the mean radius, with pronounced peaks along the 60°–120° and 240°–300° directions.
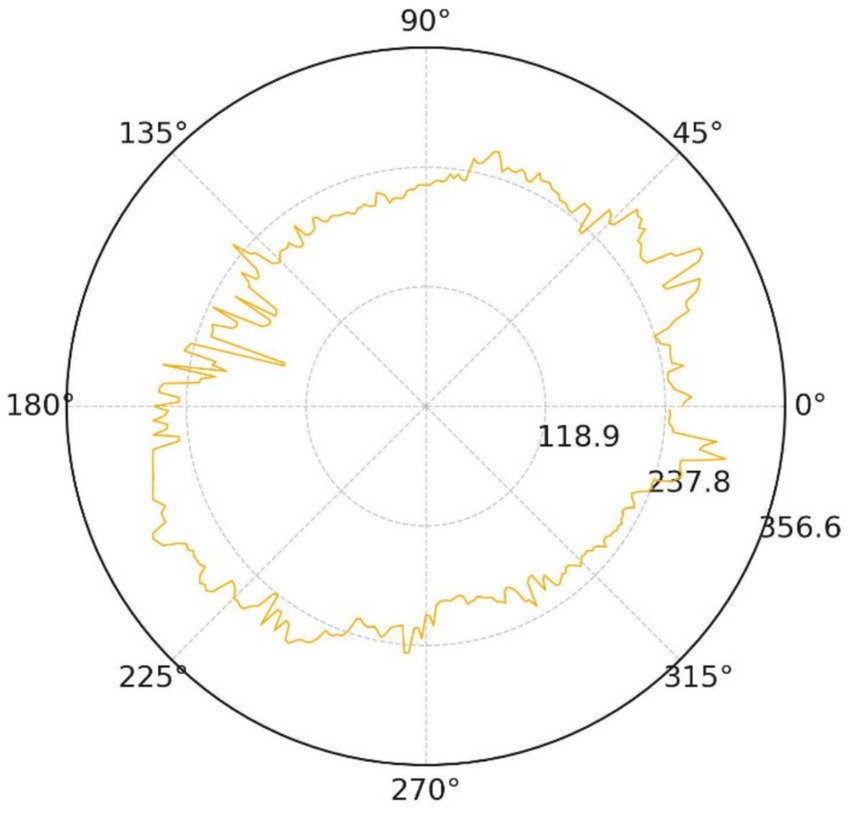
Figure 17. Radial distance profile.
The normalised deviation histogram in Figure 18 is clearly bimodal: about 41% of boundary pixels deviate from the mean radius by more than 10%, whereas benign controls rarely exceed 15%. These measurements satisfy the asymmetry clause of the ABCDE rule and reinforce the malignant impression.
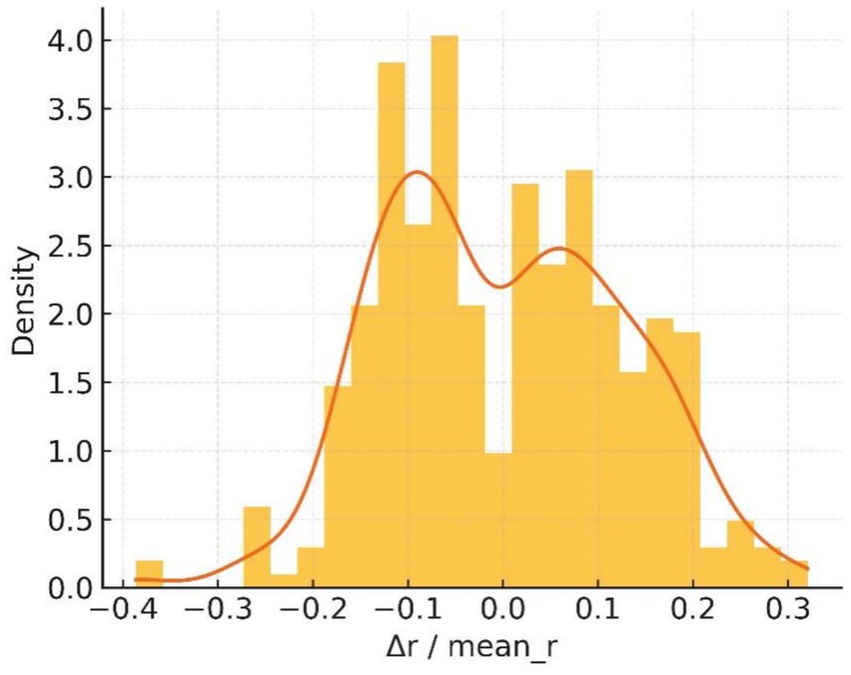
Figure 18. Δr/r̄ histogram.
Taken together, the five quantitative views demonstrate excessive boundary complexity, multiscale serration and pronounced bilateral asymmetry—three independent morphological signatures of melanoma. The convolutional network nevertheless produced a benign probability of 0.5, implying that its decision was dominated by homogeneous central pigmentation while largely ignoring higher-order geometric cues.
5.6 Benchmarking false-negative rate (FNR) against dermatologists using the ABCDE rule and 7-point checklist
In early melanoma screening, the clinical gold standard remains the visual assessment of experienced dermatologists, supported by two guideline-endorsed scoring systems—the ABCDE rule and the 7-point checklist. Demonstrating a clear performance advantage over these real-world decision benchmarks is essential for establishing the safety and utility of any AI model. Accordingly, this section benchmarks the enhanced YOLOv10 framework against dermatologists operating within these two scoring paradigms, focusing on the critical safety metric of false-negative rate (FNR).
To eliminate memory and ordering bias, three dermatologists with ≥10 years of experience independently interpreted the same set of 365 histopathology-confirmed melanoma images in a double-blind, two-round protocol. In the first round, only the ABCDE rule was applied; after a four-week washout period, the image order was re-randomized and the second round was conducted using only the 7-point checklist. Pathology results and model outputs were concealed from all readers. The comparative results are summarized in Table 12.
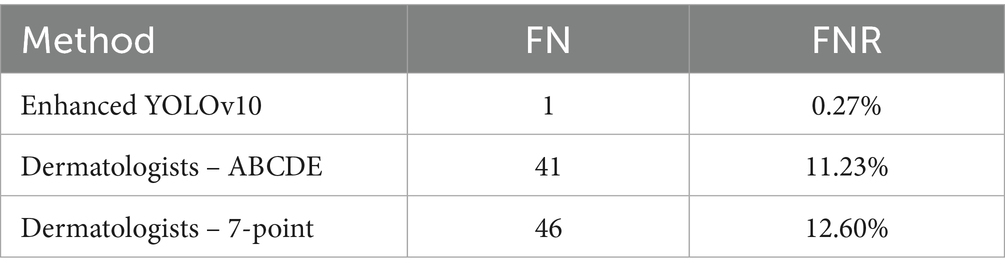
Table 12. False-negative counts and FNRs for model and dermatologist scoring systems.
The model missed only one melanoma among 365 cases, yielding an FNR roughly forty-fold lower than that of dermatologists using either conventional scoring system (McNemar p < 0.001). This marked reduction highlights the model’s superior diagnostic safety margin, particularly in minimizing false-negative outcomes in early melanoma screening.
6 Conclusion
This study addresses the persistent issue of missed melanoma diagnoses by proposing a novel “benign-first, reverse-exclusion” workflow. In this approach, the model first confidently identifies melanocytic nevi and then infers that melanoma is absent. Within the YOLOv10 framework, we introduced three specific upgrades: (i) a lightweight PP-LCNet backbone to combat the loss of fine (sub-3 mm) texture detail, (ii) a Multiscale Contextual Attention (MCA) module to improve cross-scale feature fusion, and (iii) a shape-aware Shape-IoU loss for more accurate boundary fitting.
On a multi-centre benign nevus dataset, the enhanced detector achieved mAP@0.5 of 97.69% and a precision of 0.94 with recall of 0.96. Most critically, on an independent cohort of 365 biopsy-proven melanomas, the false-negative rate (FNR) was only 0.27%, well below the clinically accepted 0.5% ceiling. In practical terms, out of 1,000 screened lesions the system would be expected to miss at most 3 melanomas — far fewer than conventional visual exams or generic AI tools — thereby preserving the life-saving window afforded by early detection.
Beyond accuracy, the model also meets two important clinical requirements: (1) an inference latency below 35 ms on edge devices, which enables real-time dermoscopy in clinics or mobile screening vans; and (2) a compact 5.4 MB model size, small enough for deployment on a smartphone — lowering the barrier to broad adoption in primary care settings.
The loss curves converged rapidly and smoothly, and the precision–recall and F1–confidence curves flattened into stable plateaus across a wide range of confidence thresholds. Together, these outcomes demonstrate that the detector maintains a low FNR and high accuracy under a variety of deployment conditions.
Three limitations remain. First, our training and test cohorts consisted exclusively of East-Asian patients with Fitzpatrick type II–III skin, so a multi-ethnic validation is essential before any global roll-out. Second, because our image archive was frozen as of 31 December 2024, only a small fraction of cases have reached the 5-year follow-up mark commonly used to assess melanoma recurrence. A prospective registry linking baseline dermoscopic images to outcomes ≥5 years is being established to quantify real-world reductions in unnecessary biopsies and to ensure long-term safety. Third, before large-scale clinical deployment, the system must meet emerging regulatory and ethical standards. Obtaining CE marking in Europe or FDA clearance in the US will depend on demonstrating robust performance, instituting post-market surveillance plans, and — critically — ensuring the model’s explainability. Although the reverse-exclusion logic is clinically intuitive, future work should integrate formal interpretability tools (for example, class-activation heatmaps or token-level attention visualizations) and produce regulatory-grade documentation to address algorithmic bias, cybersecurity, and data privacy compliance.
In conclusion, by anchoring an ultra-low FNR of 0.27% as its safety floor and tightly coupling deep-learning advances with the reverse-exclusion paradigm, the proposed detector offers a practical, efficient, and safe solution for early melanoma diagnosis and provides a foundation for wider AI-assisted skin-cancer screening.
Data availability statement
The raw data supporting the conclusions of this article will be made available by the authors, without undue reservation.
Ethics statement
The requirement of ethical approval was waived by Anhui Medical University Ethics Review Committee for the studies on humans because this study is a retrospective analysis of dermoscopic images obtained during routine clinical care that have been fully de-identified. No identifiable information is involved, and no interventions or contact with participants were carried out; therefore, formal ethics review was not required. The procedures complied with both institutional and national regulations governing secondary use of human biomedical data. The studies were conducted in accordance with the local legislation and institutional requirements. Written informed consent for participation was not required from the participants or the participants’ legal guardians/next of kin in accordance with the national legislation and institutional requirements. The human samples used in this study were acquired from a by-product of routine care or industry.
Author contributions
SW: Funding acquisition, Software, Writing – original draft, Formal analysis, Visualization, Conceptualization, Supervision, Methodology, Writing – review & editing. JW: Investigation, Writing – original draft, Resources, Funding acquisition, Writing – review & editing, Validation, Project administration, Supervision, Data curation. RY: Writing – original draft, Funding acquisition, Writing – review & editing, Resources, Project administration, Supervision, Validation, Data curation, Investigation.
Funding
The author(s) declare that no financial support was received for the research and/or publication of this article.
Conflict of interest
The authors declare that the research was conducted in the absence of any commercial or financial relationships that could be construed as a potential conflict of interest.
Generative AI statement
The author(s) declare that no Gen AI was used in the creation of this manuscript.
Any alternative text (alt text) provided alongside figures in this article has been generated by Frontiers with the support of artificial intelligence and reasonable efforts have been made to ensure accuracy, including review by the authors wherever possible. If you identify any issues, please contact us.
Publisher’s note
All claims expressed in this article are solely those of the authors and do not necessarily represent those of their affiliated organizations, or those of the publisher, the editors and the reviewers. Any product that may be evaluated in this article, or claim that may be made by its manufacturer, is not guaranteed or endorsed by the publisher.
References
Akash, N. R. J., Kaushik, A., and Sivaswamy, J., (2023). Evidence-driven differential diagnosis of malignant melanoma. In Proceedings of the ISIC workshop, 1–8.
Almubarak, H. A., Stanley, R. J., Stoecker, W. V., and Moss, R. H. (2017). Fuzzy color clustering for melanoma diagnosis in dermoscopy images. Information 8:89. doi: 10.3390/info8030089
Alzamili, A. H., and Ruhaiyem, N. I. R. (2025). A comprehensive review of deep learning and machine learning techniques for early-stage skin cancer detection: challenges and research gaps. J. Intell. Syst. 34:20240381. doi: 10.1515/jisys-2024-0381
Annadatha, S., Hua, Q., Fridberg, M., Lindstrøm Jensen, T., Liu, J., Kold, S., et al. (2022). Preparing infection detection technology for hospital-at-home after lower-limb external fixation. Digit. Health. 8:20552076221109502. doi: 10.1177/20552076221109502
Arumi-Uria, M., McNutt, N. S., and Finnerty, B. (2003). Grading of atypia in nevi: correlation with melanoma risk. Mod. Pathol. 16, 764–771. doi: 10.1097/01.MP.0000082394.91761.E5
Bossuyt, P. M., Reitsma, J. B., Bruns, D. E., Gatsonis, C. A., Glasziou, P. P., Irwig, L. M., et al. (2003). The STARD statement for reporting studies of diagnostic accuracy: explanation and elaboration. Ann. Intern. Med. 138, W1–W12. doi: 10.7326/0003-4819-138-1-200301070-00012-W1
Cai, D., Zhang, Z., and Zhang, Z. (2023). Corner-point and foreground-area IoU loss: better localization of small objects in bounding-box regression. Sensors 23:4961. doi: 10.3390/s23104961
Carrera, C., Segura, S., Aguilera, P., Scalvenzi, M., Longo, C., Barreiro, A., et al. (2017a). Dermoscopic clues for diagnosing melanomas that resemble seborrheic keratosis. JAMA Dermatol. 153, 544–551. doi: 10.1001/jamadermatol.2017.0129
Carrera, C., Segura, S., Aguilera, P., Takigami, C. M., Gomes, A., Barreiro, A., et al. (2017b). Dermoscopy improves the diagnostic accuracy of melanomas clinically resembling seborrheic keratosis: a cross-sectional study. Dermatology 233, 471–479. doi: 10.1159/000486851
Codella, N. C. F., Gutman, D., Celebi, M. E., Helba, B., Marchetti, M. A., Dusza, S. W., et al. (2017). Skin lesion analysis toward melanoma detection: a challenge at ISBI 2017 (ISIC). arXiv [Preprint]. doi: 10.48550/arXiv.1710.05006
Cui, C., Gao, T., Wei, S., Du, Y., Guo, R., Dong, S., et al. (2021). PP-lcnet: a lightweight CPU convolutional neural network. arXiv [Preprint]. doi: 10.48550/arXiv.2109.15099
Dinnes, J., Deeks, J. J., Chuchu, N., Ferrante di Ruffano, L., Matin, R. N., Thomson, D. R., et al. (2018). Dermoscopy, with and without visual inspection, for diagnosing melanoma in adults. Cochrane Database Syst. Rev. 12:CD011902. doi: 10.1002/14651858.CD011902.pub2
Do, T. (2021). Evolution of YOLO algorithm and YOLOv5: The state-of-the-art object detection algorithm. Oulu: Oulu University of Applied Sciences.
Esteva, A., Kuprel, B., Novoa, R., Novoa, R. A., Ko, J., Swetter, S. M., et al. (2017). Dermatologist-level classification of skin cancer with deep neural networks. Nature 542, 115–118. doi: 10.1038/nature21056
Ferris, L. K., and Harris, R. J. (2012). New diagnostic aides for melanoma. Dermatol. Clin. 30, 535–545. doi: 10.1016/j.det.2012.04.012
Fikrle, T., and Pizinger, K. (2007). Border sharpness of benign nevi in dermoscopic images. J. Eur. Acad. Dermatol. Venereol. 21, 48–55. doi: 10.1111/j.1468-3083.2006.01864.x
Flosdorf, C., Engelker, J., Keller, I., and Mohr, N. (2024). Skin Cancer detection utilizing deep learning: classification of skin lesion images using a vision transformer. arXiv. doi: 10.48550/arXiv.2407.18554
Flotte, T. J., and Lamberti, L. L. (1992). Symmetry features of melanocytic nevi. Mod. Pathol. 5, 333–336. doi: 10.1007/BF03000228
Henning, J. S., Dusza, S. W., Wang, S. Q., Marghoob, A. A., Rabinovitz, H. S., Polsky, D., et al. (2007). The CASH algorithm for dermoscopy. J. Am. Acad. Dermatol. 56, 45–52. doi: 10.1016/j.jaad.2006.09.003
Hunziker, M. F. V., Abdalla, B. M. Z., Brandão, F. V., Meneghello, L. P., Hunnicutt, J. M. S., di Giacomo, T. H. B., et al. (2023). Exploring small-diameter melanomas: a retrospective study on clinical and Dermoscopic features. Life 13:1907. doi: 10.3390/life13091907
Khanam, R., and Hussain, M. (2024). YOLOv11: an overview of the key architectural enhancements. arXiv :2410.17725. doi: 10.48550/arXiv.2410.17725
Krizhevsky, A., Sutskever, I., and Hinton, G. E. (2017). Imagenet classification with deep convolutional neural networks. Commun. ACM 60, 84–90. doi: 10.1145/3065386
Lallas, A., Apalla, Z., and Chaidemenos, G. (2012). New trends in dermoscopy to minimise the risk of missing melanoma. J. Skin Cancer 2012:820474. doi: 10.1155/2012/820474
Liu, W., Anguelov, D., Erhan, D., Szegedy, C., Reed, S., Fu, C.-Y., et al. (2016). “SSD: Single shot MultiBox detector,” in Computer Vision – ECCV. eds. B. Leibe, J. Matas, N. Sebe, and M. Welling (Cham: Springer), 21–37.
Liutkus, J., Kriukas, A., Stragyte, D., Mazeika, E., Raudonis, V., Galetzka, W., et al. (2023). Accuracy of a smartphone-based YOLO application for classification of melanomas, melanocytic nevi, and seborrheic keratoses. Diagnostics 13:2139. doi: 10.3390/diagnostics13132139
Naseri, H., and Safaei, A. A. (2025). Diagnosis and prognosis of melanoma from Dermoscopy images using machine learning and deep learning: a systematic literature review. BMC Cancer 25:75. doi: 10.1186/s12885-024-13423-y
Nguyen, E. H., Yang, H., Deng, R., Lu, Y., Zhu, Z., Roland, J. T., et al. (2022). Circle representation for medical object detection. IEEE Trans. Med. Imaging 41, 746–754. doi: 10.1109/TMI.2021.3122835
Rotemberg, V., Kurtansky, N., Betz-Stablein, B., Caffery, L., Chousakos, E., Codella, N., et al. (2021). A patient-centric dataset of images and metadata for identifying melanomas using clinical context. Sci Data 8:34. doi: 10.1038/s41597-021-00815-z
Seidenari, S., Pellacani, G., and Grana, C. (2005). Pigment distribution in melanocytic lesion images: a digital parameter to be employed for computer‐aided diagnosis. Skin Res Technol. 11, 236–241. doi: 10.1111/j.0909-725X.2005.00123.x
Shen, S., Xu, M., Zhang, F., Shao, P., Liu, H., Xu, L., et al. (2021). Low-cost and high-performance data augmentation for deep-learning-based skin lesion classification. arXiv [Preprint]. doi: 10.48550/arXiv.2101.02353
Sohan, M., Ram, S. T., and Reddy, V. R. C. V. (2024). “A review on YOLOv8 and its advancements,” in Data intelligence and cognitive informatics. eds. I. J. Jacob, S. Piramuthu, and P. Falkowski-Gilski (Singapore: Springer), 529–545.
Song, W., and Wang, S. Aortic aneurysm detection in CT medical images based on YOLOv5. Acad. J. Comput. Inf. Sci. (2025), 8, 56–63. Available online at: https://francis-press.com/papers/18603
Stell, V. H., Norton, H. J., Smith, K. S., Salo, J. C., and White Jr, R. L. (2007). Method of biopsy and incidence of positive margins in primary melanoma. Ann. Surg. Oncol. 14, 893–898. doi: 10.1245/s10434-006-9240-4
Stevenson, A. D., Mickan, S., Mallett, S., and Ayya, M. (2013). Systematic review of diagnostic accuracy of reflectance confocal microscopy for melanoma diagnosis in clinically equivocal lesions. Dermatol. Pract. Concept. 3, 19–27. doi: 10.5826/dpc.0304a05
Thomas, L., Tranchand, P., Berard, F., Secchi, T., Colin, C., and Moulin, G. (1998). Semiological value of ABCDE criteria in the diagnosis of cutaneous pigmented tumors. Dermatology 197, 11–17. doi: 10.1159/000017969
Tsao, H., Olazagasti, J. M., Cordoro, K. M., Brewer, J. D., Taylor, S. C., Bordeaux, J. S., et al. (2015). Early detection of melanoma: reviewing the ABCDEs. J. Am. Acad. Dermatol. 72, 717–723. doi: 10.1016/j.jaad.2014.01.887
Tschandl, P., Rinner, C., Apalla, Z., Argenziano, G., Codella, N., Halpern, A., et al. (2020). Human–computer collaboration for skin cancer recognition. Nat. Med. 26, 1229–1234. doi: 10.1038/s41591-020-0942-0
Van Loo, E., Sinx, K. A. E., Welzel, J., Schuh, S., Kelleners-Smeets, N. W. J., Mosterd, K., et al. (2020). Cumulative-sum analysis for the learning curve of optical coherence tomography-assisted diagnosis of basal cell carcinoma. Acta Derm. Venereol. 100:adv00343. doi: 10.2340/00015555-3696
Wang, A., Chen, H., Liu, L., Chen, K., Lin, Z., and Han, J. (2024). YOLOv10: real-time end-to-end object detection. arXiv [Preprint]. doi: 10.48550/arXiv.2405.14458
Wang, C. Y., Yeh, I. H., and Liao, H. Y. M. (2024). “YOLOv9: learning what you want to learn using programmable gradient information,” in Computer vision – ECCV 2024 ; LNCS 15089. eds. A. Leonardis, E. Ricci, S. Roth, O. Russakovsky, T. Sattler, and G. Varol (Cham: Springer), 1–21.
Whited, J. D., Hall, R. P., Simel, D. L., and Horner, R. D. (1997). Primary-care clinicians’ performance for detecting actinic keratoses and skin cancer. Arch. Intern. Med. 157, 985–990. doi: 10.1001/archinte.157.9.985
Ye, R., Shao, G., He, Y., Gao, Q., and Li, T. (2024). YOLOv8-RMDA: lightweight YOLOv8 network for early detection of small target diseases in tea. Sensors 24:2896. doi: 10.3390/s24092896
Yu, Y., Zhang, Y., Cheng, Z., Song, Z., and Tang, C. (2023). MCA: multidimensional collaborative attention in deep convolutional neural networks for image recognition. Eng. Appl. Artif. Intell. 126:107079. doi: 10.1016/j.engappai.2023.107079
Keywords: melanoma, melanocytic nevus, deep learning, YOLOv10, reverse exclusion
Citation: Wang S, Wang J and Yin R (2025) YOLOv10-based detection of melanocytic nevi: reverse exclusion optimization for melanoma screening. Front. Artif. Intell. 8:1637842. doi: 10.3389/frai.2025.1637842
Edited by:
Biswaranjan Acharya, Marwadi University, IndiaReviewed by:
Kevinn Eddy, Eurofins PSS, United StatesApostolos Xenakis, University of Thessaly, Greece
Majdi Sukkar, Marwadi University, India
Copyright © 2025 Wang, Wang and Yin. This is an open-access article distributed under the terms of the Creative Commons Attribution License (CC BY). The use, distribution or reproduction in other forums is permitted, provided the original author(s) and the copyright owner(s) are credited and that the original publication in this journal is cited, in accordance with accepted academic practice. No use, distribution or reproduction is permitted which does not comply with these terms.
*Correspondence: Jian Wang, YnN1d0Bmb3htYWlsLmNvbQ==