 OPhir Nave1,2*†
 Pnina Barasheshet3
- 1Department of Mathematics, Jerusalem College of Technology (Academic Lev Center), Jerusalem, Israel
- 2Department of Computer Science, The College of Management Academic Studies, Rishon LeZion, Israel
- 3Faculty of Medicine, Ben-Gurion University of the Negev, Be'er Sheva, Israel
Introduction: Granulosa cell tumors (GCTs) of the ovary are rare malignancies with limited systemic treatment options and high recurrence rates. Combining tumor necrosis factor-related apoptosis-inducing ligand (TRAIL)-producing oncolytic viruses with procaspase-3 activator (PAC-1) presents a promising therapeutic strategy, as TRAIL initiates apoptosis while PAC-1 amplifies caspase activity. However, patient responses remain variable, necessitating predictive frameworks that can integrate biological complexity with clinical data.
Methods: We developed a hybrid framework that integrates a mechanistic mathematical model of TRAIL-oncolytic virus and PAC-1 therapy with machine learning (ML) algorithms to predict tumor dynamics in GCTs. Four datasets (continuous and categorical tumor size measurements) were analyzed. Clinical and imaging data were merged with individualized solutions from the mathematical model to generate enriched feature sets for ML training. Linear regression and neural network models were trained and evaluated using accuracy, F1 scores, and root mean square error (RMSE).
Results: Integrating mathematical model outputs improved predictive performance across all datasets. Linear regression models showed reduced RMSE compared to models without mathematical features (e.g., RMSE decreased from 18.4 to 16.1 in one dataset). Neural networks incorporating model-derived variables achieved higher accuracy and F1 scores (e.g., accuracy improved from 77.3% to 91.4%). Sensitivity analysis revealed that tumor proliferation and apoptosis rates were the most influential parameters for treatment outcomes.
Discussion: Our results demonstrate that coupling mathematical modeling with ML enhances the prediction of tumor burden in patients undergoing TRAIL-oncolytic virus and PAC-1 therapy. This integrative approach provides mechanistic insight into tumor behavior while improving predictive accuracy, supporting the development of personalized therapeutic strategies for GCTs. The framework also offers broader applicability to other cancers with limited treatment options and heterogeneous responses.
1 Introduction
Granulosa cell tumors (GCTs) of the ovary constitute a rare subtype of ovarian neoplasms, accounting for approximately 2%–5% of all ovarian malignancies (Colombo et al., 2012). These tumors arise from sex cord-stromal tissue and are notable for their distinct biological behavior: they generally grow slowly yet retain a striking propensity for very late recurrence, even decades after apparently successful primary treatment (Van Meurs et al., 2014, 2013). For patients with early-stage disease, surgical resection remains the cornerstone of management. However, once recurrence or advanced disease develops, the clinical scenario becomes considerably more challenging. Unlike epithelial ovarian cancers, for which multiple systemic regimens are available, recurrent GCTs lack effective systemic treatment options. Platinum-based chemotherapy, often adapted from epithelial ovarian cancer protocols, has shown only limited and transient benefit (Van Meurs et al., 2013; Homesley et al., 1999; Bhat et al., 2024), while hormonal and radiotherapy approaches provide inconsistent responses (Van Meurs et al., 2014). Consequently, many patients endure repeated surgeries with significant morbidity, and no curative systemic therapy exists. This therapeutic gap highlights a pressing unmet clinical need: there are currently no approved targeted or precision therapies that reliably improve outcomes in GCTs.
GCTs represent a particularly compelling tumor type in which to establish a proof-of-concept for novel therapeutic frameworks. First, their biology is characterized by apoptotic dysregulation, with elevated procaspase-3 levels and a relative susceptibility to extrinsic apoptotic signaling, making them uniquely suited for apoptosis-inducing strategies such as TRAIL-producing oncolytic viruses and PAC-1 (Russell et al., 2012; Ashkenazi, 2008; Aziz et al., 2010). Second, compared with highly heterogeneous epithelial ovarian cancers, GCTs display a more uniform molecular landscape, providing a tractable model system for developing integrative predictive approaches. Third, the rarity of GCTs creates both a challenge and an opportunity: conventional large-scale clinical trials are difficult to conduct, increasing the value of computational models that can extract maximal insight from limited clinical datasets. Finally, because GCTs exemplify tumors with indolent growth but unpredictable recurrence and resistance to standard therapies, they offer a clinically meaningful setting to test strategies that combine mechanistic modeling with machine learning to personalize therapy.
In recent years, targeted combination therapies have emerged as promising strategies for GCTs and other refractory cancers. Tumor necrosis factor-related apoptosis-inducing ligand (TRAIL)-producing oncolytic viruses selectively replicate in tumor cells while sparing normal tissue, delivering TRAIL to the tumor microenvironment and activating extrinsic apoptotic pathways (Russell et al., 2012). Procaspase-3 activator 1 (PAC-1) directly activates procaspase-3, a key executioner of apoptosis, and synergizes with pro-apoptotic agents, such as TRAIL, to amplify tumor cell death (Ashkenazi, 2008; Aziz et al., 2010; Reed, 1999; Peterson et al., 2009). The rationale for combining TRAIL-oncolytic viruses with PAC-1 is therefore compelling: TRAIL initiates apoptosis upstream, while PAC-1 amplifies downstream caspase activity, together providing a potent and tumor-selective pro-apoptotic strategy (Wang and El-Deiry, 2003; Gujar et al., 2018).
Despite this strong biological rationale, patient responses to such combination therapies remain highly variable, reflecting tumor heterogeneity, viral dynamics, drug pharmacokinetics, and host immune responses (Lin et al., 2023; Esteva et al., 2019). Accurate prediction of therapeutic outcomes in GCTs thus requires new frameworks that can integrate complex, multidimensional data. Artificial intelligence (AI), particularly machine learning (ML), offers a means to identify hidden patterns in clinical, molecular, and imaging data that are not discernible through traditional methods (Rockne et al., 2008; Zhang et al., 2017). Integrating mechanistic, mathematical models of tumor growth, viral kinetics, and drug action into ML pipelines enables the development of hybrid, predictive models that not only forecast treatment outcomes, but also provide mechanistic insights (Obermeyer and Emanuel, 2016; Le Sauteur-Robitaille et al., 2023).
In this study, we present an artificial analysis framework that combines a mathematical model of TRAIL-oncolytic virus and PAC-1 therapy with ML algorithms to predict tumor dynamics in ovarian GCTs. By training ML models on clinical and imaging data enriched with personalized mathematical model outputs, we aim to improve predictive accuracy and support the design of more effective, individualized treatment strategies. GCTs, with their well-defined unmet need and distinctive biology, provide an ideal proof-of-concept setting for this integrated modeling approach, with potential relevance to other difficult-to-treat malignancies.
2 Mathematical model
In this section, we present the mathematical model describing granulosa cell tumors of the ovary treatment by a combination of a TRAIL-producing oncolytic virus and PAC-1. The mathematical model includes nonlinear ordinary differential equation of the first order. The assumptions of the model are as follows (Le Sauteur-Robitaille et al., 2023):
GCT Equations 1–5: The variables in the granulosa cell tumor (GCT) model are defined as follows: Q, the number of quiescent tumor cells; G1, the number of cells in the G1 phase; and Ai (i = 1…, n), the ith compartment of the active phases of the cell cycle, with N denoting the total number of active compartments. Quiescent cells transition into the G1 phase at a rate of a1, progress into the active phases at a2, and undergo apoptosis at d2. Upon entering the first active compartment, A1, at rate a2, cells sequentially transit through additional active compartments, Ai, at rate ktr. Throughout these active compartments, cells may also undergo apoptosis at a rate of d3.
OV Equations 6–7: The variables of the oncolytic virus (OV) are denoted by I, the infected cells, and V, the viral particles. The infected cells are generated through mass-action contact dynamics between viral particles and cells in the G1 phase, and active phases of the cell cycle N. This interaction occurs at a rate of κηV, which accounts for the half-maximal effective concentration of virions, η0.5.
Tumor-innate immune interactions Equations 8–9: The variables that describe the interaction between the tumor-innate and immune are Cytokine, C, and the population of phagocytes, P. The set of equations of these variables are incorporate parameters such as the rate with tumor cells, kp, and the digestion rates of these immune cells, kQ and ks. Additionally, immune activation was incorporated by modeling the recruitment and stimulation of phagocytes at the site of oncolytic virus infection, driven by cytokine signaling. Cytokines are produced at a rate of Cprod in response to the number of infected cells I and are eliminated at a rate of kelim. The cytokine-phagocyte interaction modulates the population of tumor-targeting phagocytes at a rate of , while these immune cells undergo natural cell death at a rate of γP.
Pharmacokinetics of PAC-1 Equations 10–12: The variables that describe the treatment of a combination of PAC-1 and TRAIL are PA, PPAC−1, and Pe. The administration process of PAC-1 was modeled with the dose initially entering the gastrointestinal tract, PA before being absorbed into the bloodstream, PPAC−1 at a rate of ka. After entering the plasma, PAC-1 is cleared at a rate of kep and distributed to the peripheral compartment, Pe, with the exchange governed by the transit parameters k12P and k21P.
Pharmacokinetics of TRAIL Equations 13–15: The variables that describe the TRAIL administration are T, TP, and TA. The pharmacokinetics (PK) of TRAIL were described using an irreversible binding, target-mediated drug disposition (TMDD) model, assuming a constant receptor count, R0. This model incorporates three compartments: the free TRAIL ligand, T, the receptor-bound TRAIL complex, TP, and the ligand present in the peripheral tissues, TA. TRAIL is generated at a rate of αT from the lysis of infected cells, and continuously at a constant rate, Tprod. Its elimination occurs at a rate of kel. TRAIL binds to death receptors, forming a complex at a rate of kon, and it moves between the ligand compartment TA with transition rates k12 and k21. Once the complex is formed, it undergoes degradation at a rate of kint.
Based on the above assumptions, the mathematical model includes the following ODE system of equations. All dynamical variables, parameters, and their corresponding units are provided in Tables 1–3.
The initial conditions of the mathematical model are
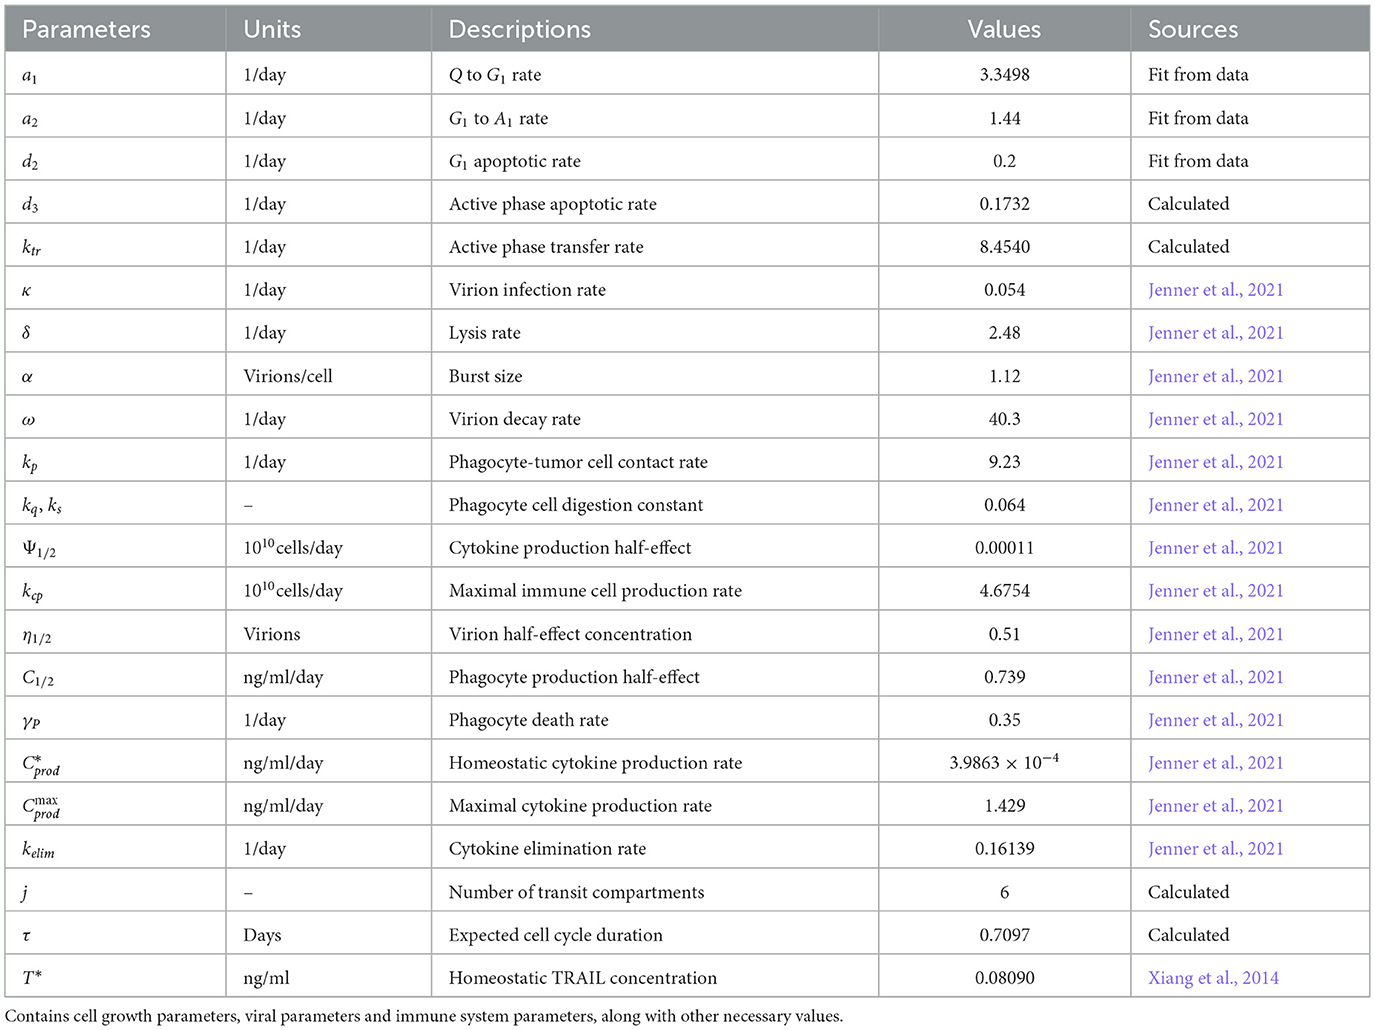
Table 1. List of parameters for the model.
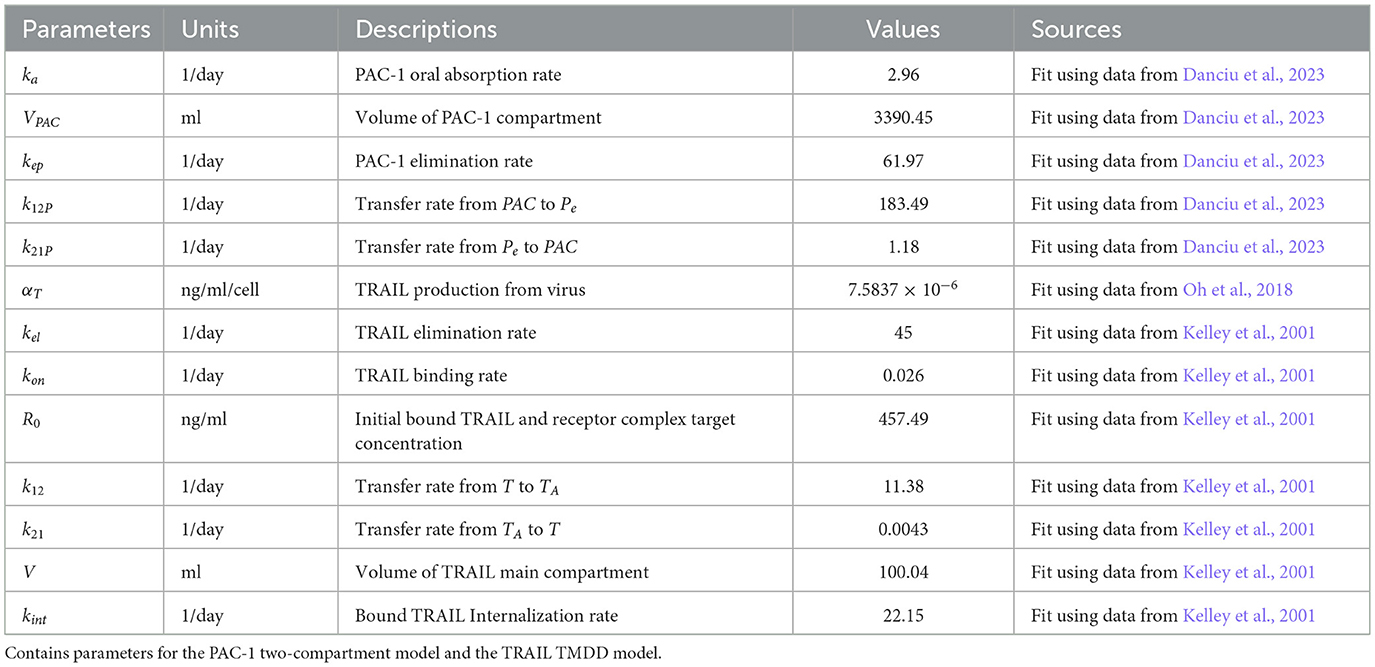
Table 2. List of PK parameters.
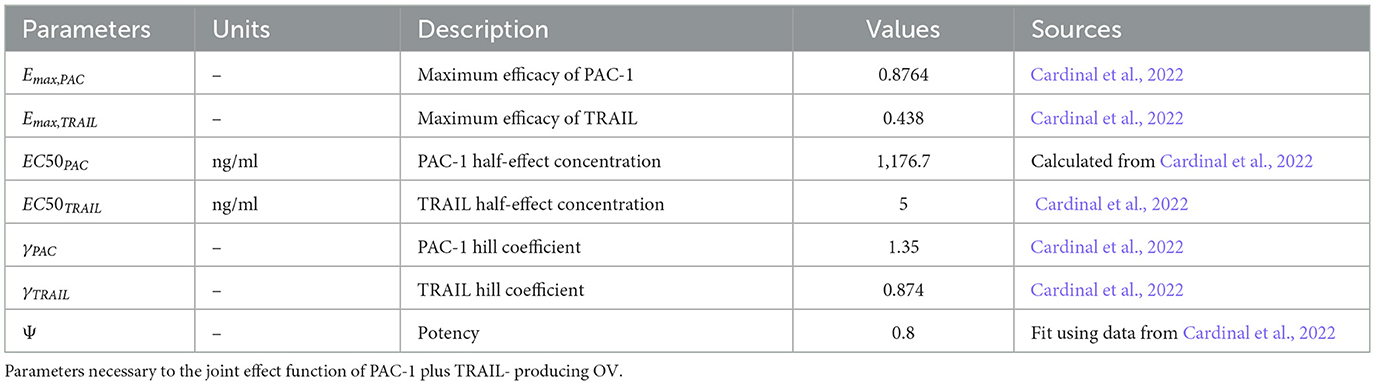
Table 3. List of PD parameters.
3 The dataset
3.1 Datasets with tumor size as a continuous variable
In this study, which focuses on the treatment of granulosa cell tumors of the ovary through the combined action of a TRAIL-producing oncolytic virus and PAC-1 therapy, we employed machine learning (ML) algorithms to enhance the prediction of tumor dynamics. Four datasets were analyzed in conjunction with mathematical models to improve the accuracy of tumor size prediction. Two of these datasets contained tumor size as a continuous variable, while the other two reported tumor size categorically (divided into tertiles).
The first dataset involved 10, 389 women receiving neoadjuvant chemotherapy for ovarian cancer, with detailed clinical and demographic data, including ethnicity, ovarian laterality, age at MRI1 (in years), subtype (lymph node-positive, PIK3CA mutation, BRCA mutation, and TP53 mutation), and BMI. Tumor sizes were recorded by MRI at 4 time points and measured by the longest diameter (LD in cm) and volume 4 (cc).
The second dataset consisted of 25, 985 women diagnosed with stage 2 or 3 ovarian cancer, recording tumor size at 3 MRI time points, along with clinical information.
The primary objective was to predict tumor size at each time point as accurately as possible, supporting the optimization of a TRAIL-producing oncolytic virus and PAC-1 therapy. To achieve this, we incorporated immunological features known to influence tumor behavior, such as CD4 + T cells, T − reg cells (Dentritic cells), and treatment parameters. Due to challenges in direct patient measurement, these features were derived from a mathematical model.
This model describes immune responses to chemotherapy (AC), refined for dosage and timing precision. The data were then pruned to include only treatment-matched samples, resulting in refined datasets of 10, 389 and 25, 389 samples, respectively.
The clinical data were merged with the mathematical model outputs using the initial MRI tumor size as T0. Individualized solutions were computed using the ODE45 Matlab function, producing unique solution vectors for each woman at 3 time points for variables such as N (NK cells), L (CD4+ T cells), C, T−reg cells (chemotherapy PAC-1), and OV-virus. These features were appended to the clinical data for subsequent ML analysis.
ML algorithms were applied to each MRI time point using current and previous data. Linear regression was first conducted with the merged dataset via fitlm in Matlab, generating RMSE and p-values to assess feature significance. The data were then discretized into tertiles for neural network training with 50 neurons and repeated 100 times to calculate the average performance from confusion matrices.
3.2 Datasets with tumor size as a categorical variable
This approach was extended to two datasets reporting tumor size categorically. The third dataset included 626 young women with ovarian cancer, providing data on age, nulliparity, contraceptive use, menopause, family history, full-term pregnancies, obesity, metastasis, lymph node status, PIK3CA and TP53 mutations, tumor size, lymph nodes, histology, vascular invasion, grade, adjuvant chemotherapy, radiotherapy, hormone therapy, and progression.
The fourth dataset comprised 41, 000 ovarian cancer cases with extensive clinical and treatment information, including metastasis, age, lymph node status, PIK3CA, P53, BRCA, stage, nodal status, histology, tumor size, grade, surgical margins, surgeries, chemotherapy, antihormonal, and other treatments. Tumor size was coded as categories 1, 2 or 3.
Following data pruning for chemotherapy regimen consistency, these datasets contained 41,000 and 626 samples. Each tertile group was assigned a random number between 0 and 100 as an initial tumor size condition, and the model was numerically solved for each sample, as described for continuous data.
Solution vectors at each time point for variables such as D, T − reg cells, C, BRCA, and chemotherapy drugs, were converted into categorical indices and merged with clinical data. As this was a classification problem, neural network algorithms were applied exclusively.
3.3 ML model
To optimize the treatment of granulosa cell tumors of the ovary using a TRAIL-producing oncolytic viruses and PAC-1 therapy through precise tumor size prediction, the ML model was trained using prior tumor size data:
For the 10,389-patient continuous dataset:
Predict Volume 2 (second MRI tumor size) from all data plus Volume 1 (first MRI),
Predict Volume 3 (third MRI) from all data plus SER Volume 1 (first MRI),
Predict Volume 3 from all data plus Volume 1 and Volume 2.
For categorical datasets, tumor size was predicted once per dataset based on clinical data and baseline measurements.
4 Results and discussion
A novel method integrating mathematical model outputs with clinical data was developed to improve tumor size prediction accuracy for granulosa cell tumor treatment with TRAIL-producing oncolytic virus and PAC-1 therapy. Linear regression and neural networks were applied to four ovarian cancer datasets, each offering unique advantages. Linear regression provided direct size predictions, while neural networks classified tumors into defined ranges. The results are presented in Tables 4–19. In Figures 1–5 we summarize the model and experimental data as histograms: Figures 1–3 define the model's structure and drug characteristics (neural network performance), while Figures 4, 5 present linear regression results for tumor size prediction, comparing models without and with mathematical features, respectively, to demonstrate improved accuracy.
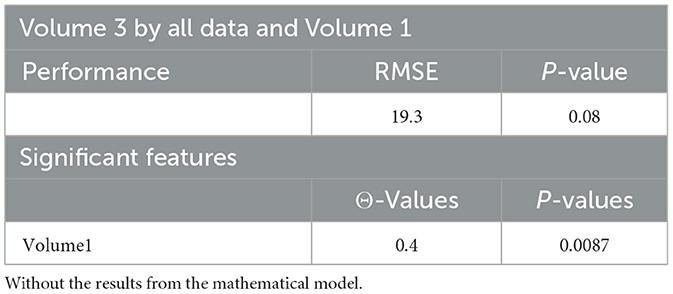
Table 4. Linear regression results using machine learning.
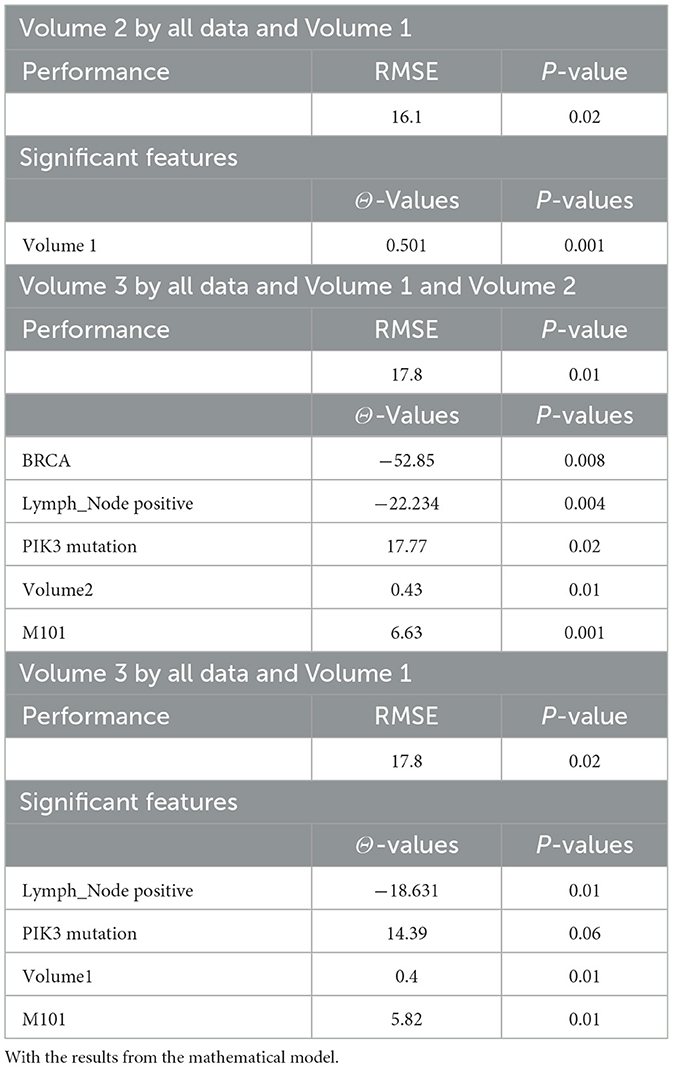
Table 5. Linear regression results using machine learning.
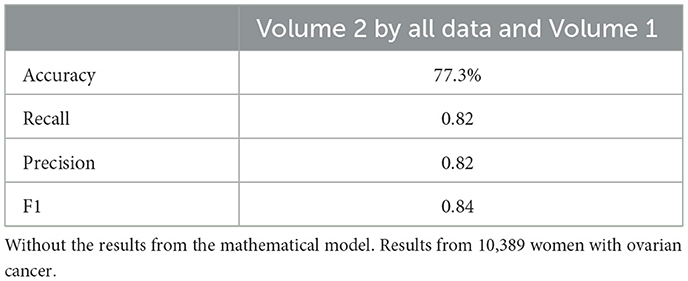
Table 6. Neural networks results using machine learning.
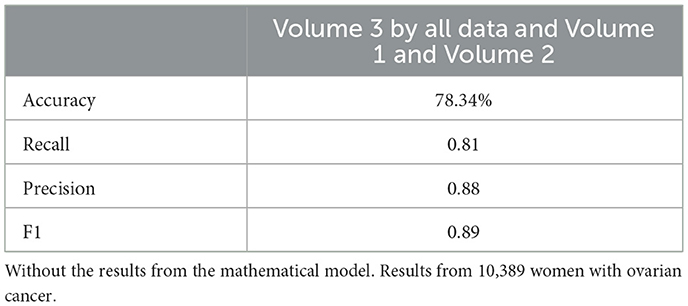
Table 7. Neural networks results using machine learning.
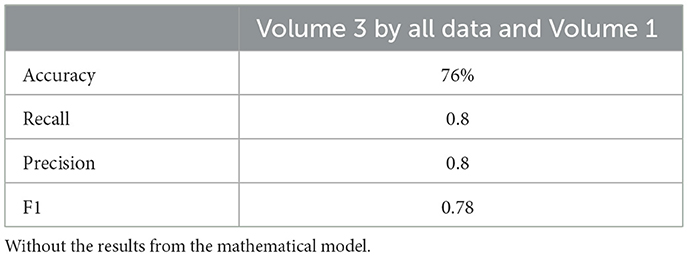
Table 8. Neural networks results using machine learning.

Table 9. Neural networks results using machine learning.

Table 10. Neural networks results using machine learning.
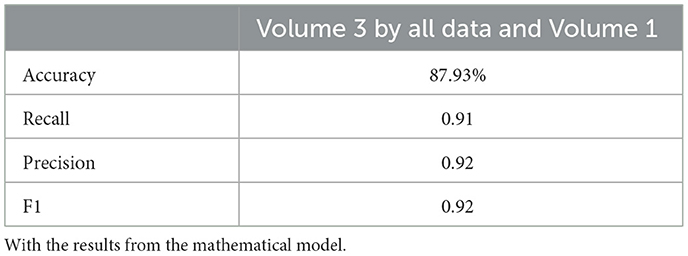
Table 11. Neural networks results using machine learning.
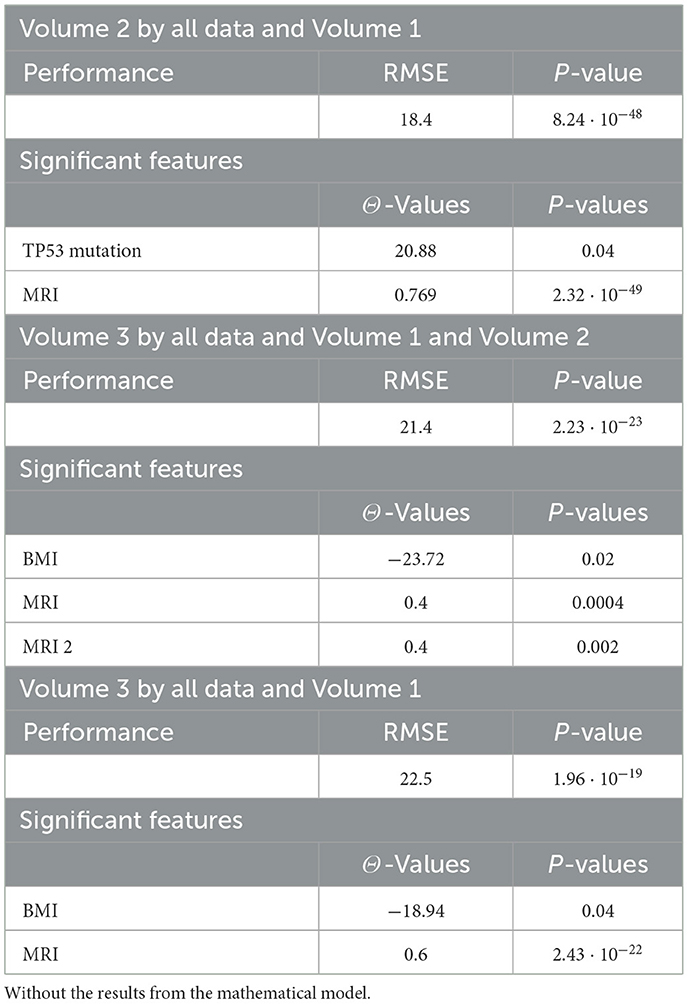
Table 12. Linear regression results using machine learning.
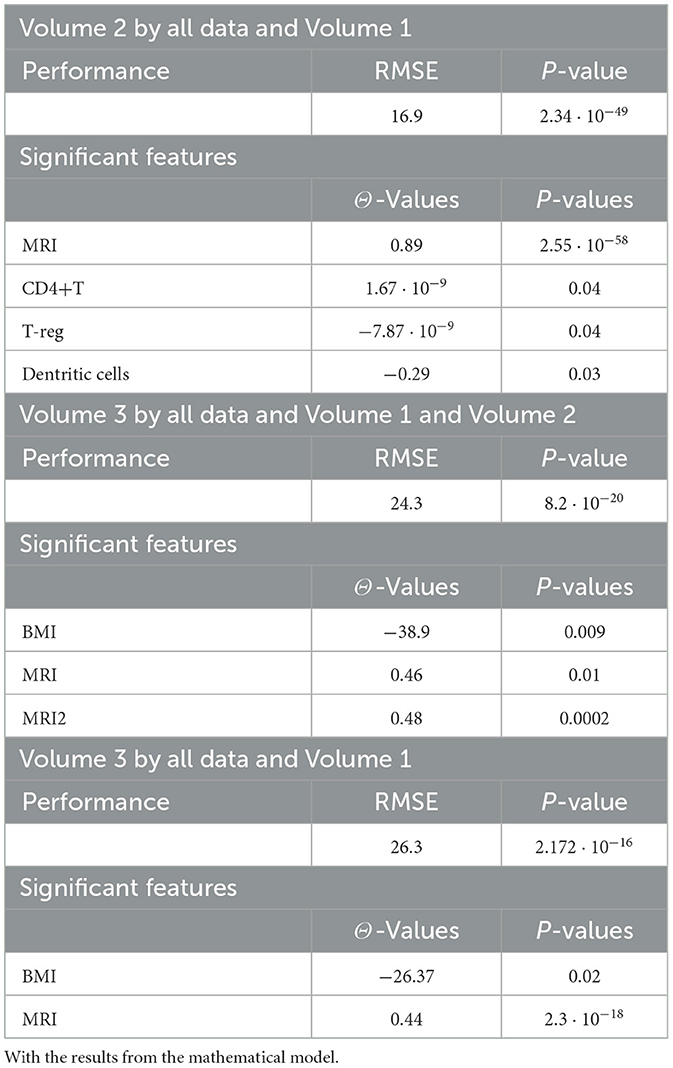
Table 13. Linear regression results using machine learning.
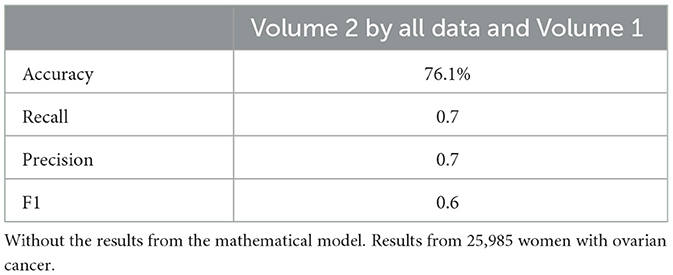
Table 14. Neural network results using machine learning.
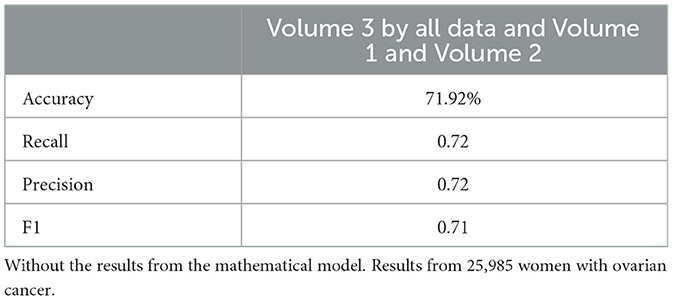
Table 15. Neural network results using machine learning.
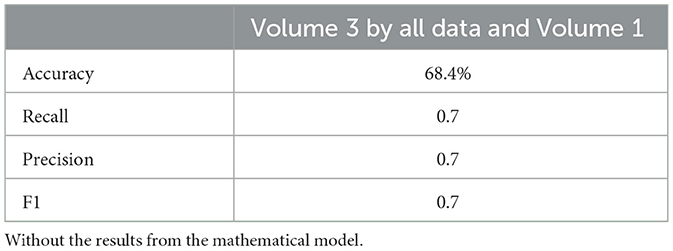
Table 16. Neural network results using machine learning.
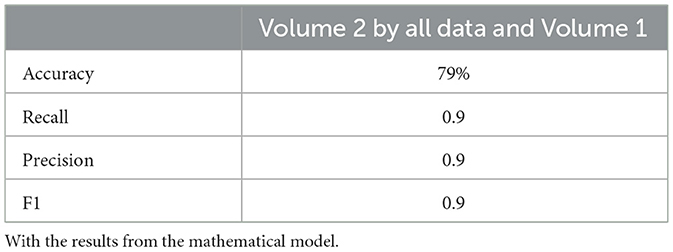
Table 17. Neural network results using machine learning.
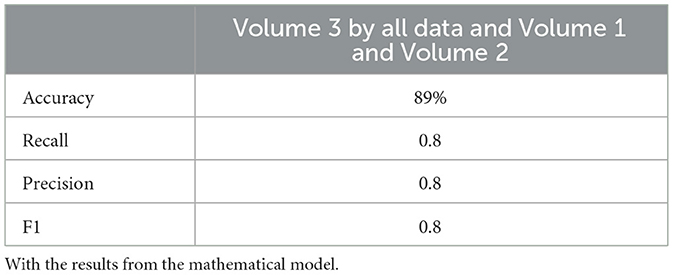
Table 18. Neural network results using machine learning.
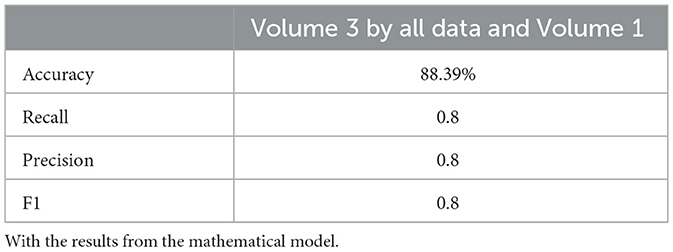
Table 19. Neural network results using machine learning.
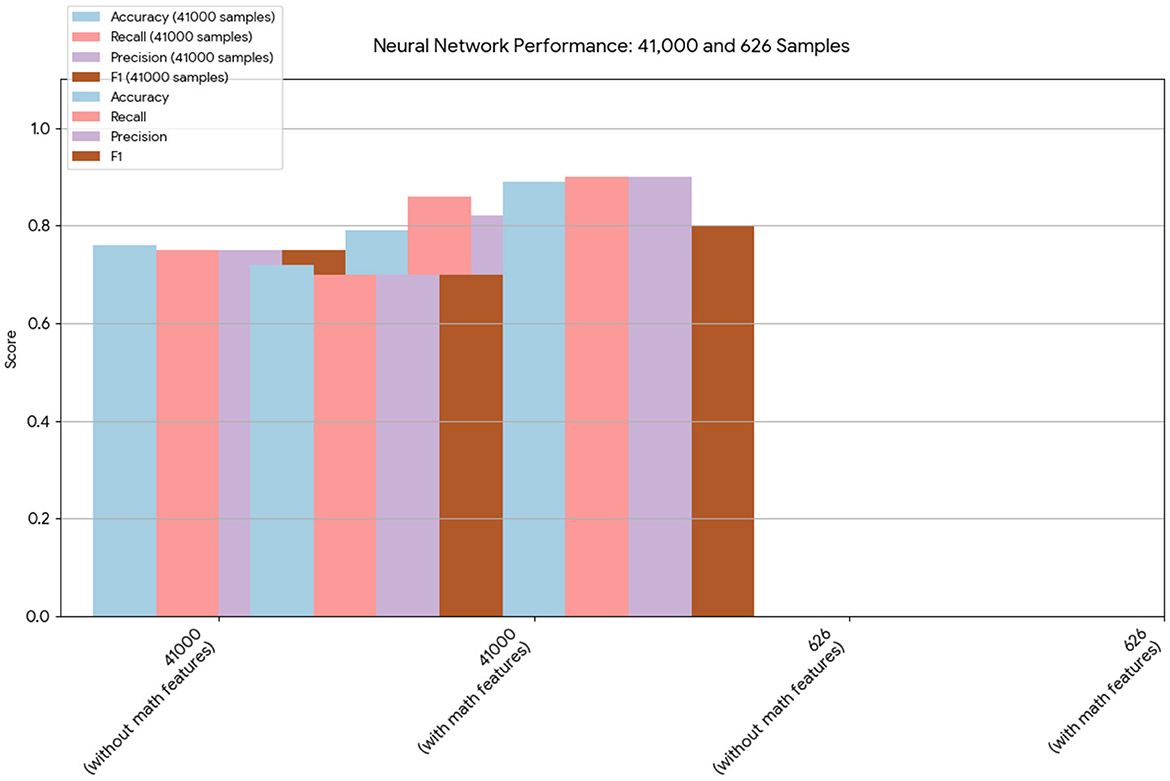
Figure 1. This chart provides a direct comparison of the neural network results on the 41,000- and 626-sample datasets. In both cases, the models that included the mathematical model features demonstrated improved overall performance, particularly in terms of accuracy and recall.
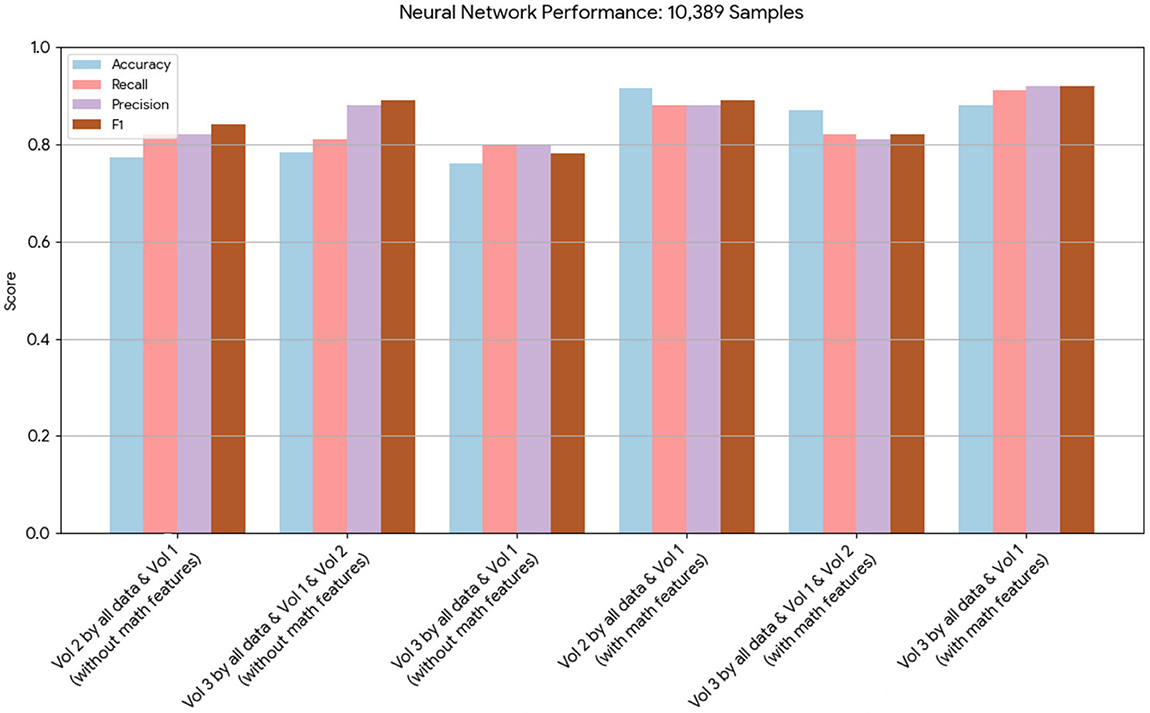
Figure 2. This chart displays the performance metrics of neural network models run on a dataset of 10,389 samples. The models with mathematical model features consistently show a notable increase in performance across all metrics compared to the models without.
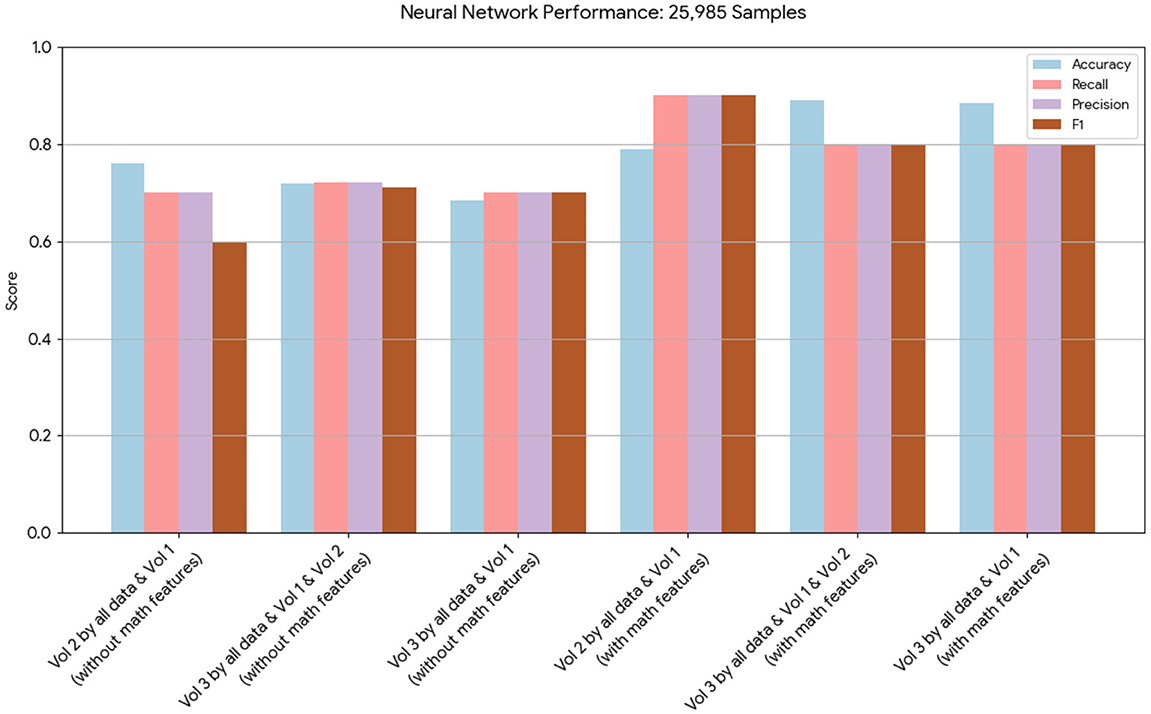
Figure 3. This chart presents the performance of neural network models on 25,985 samples. It highlights that, while both sets of models performed well, those incorporating the mathematical model features achieved higher scores in terms of accuracy, recall, and precision.
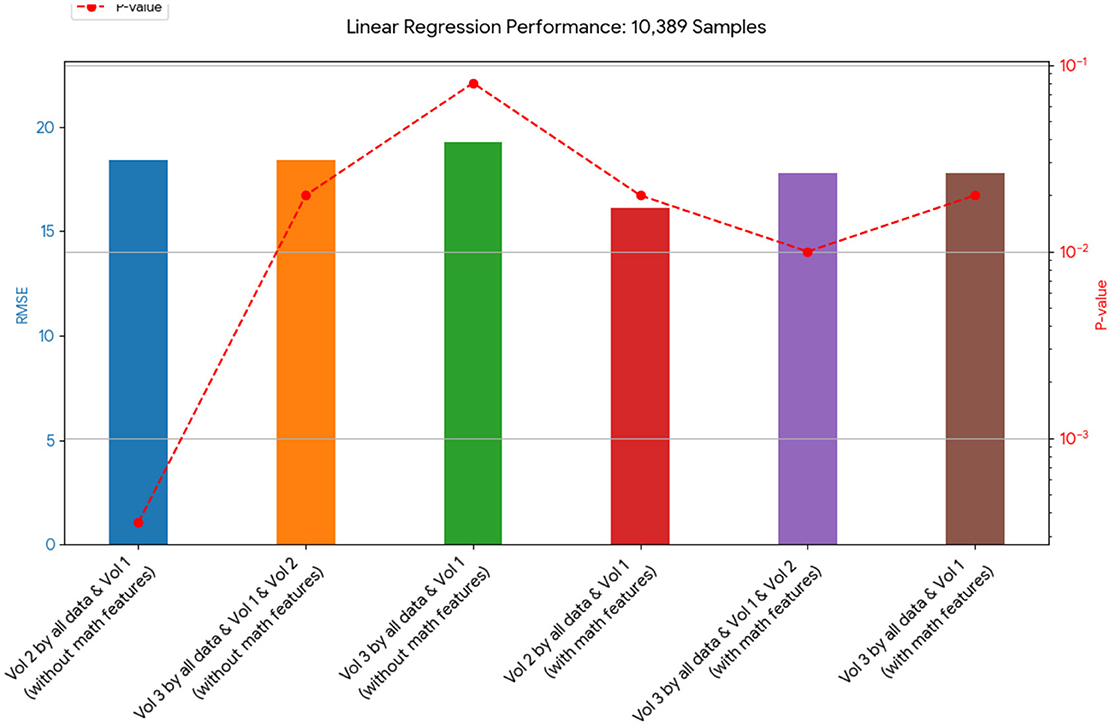
Figure 4. This chart shows the RMSE of linear regression models on the 10,389-sample dataset. The models that included the mathematical model generally had a lower RMSE, indicating a better fit to the data than those without it.
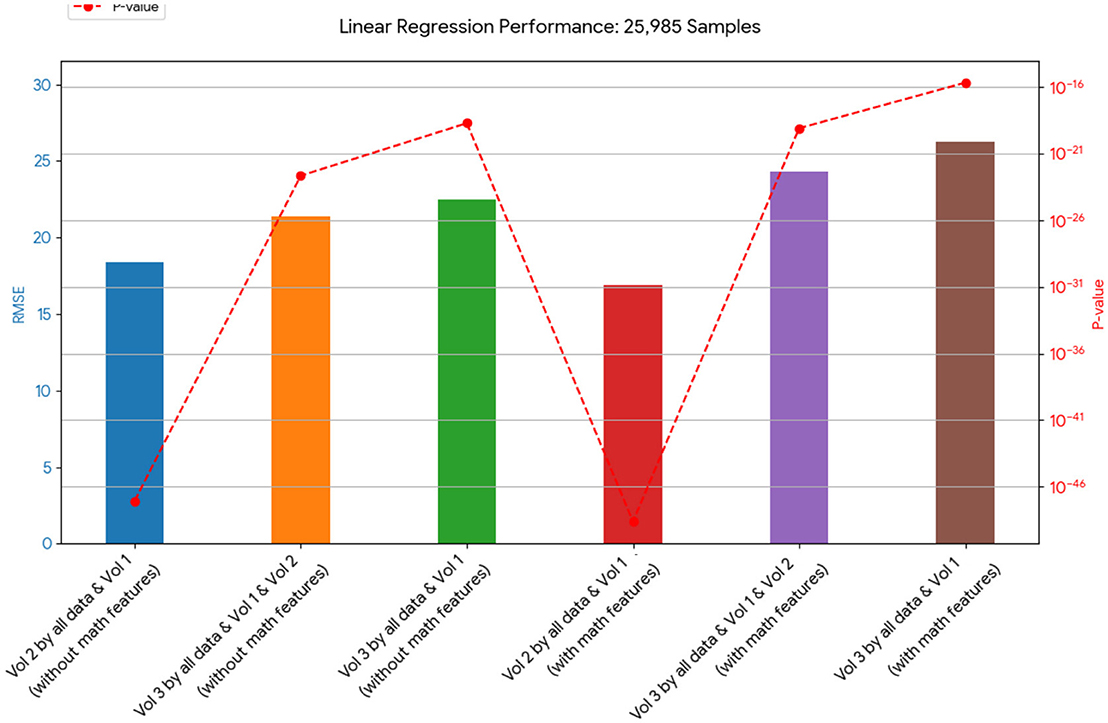
Figure 5. This chart presents the RMSE of linear regression models on 25,985 samples. It shows a varied outcome, with some models containing mathematical features performing better and some performing worse in terms of RMSE than their counterparts without these features.
4.1 Linear regression algorithm
Tables 4, 20, and 21 present the linear regression predictions without mathematical features (first dataset, 10,389 samples), whereas Table 5 includes these features. Although the p-values remained similar, the RMSE values decreased with the addition of mathematical features. For example, the RMSE for Volume 2 dropped from 18.4 (Tables 4, 20, 21) to 16.1 (Table 5), and for Volume 3, it decreased from 19.3 to 17.8.
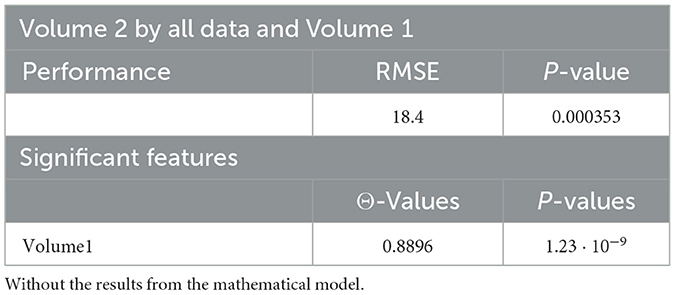
Table 20. Linear regression results using machine learning.
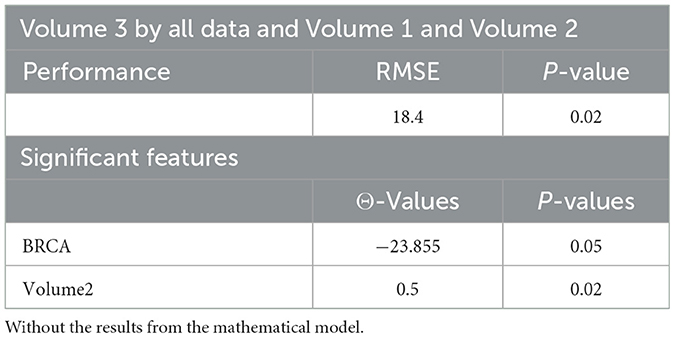
Table 21. Linear regression results using machine learning.
This indicates that incorporating mathematical model outputs into ML models improves prediction performance. Tables 4, 20, and 21 identified BRCA and Volume 2 as significant, while Table 5 additionally highlights Lymph and PIK3CA, providing further insights into treatment-relevant factors. Notably, the feature M101 (chemotherapy administered on day 101) was found to be significant, suggesting its potential role in personalized treatment adjustment.
Tables 12, 13 for the second dataset (25, 985 patients) showed improved p-values and identified CD4+ and D as important features when including mathematical outputs.
4.2 Neural network algorithm
Neural network performance metrics (accuracy, recall, precision, F1score) without mathematical features are reported in Tables 6–8, 14–16, 22, and 23. The results obtained with mathematical features are presented in Tables 9–11, 17–19, 24, and 25. For example, Volume 2 accuracy increased from 77.3% (F1score 0.84, Table 6) to 91.42% (F1score 0.89) when including mathematical model outputs.
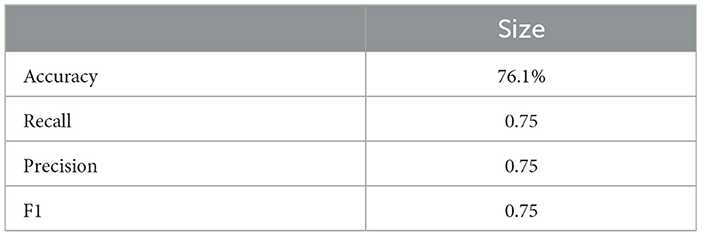
Table 22. Data without the mathematical model features.
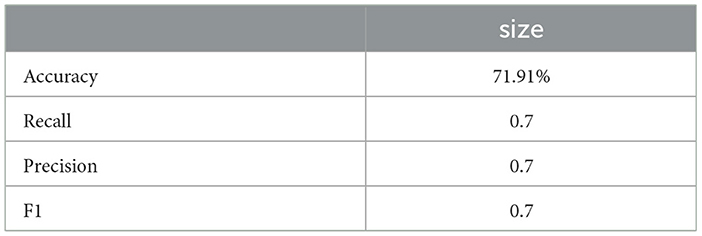
Table 23. Data without the mathematical model features.
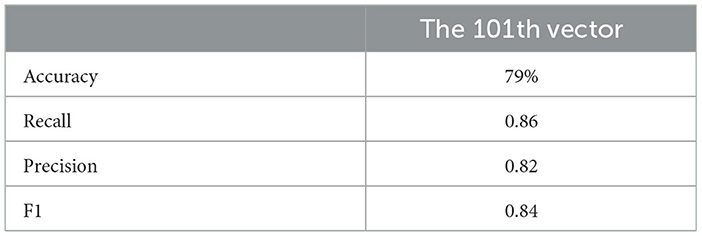
Table 24. Data with the mathematical model features.
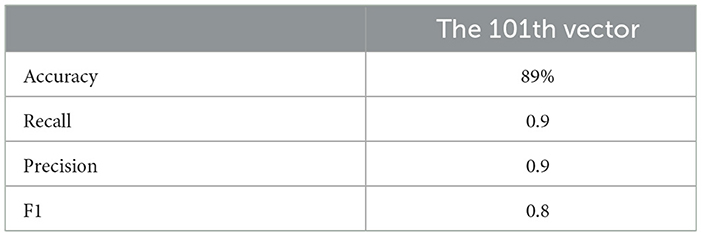
Table 25. Data with the mathematical model features.
Similarly, the 25, 985-patient dataset showed improved results when mathematical features were integrated (Tables 17–19 vs. 14–16). For the third cohort (41,000 women), accuracy rose from 76.1% to 79%, with corresponding improvements in recall, precision, and F1.
Similarly, the 25, 985-patient dataset showed improved results when mathematical features were integrated (Tables 17–19 vs. 14–16). For the third cohort (41,000 women), accuracy rose from 76.1% to 79%, with corresponding improvements in recall, precision, and F1.
Overall, across all algorithms and datasets, merged data outperformed original clinical data alone. These findings highlight the value of incorporating mathematical model-derived features for more accurate prediction of tumor dynamics, supporting the effective and personalized treatment of granulosa cell tumors of the ovary using a TRAIL-producing oncolytic virus and PAC-1 therapy.
4.3 Sensitivity analysis
In this section, we evaluated how changes in specific model parameters could influence predicted outcomes. To do this, we conducted a local sensitivity analysis, systematically varying each parameter from −85% to 85% of its value.
We assessed the changes in the predicted final tumor volume relative to baseline simulations that used a consistent 21-day treatment course consisting of daily PAC-1 administration at 375 mg with an initial multiplicity of infection (MOI) of 0.03 applied to a tumor population of 109 cells.
The results of the sensitivity analysis, presented in Figure 6, revealed that only a limited number of parameters significantly impacted tumor progression in the model: a1, a2, d1, and d2. Specifically, the tumor proliferation rate a1 and the tumor cell death rate d2 were the most influential, directly affecting tumor expansion.
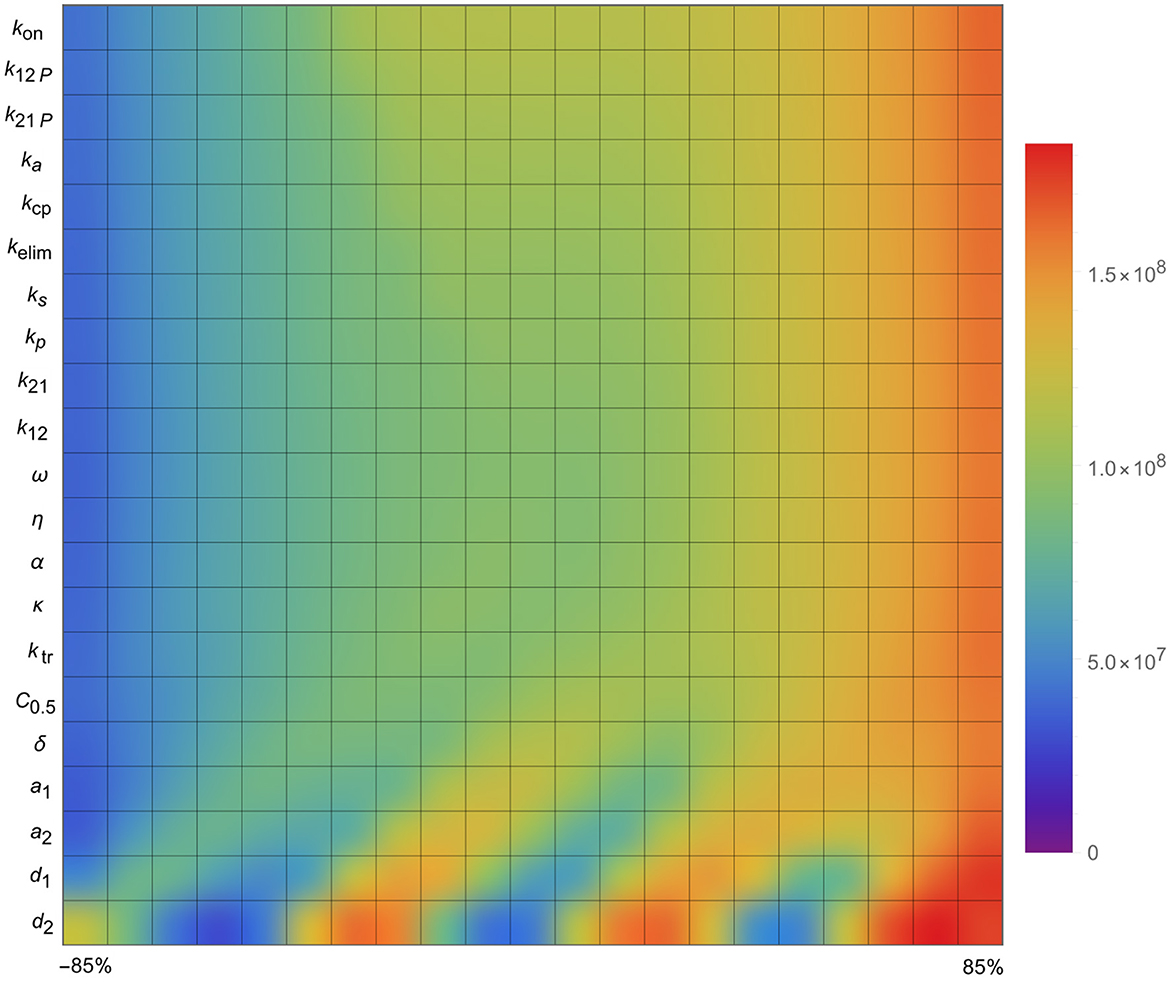
Figure 6. Sensitivity analysis of the parameters of the mathematical model, i.e., the impact of the parameters on tumor size.
Quite surprisingly, the other parameters (in the list presented in Figure 6) did not affect the stability of the model in general and the size of the tumor in particular, i.e., they appeared to have little effect overall.
These findings indicate that, beyond the initial tumor burden, the tumor's intrinsic growth characteristics-particularly its proliferation rate-are critical indicators of how well a combination treatment might perform.
5 Conclusions
In this study, we presented an innovative artificial analysis framework that integrates a mechanistic mathematical model with machine learning (ML) algorithms to improve prediction of tumor dynamics in the treatment of granulosa cell tumors of the ovary using the combined action of a TRAIL-producing oncolytic virus and PAC-1 therapy. By leveraging four extensive datasets containing both continuous and categorical tumor size data, our approach systematically combined personalized mathematical simulations with clinical and imaging features to enhance ML predictive performance.
Our results demonstrated that incorporating features derived from the mathematical model consistently improved prediction accuracy across all datasets and ML approaches used. Linear regression models showed a marked reduction in root mean square error (RMSE) when mathematical outputs were added, while neural network models exhibited increased accuracy, precision, recall, and F1 scores. These improvements underscore the importance of integrating mechanistic insights with data-driven algorithms for reliable tumor burden prediction.
The inclusion of mechanistic variables such as immune cell dynamics, the pharmacokinetics of PAC-1 and TRAIL, and tumor-virus interactions provided additional biologically relevant features that pure clinical data alone could not offer. This approach enables a more comprehensive representation of tumor behavior under therapy, enhancing the potential for effective personalized treatment strategies in granulosa cell tumors of the ovary.
However, several limitations should be acknowledged. First, while the mathematical model included key tumor-immune-pharmacokinetic interactions, further refinement and validation with larger prospective clinical datasets are needed to generalize these findings. Second, although this framework focused on granulosa cell tumors treated with a TRAIL-producing oncolytic virus and PAC-1, extending the methodology to other tumor types and therapeutic combinations could broaden its clinical applicability.
This study introduces an innovative hybrid framework that integrates mechanistic mathematical modeling with machine learning (ML) to predict tumor dynamics in granulosa cell tumors treated with a TRAIL-producing oncolytic virus and PAC-1 therapy. Unlike conventional approaches that rely solely on clinical and imaging data, this method enriches ML models with biologically meaningful variables derived from tumor–immune–drug interaction simulations. This integration significantly improves prediction accuracy, precision, recall, and F1 scores across multiple large datasets. Our work not only demonstrates the added value of combining mathematical and data-driven approaches but also establishes a novel proof-of-concept for personalized, mechanism-informed treatment planning in rare ovarian cancers where therapeutic options are limited.
In conclusion, the proposed artificial analysis framework represents a promising tool for precision oncology. By combining mathematical modeling and ML algorithms, clinicians and researchers can gain deeper insights into tumor dynamics, optimize treatment planning, and potentially improve outcomes for patients with granulosa cell tumors of the ovary. Future studies should focus on integrating this framework into clinical decision-support systems and exploring its use in real-time treatment adaptation.
Data availability statement
The original contributions presented in the study are included in the article/supplementary material; further inquiries can be directed to the corresponding author.
Author contributions
ON: Investigation, Methodology, Software, Supervision, Writing – review & editing. PB: Conceptualization, Data curation, Investigation, Software, Writing – original draft, Writing – review & editing.
Funding
The author(s) declare that no financial support was received for the research and/or publication of this article.
Conflict of interest
The authors declare that the research was conducted in the absence of any commercial or financial relationships that could be construed as a potential conflict of interest.
Generative AI statement
The author(s) declare that no Gen AI was used in the creation of this manuscript.
Any alternative text (alt text) provided alongside figures in this article has been generated by Frontiers with the support of artificial intelligence and reasonable efforts have been made to ensure accuracy, including review by the authors wherever possible. If you identify any issues, please contact us.
Publisher's note
All claims expressed in this article are solely those of the authors and do not necessarily represent those of their affiliated organizations, or those of the publisher, the editors and the reviewers. Any product that may be evaluated in this article, or claim that may be made by its manufacturer, is not guaranteed or endorsed by the publisher.
References
Ashkenazi, A. (2008). Directing cancer cells to self-destruct with pro-apoptotic receptor agonists. Nat. Rev. Drug Discov. 7, 1001–1012. doi: 10.1038/nrd2637
Aziz, G., Akselsen, Ø. W., Hansen, T. V., and Paulsen, R. E. (2010). Procaspase-activating compound 1 induces a caspase-3-dependent cell death in cerebellar granule neurons. Toxicol. Appl. Pharmacol. 247, 238–242. doi: 10.1016/j.taap.2010.07.002
Bhat, A. S., Ahmed, M., Abbas, K., Mustafa, M., Alam, M., Salem, M. A. S., et al. (2024). Cancer initiation and progression: a comprehensive review of carcinogenic substances, anti-cancer therapies, and regulatory frameworks. Asian J. Res. Biochem. 14, 111–125. doi: 10.9734/ajrb/2024/v14i4300
Cardinal, O., Burlot, C., Fu, Y., Crosley, P., Hitt, M., Craig, M., et al. (2022). Establishing combination PAC-1 and TRAIL regimens for treating ovarian cancer based on patient-specific pharmacokinetic profiles using in silico clinical trials. Comput. Syst. Oncol. 2:e1035. doi: 10.1002/cso2.1035
Colombo, N., Peiretti, M., Garbi, A., Carinelli, S., Marini, C., Sessa, C., et al. (2012). Non-epithelial ovarian cancer: ESMO clinical practice guidelines for diagnosis, treatment and follow-up. Ann. Oncol. 23, vii20–vii26. doi: 10.1093/annonc/mds223
Danciu, O. C., Holdhoff, M., Peterson, R. A., Fischer, J. H., Liu, L. C., Wang, H., et al. (2023). Phase I study of procaspase-activating compound-1 (PAC-1) in the treatment of advanced malignancies. Br. J. Cancer. 128, 783–792. doi: 10.1038/s41416-022-02089-7
Esteva, A., Robicquet, A., Ramsundar, B., Kuleshov, V., DePristo, M., Chou, K., et al. (2019). A guide to deep learning in healthcare. Nat. Med. 25, 24–29. doi: 10.1038/s41591-018-0316-z
Gujar, S., Pol, J. G., Kim, Y., Lee, P. W., and Kroemer, G. (2018). Antitumor benefits of antiviral immunity: an under appreciated aspect of oncolytic virotherapies. Trends Immunol. 39, 209–221. doi: 10.1016/j.it.2017.11.006
Homesley, H. D., Bundy, B. N., Hurteau, J. A., and Roth, L. M. (1999). Bleomycin, etoposide, and Cisplatin: combination therapy of ovarian granulosa cell tumors and other stromal malignancies: a gynecologic oncology group study. Gynecol. Oncol. 72, 131–137. doi: 10.1006/gyno.1998.5304
Jenner, A. L., Cassidy, T., Belaid, K., Bourgeois-Daigneault, M. C., and Craig, M. (2021). In silico trials predict that combination strategies for enhancing vesicular stomatitis oncolytic virus are determined by tumor aggressivity. J. Immunother. Cancer 9:e001387. doi: 10.1136/jitc-2020-001387
Kelley, S. K., Harris, L. A., Xie, D., Deforge, L., Totpal, K., Bussiere, J., et al. (2001). Preclinical studies to predict the disposition of Apo2L/tumor necrosis factor-related apoptosis-inducing ligand in humans: characterization of in vivo efficacy, pharmacokinetics, and safety. J. Pharmacol. Exp. Ther. 299, 31–38. doi: 10.1016/S0022-3565(24)29298-3
Le Sauteur-Robitaille, J., Crosley, P., Hitt, M., Jenner, A. L., and Craig, M. (2023). Mathematical modeling predicts pathways to successful implementation of combination TRAIL-producing oncolytic virus and PAC-1 to treat granulosa cell tumors of the ovary. Cancer Biol. Ther. 24:2283926. doi: 10.1080/15384047.2023.2283926
Lin, D., Shen, Y., and Liang, T. (2023). Oncolytic virotherapy: basic principles, recent advances and future directions. Signal Transduct. Target. Ther. 8. doi: 10.1038/s41392-023-01407-6
Obermeyer, Z., and Emanuel, E. J. (2016). Predicting the future big data, machine learning, and clinical medicine. N. Engl. J. Med. 375, 1216–1219. doi: 10.1056/NEJMp1606181
Oh, E., Hong, J., Kwon, O. J., and Yun, C. O. A. (2018). hypoxia- and telomerase-responsive oncolytic adenovirus expressing secretable trimeric TRAIL triggers tumour-specific apoptosis and promotes viral dispersion in TRAIL-resistant glioblastoma. Sci. Rep. 8:1420. doi: 10.1038/s41598-018-19300-6
Peterson, Q. P., Goode, D. R., West, D. C., Ramsey, K. N., Lee, J. J. Y., Hergenrother, P. J., et al. (2009). PAC-1 activates procaspase-3 in vitro through relief of zinc-mediated inhibition. J. Mol. Biol. 388, 144–158. doi: 10.1016/j.jmb.2009.03.003
Reed, J. C. (1999). Mechanisms of apoptosis avoidance in cancer. Curr. Opin. Oncol. 11:68. doi: 10.1097/00001622-199901000-00014
Rockne, R., Alvord, E. C. Jr., Rockhill, J. K., and Swanson, K. R. (2008). A mathematical model for brain tumor response to radiation therapy. J. Math. Biol. 58. doi: 10.1007/s00285-008-0219-6
Russell, S. J., Peng, K.-W., and Bell, J. C. (2012). Oncolytic virotherapy. Nat. Biotechnol. 30, 658–670. doi: 10.1038/nbt.2287
Van Meurs, H. S., Bleeker, M. C. G., van der Velden, J., Overbeek, L. I. H., Kenter, G. G., Buist, M. R., et al. (2013). The incidence of endometrial hyperplasia and cancer in 1031 patients with a granulosa cell tumor of the ovary. Int. J. Gynecol. Cancer 23, 1417–1422. doi: 10.1097/IGC.0b013e3182a57fb4
Van Meurs, H. S., van Lonkhuijzen, L. R. C. W., Limpens, J., van der Velden, J., and Buist, M. R. (2014). Hormone therapy in ovarian granulosa cell tumors: a systematic review. Gynecol. Oncol. 134, 196–205. doi: 10.1016/j.ygyno.2014.03.573
Wang, S., and El-Deiry, W. S. (2003). TRAIL and apoptosis induction by TNF-family death receptors. Oncogene 22, 8628–8633. doi: 10.1038/sj.onc.1207232
Xiang, G., Zhang, J., Ling, Y., and Zhao, L. (2014). Circulating level of TRAIL concentration is positively associated with endothelial function and increased by diabetic therapy in the newly diagnosed type 2 diabetic patients. Clin. Endocrinol. 80, 228–234. doi: 10.1111/cen.12312
Keywords: artificial intelligence, mathematical model, PAC-1, oncolytic virus, granulosa cells, ovarian cancer, machine learning
Citation: Nave O and Barasheshet P (2025) Artificial intelligence analysis applied to the treatment of granulosa cell tumors of the ovary. Front. Artif. Intell. 8:1675969. doi: 10.3389/frai.2025.1675969
Received: 31 July 2025; Accepted: 19 September 2025;
Published: 11 November 2025.
Edited by:
Tamer Saad Kaoud, The University of Texas at Austin, United StatesReviewed by:
Sidra Islam, Case Western Reserve University, United StatesRichard Segall, Arkansas State University, United States
Copyright © 2025 Nave and Barasheshet. This is an open-access article distributed under the terms of the Creative Commons Attribution License (CC BY). The use, distribution or reproduction in other forums is permitted, provided the original author(s) and the copyright owner(s) are credited and that the original publication in this journal is cited, in accordance with accepted academic practice. No use, distribution or reproduction is permitted which does not comply with these terms.
*Correspondence: OPhir Nave, b3BoaXJuQGcuamN0LmFjLmls
†ORCID: OPhir Nave orcid.org/0000-0001-5499-0036