 Samantha A. Alger1*
 P. Alexander Burnham2
 M. Sydney Miller1
 Esmaeil Amiri3,4
 Corinne Jordan5
 Kaira Wagoner4
- 1Agriculture, Landscape, and Environment Department, University of Vermont, Burlington, VT, United States
- 2Biology Department, University of Vermont, Burlington, VT, United States
- 3Delta Research and Extension Center, Mississippi State University, Stoneville, MS, United States
- 4Biology Department, University of North Carolina, Greensboro, NC, United States
- 5The Bee Lady Apiaries, Carbrook, QLD, Australia
Pests and pathogens are a primary threat to honey bee (Apis mellifera) colonies worldwide. Selective breeding for honey bees resistant to these stressors represents a promising approach for mitigating their impacts on honey bee health. UBeeO is a novel hygiene-eliciting selection tool that has been used to identify honey bee colonies that are resistant to the parasitic mite Varroa destructor, and that are more likely to survive winter without beekeeper intervention. Here, we used three separate case studies to evaluate the effectiveness of the UBeeO assay in identifying colonies resist to disease. In three distinct geographic regions, we measured UBeeO scores along with the prevalence and load of key fungal and viral honey bee pathogens. We show that UBeeO can be used to identify colonies resistant to several other diseases, including the two fungal pathogens chalkbrood (Ascosphaera apis) and Vairimorpha spp. (previously Nosema), and multiple viruses, all critically important to honey bee health and survival. Furthermore, we identify potential UBeeO resistance thresholds for each pathogen, demonstrating an inverse relationship between pathogen virulence and the minimum UBeeO score associated with resistance to that pathogen. These findings suggest that UBeeO-guided selection strategies have the potential to significantly improve honey bee breeding programs by facilitating identification of resilient and pathogen-resistant colonies. The broad geographic range of our study sites underscores the robustness and applicability of UBeeO across varying environmental contexts. Since honey bees provide essential pollination services in both natural and agricultural ecosystems, this work has major implications for environmental health, crop productivity, and food security on a global scale.
1 Introduction
The health and productivity of honey bee colonies are profoundly influenced by their susceptibility to various pathogens. Among these, viral infections, fungal diseases, and protozoan parasites pose significant threats, often leading to colony declines and economic losses in apiculture (Belsky and Joshi, 2019; Grozinger and Flenniken, 2019; Lippert et al., 2021; Popovska Stojanov et al., 2021; Ullah et al., 2021). With the increasing challenges posed by these pathogens and the limited availability of treatment options, there is a growing need for effective management strategies and breeding programs aimed at enhancing colony resistance to pests and pathogens. One promising approach is the selection for hygienic behavior in honey bees, which has been shown to increase disease resistance and improve overall colony health (Erez et al., 2022; Seltzer et al., 2022, 2023).
Hygienic behavior is the ability of honey bees to detect, uncap, and remove unhealthy brood from the colony. An important social immune mechanism, hygienic behavior is thought to improve colony health and productivity by reducing the spread and proliferation of various pests and pathogens including Varroa mites, viruses, microsporidia, and fungi. However, evidence of the efficacy of hygienic behavior varies widely between studies and across stressors. For example, some studies link hygienic behavior to reductions in Varroa loads (Spivak, 1996; Spivak and Reuter, 2001; Wagoner et al., 2021) deformed wing virus (DWV) loads (Erez et al., 2022) and the probability of DWV virus outbreak (Mugabi et al., 2024) while other studies indicate that hygienic behavior does not predict Varroa resistance (Locke and Fries, 2011; Leclercq et al., 2018a) and may even contribute to the spread of DWV between nestmates (Posada-Florez et al., 2021). Selective breeding programs for hygienic behavior have reported overall declines in Vairimorpha spp. (Previously Nosema) levels at the apiary level (Ivgin Tunca et al., 2017), but hygienic behavior has never been found to directly impact or reduce Vairimorpha spp. loads (Murray et al., 2016). Similarly, in some studies, hygienic behavior has been shown to reduce the spread of chalkbrood through early detection of infected larvae and removal of mummies (Medina-Flores et al., 2022; Invernizzi et al., 2011) while in other studies, hygienic behavior has shown little impact on chalkbrood presence or severity (Gerdts et al., 2018).
Likely explanations for the wide variability in reported efficacy of hygienic behavior against honey bee pests and pathogens include differences in the assays used to quantify hygiene, and differences in pest and pathogen virulence between studies. Necrophoresis-based methods for testing hygienic behavior, like the freeze-killed brood (FKB) and pin-killed brood (PKB) assays, may not be as reliable at predicting pest and disease resistance of honey bee colonies (Locke and Fries, 2011; Leclercq et al., 2018a; Wagoner et al., 2021). This may be due to differences in the strength and/or makeup of chemical signals emitted by dead brood (McAfee et al., 2018) compared to those emitted by unhealthy but living brood (Nazzi et al., 2004; Wagoner et al., 2019, 2020). Vairimorpha can infect brood under laboratory conditions (Eiri et al., 2015), but brood infections are detected at extremely low frequencies in the field, with much higher infection levels exhibited in older adults (Smart and Sheppard, 2012; Urbieta-Magro et al., 2019; Jabal-Uriel et al., 2022). Therefore, hygienic behavior assays that assess response to dead brood are unlikely to be effective in selecting for resistance to Vairimorpha and other non-lethal, non-brood-based pathogens.
In response to inconsistencies in the level of disease resistance conferred by necrophoresis-based selection, researchers have highlighted the need for development of an improved hygiene assay, ideally one which employs a chemical stimulus that closely mimics the compounds naturally produced by infested and/or infected pupae (Leclercq et al., 2018a). The same authors point out the need for establishment of resistance thresholds, or stimulus response rates beyond which colony resistance to a particular stressor is achieved (Leclercq et al., 2018b). UBeeO is a novel hygiene-eliciting selection tool that uses synthetic pheromones derived from natural semiochemicals emitted from diseased brood to measure hygienic behavior. Initial studies suggest that high UBeeO colonies, those that score ≥ 60% on UBeeO tests, have significantly lower Varroa loads and higher survival rates compared to low-UBeeO colonies (Wagoner et al., 2021). Despite having a lower resistance threshold, UBeeO outperformed the FKB assay in identifying Varroa-resistant colonies capable of winter survival without mite treatment. While this suggests that UBeeO may be a promising tool for identifying and selecting colonies with superior mite resistance traits, no studies have been performed to test or characterize UBeeO’s ability to predict colony resistance to other important honey bee stressors. In this study, we investigated the relationships between UBeeO scores and eight key pathogens affecting honey bee colony health and survival. Specifically, we compare colony UBeeO scores and the prevalence and load of six viral pathogens, the microsporidian parasite Vairimorpha spp., and the fungus Ascosphaera apis, which causes chalkbrood. For each pathogen in which load and/or prevalence was predicted by the UBeeO assay, we calculated a resistance threshold - a minimum target UBeeO score that breeders should seek to obtain to select colonies more resistant to that specific pathogen. By analyzing these relationships, we provide insight regarding the ability of UBeeO to identify colonies capable of managing pathogen pressures via hygienic behavior. By investigating three case studies in three distinct geographic areas, we test UBeeO’s robustness and applicability across diverse environmental conditions and beekeeping practices. More broadly, this research contributes to our understanding of the mechanisms through which hygienic behavior influences disease resistance and provides valuable insights for the development of targeted management strategies aimed at enhancing honey bee health. By using tools like UBeeO to integrate hygienic traits into breeding programs, beekeepers may significantly improve honey bee colony resistance to a broad spectrum of pathogens, increasing the sustainability of the beekeeping industry and augmenting the contributions of honey bees to crop and natural ecosystem pollination.
2 Materials and methods
2.1 UBeeO testing
UBeeO assays were performed as previously described (Wagoner et al., 2021). Briefly, a brood frame was selected from each colony. A segment of PVC pipe approximately 4 cm in diameter was gently pressed and twisted into an area of capped brood to define the test area. A spray applicator was used to treat the test area with 0.5mL of the UBeeO solution. Frames were returned to the colony for two hours, and then recollected. Photos of the test area were taken at the time of treatment (T0) and after two hours (T2). For each photo, the number of capped cells that fell ≥ 50% inside the test area was counted and recorded. Assay scores were calculated using the equation:
In previous studies that examined the effect of UBeeO assay scores on Varroa mite loads, findings showed a high UBeeO response in colonies that had ≥ 60% manipulated cells (Wagoner et al., 2021). Here, we used this same metric threshold with colonies scoring at or above 60% were classified as hygienic or “high UBeeO”. Colonies scoring below 60% were classified as non-hygienic or “low UBeeO”. However, UBeeO scores from the colonies in the chalkbrood study ranged from 0-46%. Through a visual analysis of the data, we identified 20% as a conservative estimate when chalkbrood infections were reduced and thus, for the chalkbrood analyses, we considered colonies above 20% “high UBeeO”.
2.2 Virus sample collection and quantification
Twenty-one experimental honey bee colonies were established by mid-April 2021 at the research apiary of the University of North Carolina at Greensboro, North Carolina. Experimental colonies included ten unselected colonies purchased in 2021 as packages from Triad Bee Supply in Trinity, NC, one Minnesota Hygienic breeder queen provided in 2021 by Jeff Hull, seven POL queens sent from the breeding program at the USDA Lab at Baton Rouge, LA in 2021 (n = 5) and 2020 (n = 2), and three Russian queens shipped from Mann Lake in 2021. UBeeO tests were performed on each colony in June, no less than 7 weeks post release of caged queens. Live bee samples were collected in August for RNA virus analysis. A 50 mL Falcon tube was gently dragged down the middle of a brood frame until filled with bees, and then capped and frozen at -80°C until analysis.
Before RNA extraction, Varroa mites were removed from samples of 100 worker bees. The bees were ground using a pestle and mortar and a pinch (approximately 10-15 mg) of the crushed material was used to extract RNA. Total RNA was extracted using an established TRIzol™ (Invitrogen, Carlsbad, CA, USA) protocol. Concentration and purity of the extracted RNA samples were measured using a Nanodrop OneC Microvolume UV-Vis Spectrophotometer (Thermo Fisher Scientific, MA, USA). The total RNA concentration was adjusted to 20 ng/µL in molecular grade water (Fisher Scientific, Fair Lawn, NJ, USA) and cDNA was synthesized for each sample using the High-Capacity cDNA Reverse-Transcription Kit (Applied Biosystems, Foster City, CA, USA). Ten µL of the RNA template (200 ng) were added to 10 µL of the provided cDNA master mix, followed by an incubation period as recommended by the manufacturer; 10 min at 25°C, 120 min at 37°C, and 5 min at 85°C. Resulting cDNA solution then diluted 10-fold in molecular grade water to serve as the template in subsequent qPCR. The qPCR was conducted in duplicate using 384-well plates on a QuantStudio™ 6 cycler (Thermo Fisher Scientific). The reactions were performed using unlabeled primers and SYBR Green DNA binding dye (Applied Biosystems) with a volume of 12 µL and the final primer concentrations of 0.4 µM. A positive control of previously known positive sample was run in each plate, RNase-free water was added as template for the “Not Target Control” (NTC) and “No Reverse Transcriptase” (NRT) served as an additional negative control. The quality of the extracted RNA and the efficiency of the PCR reactions were confirmed by amplification of the reference gene RPS5. The thermal cycling conditions were 10 min at 95°C, followed by 40 cycles consisting of a denaturing stage at 95°C for 15 s and an annealing/extension stage at 60°C for 1 min. Fluorescence measurements were taken at the end of each cycle, followed by a final melt curve dissociation to confirm the specificity of the products. Samples were deemed positive for a target when their melting temperature was within 0.5°C of the melting temperature of the positive control. The Cq values were determined at the sample fluorescence threshold (0.03) for all plates, and a Cq value of 35 or lower was recorded as positive amplification. Quantitative RT-PCR was performed to detect and quantify several viruses using previously validated primers including Deformed wing virus (both type DWV-A, and DWV-B), Sacbrood virus (SBV), Black queen cell virus (BQCV), Israeli acute bee paralysis virus (IAPV) and Lake Sinai Viruses (LSV) (Table 1). Finally, virus load in each sample was quantified using the absolute quantification method, based on our standard curves obtained throughout serial dilutions of known numbers of amplicons as described previously (Francis et al., 2013).
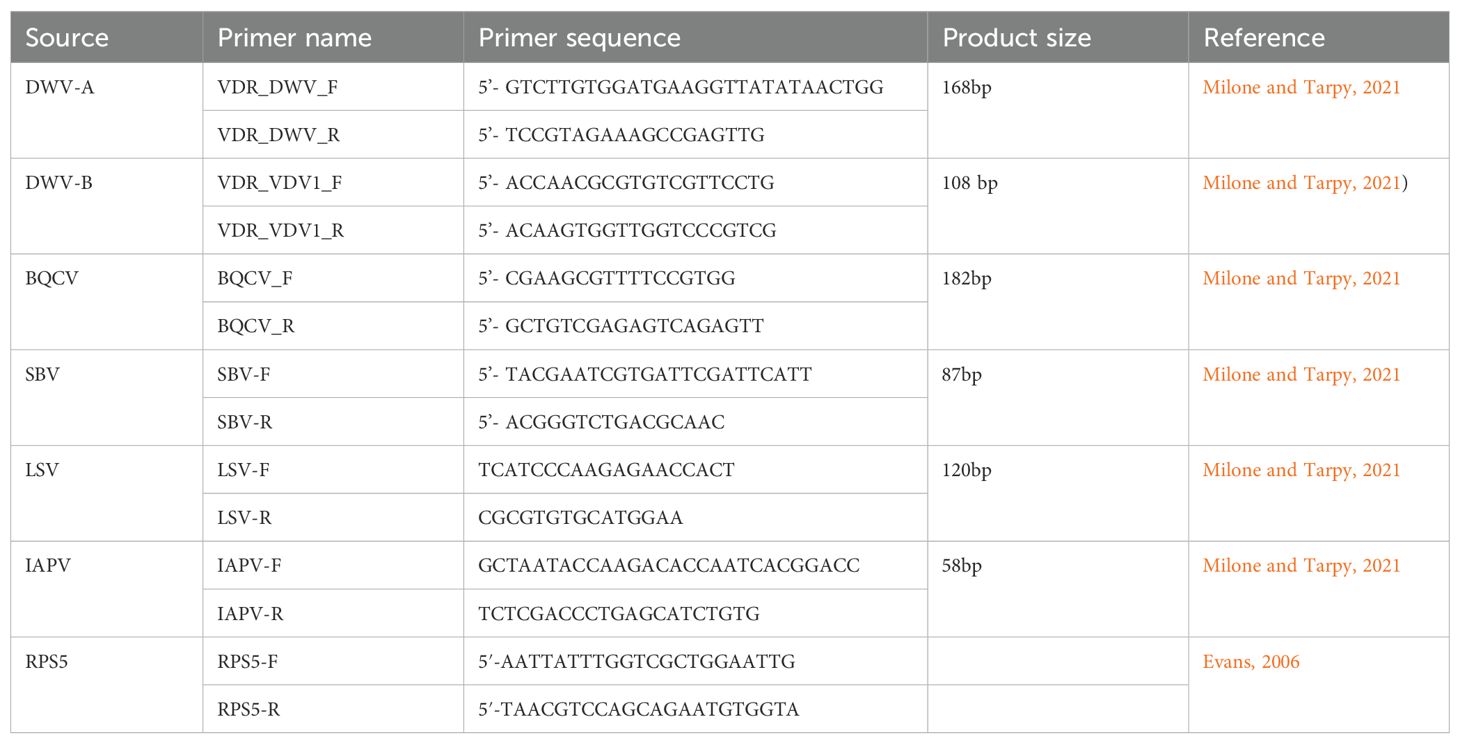
Table 1. Primers used for virus quantification.
2.3 Vairimorpha sample collection and quantification
Colonies were randomly selected to be included in the study across three apiary locations in Vermont: 16 full size colonies located in W. Pawlet VT, 16 full size colonies located in Cornwall VT, and 100 nucleus colonies located in St. Albans VT. Colonies were started in a single 10-frame deep hive body with a medium honey super in May. Honey supers were added throughout the season to accommodate colony population growth. Half of the colonies in Cornwall VT were maintained in one, 8-frame, deep super with medium honey supers and the other half were maintained in horizontal hives containing 8 frames for the brood chamber. UBeeO tests were performed on full production hives in early May to late June and on nucleus colonies in August, no earlier than 6 weeks post requeening. Vairimorpha spp. samples were collected monthly, starting in late-May for full production colonies, early-July for nucleus colonies, until late-September for all colonies. To collect samples for evaluating Vairimorpha spp. infection, a frame from each colony containing brood and nurse bees was shaken into a plastic bin, and approximately 300 bees were scooped into a container filled with 70% ethanol.
To conduct spore counts of Vairimorpha spp., we transferred 100 bees from the ethanol sample to a plastic bag, added 100 mL of distilled water, and pulverized them using a pestle on the outside of the bag for 90 s. The solution was allowed to settle for 45 s, and then 10 µL was transferred onto two haemocytometer counting chambers. We counted spores for each sample twice under 40× magnification, averaged them, and converted to spores per bee (Fries et al., 2013).
2.4 Ascosphaera apis (chalkbrood) sample collection and quantification
Seventy-one colonies were randomly selected for chalkbrood testing from a single breeding apiary of 200 colonies located in Carbrook, Queensland Australia. This apiary is part of a 10-year breeding program aimed at improving hygiene performance and chalkbrood resistance. Sizes of experimental colonies varied in size ranging from four-frame nucleus colonies to 10-frame full production colonies consisting of two deep hive bodies with a deep super. The colonies’ queens were a mix of instrumentally inseminated and open mated. Colonies were founded on either new foundation or gamma irradiated comb. Chalkbrood sampling was conducted during January and February 2023, during the rainy season when colonies were experiencing a nectar dearth and peak chalkbrood prevalence was expected. UBeeO tests were performed during December 2022-February 2023, 0-67 days prior to chalkbrood sample collection. Since UBeeO scores are found to be more accurate during a nectar flow (Wagoner, unpublished), supplemental feed of 50% sucrose was provided to each colony 24 hours before and during the UBeeO test.
During each chalkbrood sampling event, individual frames of each colony were inspected visually for chalkbrood. Data were collected on the number of frames containing brood and chalkbrood-infected brood. When chalkbrood was observed, the total number of cells containing white chalkbrood was counted in each colony. Chalkbrood infected larvae will transition from white to a gray-black color during its spore producing state. To collect data on the severity of chalkbrood infection, the total number of cells containing spore-producing gray-back larvae were also counted in each colony.
2.5 Data analysis
All data analyses were conducted in R (v4.2.3) (R Core Team, 2021) All mixed models were constructed using the LME4 package (Bates et al., 2015). Significance for all main effects and interaction terms was determined by conducting type II Wald chi-square tests using the “Anova” function in the CAR package (v3.1-0) (Fox and Weisberg, 2019). Prevalence was derived from presence/absence data and describes the proportion of bees or colonies that are positive for a given pathogen. This was calculated by dividing the total number of infected by the total sample size for each experimental group. For all pathogens, “load” or “average load” is used to describe the quantity of individual pathogens (cells/spores/virions) per bee or colony depending on the scenario.
To test if the prevalence and load of six viruses (DWV-A, DWV-B, SBV, BQCV, IAPV, and LSV) were correlated with UBeeO score, while accounting for possible non-independence of the viruses, we first conducted a series of three MANCOVAs using the “manyglm” function in the MVABUND package (v4.2.1) (Wang et al., 2012). The three MANCOVAs tested virus load as a function of UBeeO score and virus load and prevalence as a function of a discretized (“high”, “low”) UBeeO variable based on a published threshold of 60% response (Wagoner et al., 2021). Continuous data were log-transformed to fit a gaussian distribution and the binary response model used a binomial distribution. For all three models, we used an unstructured correlation matrix in the model, which does not assume independence between response variables and included Varroa load as a covariate to account for any correlation with a potential vector.
After verifying a significant effect of UBeeO score on the virus response variables and no effect of Varroa in our multivariate analysis, we then repeated these analyses using a univariate approach to examine the patterns exhibited by each virus independently. For both prevalence and load, separate models were created for each virus. For virus prevalence we tested a binary response variable (presence = 1, absence = 0) using a generalized linear model (GLM) with a binomial distribution and a link “logit” function. The binary UBeeO variable was the only predictor in each model. A similar model structure was used for virus load data (genome copies/ul) with the exception that a gamma distribution was used instead of the binomial distribution. We also examined virus load on a continuous UBeeO scale. For each virus, we conducted a separate linear model. Virus load data were log10-transformed with continuous UBeeO score as the only predictor in each model. Significance for UBeeO score was assessed by conducting type II Wald chi-square tests using the “Anova” function in the CAR package (v3.1-0) (Fox and Weisberg, 2019).
For Vairimorpha, we tested prevalence and load between high and low UBeeO testing colonies. For Vairimorpha prevalence we examined a binary response variable (presence = 1, absence = 0) using a generalized linear mixed model (GLMM) with a binomial distribution and a link “logit” function. The binary UBeeO variable, month (June-September) and their interaction effect were used as predictors with apiary yard as a random control variable. The same model structure was used for the Vairimorpha load data. Because Vairimorpha load was skewed right, a Gamma distribution was used with a link “log” function. To identify significant UBeeO results over the four months of the study, we conducted pairwise comparisons on significant variables using the MULTCOMP package (Hothorn et al., 2008). In addition to testing disease response as a function of a binary UBeeO variable, we examined Vairimorpha load’s response on a continuous UBeeO scale. Data from all months were pooled. We constructed a GLMM with Vairimorpha load modeled using a Gamma distribution with a link “log” function. UBeeO assay score (manipulated cells/total cells), month, and their interaction term were used as predictors. Apiary site was included as a random control variable. Significance of all models was assessed by conducting type II Wald chi-square tests using the “Anova” function in the CAR package (v3.1-0) (Fox and Weisberg, 2019).
To determine if the number of chalkbrood cells and spore type (white and black) in a colony were influenced by UBeeO score, we conducted a GLM with chalkbrood spore count as a function of chalkbrood type, UBeeO score, and their interaction term. As chalkbrood spore count was right-skewed integer count data, a Poisson distribution was used with a link “log” function. To examine how chalkbrood prevalence and load were influenced by spore type and UBeeO score we constructed two models. For the prevalence data we fit a binomial GLM with a link logit function, and for the load data, we fit a gaussian distribution. We modeled binary chalkbrood as a function of spore type, discretized UBeeO score (> 20% = High; < 20% = Low), and their interaction term.
After analyzing pathogens either using a 60% threshold (Wagoner et al., 2021) or 20%, in the case of chalkbrood, we wanted a unified approach to further refine UBeeO score thresholds that confer pathogen resistance for each significant pathogen. We used change point analysis implemented in the MCP (Multiple Change Point) package in R (Lindeløv, 2020). This methodology, traditionally used for identifying changes of regime in time-series data, is ideally suited for determining UBeeO thresholds (hereafter called “resistance thresholds” or “thresholds”) where the processes underlying a dataset have changed resulting in a differential response of the dependent disease variable. We identified resistance thresholds for six pathogens that demonstrated significant inverse relationships with UBeeO score: DWV-A, DWV-B, IAPV, LSV, Vairimorpha, and chalkbrood. In a previous paper, the Varroa threshold was identified to be 60% (Wagoner et al., 2021). Using MCP, we analyzed the Varroa data set from that study as a benchmark for this new methodology.
For all variables, missing data were removed from the analysis. For Vairimorpha, chalkbrood, and the viruses, which were all integer count data, we fit a Poisson model. Varroa count was an average of multiple counts and as such, was not an integer value. However, since Varroa load is naturally count data, Varroa load was rounded and also fit with a Poisson distribution. For all seven pathogens, raw scatter plots of pathogen load by UBeeO score indicated an underlying shelf or two plateau structure. As such, the MCP algorithm was passed a two-segment model. All models were run for 100,000 iterations. The change point estimate, upper and lower error boundaries, and scatter plot with posterior distributions and test segments were recorded. A more detailed account of the change point analysis along with additional model structures, underlying distributions, and resultant figures may be found in the supplementary material (Supplementary Material S1-S2).
Using these pathogen-specific resistance thresholds, we re-evaluated whether UBeeO status (high or low) predicted the prevalence and load of each pathogen. All prevalence and load comparisons were repeated using the same model structures and methods. For all pathogens, only the cutoff value between high and low UBeeO score was changed from previous analyses using the threshold values found in Table 2. We then determined whether the new threshold led to an increase or decrease in significance for each pathogen. As a benchmark, we included Varroa prevalence and load results (Wagoner et al., 2021) in this comparison with both original and our newly computed threshold. Varroa count data were analyzed using a glm fit with a Poisson distribution. Prevalence data were fit with a binomial distribution. As with all other models, significance was assessed by conducting type II Wald chi-square tests using the “Anova” function in the CAR package (v3.1-0) (Fox and Weisberg, 2019).
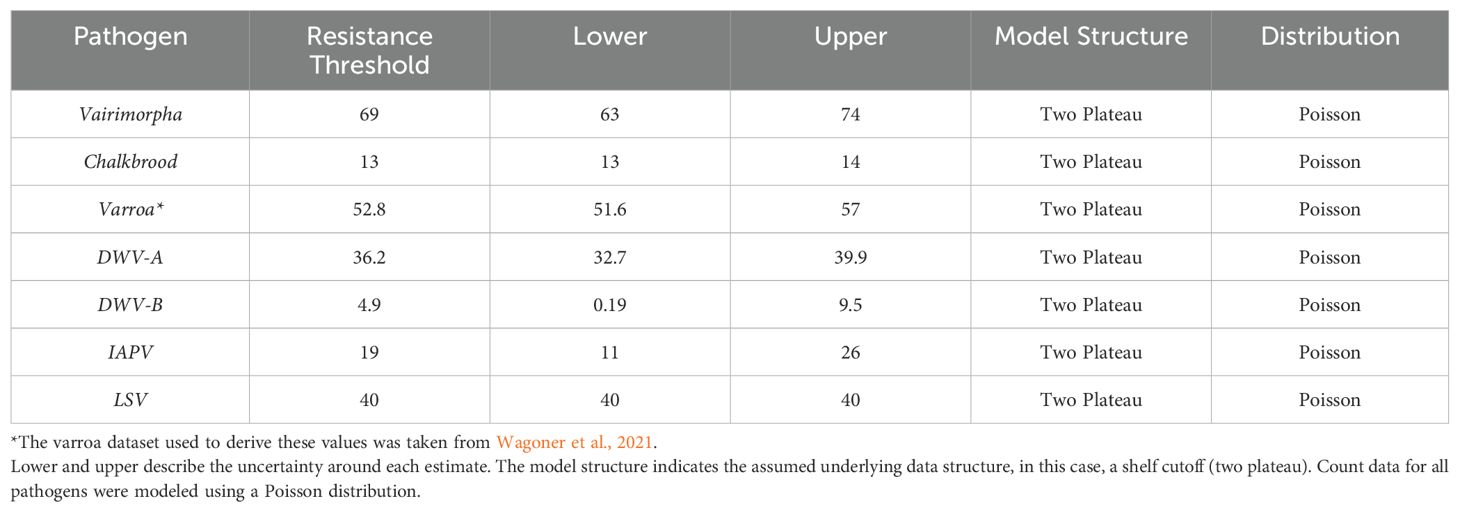
Table 2. The resistance thresholds for the six pathogens that significantly decreased with increasing UBeeO scores in our study.
3 Results
3.1 Virus prevalence and load
All six viruses searched for were detected in the investigated colonies. When examining the relationship of these viruses and UBeeO within a multivariate framework, we found that virus load decreased with increasing UBeeO score (p < 0.001) but was unaffected by Varroa load (p = 0.213). 31.8% of variance was explained by the model. Likewise, for virus prevalence and virus load, we found that high UBeeO colonies were lower than low UBeeO colonies (load, p = 0.033; prevalence, p = 0.044). No effect of Varroa load was detected in either model (p > 0.269). Examining the viruses individually we found several notable patterns that lead to these relationships. Compared to low UBeeO colonies, high UBeeO colonies had lower prevalences of two RNA viruses (DWV-B, p < 0.01; LSV, p < 0.01) with DWV-B not being detected in high UBeeO colonies. For the remainder of the viruses (DWV-A, SBV, BQCV, and IAPV), there was no significant difference in virus prevalence between high and low UBeeO colonies. Compared to low UBeeO colonies, high UBeeO colonies had significantly lower loads for three viruses: DWV-A (p < 0.05), DWV-B (p < 0.01), and IAPV (p < 0.01). Virus loads of SBV, BQCV, and LSV did not differ between high and low UBeeO colonies (Figure 1). For four of the viruses, significant negative correlations were found between virus load and UBeeO score (DWV-A, p = 0.011; DWV-B, p = 0.0002; IAPV, p = 0.007; LSV, p = 0.0004, Figure 2).
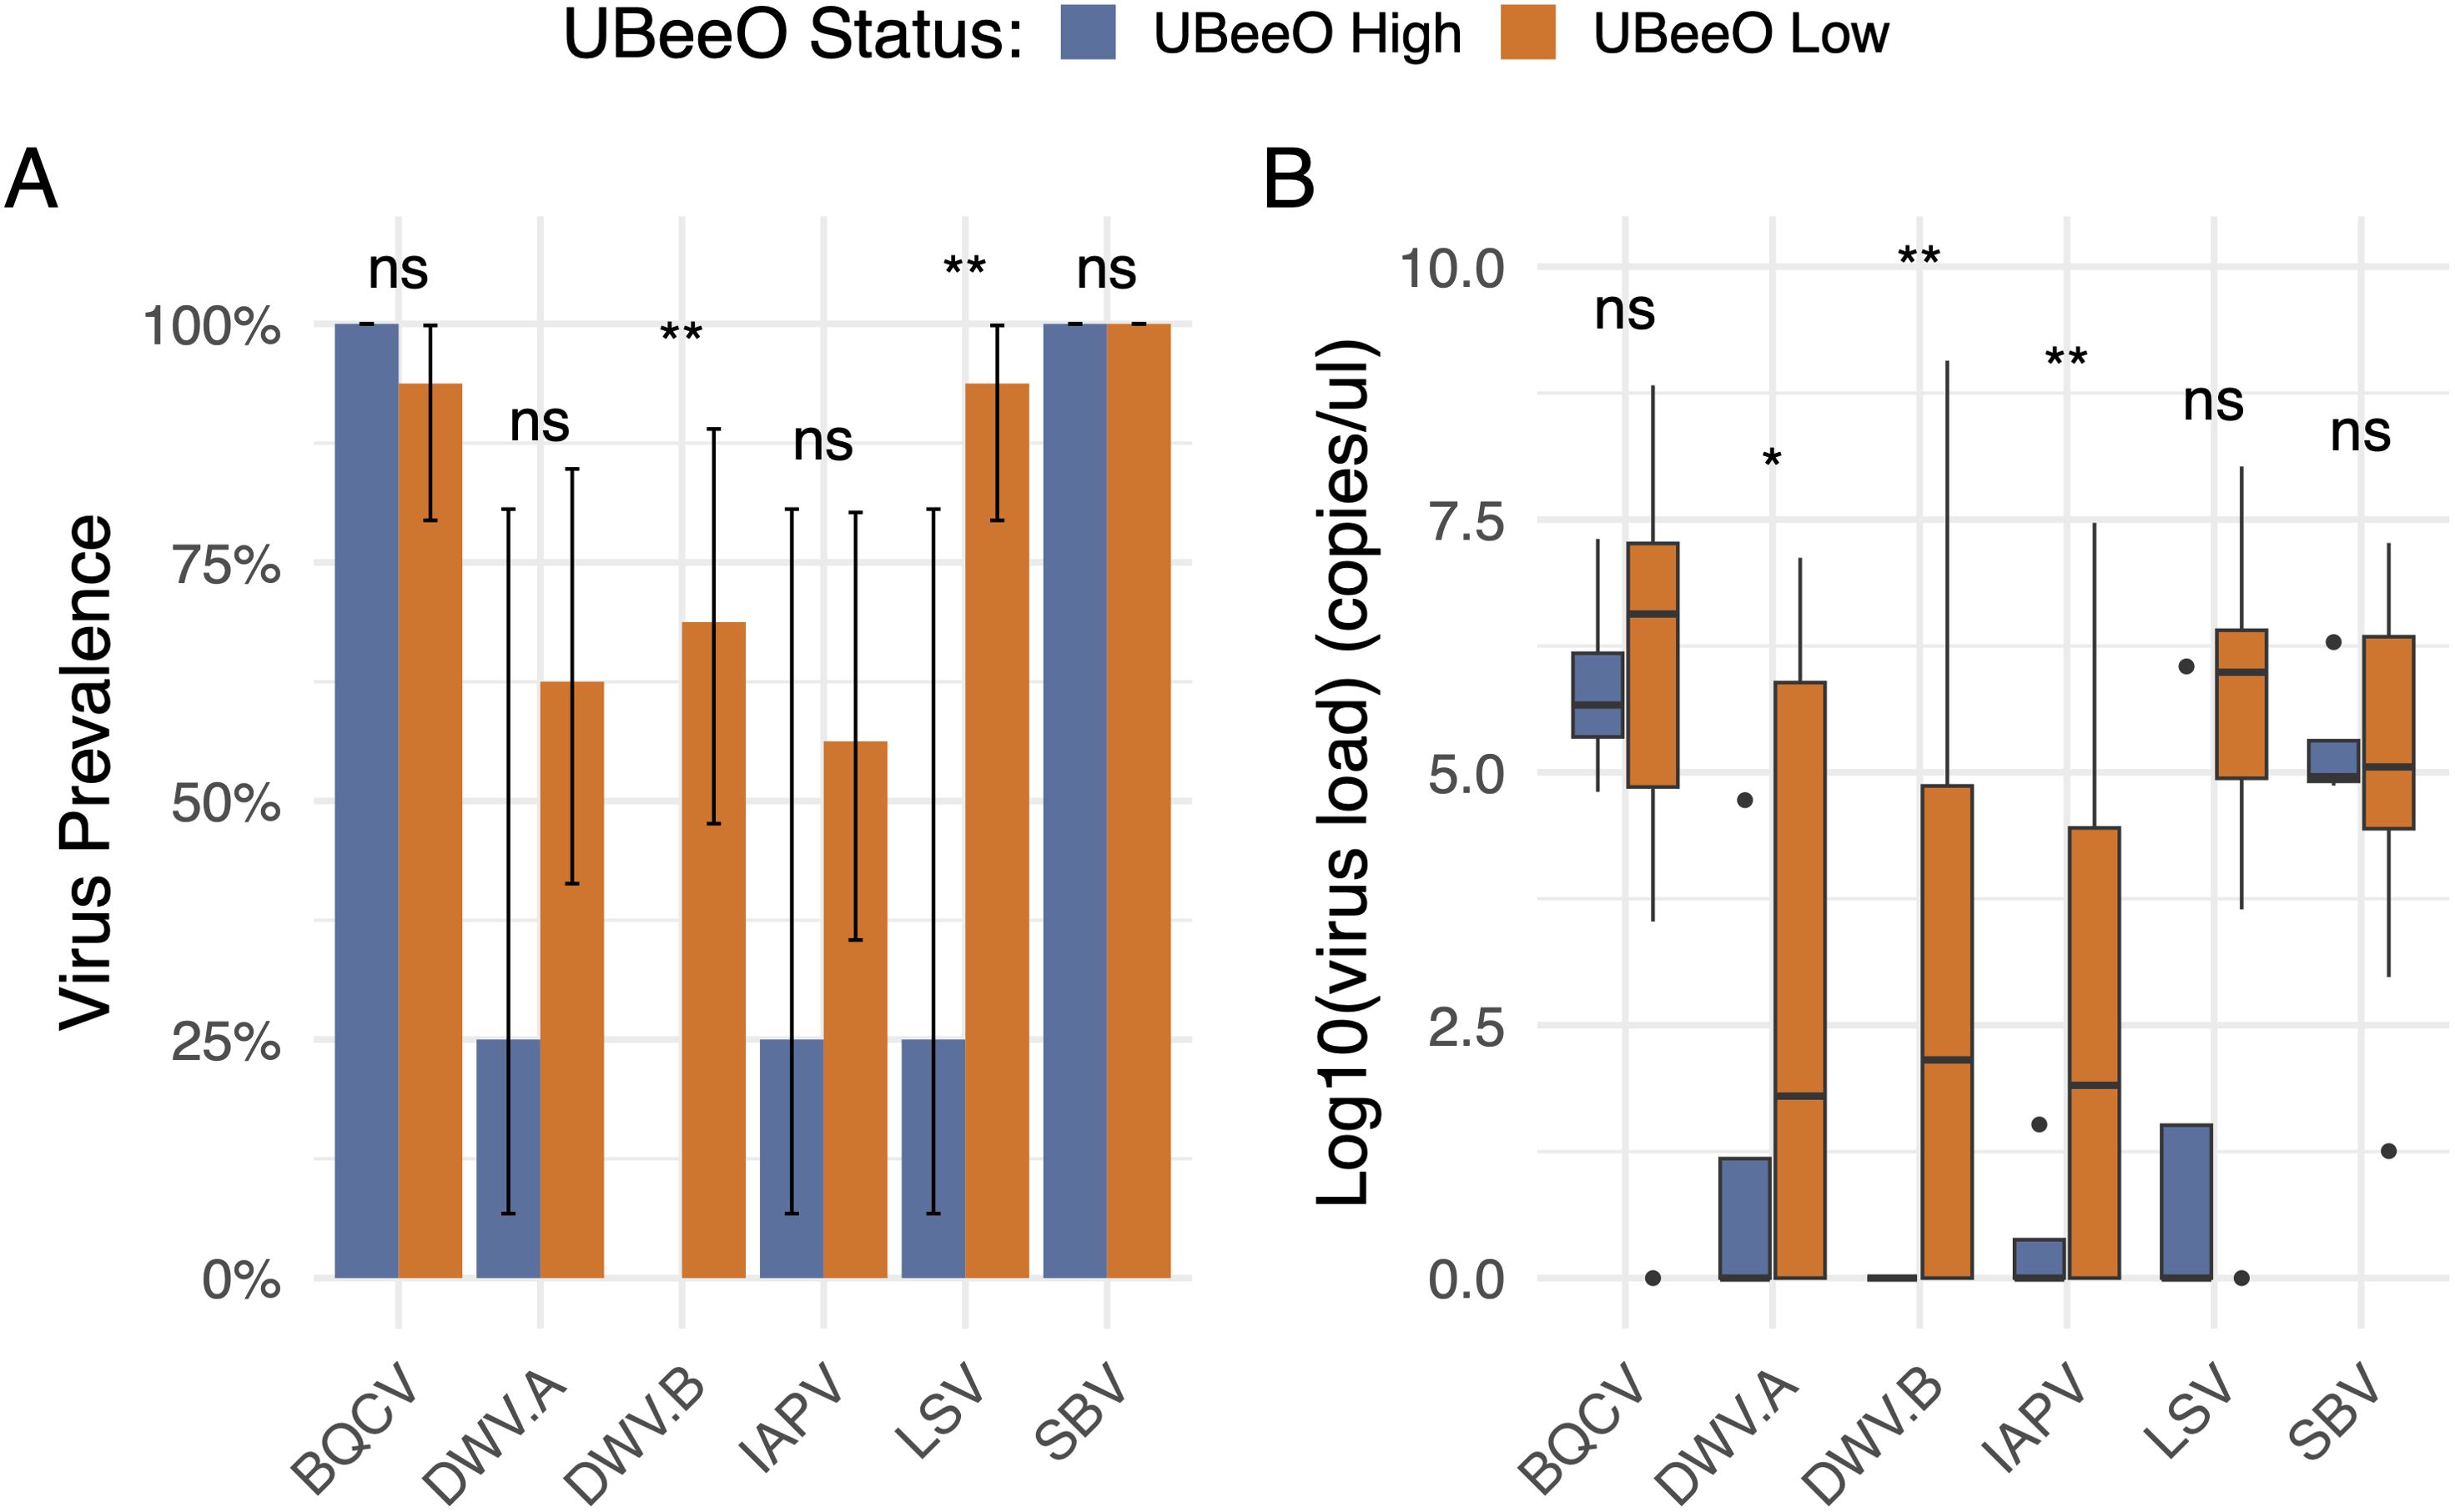
Figure 1. Prevalence and load of 6 honey bee viruses by UBeeO status (high and low, represented by blue and orange, respectively). Significance level is shown above the bars, with one asterisk indicating p < 0.05, two asterisks indicating p < 0.01 and “ns” representing non-significant comparisons. (A) Virus prevalence represents the percent of samples in which virus was detected. Error bars represent a confidence interval generated by sampling from a binomial distribution parameterized by the number of infected (1) and uninfected (0) colonies for each virus and UBeeO group. (B) Virus load represents genome copies/bee and was log10 transformed. Horizontal black lines represent the median. Black dots represent outliers.
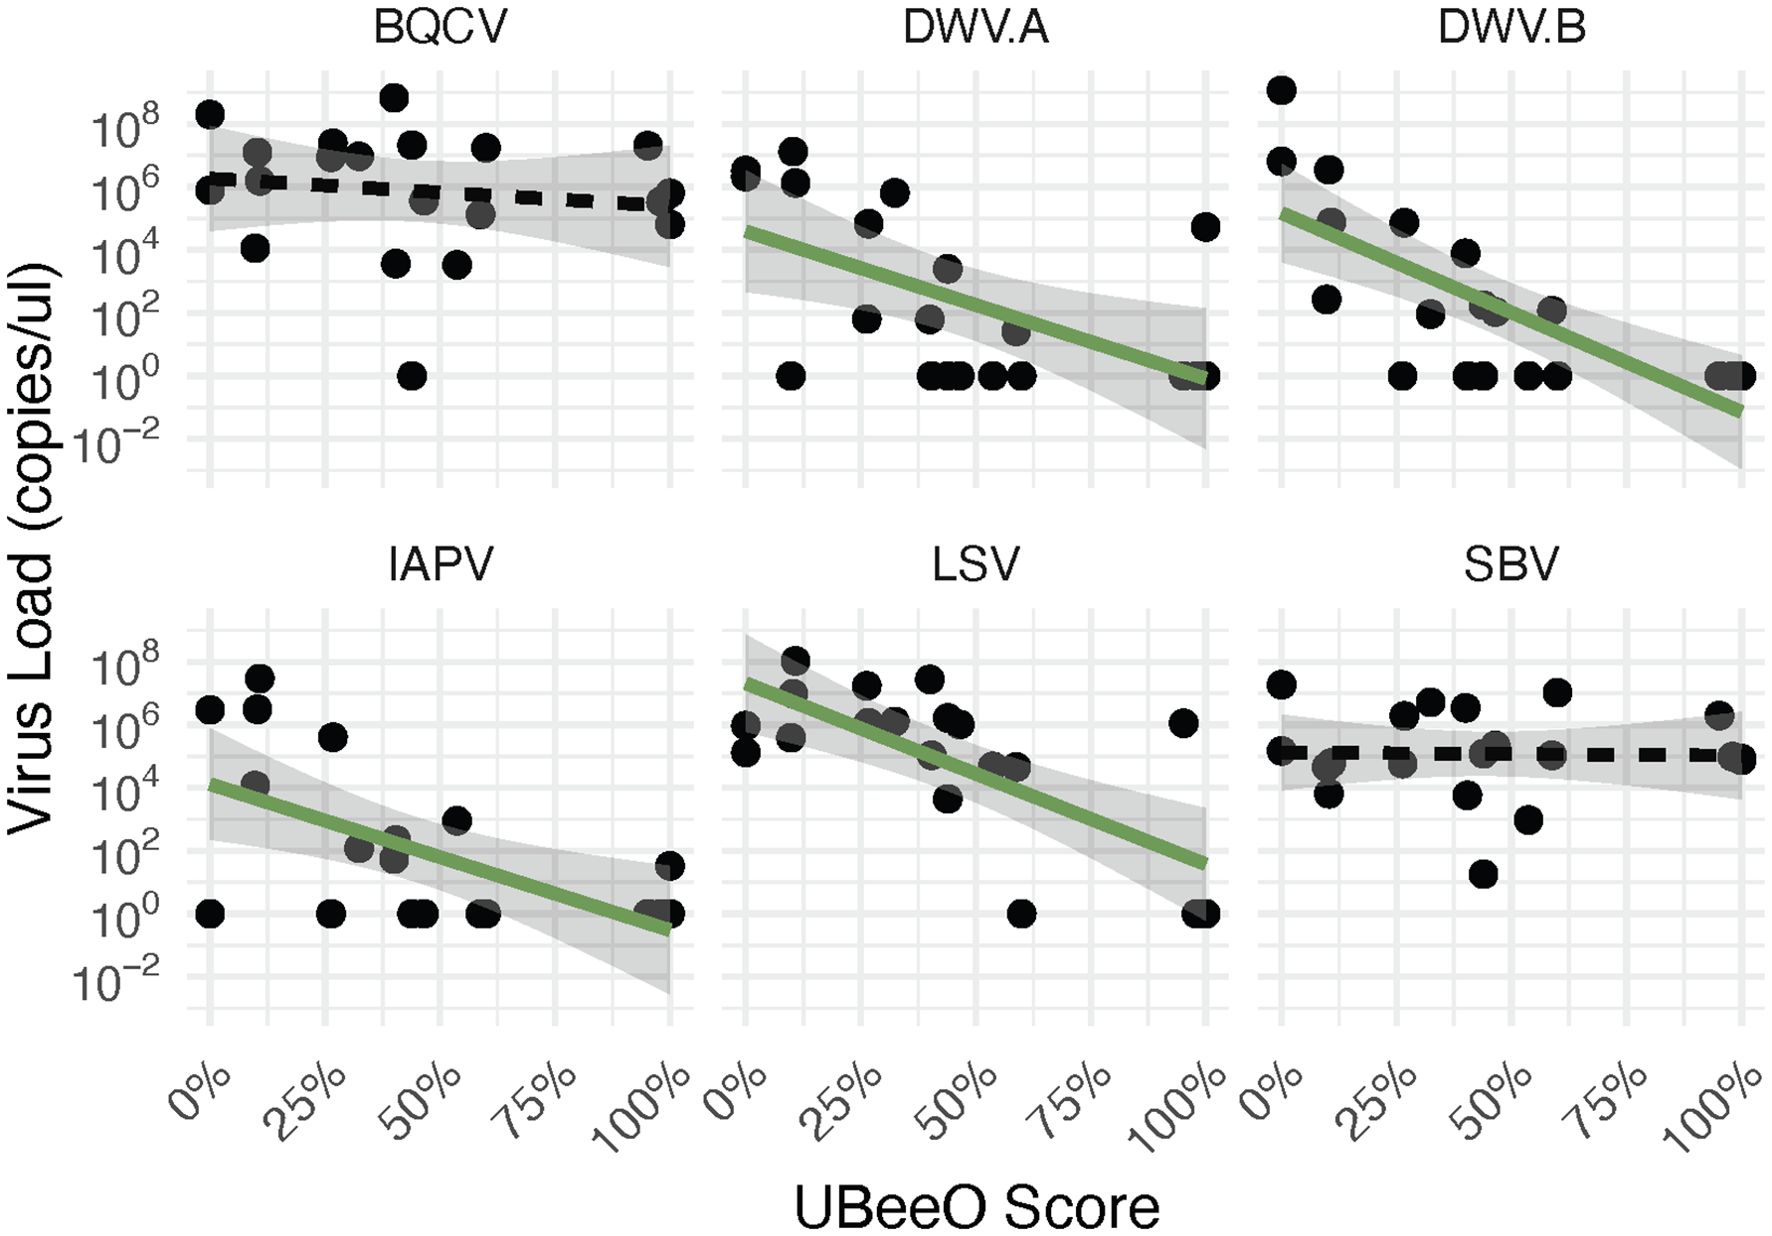
Figure 2. Virus load (genome copies/bee) by UBeeO score for 6 honey bee viruses. Significant (green solid) and non-significant (black hatched) regression lines represent the line of best fit generated by a linear model. Shaded regions indicate a 95% confidence interval for each virus. No significant effect of UBeeO score was found for BQCV and SBV (p > 0.54). For the other four viruses, load decreased significantly with increasing UBeeO score (DWV-A (p = 0.011); DWV-B (p = 0.0002); IAPV (p = 0.007); LSV (p = 0.0004)).
3.2 Vairimorpha prevalence and load
Varimorpha prevalence ranged from 4.8% - 81.8% across all colonies and months, peaking in July and decreasing throughout the remainder of the season. Vairimorpha prevalence did not differ between high and low UBeeO colonies (p = 0.74). However, Vairimorpha load was significantly lower in high UBeeO colonies (p < 0.0001) and decreased more quickly over time (p = 0.002) once loads reached a threshold of 105 spores/bee (Figure 3). For high UBeeO colonies, load peaked in July and steadily decreased through September. For low UBeeO colonies, load peaked in August and declined by September. Additionally, there was a significant negative correlation between Vairimorpha load and UBeeO score (p < 0.0001, Figure 4, Supplementary Figure 6).
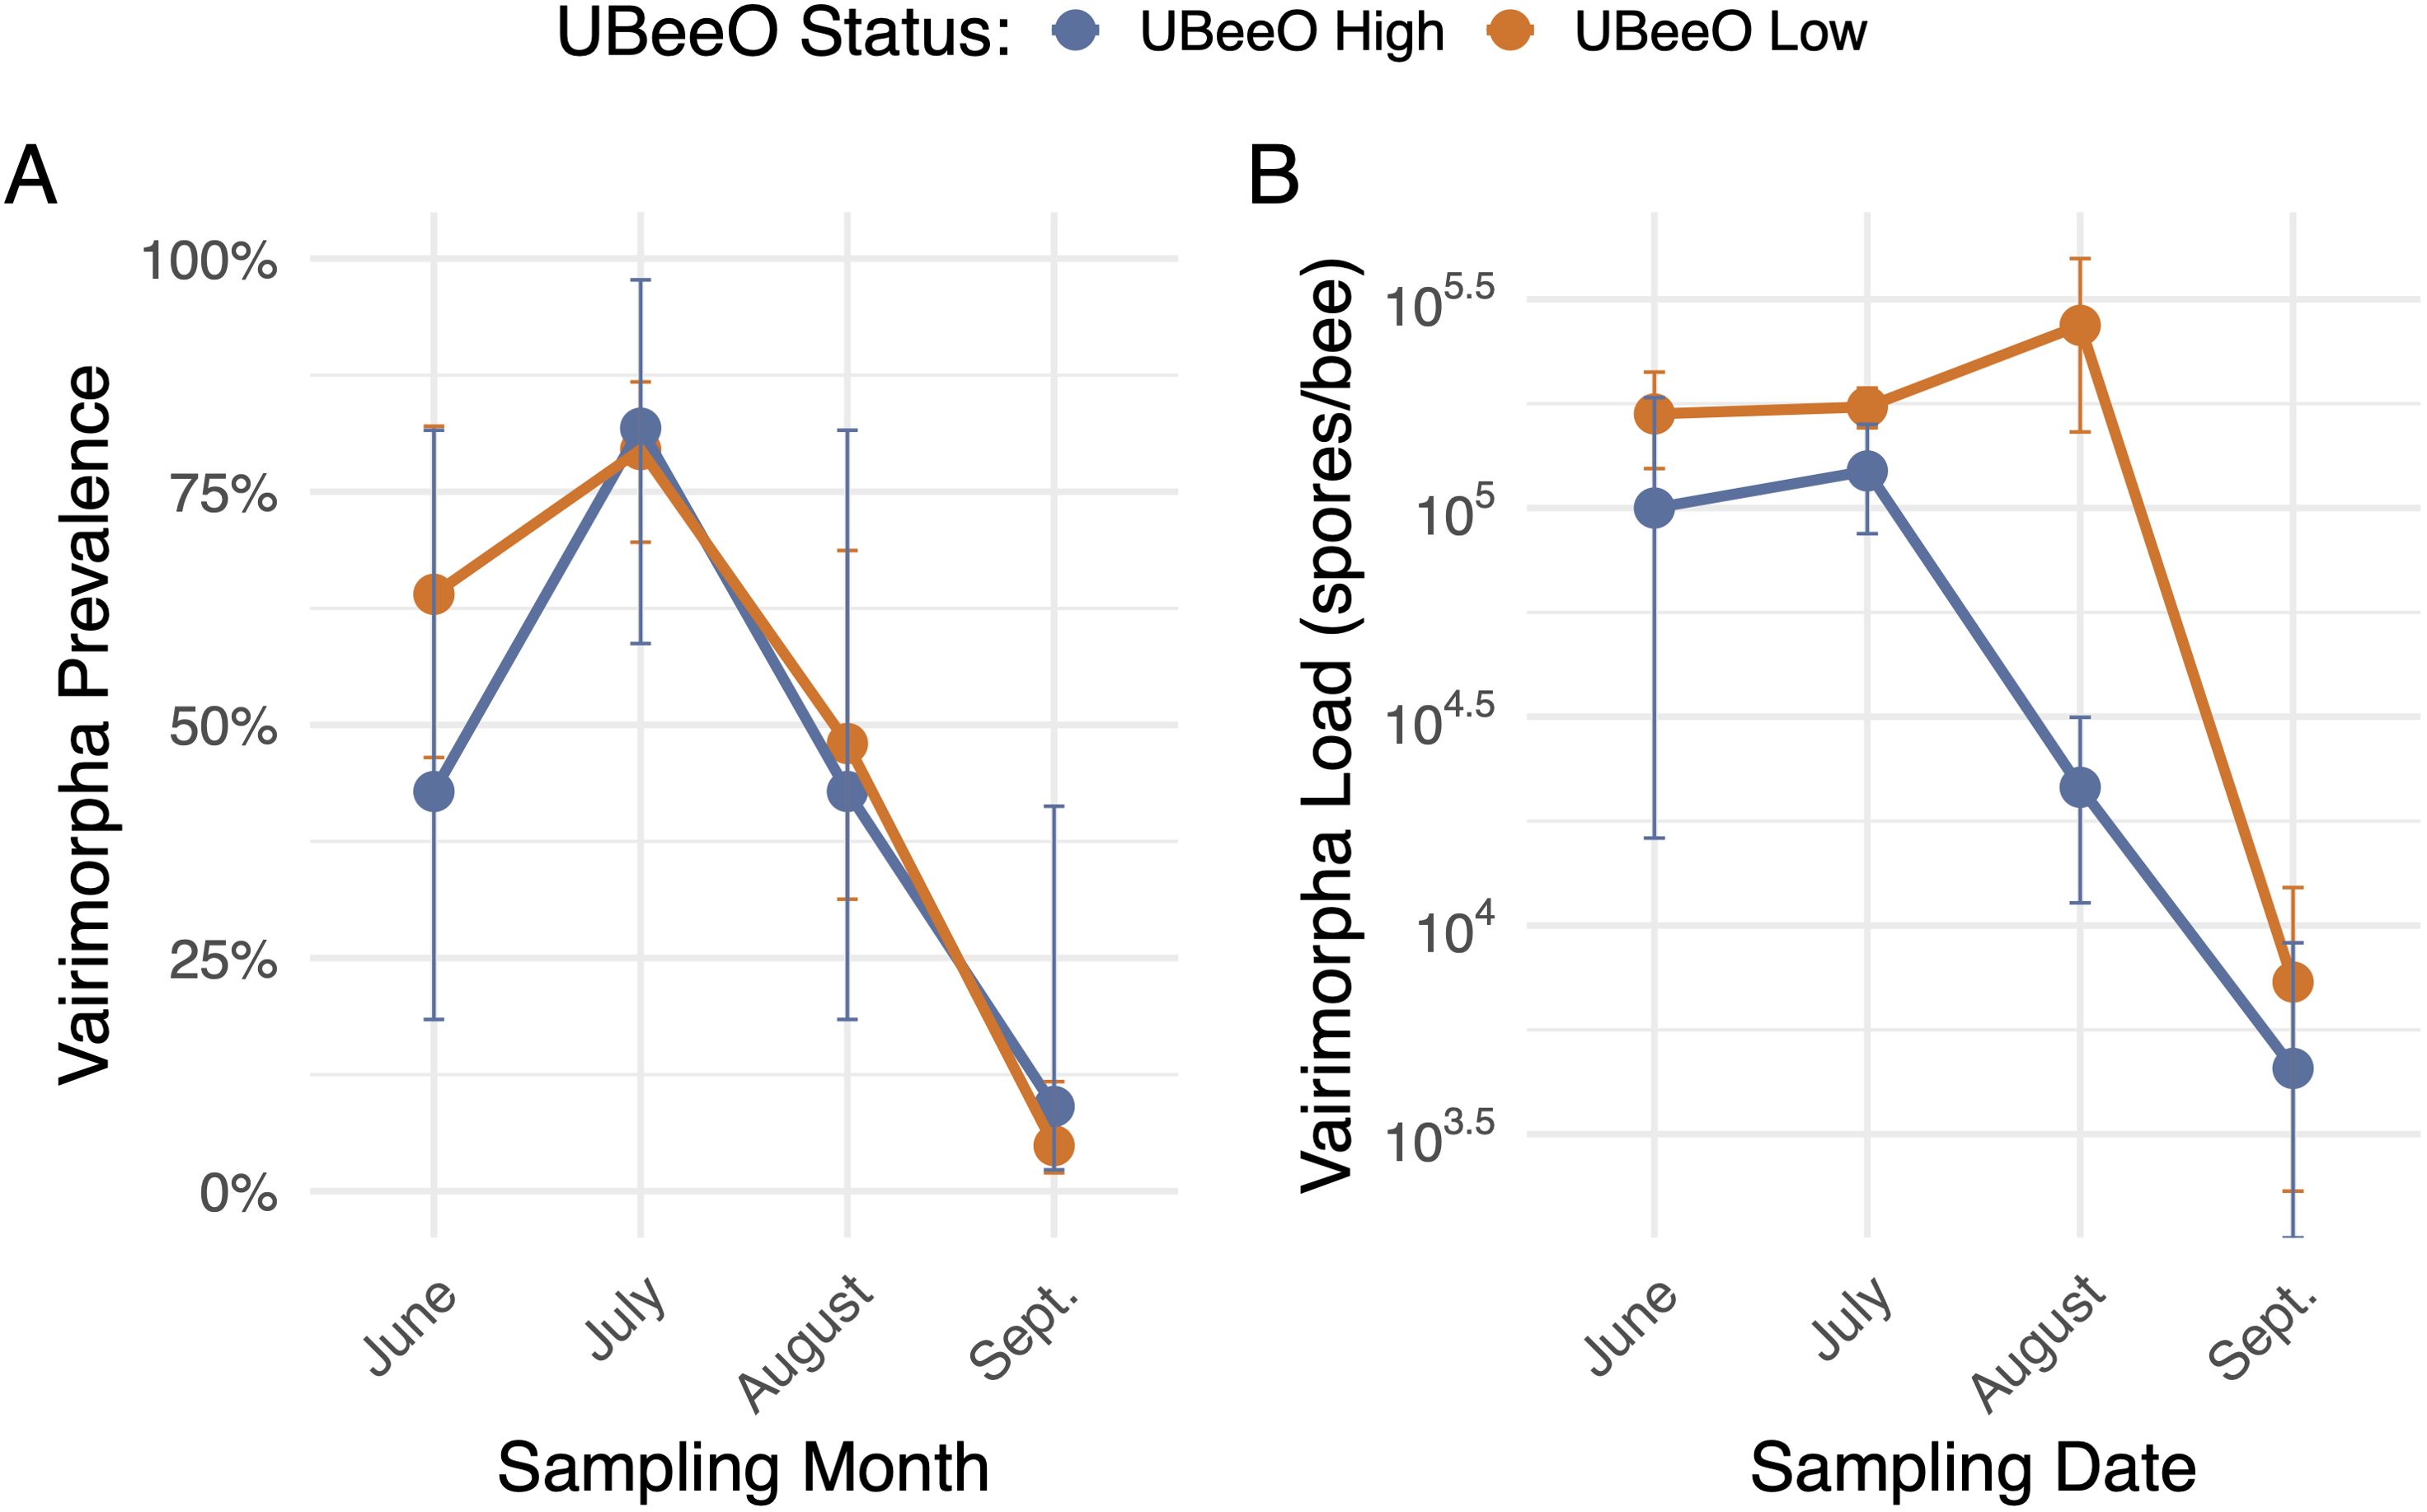
Figure 3. Vairimorpha prevalence and load by month for high UBeeO high (≥60%, blue) and low UBeeO (<60%, orange) colonies. (A) Vairimorpha prevalence (infected colonies/total colonies) by UBeeO score over time (month). Error bars represent a confidence interval generated by sampling from a binomial distribution parameterized by the number of infected (1) and uninfected (0) colonies for each UBeeO group at each month. Vairimorpha prevalence did not differ between UBeeO status (p = 0.74) (B) Vairimorpha load (spores/bee) by UBeeO score over time (month). Error bars represent standard error. Vairimorpha load was significantly higher in low UBeeO colonies (p < 0.0001) and on average decreased more slowly over time (p = 0.002).
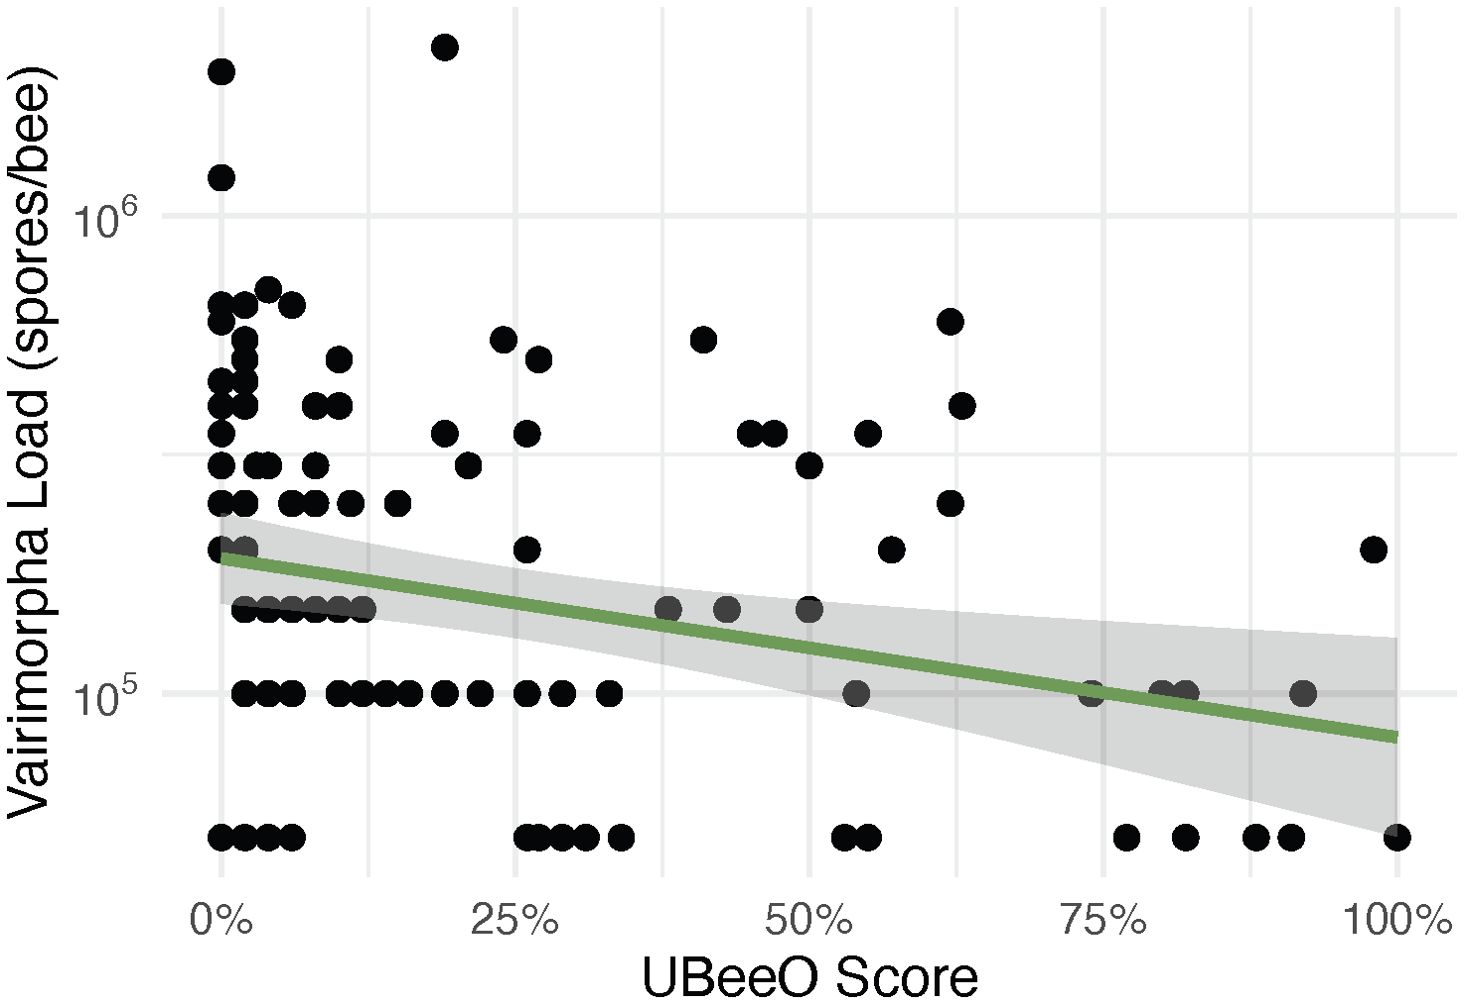
Figure 4. Vairimorpha load (spores/bee) for all months (June-September) by percent UBeeO score. Green regression line represents the line of best fit generated by a linear model. Vairimorpha load decreased significantly as UBeeO score increased (p < 0.0001). The shaded region indicates a 95% confidence interval around the regression line.
3.3 Ascosphaera apis (chalkbrood) prevalence and intensity
Overall, chalkbrood prevalence was 30.9%. High UBeeO colonies (> 20% = High; < 20% = Low) (n = 5) had a chalkbrood prevalence of 20% while low UBeeO colonies (n = 66) had a prevalence of 31.8%. When we examined only black spores, prevalences for high and low UBeeO colonies were 0% and 15.2%, respectively. However, there were no significant differences in prevalence between high and low UBeeO colonies (p = 0.388). Average load was 4.79 cells/colony and ranged in intensity from 0 - 163 cells/colony. Chalkbrood load decreased significantly as UBeeO score increased (p = 0.01) with black spores being significantly less numerous in high UBeeO colonies (p < 0.0001). A significant interaction term between spore type and UBeeO score indicated that slopes differed significantly based on spore type (p = 0.0004, Figure 5).
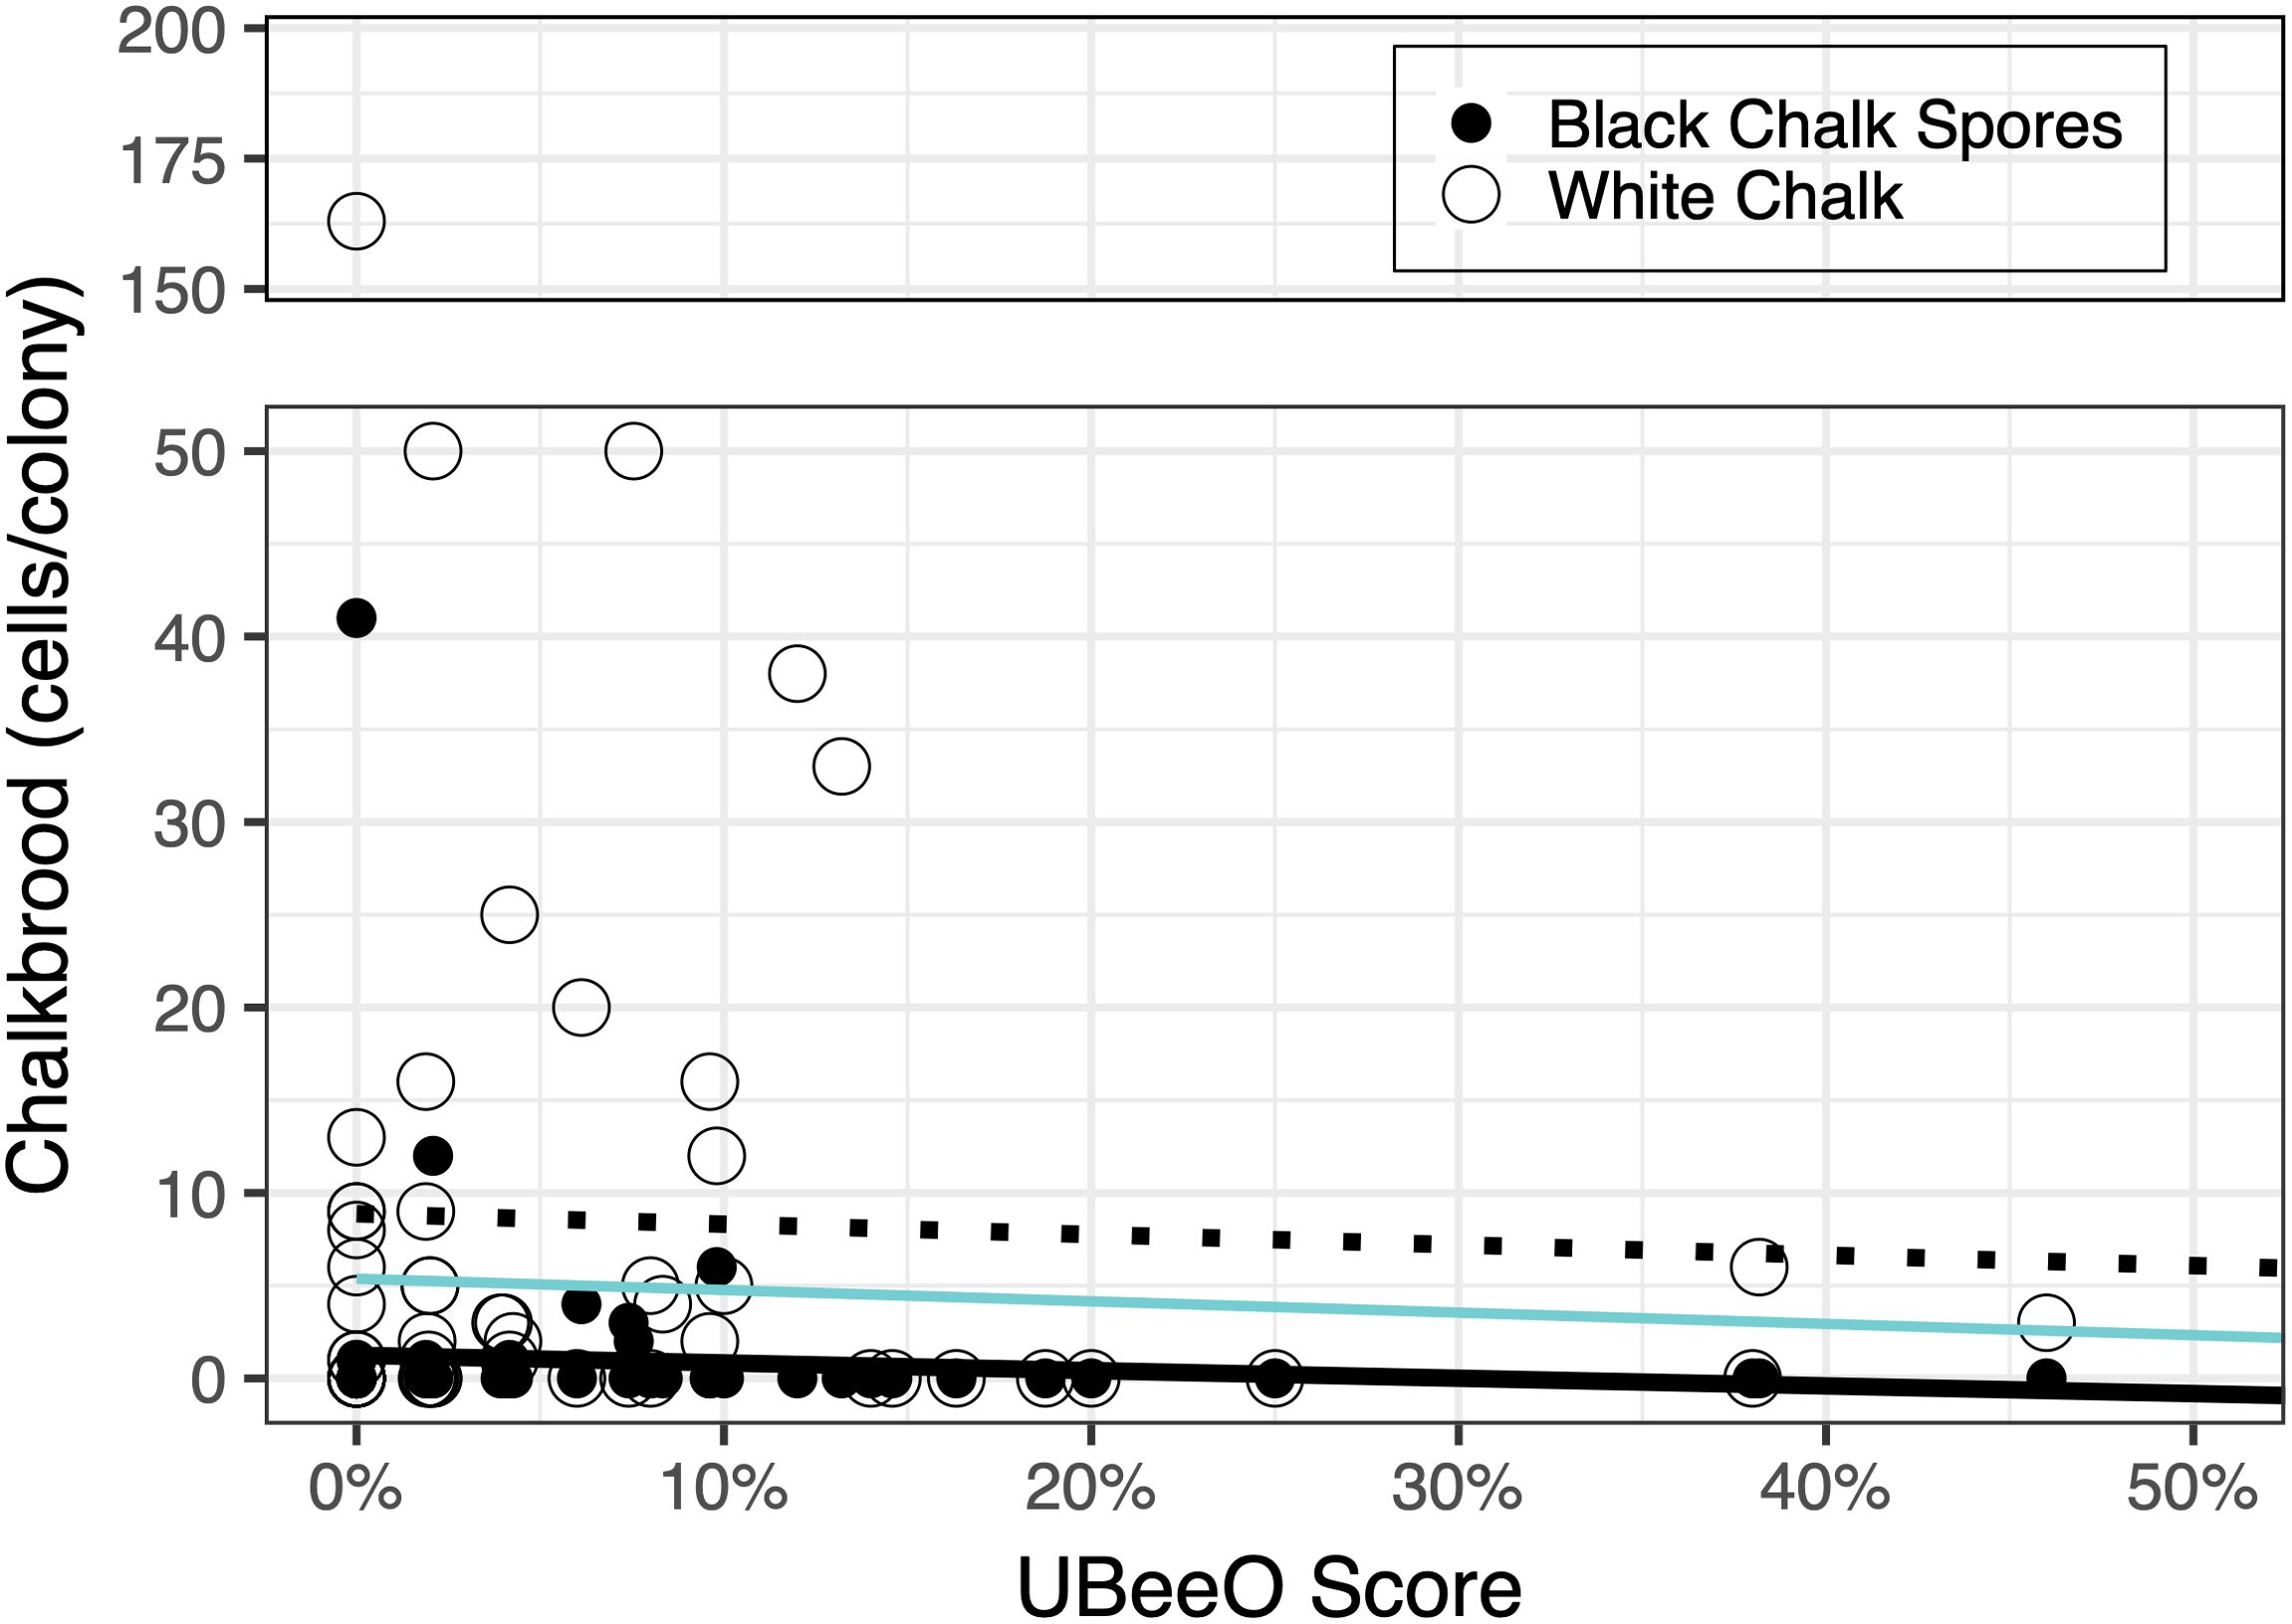
Figure 5. Chalkbrood load as a function of UBeeO score and spore type. Each marker represents one colony. Black and white markers indicate black (infective) and white chalkbrood spores, respectively. The black solid line and hatched line represent lines of best fit for black spores and white spores, respectively. The blue line represents the line of best fit for all spores, regardless of type. Chalkbrood decreased significantly as UBeeO score increased (p = 0.01) with black chalk spores being significantly less numerous in high UBeeO colonies (p < 0.0001).
3.4 Resistance thresholds
The resistance threshold estimates for RNA viruses were as follows: DWV-A: 36.2%, (lower: 32.7%, upper: 39.9%); DWV-B: 4.9%, (lower: 0.19%, upper: 9.5%); IAPV: 19%, lower: (11%, upper: 26%); and LSV: 40%, (lower and upper: 40%). The resistance threshold estimate for Vairimorpha was 69% (lower: 63%, upper: 74%). The resistance threshold estimate for chalkbrood was 13% (lower: 13%, upper: 14%) (Table 2, Figure 6).
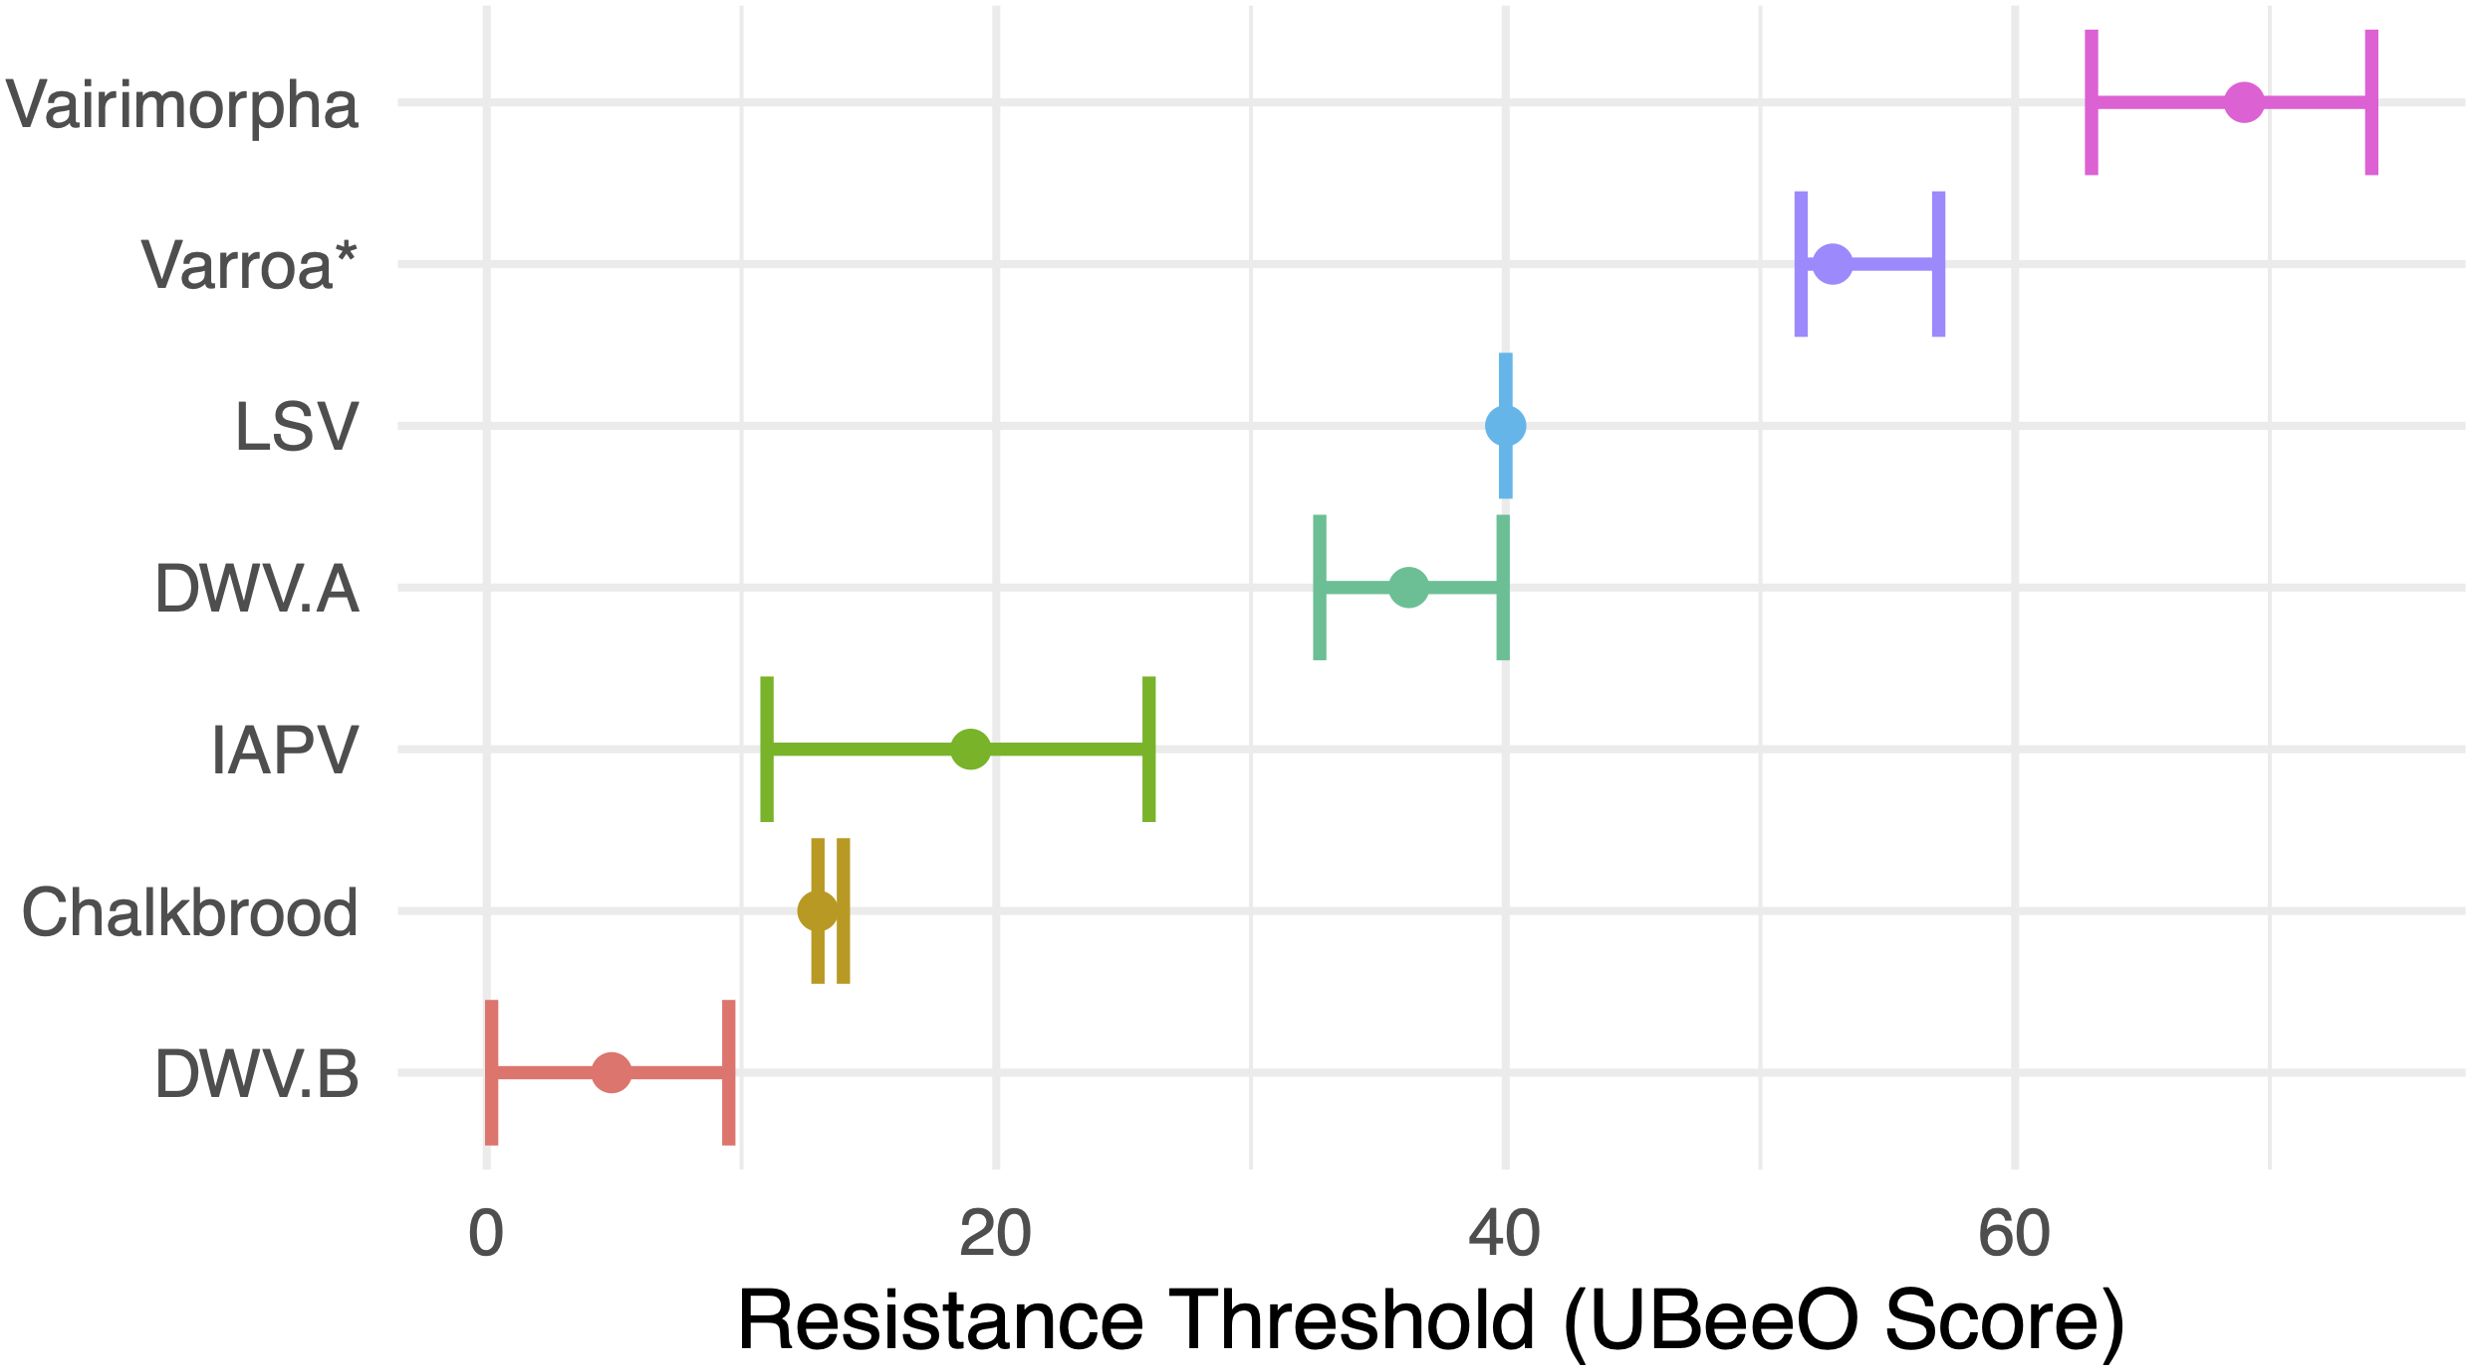
Figure 6. The resistance thresholds for seven honey bee stressors computed using changepoint analysis. The y axis represents UBeeO score in percent. Points represent the estimate for the resistance threshold. Error bars represent a 95% confidence interval.
When using pathogen-specific thresholds, we found the prevalence of Varroa, DWV-A, and LSV significantly decreased in high UBeeO colonies (p = 0.01; p = 0.01; p = 0.02). No effect of disease prevalence was found for Vairimorpha, chalkbrood, DWV-B, or IAPV (p > 0.06). The loads of Vairimorpha, Varroa, DWV-A, DWV-B, IAPV, and LSV significantly decreased in high UBeeO colonies (p < 0.0001; p < 0.0001; p = 0.0001; p = 0.0004; p = 0.002; <0.0001). No effect was found for chalkbrood load (p = 0.16) (Table 3). When comparing high and low UBeeO significance between our original threshold values (60% or 20%) and the newly computed pathogen-specific resistance thresholds, we found that for both load and prevalence the majority of pathogens increased in significance (lower p-values) with the introduction of the new thresholds (Table 3). Out of seven pathogens, analyzed for both prevalence and load (14 models total), 11 out of 14, 78.6%, increased in significance or had no change while only 21.4% decreased in significance. 100% of the load models exhibited increased significance or exhibited no change when pathogen-specific thresholds were introduced.
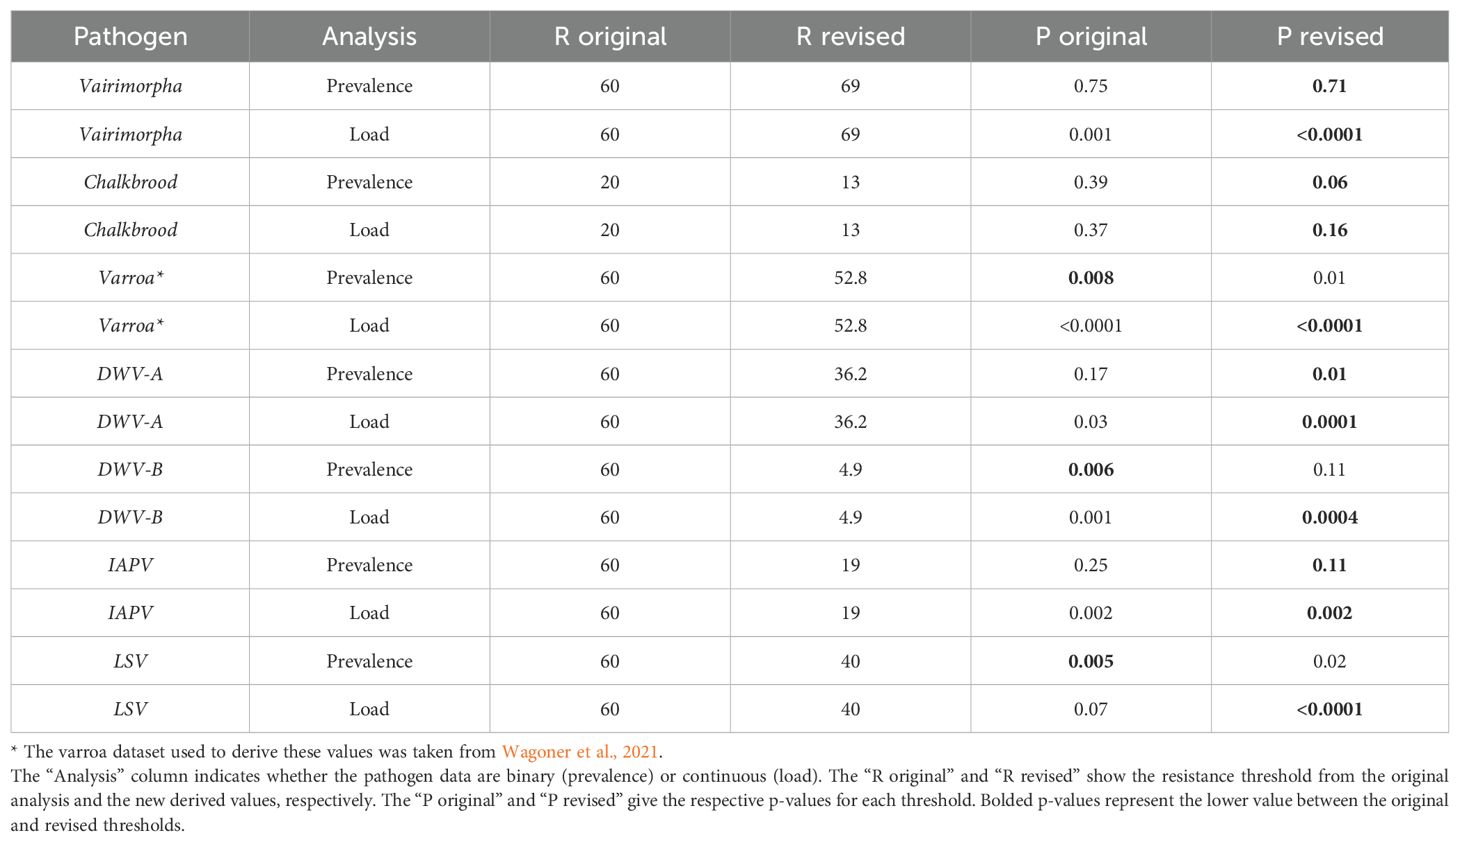
Table 3. The compared significance between high and low UBeeO colonies for the original threshold and the new derived resistance threshold from our MCP analysis.
4 Discussion
Our findings underscore the efficacy of UBeeO as a tool for identifying honey bee colonies with enhanced resistance to RNA viruses, Vairimorpha, and chalkbrood. These results hold significant implications for honey bee health management and breeding programs, as they offer insights into the mechanisms underlying disease resistance traits and highlight the potential of targeted selection strategies to mitigate the impact of common honey bee pathogens on colony health.
4.1 RNA viruses and hygienic behavior
A key finding of this study was the negative correlations between multiple RNA virus loads and colony UBeeO score. These inverse relationships suggest a direct link between hygienic behavior and reduced transmission of viral pathogens, particularly viral pathogens vectored by the Varroa mite. Varroa mites are known vectors for several honey bee viruses, including DWV-A, DWV-B (Highfield et al., 2009; LeConte et al., 2010; Dainat et al., 2012; Francis et al., 2013; Mondet et al., 2014; Posada-Florez et al., 2019; Ryabov et al., 2022), BQCV, IAPV (Di Prisco et al., 2011), and LSV (Faurot-Daniels et al., 2020; Yañez et al., 2020; Shojaei et al., 2023). While acaricides can be used to control Varroa mites, there has been little evidence pointing to their effect on reducing viral loads in the colony (Locke et al., 2012). High-hygienic colonies, through their efficient removal of Varroa-infested brood, disrupt the mite’s reproductive cycle, thereby reducing the overall viral load and potential spread within the colony (Penn et al., 2022; Ramos-Cuellar et al., 2022). This suggests that UBeeO- based selective breeding can reduce the need for Varroa management, as this type of hygienic selection confers resistance to both Varroa and related viral pathogens. Since the UBeeO assay relies on stress signals and viruses induce stress, it is possible that in high scoring UBeeO colonies, individuals infected with viruses (regardless of whether they are also parasitized by Varroa) could be identified and removed. It is assumed that the greater the stress experienced by the larvae (i.e., the higher the virus titer or virulence), the stronger the signal they emit. Consequently, higher pathogen load or virulence results in a stress signal that is more likely to be detected by a hygienic worker bee on the other side of the cell cap. Future studies should further examine the relationships between pathogen load, virulence, brood signaling, and hygienic response.
In Posada-Florez et al., 2021, cannibalism and trophallaxis led to DWV transmission, with important implications for hygienic colonies that remove and cannibalize infected pupae. However, this was a cage study, and thus not reflective of the social mechanisms that may be at play in a honey bee colony. The caged honey bees in the study were starved and only provided a single food option: trophallaxis from a nestmate that had cannibalized a DWV-infected brood. In a colony setting, individuals may avoid engaging in trophallaxis with a hygienic worker. Given our results combined with those from the Posada-Florez study, hygienic workers may reduce overall virus loads by either eliminating more virus from the colony than they spread to nestmates, or by preventing the spread of disease to nestmates through some unknown mechanism such as nestmate avoidance or altruistic self-sacrifice.
4.2 Vairimorpha spp. and hygienic behavior
Our study provides intriguing insights into the relationship between hygienic behavior and Vairimorpha spp. infection in honey bee colonies. Hygienic behavior is typically associated with the reduction of brood disease and has never been found to affect Vairimorpha prevalence or load. Vairimorpha spp. primarily affects adult bees under natural field settings, so the act of detecting and removing diseased brood would appear to have little impact on Vairimorpha at the colony level. While our prevalence results suggest that hygiene does not affect a colony’s likelihood of Vairimorpha exposure, our analysis of pathogen load suggests that high-UBeeO colonies exhibit reduced Vairimorpha infections overall. One possible explanation is that, in addition to targeting unhealthy brood for removal, high UBeeO colonies also target unhealthy adults. As with unhealthy brood (Nazzi et al., 2004; Wagoner et al., 2019, 2020), nestmates may be able to detect and remove sick adult bees based on their altered cuticular hydrocarbons (Baracchi et al., 2012; Hernandez Lopez et al., 2017; Richard et al., 2012). Healthy workers may detect and take action to remove Vairimorpha-infected bees by killing or forced ejection from the colony, an idea that is supported by previous work with Vairimorpha and other stimulants (Biganski et al., 2018; Conroy and Holman, 2022). High UBeeO colonies may also engage in co-occurring behaviors that are linked to hygienic behavior performance, such as reduced trophallaxis or altruistic self-sacrifice (Rueppell et al., 2010; Pusceddu et al., 2021; Conroy and Holman, 2022). The removal or avoidance of contaminated hive materials including fecal matter or food resources could also contribute to lower oral transmission of Vairimorpha spores (Michalczyk and Sokół, 2014) in high UBeeO colonies, but this possibility has not yet been investigated.
It is plausible that, in addition to social behaviors, high UBeeO colonies have either enhanced innate immune functions or less compromised immune systems at the individual level, thereby reducing colony susceptibility to Vairimorpha infection. However, since higher Vairimorpha loads are found in forager bees, an alternative explanation may be that bees from high UBeeO colonies are more susceptible to Vairimorpha, causing impaired flight (Wolf et al., 2014) and navigation (Dussaubat et al., 2013) and resulting in fewer infected foragers returning to the colony (Kralj and Fuchs, 2010). These explanations are consistent with our finding that there is equal prevalence of Vairimorpha spp. among high and low UBeeO colonies, but that high colonies have significantly lower Vairimorpha spp. pathogen loads over time. More research is needed to understand mechanisms by which high UBeeO colonies control Vairimorpha spp. and whether a reduction in Vairimorpha spp. load in high UBeeO colonies is driven through individual and/or social immune function.
4.3 Ascosphaera apis (chalkbrood) and hygienic behavior
This study highlights the role of hygienic behavior in disrupting the progression and spread of Chalkbrood. Chalkbrood is a fungal pathogen that affects honey bee brood, and leads to larval death and colony weakening. By promptly identifying and removing diseased brood, high-hygienic colonies effectively limit the spread of the pathogen within the colony, mitigating the impact of chalkbrood on colony health. Early removal of infected brood prevents the buildup of infectious spores, thereby reducing the overall severity of chalkbrood outbreaks within the colony. Hygienic behavior in chalkbrood infested colonies has been characterized by the early detection of infected larvae and their quick removal before disease progression (Invernizzi et al., 2011).A previous study from Australia found that hygienic behavior as measured by the FKB assay was not a significant predictor of the presence of chalkbrood (Gerdts et al., 2018), however the severity of the infection (black versus white spores) was not considered. It is known that larvae infected with chalkbrood emit chemical odorants that stimulate hygienic behavior (Swanson et al., 2009). Hygienic assays based on semiochemical signaling rather than necrophoresis may be better at identifying colonies capable of removing chalkbrood early, and thus better able to predict colony chalkbrood resistance.
4.4 Resistance thresholds
In most instances, thresholds calculated through change point analysis derived more accurate representations of resistance compared to a universal 60% threshold (Table 3). While using a conservative threshold of 69% would likely identify colonies resistant to the entire suite of pathogens we examined, beekeepers may consider using UBeeO thresholds specific to pathogens of interest. Such a practice would enable beekeepers to identify colonies resistant to pathogens most relevant to their region and/or specific to their selection and breeding goals.
Variation in resistance thresholds was observed across honey bee pathogens, with notably lower thresholds for pathogens more virulent during the pupal and larval stages of bee development (Figure 6). For example, for highly virulent chalkbrood, disease levels drop off in colonies that scored 13% or higher on UBeeO assays. This contrasts to the less virulent Variamorpha and Varroa, in which disease levels dropped off at UBeeO scores of 69% and 52.8%, respectively. In an alternative analysis using a series of t-tests, Wagoner et al., 2021 also estimated the threshold for Varroa at 52%, but ultimately used a conservative and slightly higher threshold of 60%. In contrast to Varroa and Vairimorpha, chalkbrood is lethal for honey bee brood and may cause a higher level of stress earlier in bee development. Presumably, the chemical signals emitted by dying or dead brood are more easily detected by nurse bees (even in non-hygienic colonies) due to increased signal strength. Indeed, honey bees show selective, damage dependent hygienic behavior, and are more likely to perform hygiene on brood parasitized by ‘virulent’ mites (i.e. mites with high potential to induce DWV infections) compared to ‘less virulent’ mites (i.e. mites with low potential to induce DWV infections) (Schöning et al., 2012). The resistance thresholds presented here for RNA viruses largely reinforce this pattern, with IAPV, a highly virulent virus (de Miranda et al., 2010; Chen et al., 2014), having a lower threshold compared to LSV, a virus associated with poor health conditions, but which primarily results in asymptomatic infections (Daughenbaugh et al., 2015; Glenny et al., 2017; Faurot-Daniels et al., 2020; Hou et al., 2023). Significant differences in resistance thresholds were also observed for the two DWV variants, with a higher threshold for DWV-A, indicating greater virulence of DWV-B. This finding further supports the notion that differences in virulence influence brood signaling and subsequent hygienic response. However, there is active debate about which DWV variant is more virulent (McMahon et al., 2016; Mordecai et al., 2016; Natsopoulou et al., 2017; Gisder et al., 2018; Tehel et al., 2019; Paxton et al., 2022) with virulence likely related to the presence of recombinants in a mixed infection (Yañez et al., 2020). It is important to note that the resistance thresholds presented here are based on pathogen loads rather than colony performance. Future studies should confirm these thresholds in other honey bee populations and investigate the biological relevance of these thresholds in the context of colony outcomes. For example, further experiments should be performed to determine whether colonies that meet the proposed thresholds actually achieve improved health, increased productivity, and/or higher survival rates.
4.5 Implications for honey bee health management
This study reveals multiple potential benefits of the incorporation of UBeeO-based selection into honey bee breeding programs. By selecting for high UBeeO scores, beekeepers may be able to enhance colony resistance to a broad range of pathogens, including RNA viruses, microsporidian parasites, and fungal diseases. Preventing disease through selective breeding reduces the need for chemical treatments and offers a holistic method for improving colony health and resilience, potentially leading to more sustainable and productive beekeeping practices.
Our study highlights the application of UBeeO as a tool for identifying colonies with reduced pathogen prevalence and loads. However, we did not explore the specific mechanisms responsible for resistance. The observed benefits of high-hygienic behavior underscore the importance of continued research into the mechanisms by which hygiene influences disease resistance. Future studies should explore the genetic basis of hygienic behavior and its interactions with other factors influencing honey bee health. Moreover, expanding the application of UBeeO across different environmental conditions and beekeeping practices will be crucial in validating the tool’s effectiveness at optimizing breeding strategies.
It is important to note that this study did not control for the level or presence of diseases in the colonies, which may influence hygienic behavior. Colonies already affected by disease could potentially become acclimated to the stress cues emitted by infected brood, leading to a diminished response to UBeeO. However, it is also possible that exposure to natural diseases could lead to increased recruitment of individuals performing hygienic tasks, and thus augmented response to UBeeO. While our findings suggest a strong positive relationship between colony hygienic response to UBeeO and colony health, and this study was correlative in nature and future studies are needed to improve our understanding of the effects that disease and other stressors have on colony hygiene performance. This study highlights the multifaceted advantages of selecting for hygienic behavior in honey bees. By leveraging tools like UBeeO to identify and breed colonies with enhanced disease resistance, beekeepers can improve the overall health and productivity of honey bee populations, contributing to the sustainability of apiculture and the productivity of pollinator-dependent crops worldwide.
Data availability statement
The datasets used for this study and subsequent code used for analysis can be found in the following repository: [https://github.com/alexburn17/UBO_disease_paper]. Further inquiries can be directed to the corresponding authors.
Ethics statement
The manuscript presents research on animals that do not require ethical approval for their study.
Author contributions
SA: Conceptualization, Formal Analysis, Funding acquisition, Investigation, Methodology, Project administration, Resources, Supervision, Validation, Visualization, Writing – original draft, Writing – review & editing. PB: Conceptualization, Data curation, Formal Analysis, Investigation, Methodology, Validation, Visualization, Writing – original draft, Writing – review & editing. MM: Data curation, Formal Analysis, Investigation, Methodology, Project administration, Supervision, Validation, Writing – original draft, Writing – review & editing. EA: Data curation, Formal Analysis, Funding acquisition, Investigation, Methodology, Resources, Writing – review & editing. CJ: Data curation, Investigation, Methodology, Project administration, Resources, Writing – review & editing. KW: Conceptualization, Funding acquisition, Investigation, Methodology, Project administration, Resources, Supervision, Validation, Writing – review & editing, Visualization.
Funding
The author(s) declare that financial support was received for the research and/or publication of this article. This work was supported by the National Institute of Food and Agriculture, U.S. Department of Agriculture, through the Northeast Sustainable Agriculture Research and Education program under subaward ONE20-355, the One Hive Foundation, Project Apis m., US National Research Council Fellowship and the USDA-ARS Cooperative Agreement (586066-9-045).
Acknowledgments
We acknowledge the efforts of our team and beekeeping partners who made field work possible: Sophia Carlat, Sophie Gustafson, Cailin Barrett, Michael Palmer, Adam Collins, Andrew Munkres, and Jack Rath.
Conflict of interest
KW is co-inventor of the UBeeO assay and is owner of Optera LLC, which developed and now sells UBeeO. At the time of the study, the UBeeO assay was not commercially available. However, to avoid any potential future conflict of interest, KW did not collect or analyze any pathogen data presented in this study, and scored UBeeO assays for colonies in the virus study prior to sample analysis by co-author EA and thus blind to virus results.
The remaining authors declare that the research was conducted in the absence of any commercial or financial relationships that could be construed as a potential conflict of interest.
Generative AI statement
The author(s) declare that no Generative AI was used in the creation of this manuscript.
Publisher’s note
All claims expressed in this article are solely those of the authors and do not necessarily represent those of their affiliated organizations, or those of the publisher, the editors and the reviewers. Any product that may be evaluated in this article, or claim that may be made by its manufacturer, is not guaranteed or endorsed by the publisher.
Supplementary material
The Supplementary Material for this article can be found online at: https://www.frontiersin.org/articles/10.3389/frbee.2025.1509871/full#supplementary-material
References
Baracchi D., Fadda A., Turillazzi S. (2012). Evidence for antiseptic behaviour towards sick adult bees in honey bee colonies. J. Insect Physiol. 58, 1589–1596. doi: 10.1016/j.jinsphys.2012.09.014
Bates D., Maechler M., Bolker B., Walker S. (2015). Fitting linear mixed-effects models using lme4. J. Stat. Softw. 67, 1–48. doi: 10.18637/jss.v067.i01
Belsky J., Joshi N. K. (2019). Impact of biotic and abiotic stressors on managed and feral bees. Insects 10, 1-42. doi: 10.3390/insects10080233
Biganski S., Kurze C., Müller M. Y., Moritz R. F. A. (2018). Social response of healthy honeybees towards Nosema ceranae-infected workers: care or kill? Apidologie 49, 325–334. doi: 10.1007/s13592-017-0557-8
Chen Y. P., Pettis J. S., Corona M., Chen W. P., Li C. J., Spivak M., et al. (2014). Israeli acute paralysis virus: epidemiology, pathogenesis and implications for honey bee health. PloS Pathog. 10, 1-15. doi: 10.1371/journal.ppat.1004261
Conroy T. E., Holman L. (2022). Social immunity in the honey bee: do immune-challenged workers enter enforced or self-imposed exile? Behav. Ecol. Sociobiol. 76, 1–9. doi: 10.1007/s00265-022-03139-z
Dainat B., Evans J. D., Chen Y. P., Gauthier L., Neumanna P. (2012). Dead or alive: Deformed wing virus and varroa destructor reduce the life span of winter honeybees. Appl. Environ. Microbiol. 78, 981–987. doi: 10.1128/AEM.06537-11
Daughenbaugh K. F., Martin M., Brutscher L. M., Cavigli I., Garcia E., Lavin M., et al. (2015). Honey bee infecting Lake Sinai viruses. Viruses 7, 3285–3309. doi: 10.3390/v7062772
de Miranda J. R., Cordoni G., Budge G. (2010). The Acute bee paralysis virus-Kashmir bee virus-Israeli acute paralysis virus complex. J. Invertebr. Pathol. 103 Suppl 1, S30–S47. doi: 10.1016/J.JIP.2009.06.014
Di Prisco G., Pennacchio F., Caprio E., Boncristiani H. F., Evans J. D., Chen Y. (2011). Varroa destructor is an effective vector of Israeli acute paralysis virus in the honeybee, Apis mellifera. J. Gen. Virol. 92, 151–155. doi: 10.1099/vir.0.023853-0
Dussaubat C., Maisonnasse A., Crauser D., Beslay D., Costagliola G., Soubeyrand S., et al. (2013). Flight behavior and pheromone changes associated to Nosema ceranae infection of honey bee workers (Apis mellifera) in field conditions. J. Invertebr. Pathol. 113, 42–51. doi: 10.1016/j.jip.2013.01.002
Eiri D. M., Suwannapong G., Endler M., Nieh J. C. (2015). Nosema ceranae can infect honey bee larvae and reduces subsequent adult longevity. PloS One 10, 1–17. doi: 10.1371/journal.pone.0126330
Erez T., Bonda E., Kahanov P., Rueppell O., Wagoner K., Chejanovsky N., et al. (2022). Multiple benefits of breeding honey bees for hygienic behavior. J. Invertebr. Pathol. 193, 107788. doi: 10.1016/J.JIP.2022.107788
Evans J. D. (2006). Beepath: an ordered quantitative-PCR array for exploring honey bee immunity and disease. J. Invertebr. Pathol. 93, 135–139. doi: 10.1016/J.JIP.2006.04.004
Faurot-Daniels C., Glenny W., Daughenbaugh K. F., McMenamin A. J., Burkle L. A., Flenniken M. L. (2020). Longitudinal monitoring of honey bee colonies reveals dynamic nature of virus abundance and indicates a negative impact of Lake Sinai virus 2 on colony health. PloS One 15, 1–36. doi: 10.1371/journal.pone.0237544
Fries I., Chauzat M. P., Chen Y P., Doublet V., Genersch E., Gisder S., et al. (2013). Standard methods for Nosema research. J. Apic. Res. 52 (1), 1–28. doi: 10.3896/IBRA.1.52.1.14
Fox J., Weisberg S. (2019). Companion to Applied Regression [R package car version 3.1-3] (Thousand Oaks, CA: Sage). doi: 10.32614/CRAN.PACKAGE.CAR
Francis R. M., Nielsen S. L., Kryger P. (2013). Varroa-virus interaction in collapsing honey bee colonies. PloS One 8, 1- 9. doi: 10.1371/journal.pone.0057540
Gerdts J., Laurie Dewar R., Finstrom M. S., Edwards T., Angove M. (2018). Hygienic behaviour selection via freeze-killed honey bee brood not associated with chalkbrood resistance in eastern Australia. PloS One 13, 1–13. doi: 10.1371/journal.pone.0203969
Gisder S., Möckel N., Eisenhardt D., Genersch E. (2018). In vivo evolution of viral virulence: switching of deformed wing virus between hosts results in virulence changes and sequence shifts. Environ. Microbiol. 20, 4612–4628. doi: 10.1111/1462-2920.14481
Glenny W., Cavigli I., Daughenbaugh K. F., Radford R., Kegley S. E., Flenniken M. L. (2017). Honey bee (Apis mellifera) colony health and pathogen composition in migratory beekeeping operations involved in California almond pollination. PloS One 12, 1–24. doi: 10.1371/journal.pone.0182814
Grozinger C. M., Flenniken M. L. (2019). Annual review of entomology bee viruses: ecology, pathogenicity, and impacts. AnnualReviewofEntomology 64, 205–226. doi: 10.1146/annurev-ento-011118
Hernández López J., Riessberger-Gallé U., Crailsheim K., Schuehly W. (2017). Cuticular hydrocarbon cues of immune-challenged workers elicit immune activation in honeybee queens. Mol. Ecol. 26, 3062–3073. doi: 10.1111/mec.14086
Highfield A. C., El Nagar A., Mackinder L. C. M., Noël L. M. L. J., Hall M. J., Martin S. J., et al. (2009). Deformed wing virus implicated in overwintering honeybee colony losses. Appl. Environ. Microbiol. 75, 7212–7220. doi: 10.1128/AEM.02227-09
Hothorn T., Bretz F., Westfall P. (2008). Simultaneous Inference in General Parametric Models. Biom. J. 50 (3), 346–363.
Hou C., Liang H., Chen C., Zhao H., Zhao P., Deng S., et al. (2023). Lake Sinai virus is a diverse, globally distributed but not emerging multi-strain honeybee virus. Mol. Ecol. 32, 3859–3871. doi: 10.1111/mec.16987
Invernizzi C., Rivas F., Bettucci L. (2011). Resistance to Chalkbrood Disease in Apis mellifera L. (Hymenoptera: Apidae) Colonies with Diff erent Hygienic Behaviour. Neotrop. Entomol. 40, 28–34.
Ivgin Tunca R., Oskay D., Erginoglu S. (2017). Monitoring of nosema infections levels during hygienic honey bee breeding programs in Turkey. Kafkas. Univ. Vet. Fak. Derg. 23, 521–526. doi: 10.9775/kvfd.2016.17186
Jabal-Uriel C., Albarracín V. N., Calatayud J., Higes M., Martín-Hernández R. (2022). Age and season effect the timing of adult worker honeybee infection by nosema ceranae. Front. Cell Infect. Microbiol. 11. doi: 10.3389/fcimb.2021.823050
Kralj J., Fuchs S. (2010). Nosema sp. influences flight behavior of infected honey bee (Apis mellifera) foragers. Apidologie 41, 21–28. doi: 10.1051/apido/2009046
Leclercq G., Blacquière T., Gengler N., Francis F. (2018a). Hygienic removal of freeze-killed brood does not predict Varroa resistance traits in unselected stocks. J. Apic. Res. 57, 292–299. doi: 10.1080/00218839.2018.1426350
Leclercq G., Francis F., Gengler N., Blacquière T. (2018b). Bioassays to quantify hygienic behavior in honey bee (Apis mellifera L.) colonies: A review. J. Apic. Res. 57, 663–673. doi: 10.1080/00218839.2018.1494916
LeConte Y., Ellis M., Ritter W. (2010). Varroa mites and honey bee health: Can Varroa explain part of the colony losses? Apidologie 41, 353–363. doi: 10.1051/apido/2010017
Lindeløv J. K. (2020). mcp: An R Package for Regression With Multiple Change Points (Charlottesville, VA: Center for Open Science). doi: 10.31219/osf.io/fzqxv
Lippert C., Feuerbacher A., Narjes M. (2021). Revisiting the economic valuation of agricultural losses due to large-scale changes in pollinator populations. Ecol. Econ. 180, 1–14. doi: 10.1016/j.ecolecon.2020.106860
Locke B., Forsgren E., Fries I., de Miranda J. R. (2012). Acaricide treatment affects viral dynamics in Varroa destructor-infested honey bee colonies via both host physiology and mite control. Appl. Environ. Microbiol. 78, 227–235. doi: 10.1128/AEM.06094-11
Locke B., Fries I. (2011). Characteristics of honey bee colonies (Apis mellifera) in Sweden surviving Varroa destructor infestation. Apidologie 42, 533–542. doi: 10.1007/s13592-011-0029-5
McAfee A., Chapman A., Iovinella I., Gallagher-Kurtzke Y., Collins T. F., Higo H., et al. (2018). A death pheromone, oleic acid, triggers hygienic behavior in honey bees (Apis mellifera L.). Sci. Rep. 8, 1–13. doi: 10.1038/s41598-018-24054-2
McMahon D. P., Natsopoulou M. E., Doublet V., Fürst M., Weging S., Brown M. J. F., et al. (2016). Elevated virulence of an emerging viral genotype as a driver of honeybee loss. Proc. R. Soc. B.: Biol. Sci. 283, 1–8. doi: 10.1098/rspb.2016.0811
Medina-Flores C. A., Medina L. A. M., Guzmán-Novoa E. (2022). Effect of hygienic behavior on resistance to chalkbrood disease (Ascosphaera apis) in Africanized bee colonies (Apis mellifera). Rev. Mex. Cienc. Pecu. 13, 225–239. doi: 10.22319/RMCP.V13I1.5907
Milone J. P., Tarpy D. R. (2021). Effects of developmental exposure to pesticides in wax and pollen on honey bee (Apis mellifera) queen reproductive phenotypes. Sci. Rep. 11, 1–12. doi: 10.1038/s41598-020-80446-3
Mondet F., de Miranda J. R., Kretzschmar A., Le Conte Y., Mercer A. R. (2014). On the Front Line: Quantitative Virus Dynamics in Honeybee (Apis mellifera L.) Colonies along a New Expansion Front of the Parasite Varroa destructor. PloS Pathog. 10, 1–15. doi: 10.1371/journal.ppat.1004323
Mordecai G. J., Wilfert L., Martin S. J., Jones I. M., Schroeder D. C. (2016). Diversity in a honey bee pathogen: First report of a third master variant of the Deformed Wing Virus quasispecies. ISME. J. 10, 1264–1273. doi: 10.1038/ismej.2015.178
Mugabi F., Duffy K. J., van Langevelde F. (2024). Behaviours of honeybees can reduce the probability of deformed wing virus outbreaks in Varroa destructor-infested colonies. Model. Earth Syst. Environ. 10, 3745–3761. doi: 10.1007/s40808-024-01974-9
Murray Z. L., Keyzers R. A., Barbieri R. F., Digby A. P., Lester P. J. (2016). Two pathogens change cuticular hydrocarbon profiles but neither elicit a social behavioural change in infected honey bees, Apis mellifera (Apidae: Hymenoptera). Aust. Entomol. 55, 147–153. doi: 10.1111/aen.12165
Natsopoulou M. E., McMahon D. P., Doublet V., Frey E., Rosenkranz P., Paxton R. J. (2017). The virulent, emerging genotype B of Deformed wing virus is closely linked to overwinter honeybee worker loss. Sci. Rep. 7, 1–9. doi: 10.1038/s41598-017-05596-3
Nazzi F., Della Vedova G., D’Agaro M. (2004). A semiochemical from brood cells infested by Varroa destructor triggers hygienic behaviour in Apis mellifera. Apidologie 35, 65–70. doi: 10.1051/apido:2003065
Paxton R. J., Schäfer M. O., Nazzi F., Zanni V., Annoscia D., Marroni F., et al. (2022). Epidemiology of a major honey bee pathogen, deformed wing virus: potential worldwide replacement of genotype A by genotype B. Int. J. Parasitol. Parasites Wildl. 18, 157–171. doi: 10.1016/j.ijppaw.2022.04.013
Penn H. J., Simone-Finstrom M. D., Chen Y., Healy K. B. (2022). Honey Bee Genetic Stock Determines Deformed Wing Virus Symptom Severity but not Viral Load or Dissemination Following Pupal Exposure. Front. Genet. 13. doi: 10.3389/fgene.2022.909392
Popovska Stojanov D., Dimitrov L., Danihlík J., Uzunov A., Golubovski M., Andonov S., et al. (2021). Direct economic impact assessment of winter honeybee colony losses in three european countries. Agric. (Switzerland). 11, 1–11. doi: 10.3390/agriculture11050398
Posada-Florez F., Childers A. K., Heerman M. C., Egekwu N. I., Cook S. C., Chen Y., et al. (2019). Deformed wing virus type A, a major honey bee pathogen, is vectored by the mite Varroa destructor in a non-propagative manner. Sci. Rep. 9, 1–10. doi: 10.1038/s41598-019-47447-3
Posada-Florez F., Lamas Z. S., Hawthorne D. J., Chen Y., Evans J. D., Ryabov E. V. (2021). Pupal cannibalism by worker honey bees contributes to the spread of deformed wing virus. Sci. Rep. 11, 8989. doi: 10.1038/s41598-021-88649-y
Pusceddu M., Cini A., Alberti S., Salaris E., Theodorou P., Floris I., et al. (2021). Honey bees increase social distancing when facing the ectoparasite Varroa destructor. Sci. Adv. 7, 1–14. doi: 10.1126/sciadv.abj1398
Ramos-Cuellar A. K., de la Mora A., Contreras-Escareño F., Morfin N., Tapia-González J. M., Macías-Macías J. O., et al. (2022). Genotype, but Not Climate, Affects the Resistance of Honey Bees (Apis mellifera) to Viral Infections and to the Mite Varroa destructor. Vet. Sci. 9, 2–16. doi: 10.3390/vetsci9070358
R Core Team (2021). R: a language and environment for statistical computing. Available online at: https://www.R-project.org/ (Accessed October 8, 2024).
Richard F. J., Holt H. L., Grozinger C. M. (2012). Effects of immunostimulation on social behavior, chemical communication and genome-wide gene expression in honey bee workers (Apis mellifera). BMC Genomics 13, 1–17. doi: 10.1186/1471-2164-13-558
Rueppell O., Hayworth M. K., Ross N. P. (2010). Altruistic self-removal of health-compromised honey bee workers from their hive. J. Evol. Biol. 23, 1538–1546. doi: 10.1111/j.1420-9101.2010.02022.x
Ryabov E. V., Posada-Florez F., Rogers C., Lamas Z. S., Evans J. D., Chen Y., et al. (2022). The vectoring competence of the mite Varroa destructor for deformed wing virus of honey bees is dynamic and affects survival of the mite. Front. Insect Sci. 2. doi: 10.3389/finsc.2022.931352
Schöning C., Gisder S., Geiselhardt S., Kretschmann I., Bienefeld K., Hilker M., et al. (2012). Evidence for damage-dependent hygienic behaviour towards Varroa destructor-parasitised brood in the western honey bee, Apis mellifera. J. Exp. Biol. 215, 264–271. doi: 10.1242/jeb.062562
Seltzer R., Kahanov P., Kamer Y., Hetzroni A., Bieńkowska M., Hefetz A., et al. (2022). The payoffs and tradeoffs of hygienic behavior: a five year field study on a local population of honey bees. J. Apic. Res. 61, 492–501. doi: 10.1080/00218839.2022.2048947
Seltzer R., Kamer Y., Kahanov P., Splitt A., Bieńkowska M., Hefetz A., et al. (2023). Breeding for hygienic behavior in honey bees (Apis mellifera): a strong paternal effect. J. Apic. Res. 62, 419–428. doi: 10.1080/00218839.2022.2140927
Shojaei A., Nourian A., Khanjani M., Mahmoodi P. (2023). The first molecular characterization of Lake Sinai virus in honey bees (Apis mellifera) and Varroa destructor mites in Iran. J. Apic. Res. 62, 1176–1182. doi: 10.1080/00218839.2021.1921467
Smart M. D., Sheppard W. S. (2012). Nosema ceranae in age cohorts of the western honey bee (Apis mellifera). J. Invertebr. Pathol. 109, 148–151. doi: 10.1016/j.jip.2011.09.009
Spivak M. (1996). Honey bee hygienic behavior and defense against Varroa jacobsoni. Apidologie 27, 245–260. doi: 10.1051/APIDO:19960407
Spivak M., Reuter G. S. (2001). Varroa destructor infestation in untreated honey bee (Hymenoptera: apidae) colonies selected for hygienic behavior. J. Econ. Entomol. 94, 326–331. doi: 10.1603/0022-0493-94.2.326
Swanson J. A. I., Torto B., Kells S. A., Mesce K. A., Tumlinson J. H., Spivak M. (2009). Odorants that induce hygienic behavior in honeybees: Identification of volatile compounds in chalkbrood-infected honeybee larvae. J. Chem. Ecol. 35, 1108–1116. doi: 10.1007/s10886-009-9683-8
Tehel A., Vu Q., Bigot D., Gogol-Döring A., Koch P., Jenkins C., et al. (2019). The two prevalent genotypes of an emerging infectious disease, deformed wing virus, cause equally low pupal mortality and equally high wing deformities in host honey bees. Viruses 11, 1-18. doi: 10.3390/v11020114
Ullah A., Tlak Gajger I., Majoros A., Dar S. A., Khan S., Kalimullah, et al. (2021). Viral impacts on honey bee populations: A review. Saudi. J. Biol. Sci. 28, 523–530. doi: 10.1016/j.sjbs.2020.10.037
Urbieta-Magro A., Higes M., Meana A., Gómez-Moracho T., Rodríguez-García C., Barrios L., et al. (2019). The levels of natural Nosema spp. infection in Apis mellifera iberiensis brood stages. Int. J. Parasitol. 49, 657–667. doi: 10.1016/j.ijpara.2019.04.002
Wagoner K., Millar J. G., Keller J., Bello J., Waiker P., Schal C., et al. (2021). Hygiene-eliciting brood semiochemicals as a tool for assaying honey bee (Hymenoptera: apidae) colony resistance to varroa (Mesostigmata: varroidae). J. Insect Sci. 21, 1–13. doi: 10.1093/jisesa/ieab064
Wagoner K. M., Millar J. G., Schal C., Rueppell O. (2020). Cuticular pheromones stimulate hygienic behavior in the honey bee (Apis mellifera). Sci. Rep. 10, 1–11. doi: 10.1038/s41598-020-64144-8
Wagoner K., Spivak M., Hefetz A., Reams T., Rueppell O. (2019). Stock-specific chemical brood signals are induced by Varroa and Deformed Wing Virus, and elicit hygienic response in the honey bee. Sci. Rep. 9, 1–14. doi: 10.1038/s41598-019-45008-2
Wang Y., Naumann U., Wright S. T., Warton D. I. (2012). mvabund– an R package for model-based analysis of multivariate abundance data. Methods in Ecology and Evolution 3, 471-474. doi: 10.1111/j.2041-210X.2012.00190.x
Wolf S., McMahon D. P., Lim K. S., Pull C. D., Clark S. J., Paxton R. J., et al. (2014). So near and yet so far: Harmonic radar reveals reduced homing ability of nosema infected honeybees. PloS One 9, 1–15. doi: 10.1371/journal.pone.0103989
Keywords: honey bee, hygiene, pathogen, RNA virus, Vairimorpha, Nosema, Varroa, chalkbrood
Citation: Alger SA, Burnham PA, Miller MS, Amiri E, Jordan C and Wagoner K (2025) Unhealthy brood odor scores predict pathogen loads of several important honey bee diseases. Front. Bee Sci. 3:1509871. doi: 10.3389/frbee.2025.1509871
Received: 11 October 2024; Accepted: 26 February 2025;
Published: 02 April 2025.
Edited by:
Susan E Fahrbach, Wake Forest University, United StatesReviewed by:
Tugrul Giray, University of Puerto Rico, Puerto RicoAhmet Onur Girisgin, Bursa Uludağ University, Türkiye
Copyright © 2025 Alger, Burnham, Miller, Amiri, Jordan and Wagoner. This is an open-access article distributed under the terms of the Creative Commons Attribution License (CC BY). The use, distribution or reproduction in other forums is permitted, provided the original author(s) and the copyright owner(s) are credited and that the original publication in this journal is cited, in accordance with accepted academic practice. No use, distribution or reproduction is permitted which does not comply with these terms.
*Correspondence: Samantha A. Alger, c2FsZ2VyQHV2bS5lZHU=