 Laura C. McHenry
 Roger Schürch
 Lindsay E. Johnson1
 Margaret J. Couvillon
- 1Department of Entomology, Virginia Tech, Blacksburg, VA, United States
- 2Department of Entomology, The Pennsylvania State University, University Park, PA, United States
- 3Odum School of Ecology, University of Georgia, Athens, GA, United States
Social network analysis is increasingly and fruitfully applied to study the collective structure and function of animal societies across space and time. Honey bees (Apis mellifera L.) are a particularly tractable model system that is rich in social relationships and dynamics. Despite the rich body of literature describing the social life of the honey bee, including the famous waggle dance by which foragers recruit nestmates to profitable resources, relatively little is known about the networks that arise from waggle dance communication. Here we conducted a field experiment with fully-marked experimental colonies (N = 2 colonies, 3,000 bees each) to characterize the honey bee waggle dance recruitment network structure and function. Particularly, we studied network density, burstiness in waggle dance bouts, and the effect of individuality in waggle dance communication behavior on network structure. We simulated a maximally-efficient honey bee recruitment network using a deterministic susceptible-infected model. Then we used this simulated network as an upper bound for network density to calculate the proportion of successful recruitment events in observed networks compared to the simulated maximal network. Next, we characterized the burstiness, or temporal distribution, of waggle dance bouts. Finally, we tested whether inter-bee differences, or individuality, in waggle dance communication affected the recruitment network structure. We found that (1) real recruitment networks are sparse, with each individual recruiting up to 3.5% as many nestmates as predicted by the simulated maximal network; (2) individual bees danced steadily, not in bursts, and (3) that individuality in waggle dance calibrations was positively associated with successful recruitment and thus the propagation of the recruitment network (p = 0.008). Our results offer the first empirical and biologically-informed descriptive statistics for honey bee waggle dance networks and may be informative in the parameterization of bio-inspired computing models.
Introduction
Information and its transmission via social networks govern the lives of group-living animals (Wilson, 2000; Gordon, 2010; Hasenjager and Dugatkin, 2015; Krause et al., 2015). Whether such information is gleaned from personal sampling of the environment (private information), or via signals from group members or their products (public information), the interpretation of information not only allows animals to make more adaptive behavioral choices, but also shapes group-level behavioral phenotypes (Danchin et al., 2004; Dall et al., 2005; Gordon, 2010; Schmidt et al., 2010; Baude et al., 2011; Krause et al., 2015; Hasenjager et al., 2024).
Eusocial insects, where groups of bees, ants, some wasps, and termites live and work together in organized societies, offer rich systems in which to study social networks (Wey et al., 2008; Krause et al., 2009; Hölldobler and Wilson, 2009; Gordon, 2010; Grüter and Leadbeater, 2014; O’Shea-Wheller et al., 2021; Hasenjager et al., 2022; Perez and Johnson, 2025). Social relationships in these societies often feature many types of connections existing simultaneously and in interaction with one another (Grüter and Farina, 2009; Finn et al., 2019; Hasenjager et al., 2020, 2024). Additionally, social networks arising from these connections are often volitional, where connections are related to choices made by signalers and/or receivers, rather than simply based on happenstance spatiotemporal proximity, such as a network formed by strangers sitting next to one another on an airplane. In these complicated systems, network analyses can yield insights into animal social life unavailable via other analytical approaches (Rosenthal et al., 2018; Finn et al., 2019; Beisner et al., 2020; Hasenjager et al., 2021a, Hasenjager et al., 2021b; Hasenjager et al., 2022).
The honey bee (Apis mellifera L.) is one such eusocial insect that lives in large colonies comprised of up to tens of thousands of individuals, mostly female workers, and headed by a single queen (Seeley, 1985). Honey bees also possess division of labor (Von Frisch, 1967; Michener, 1969; Seeley, 1983; Beshers and Fewell, 2001; Robinson, 2009) and complex, well-studied signaling behaviors (reviewed in Hasenjager et al., 2022) that are experimentally-tractable, in part because of their visibility through the clear-walled observation hives where bees may be housed (Von Frisch, 1967; Ohlinger et al., 2022a; McHenry et al., 2025a; McHenry et al., 2025b). Most importantly, honey bees possess one of the most highly-celebrated communication behaviors in the animal kingdom, the waggle dance.
In the dance, a worker bee who has discovered a profitable resource in the landscape, usually floral nectar or pollen, can inform her nestmates of both a distance and a direction to that resource (Von Frisch, 1967; Gould, 1975; Seeley, 1995; Couvillon, 2012). To do this, she repeatedly moves across the vertical comb surface in a figure-of-eight pattern. In the middle of the eight, she performs a waggle run, wherein she shakes her body back and forth energetically as she proceeds across the comb. The waggle run is the information-rich portion of the dance. The angle of the waggle run’s trajectory encodes the direction to the resource she is advertising, where the vertical corresponds to the sun’s azimuth at the time of the dance. The duration of the waggle run in seconds is proportional to the resource’s distance from the colony (Von Frisch, 1967; Couvillon, 2012; Schürch et al., 2013, 2019). Bees performing waggle dances (signal givers) move on the comb through jostling crowds of nestmates (potential signal receivers), making the waggle dance a broadcast signal (Nieh and Tautz, 2000). Additionally and importantly, unlike in some Hymenopteran recruitment behaviors such as tandem running, where naïve ants are led bodily to a profitable resource by a knowledgeable nestmate (Franks and Richardson, 2006; Franklin, 2014; Sasaki et al., 2020), dance followers attempt to locate the resource in the field without direct aid (Von Frisch, 1967; Seeley, 1995). The successful transmission of waggle dance information therefore is a multi-step process. A follower bee must first (1) opt to closely attend a dance signal occurring in her vicinity; (2) decide to act on the information she has received, and (3) successfully locate the resource outside the hive, sometimes at as far as 10–12 kilometers (Von Frisch, 1967; Beekman and Ratnieks, 2000).
A growing area of interest in animal communication and social network analysis (Borgatti, 2018) is the role of consistent, inter-individual differences between network actors (Krause et al., 2007; Croft et al., 2009; Schürch et al., 2010; Pinter-Wollman et al., 2011; Aplin et al., 2014; Firth et al., 2015; Cook et al., 2019; Cook et al., 2020; Loftus et al., 2021; Easter et al., 2022), and recent evidence suggests that inter-individual variation may also play a part in the recruitment network. Interestingly, forager bees differ from one another in the duration of the waggle runs they produce to advertise a particular distance (Schürch et al., 2016). Each bee measures the real-world distance she perceived from the resource to the colony (Srinivasan, 1992; Esch et al., 2001) and scales it down to a waggle run duration according to a calibration that is particular unto herself (Schürch et al., 2016). Hereafter, we refer to this phenomenon as individual calibrations. It was recently demonstrated that the direction of calibration differences between a dancer and a follower, and not simply calibration similarity, can promote the likelihood of recruitment success (McHenry et al., 2025a). Individuality in communication behavior may therefore be a factor affecting the structure and function of the social network formed via waggle dance recruitment.
Since Karl Von Frisch’s description of the waggle dance (Von Frisch, 1946; Von Frisch, 1967), decades of research have described the form and function of the dance (reviewed in Seeley, 1994; Seeley, 1995; Anderson and Ratnieks, 1999; Couvillon, 2012; Kietzman and Visscher, 2015). However, descriptions of the network(s) of information flow arising from dancer-follower (or dyad-level) interactions are limited, mostly because of methodological challenges. While it may be relatively simple to install bees in an observation hive, the logistical difficulty of detecting and tracking interactions among uniquely-identifiable individuals in colonies consisting of thousands of indistinguishable members, and then handling the volumes of resulting data, is exceedingly challenging (Hasenjager et al., 2022; although see Biesmeijer and Seeley, 2005; Wario et al., 2017; Wild et al., 2021, Liberti et al., 2022, and Perez and Johnson, 2025). As a result, relatively little is known about the structure and properties of waggle dance communication networks and the factors that influence them.
Here we conducted a field experiment with fully-marked experimental colonies of honey bees housed in clear-walled hives to track the formation of real waggle dance communication networks in vivo. First, we calculate network density using a biologically-informed, simulated upper-bound; second, we describe the burstiness of bees’ waggle dance behavior; and third, we test whether individuality in waggle dance communication (Schürch et al., 2016), which has been shown to affect communication outcomes between a given dancer and follower (McHenry et al., 2025a), may also affect the structure of the network that emerges from dyad level interactions.
Materials and methods
Study organism, individual marking, and colony management
We studied two queenright experimental honey bee colonies of mixed European subspecies (Apis mellifera subsp.), each containing approximately 3,000 workers plus brood. These bees were marked (see below) as part of another project (McHenry et al., 2025a) but analyzed here for our investigation. Briefly, it was important that bees be individually identifiable from the onset of the experiment since we were interested in tracking the flow of information from bee to bee via waggle dance communications. To that end, we marked each cold-anesthetized worker with a unique identifier (UID). Each UID consisted of a combination of a colored, numbered disc tag (BetterBee, Greenwich, NY) that we glued to the thorax and a colored stripe from a paint pen (POSCA, USA) applied dorsally to the abdomen. We used sets of disc tags numbered 1–100 in five colors and paint pens in six colors to yield 3,000 distinct UID values. We placed each marked bee in a recovery chamber with the queen and access to sucrose solution until we were done with marking. In all, we marked approximately 3,000 workers from each colony. We installed workers in an observation hive with the queen, usually by mid-afternoon on the second day. We created and worked sequentially with two fully-marked colonies.
Each observation hive consisted of three American Standard Deep frames arranged vertically in a wooden scaffold such that the comb surfaces aligned in a single plane. This setup was enclosed with transparent Lexan, allowing unobstructed visual access to activity on the comb surface, including waggle dances. To encourage waggle dancing, we selected frames with some empty cells available for nectar storage, as previous work has shown that shortage of storage space leads to increased forager wait time for nectar unloading, which then reduces the likelihood of dances Seeley, 1989; Seeley and Tovey, 1994; Seeley, 1995). We housed the observation hives indoors at the Prices Fork Research Center in Blacksburg, Virginia, with hives connected to the outdoors via a plastic tube measuring approximately 5 cm x 30 cm.
We collected field data from July 11, 2022, to July 23, 2022, on warm sunny days with favorable foraging conditions. High summer tends to be a preferable time to train bees to feeders in our study area, since there is a relative scarcity of floral resources in the landscape, making our training sugar solution more attractive (Seeley et al., 1991; Ohlinger et al., 2022). Colonies received supplemental feeding during periods of poor weather, but this supplemental food was removed prior to data collection.
Pre-training phase: feeder training and recruitment of origin bees for network establishment
For each experimental colony, we trained bees to forage at an artificial feeder station using previously established stepwise training protocol (Schürch et al., 2013; Couvillon et al., 2015; Schürch et al., 2016, 2019; Ohlinger et al., 2022; Couvillon et al., 2023; McHenry et al., 2025a; McHenry et al., 2025b). Briefly, the training occurred in two phases called the pre-training phase and experimental phase. In the pre-training phase, we trained an initial cohort of foragers to collect 2 M sucrose solution scented with lavender (5 μL/L) from our artificial feeder station. This initial pre-training cohort would become our “origin” bees, so named because they would go on “originate” their own waggle dance communication networks during the experimental phase.
We initiated pre-training by loading a Petri dish with a few drops of the sucrose solution and placing it inside a small box, which we then secured over the exterior hive entrance using a tripod and duct tape. This setup ensured that foragers exiting the colony would explore the box, and that some would find the food source. A transparent window in the top of the box allowed us to monitor the Petri dish for drinking foragers. When at least three individual bees were drinking from the Petri dish, we carefully dislodged the box and gently transferred the dish directly onto the tripod platform, still situated just outside the hive entrance, taking great care not to disturb drinking bees. When 3–5 individual bees had each completed at least three foraging trips to and from the Petri dish, we swapped in the full feeder setup: a 4 oz glass jar (approximately 29.6 ml; Ball, Westminster, CO, USA) mounted on a plastic base with collection wells situated around the perimeter of the jar’s mouth. The tripod base’s platform was covered with a blue plastic tablecloth and its height set at 1 meter above the ground.
We then gradually relocated the feeder farther away from the colony in a stepwise fashion, moving across an open field in increments of 10–15 meters at a time. At each step, we waited until 5–15 bees had made at least three return trips, confirming that they had learned and remained committed to the current feeder location, before advancing to the next step. This stepwise procedure continued for 10–12 steps, until we reached the initial experimental feeder distance – 215 meters in Trial 1 and 315 in Trial 2 (see below for feeder distance rationale). This process typically lasted through the late afternoon or early evening. Allowing bees to accumulate multiple rewarding visits at the final feeder location increased the likelihood that they would return the following day as origin bees and perform waggle dances to recruit nestmates (Seeley, 1995).
Experimental phase: recruitment of naïve nestmates by origin bees
To begin the experimental phase, we re-established the feeder at the final location reached during pre-training. The experiment began when the first bee from the pre-training cohort returned to the feeder, which was freshly replenished with unscented 2 M sucrose solution. Such a concentrated solution provided a highly rewarding foraging experience for returning bees, which encouraged them to advertise the feeder and recruit a new wave of bees, which were our experimental phase recruits. These newly-recruited bees were of course already marked, but naïve to the location of our feeder. We used unscented sucrose solution to ensure that they would need to rely as much as possible on waggle dance information rather than on olfactory cues (Tautz and Sandeman, 2003; Tautz, 2022; Tautz, 2023).
Since one of our interests was to examine the role of individual waggle dance calibrations (Schürch et al., 2013; McHenry et al., 2025a) in the structure and propagation of the recruitment network, it was important to capture waggle dance data for as many experimental phase bees as possible. This is because, if a bee did not dance, we could not obtain a calibration value for her, and she would be ineligible for this portion of the analysis. To that end, we allowed foraging and recruitment to continue until our origin bees and 10–20 experimental phase recruits had each completed at least 2–3 unique waggle dance bouts advertising the feeder location. Four researchers participated in experimental phase data collection: two monitored and recorded foraging visits at the feeder, while two others observed and filmed waggle dances at the observation hive, one on either side of the colony so as to monitor both sides of the dance floor at once. We logged all feeder visits and waggle dances using ODK Collect on Samsung tablets, recording each bee’s UID and the event’s timestamp.
Video recording and monitoring of observation hives, extraction of waggle dance data from video
We filmed the bottom frame, or “dance floor,” of each observation hive continuously during experimental phase data collection, using two Canon Vixia G50 camcorders mounted on tripods. We placed one on either side of the observation hive, positioned approximately 1 meter from the comb surface to reduce parallax. Video data were recorded at 30 frames per second using the 3840x2160 resolution setting, and stored on SanDisk Extreme 256 GB SD cards. We labeled and stored SD cards as original video data, but also backed up all video data to a cloud-based repository and an external storage device (Seagate One Touch with Hub, 8 TB).
We had two main goals for our video data analysis: (1) to match each experimental phase recruit with the dancer who recruited her to map out the recruitment network, and, whenever possible, to (2) obtain dancers’ calibrations to study their effect on the network as a node attribute. Detailed description of methods used for video data extraction may be found in the Supplementary Online files for McHenry et al. (2025a). Briefly: to achieve this first goal, we matched each experimental phase recruit with the dancer from whom she learned of the feeder’s location (recall that this dancer could have been an origin bee or a fellow experimental phase recruit). To do this, we searched video data in the minutes preceding each bee’s first recorded feeder visit in DaVinci Resolve 18 (Version 18.0.4, Build 5) to find the last waggle dance where she followed at least one waggle run before arriving at the feeder (Seeley et al., 2000; Couvillon et al., 2012). Our criterion for dance following was being within antennal contact distance with the dancer during a waggle run (Rohrseitz and Tautz, 1999; Tanner and Visscher, 2008; Grüter and Ratnieks, 2011; Kietzman and Visscher, 2019).
To achieve the second goal of extracting waggle dance calibration values, we followed the dance decoding methods of Couvillon et al. (2012) in DaVinci Resolve, decoding four non-first, non-last waggle runs with two left-lead-ins and two right-lead-ins for each bee. The arithmetic mean of these four waggle runs gives a representative estimation of that bee’s waggle dance distance calibration (Couvillon et al., 2012; Schürch et al., 2013, 2019). Whenever possible, for each dancer-follower dyad, we decoded dancer waggle runs from the same dance bout that the successful recruit herself followed prior to arriving at the feeder, to represent as closely as possible the information that the recruit had received. For the successful recruits, we selected waggle runs from the first dance where our waggle dance decoding criteria could be met, and which occurred after the recruit had made at least three consecutive feeder visits (Chatterjee et al., 2019). This yielded waggle run duration values, measured in seconds, for each member of a successful dancer-follower dyad.
Here, we had to contend with a tricky feature of this dataset: for the purposes of the original study (McHenry et al., 2025a), waggle dance data were collected at not one, but two feeder distances from the colony as mentioned above (see that study’s Supplementary Online for rationale and details). This posed a challenge for our analysis, since calculating differences between calibrations in dancer-follower dyads would not be appropriate if waggle dances were advertising different distances. To account for this, we scaled all bees’ waggle run durations according the universal waggle dance calibration data object (Schürch et al., 2019) for the appropriate experimental distance (either 215 m, or 315 m). We first separated our observed waggle run duration data by distance category, and then joined them to a data frame containing a set of 1000 randomly selected, simulated waggle run duration values from the universal waggle dance calibration data object (Schürch et al., 2019) for the appropriate experimental distance. We then conducted scaling on each distance category’s full dataset including simulated and observed values before re-extracting our now-scaled observed values. For our analysis, we used these scaled duration values as calibration values.
Key network terms and definitions
The field of network analysis has its own vocabulary that is not commonplace even in closely related fields. Here (Table 1) we briefly define some key terms that we use to describe our networks and analyses.
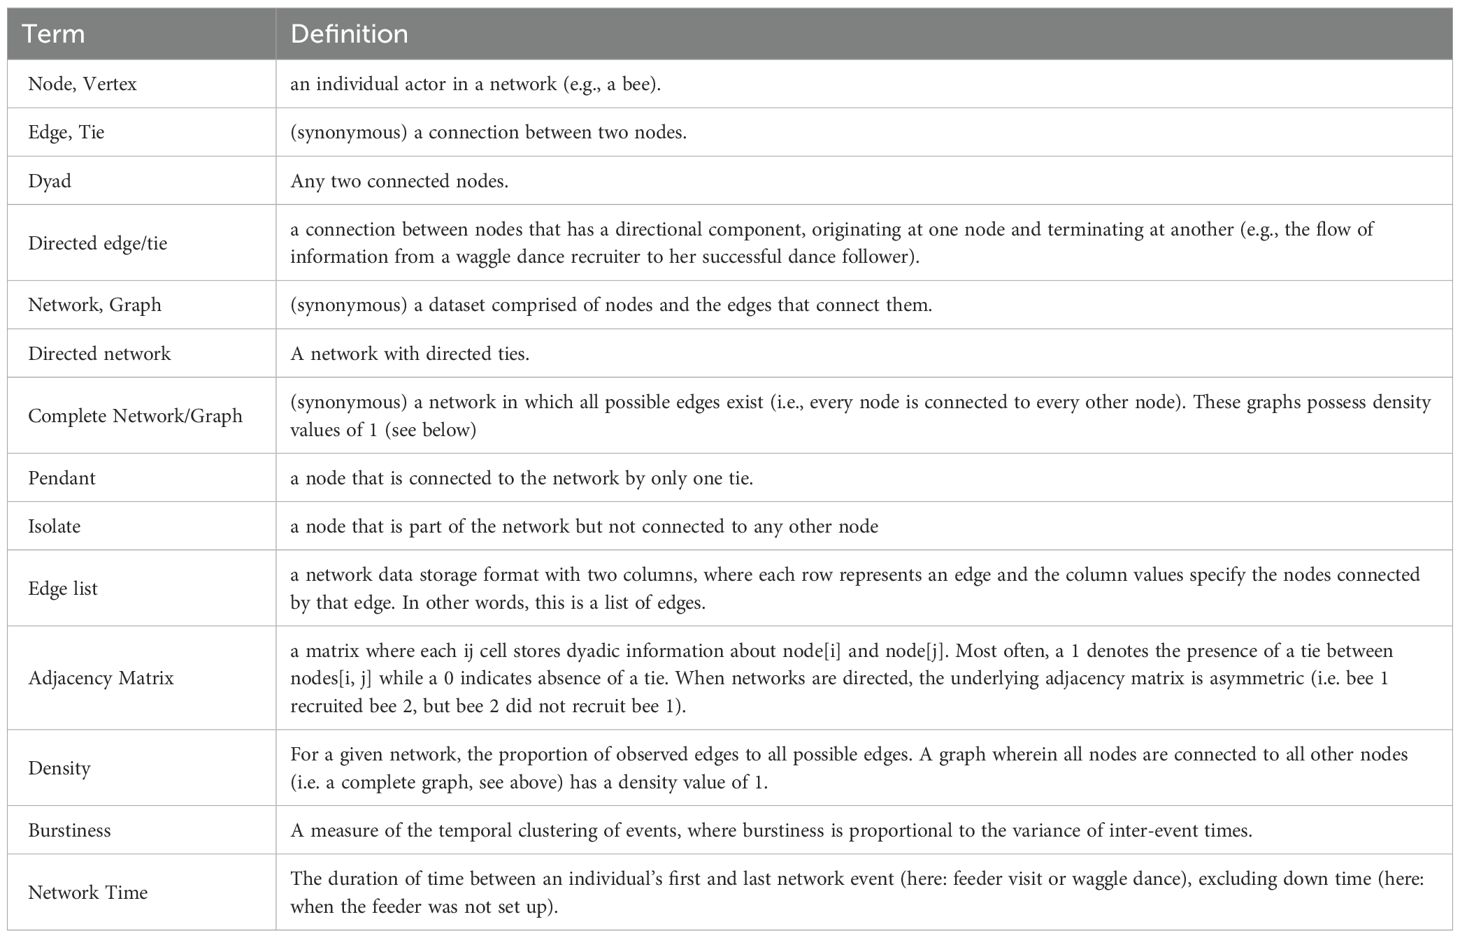
Table 1. Glossary of selected key network analysis terms.
Network construction
To construct the waggle dance communication network, we used the dancer-follower relationship datasets obtained from video analysis (Goal 1, see above) to create a network edge list using the igraph R package (Csárdi and Nepusz, 2006; Csárdi et al., 2024). We represented recruitment relationships as directed edges, with the edge pointing from dancer to follower along with the flow of information. Each node representing an experimental phase recruit thus has one inbound tie representing the receipt of feeder location information from the dancer that recruited her, but can have any number of outbound ties depending on the number of nestmates she herself went on to recruit. We also added isolate nodes to the network, which we considered to be origin bees that continued visiting the feeder during the experimental phase but did not recruit any nestmates to it, whether from lack of dancing or lack of dancing success. We excluded from the network any bee that participated in the pre-training phase but did not continue visiting the feeder after the start of the experimental phase.
Network density, with simulation of a biologically-informed upper bound
Network density is defined as the proportion of observed ties relative to the maximum number of ties possible for that network, which is also referred to as a complete graph (i.e. if every node were connected to every other node) (Bang-Jensen and Gutin, 2018). Density is a common network descriptive statistic, giving an overall measure of the level of connectivity or sparseness of a network. However, we considered that the case of a complete graph as a baseline comparison to our observed number of ties would be biologically meaningless, as there is no real-world scenario where every bee recruits every other bee to the same food source. Rather, a biologically-informed complete graph (hereafter referred to as BICG) of honey bee foraging would be one where every dancing bee had a perfect record of successfully recruiting every nestmate for whom she performed a waggle dance.
We therefore set out to simulate a BICG as an empirical estimate of an upper bound on network edges for a honey bee recruitment network using a deterministic compartmental model (DCM) of the susceptible-infected (SI) model family (Anderson and May, 1991; Gernat et al., 2018). Traditionally formulated deterministic SI models feature individuals that are in one of two states: either “susceptible” or “infected,” and an infected individual may infect susceptible individuals when they come in contact based on a given probability value that is specified in the model. We reimagined an SI model in the context of honey bee waggle dance communication, wherein “infected” bees are those with knowledge of a food resource, “susceptible” bees are nestmates that follow dance communications, in part because they are currently unemployed foraging elsewhere, and an “infection” would represent a successful recruitment to the resource of a susceptible bee by an infected bee. To simulate the BICGs of honey bee foraging, we set the “infection” probability to 1. The resulting network simulation therefore represents what the recruitment network might look like if bees were 100% effective at recruiting every nestmate they contacted while dancing – a more biologically relevant and informative upper bound that we then used in place of a complete graph in calculating network density.
Since density is calculated with respect to the complete graph for the set of nodes and edges belonging to the observed network, we parameterized and simulated a BICG for both trials. To do this, we used the dcm() function from the R package EpiModel (Jenness et al., 2018). We specified the number of initially-infected individuals for each trial as the number of origin bees that made at least one feeder visit during the experimental phase, since these were bees that had knowledge of the feeder location and thus had the opportunity to advertise it. We set the total population to 1,000 individuals, since colonies were created with 3,000 marked bees and roughly one-third of the workers within a colony may be involved in foraging activities at any given time (Seeley, 1995, Seeley, 2019).
Here we calculated classical density for each trial using both conventional complete graphs and corrected density using our BICG as upper bounds. For the sake of comparability between classical and BICG (corrected) density values, we first added dummy isolate nodes to our observed networks to get the node total to 1,000. We then supplied that graph object to the edge_density() function from the igraph package to obtain classical density for each trial. Then we calculated a corrected density for each trial by dividing the number of edges in the observed graph by the number of edges in the BICG.
Burstiness of waggle dancing
Burstiness is a concept used to describe the temporal clustering of events in a time series. In the context of network analysis, it refers to the phenomenon where nodes exhibit alternating periods of high and low activity (Barabási, 2005). This pattern indicates that events or interactions occur in clusters, and it deviates from a uniform or random distribution of actions over time.
To explore burstiness in waggle dance behavior, we first created a timeline of waggle dance bouts for each bee. To do this, we used the waggle dance data collected at the observation colony during the experimental phase to calculate the time interval between each successive dance for each bee, excluding overnight periods when data collection paused. A bee was eligible for burstiness analysis if she performed at least two waggle dances during the experimental phase, since the burstiness coefficient is calculated based on inter-event times. Therefore, we extracted the timelines of only bees who met these criteria, and we calculated the coefficient for each and then plotted the distribution of burstiness values.
Effect of individual calibrations on network structure
We set out to test whether individuality in waggle dance calibrations influenced the structure of waggle dance communication networks. Previously, we showed that individual calibrations (Schürch et al., 2016), rather than causing miscommunication, supported recruitment success depending on the relationship between the dancer’s and follower’s calibrations. Specifically, recruitment is more likely to succeed when a follower bee’s communicated waggle run duration for a given distance, or her calibration, is shorter than that of the dancer that recruited her (McHenry et al., 2025a). We call this type of calibration relationship the positive mismatch condition (dancer calibration – follower calibration > 0) and would likely result in the follower bee overshooting the target in the landscape, which might then double her resource discovery opportunities as she flies back over it on the way back to the hive (McHenry et al., 2025a). Now we wanted to know whether positive mismatch in calibrations would also affect the structure of the larger recruitment networks emerging from waggle dance interactions. Here, again, we needed to customize the analysis to reflect the biology of recruitment: since each bee could only be recruited to the feeder once, each bee could therefore have only one inbound tie, representing the successful receipt of feeder location information. To test the effect of calibration differences on network structure while respecting this one-inbound-tie network constraint, we implemented a custom node-label permutation test (Whitehead, 2008; Croft et al., 2009; Croft et al., 2011; Holt and Sullivan, 2023). In general, node-label permutation tests for significance by repeatedly shuffling the specified node attribute and calculating the outcome of interest over many iterations to generate a null distribution against which observed values are then compared. Here, we reshuffled scaled calibration values (described above) among nodes in our observed network and then calculated the number of ties in each permuted network that matched the longer-to-shorter calibration relationship criterion between dancers and followers. We then compared the observed number of ties matching this criterion against the permuted null distribution to obtain a p-value.
Statistical analysis and data visualization
We carried out all data cleaning, variable calculation, analysis, and visualization in R version 4.4.2 (R Core Team, 2024) and the following R packages: igraph v. 2.0.3 (Csárdi and Nepusz, 2006; Csárdi et al., 2024), knitr v. 1.46 (Xie, 2014; Xie, 2015; Xie, 2024), rmarkdown v. 2.26 (Xie et al., 2018; Allaire et al., 2024), tools v. 4.4.1 (R Core Team, 2024). We used the package grateful v. 0.2.4 (Rodríguez-Sánchez and Hutchins, 2020) to facilitate proper citation of all R packages used.
Data availability
Data and code underlying this manuscript are made accessible through the Virginia Tech Data Repository at DOI: 10.7294/29395904.
Results
Honey bee recruitment networks are sparse, but biologically-informed density corrects sparseness by three orders of magnitude
We calculated network density values for both trials using both a classically defined complete graph and our biologically-informed complete graph (BICG; see above). For Trial 1, the classical network density for the observed network was 3.60 x 10⁻⁵ (Figure 1, Trial 1a), and the corrected network density calculated with our simulated BICG was 3.68 x 10⁻² (Figure 1, Trial 1b). For Trial 2, classical network density for the observed network was 1.50 x 10⁻⁵ (Figure 1, Trial 2a), and corrected density using the simulated complete graph was 1.55 x 10⁻² (Figure 1, Trial 2b). In this way, both trials reveal that honey bee waggle dance recruitment networks are sparsely connected, and that the biologically-informed density values differed from the classical density values by a factor of 1000.
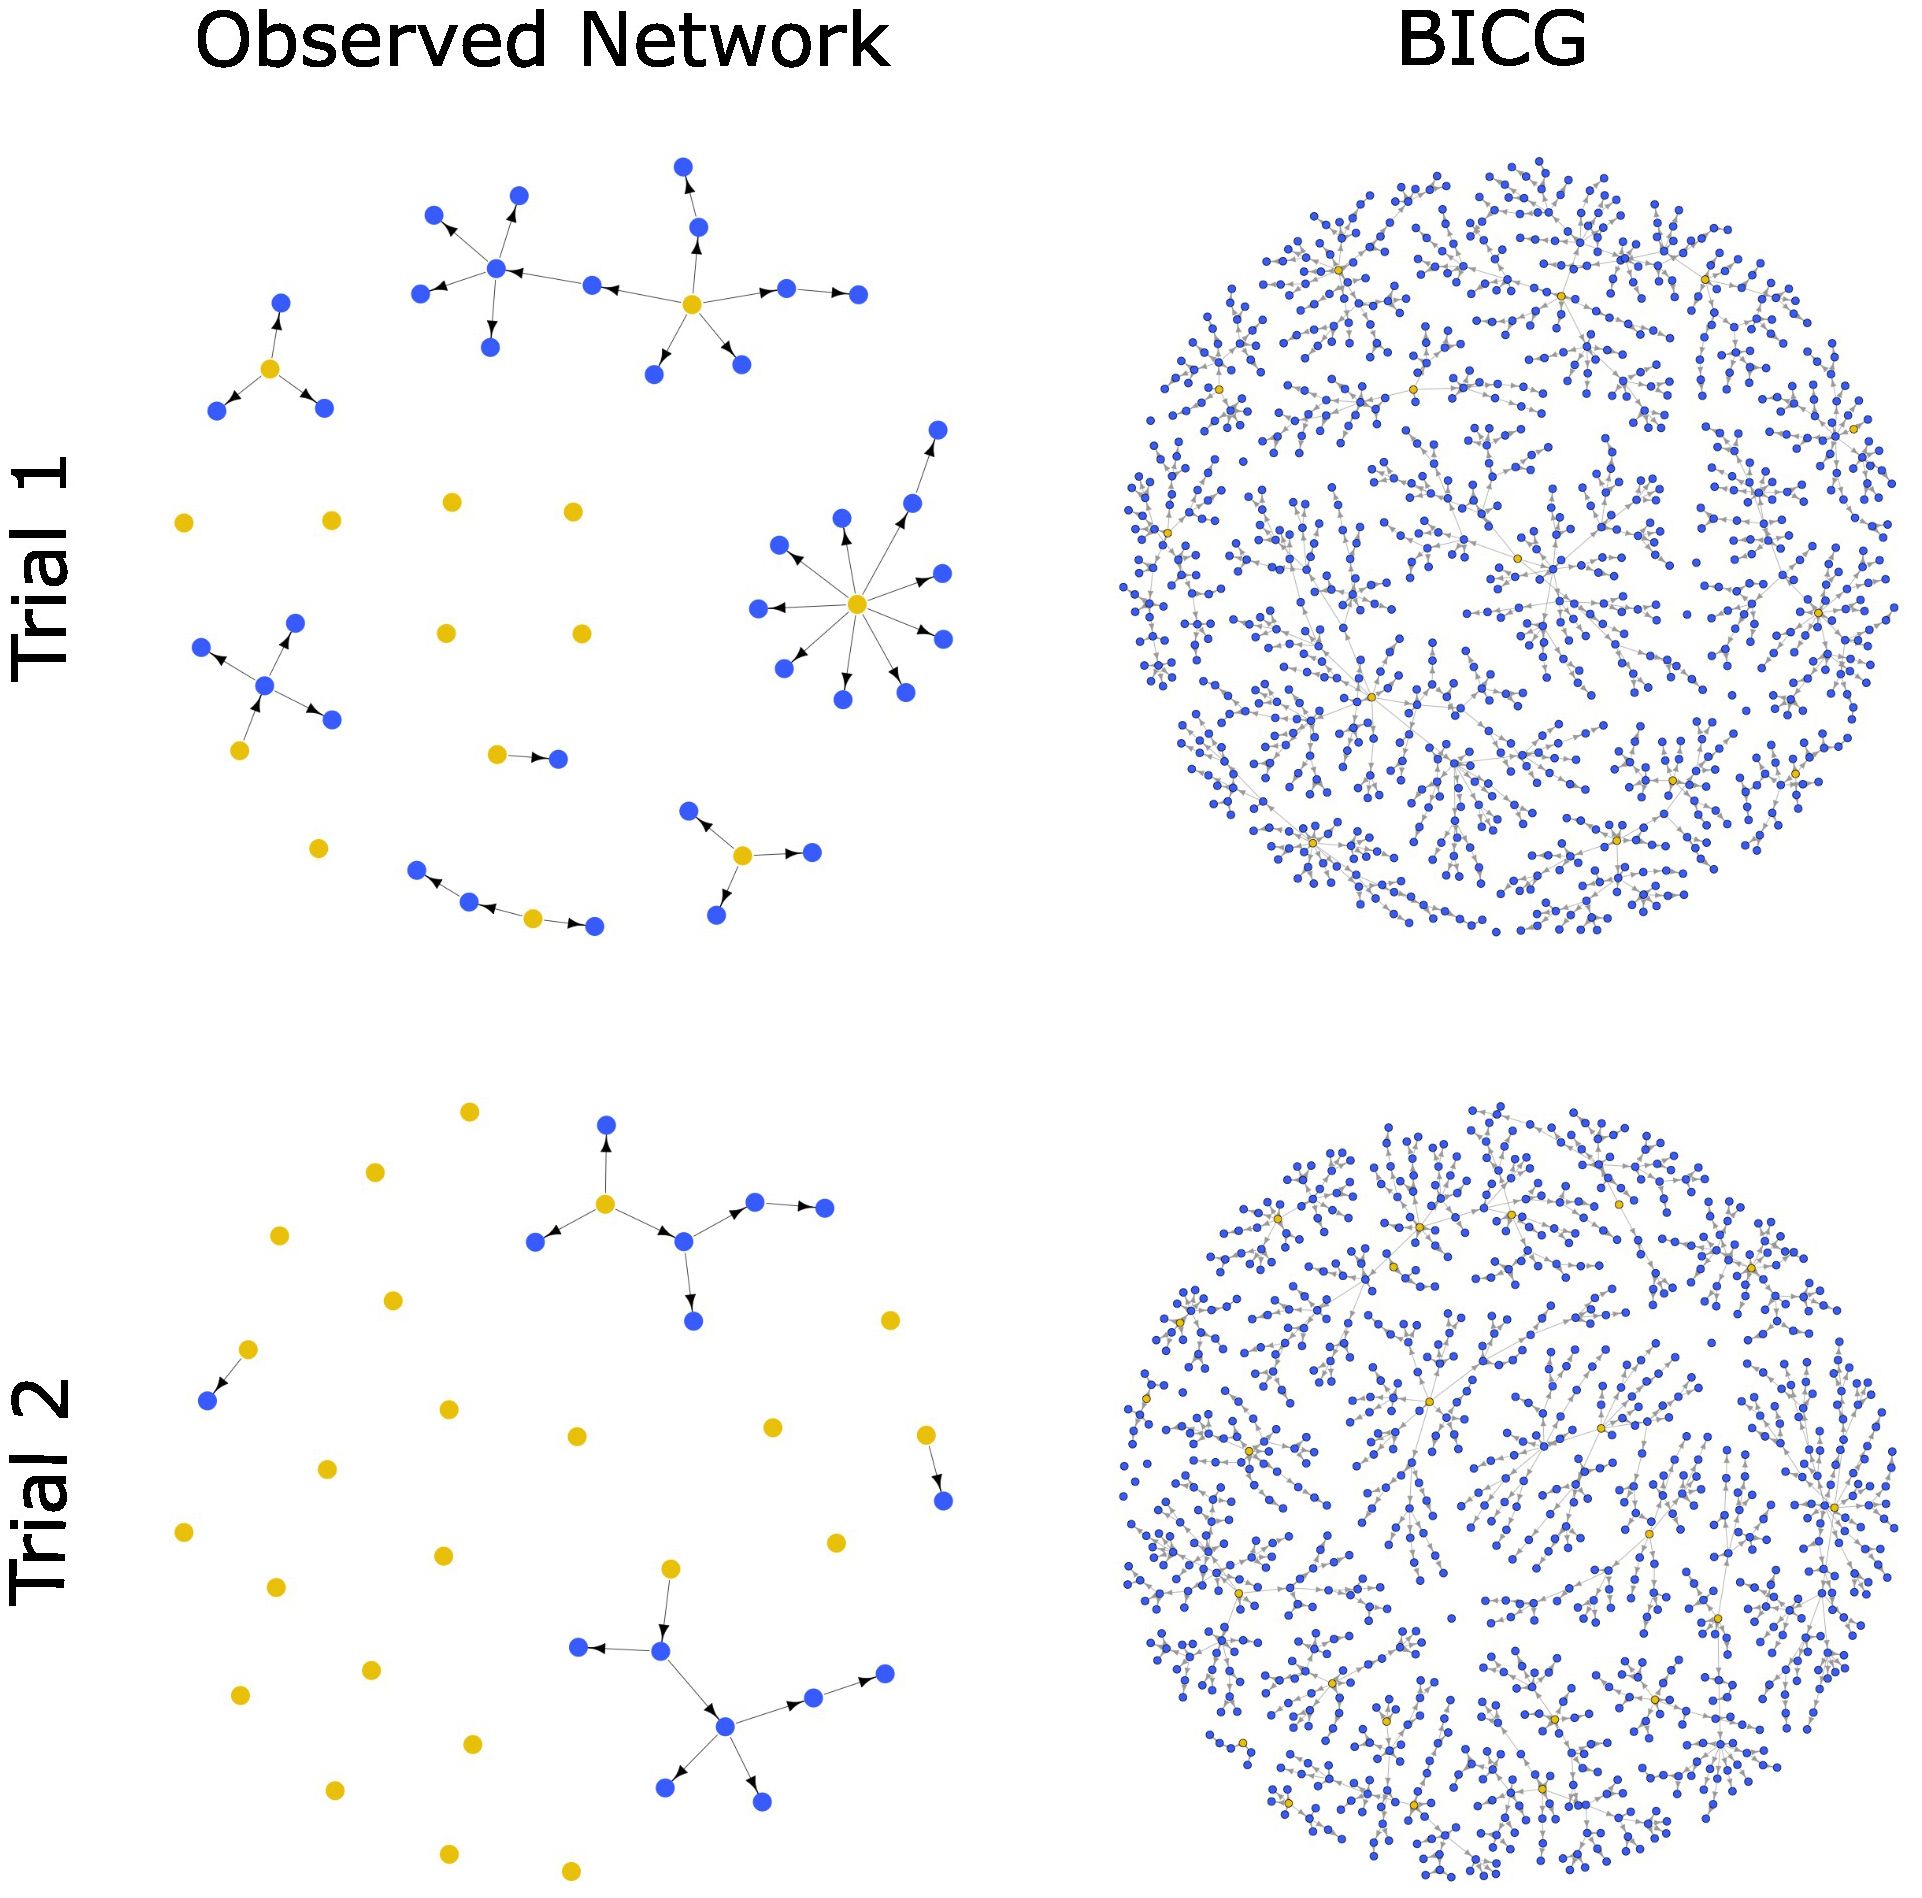
Figure 1. Observed waggle dance recruitment networks and biologically-informed complete graphs (BICG) for Trial 1 (top) and Trial 2 (bottom). For observed network structures, origin bees (yellow) participated in the pre-training phase; recruit bees (blue) were recruited to the feeder during the experimental phase. BICGs show the simulated complete graph for the corresponding trial’s observed network, constructed based on DCM model output using the same number of origin bees and a probability of recruitment success set to 1. Not shown: dummy isolate nodes added to observed networks to ensure comparability between observed and simulated networks (total nodes = 1000). Biologically-informed network density for each trial is calculated as (# Edges in Observed Network/# Edges in BICG).
Bees danced steadily, not burstily
Of the 63 bees that performed waggle dances during the experimental phase to advertise our feeders, 53 bees performed more than one dance and were thus eligible for burstiness analysis.
Overall, bees danced steadily, not burstily. We calculated a mean burstiness coefficient (95% CI) of -0.05 (-0.12 – 0.015). We also compared our observed distribution of burstiness coefficients against a normal distribution by quantifying skewness and kurtosis. Our burstiness coefficient distribution’s skewness was -0.68, indicating a left-skew, and its kurtosis was 3.26.
Dyadic calibration relationships affect recruitment network structure
The flow of information in the waggle dance recruitment network was facilitated by calibration differences. In our bees’ communication networks, 76% of recruitment events occurred between dyads where the dancer’s calibration was longer than the follower’s, with 23 ties out of 30 matching this criterion (Figure 2). This frequency of longer-to-shorter ties was higher than would be predicted by chance based on the permuted null distribution (p = 0.008). As a result of this phenomenon, chains of recruitment generally showed a trend of successively lower calibration values.
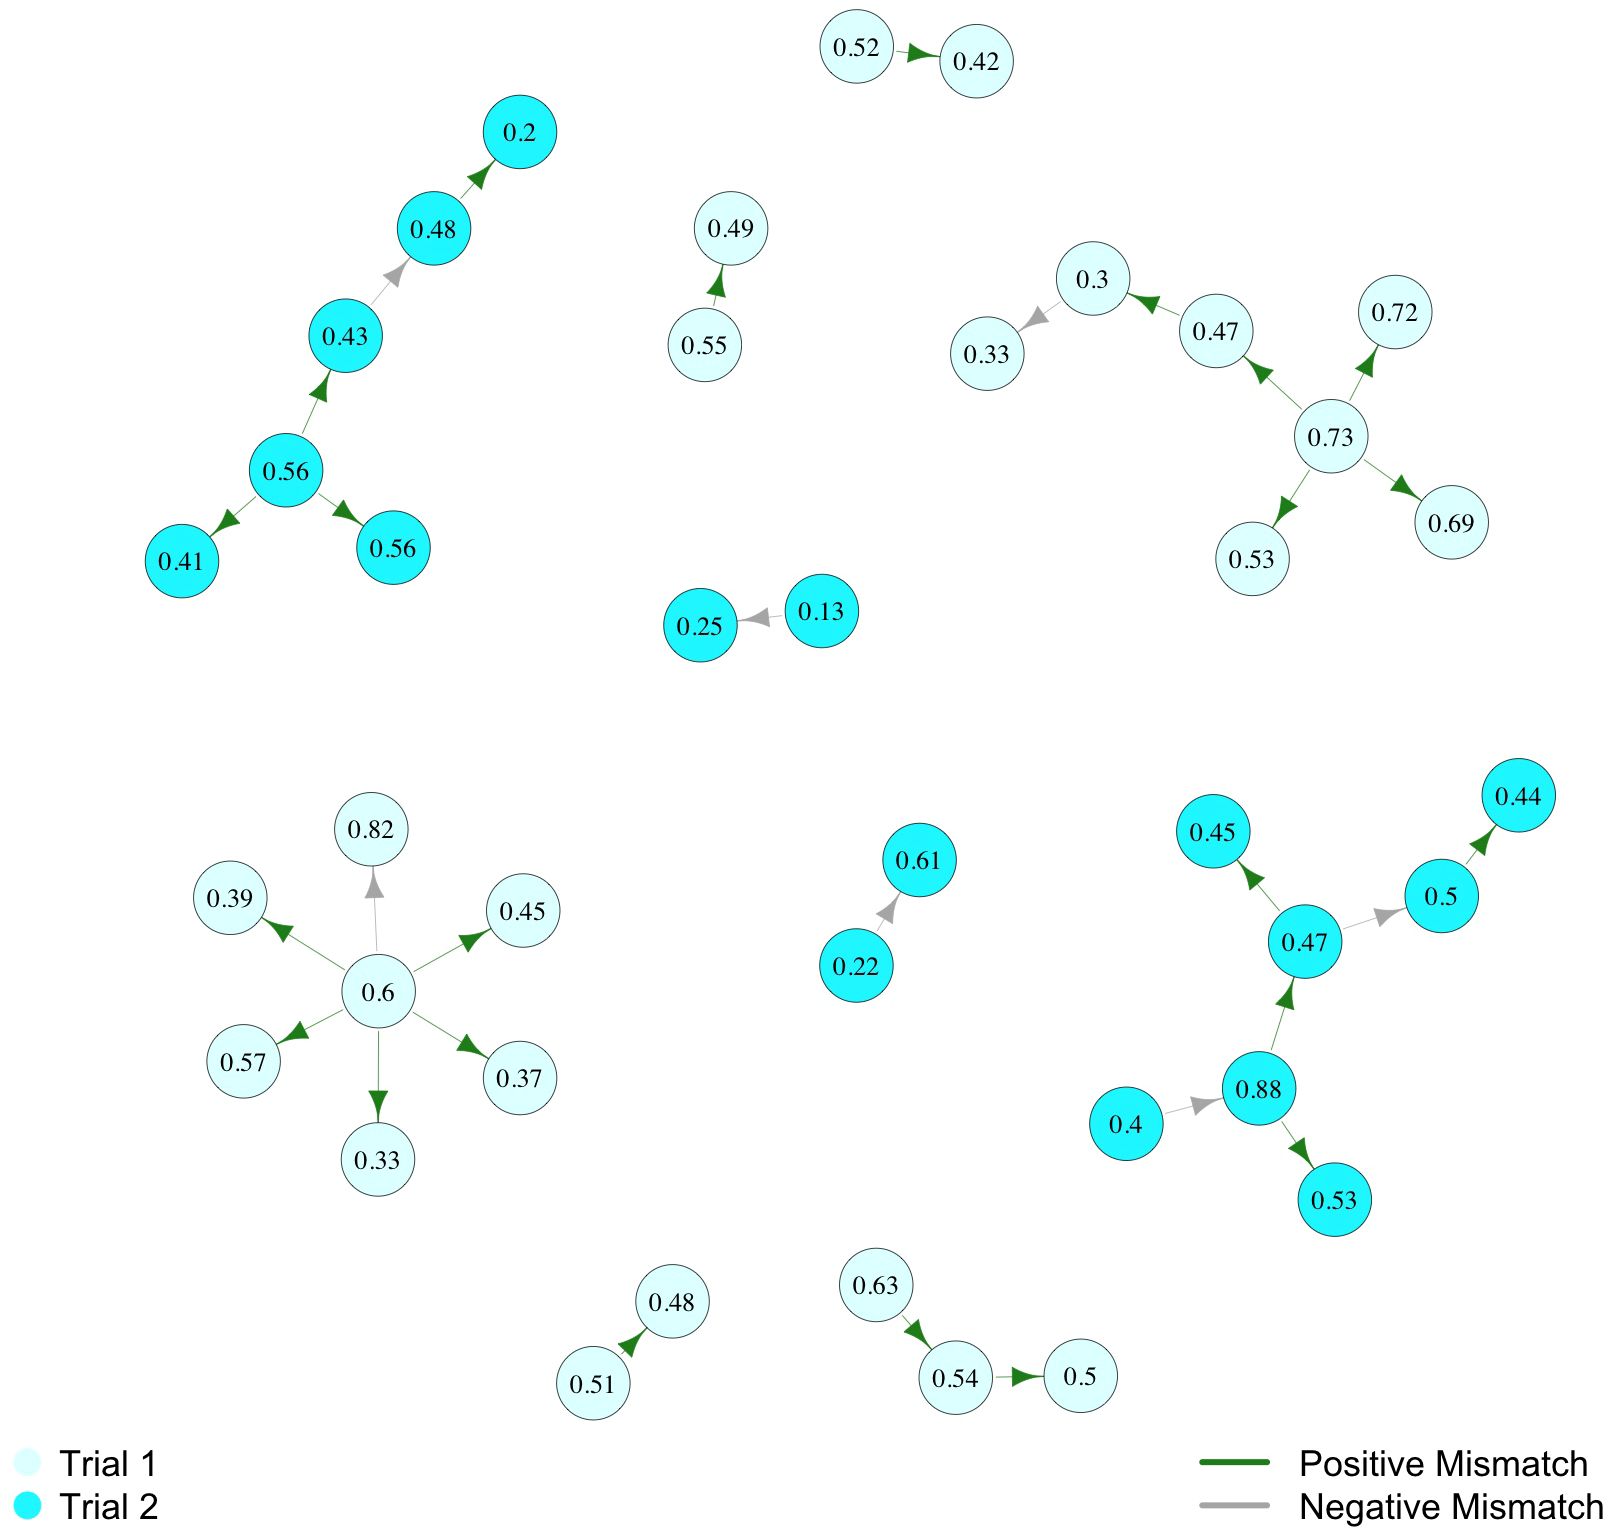
Figure 2. Network of waggle dance recruitment among calibratable bees. Node labels show that bee’s scaled waggle run duration value in seconds. Arrows show recruitment relationships, with the arrow pointing from dancer to successful follower. Arrow color denotes the calibration mismatch condition: green indicates the positive mismatch condition, where the dancer’s calibration > recruit’s calibration, and grey indicates the negative mismatch, where the dancer’s calibration < recruit’s calibration. Node color denotes the trial to which a network component belongs.
Discussion
This study investigated the structure and properties of the social network of waggle dance recruitment in honey bees. While the importance of a network analysis approach in gaining insights into the life of eusocial insects is widely understood, in vivo studies of such networks are rare due to the steep logistical difficulty of obtaining and handling these data. This study provides an empirical description of network density, burstiness, and the role of individuality in the honey bee waggle dance recruitment network and, as such, represents an important advancement in the intersection of network analysis and social insect behavioral ecology.
Recruitment networks are sparse
We found that, while both the classical density and biologically-informed density of observed recruitment networks were sparse, biologically-informed density calculated using our BICG yielded network density values that were higher than classical density by three orders of magnitude (Figure 1). Even when using our biologically-informed, simulated upper bound for waggle dance recruitment, the resulting network density values indicate an extremely sparse network structure, containing only up to 3.5% of the edges predicted by our BICGs (Figure 1). In other words, our model estimates that each trial’s pool of origin bees recruited only up to 3.5% of the nestmates that they might have, if they had a perfect recruitment record.
The sparseness of the recruitment network may be related to the fact that transmission of information and successful recruitment relies upon many signal receiver characteristics, choices, and what we might call luck. It is a leaky pipeline. For successful recruitment to occur, a potential receiver bee must first be within perceptive range of a waggle dance (Drosopoulos and Claridge, 2005), usually 3–6 cell diameters or 18–27 mm from the dancer (Tautz and Rohrseitz, 1998; Kietzman and Visscher, 2019). Even if she is within perceptive range, she may not choose to follow the dance (Tautz and Rohrseitz, 1998; Okada et al., 2008; Grüter and Farina, 2009). If she does, she must closely observe multiple waggle runs (Judd, 1994, mean 8 runs; Grüter et al., 2008, 17; Menzel et al., 2011, 20-23; Wray et al., 2012, 15.5), without being bumped off-course by nestmates. Having done this, she must then weigh this social information against any private information that she may possess (Grüter et al., 2008; Grüter and Ratnieks, 2011; Grüter et al., 2013), to decide whether act on the public dance information received, or do something else. Approximately 75 – 88% of dance-following interactions result in reactivation to a known foraging site on the part of experienced foragers (Biesmeijer and Seeley, 2005) rather than recruitment to the advertised food source (i.e., their dance-following does prompt a change in volitional state, but towards the use of private information rather than public (Grüter et al., 2008; Grüter and Farina, 2009; Grüter and Ratnieks, 2011; Hasenjager et al., 2020)). Finally, the last step in this leaky pipeline: 60-80% of bees who do set out to find the advertised resource will fail to do so (Esch and Bastian, 1970; Gould et al., 1970; Seeley, 1983; Seeley and Visscher, 1988; Seeley and Towne, 1992; Riley et al., 2005; Seeley, 1995). Considering all this together, perhaps such sparse network densities are unsurprising.
This leaky pipeline of recruitment, and the sparseness of recruitment networks that we found, are both consistent with the decentralized model of division of labor, where behavior is coordinated locally by the interaction of an individual’s morphology, genotype, age, and past experience with that individual’s particular social environment (Hölldobler and Wilson, 1990; Fewell and Page, 1993; Calderone, 1998; Beshers and Fewell, 2001; Ravary et al., 2007; Robinson, 2009). Most of these “leaks” in the recruitment pipeline may then be attributed to variation between bees’ predispositions and experience that leads only a subset of bees all the way to successful recruitment given the particular social stimuli on the dance floor. The sparseness of recruitment networks that we found is consistent with this paradigm. Additionally, however, sparse recruitment networks are consistent with what is known, if not fully understood, about honey bee foraging and recruitment: that the waggle dance is a famously inefficient system. The last leak in this pipeline, where 60 – 80% of bees who try to locate an advertised resource fail to do so (Esch and Bastian, 1970; Gould et al., 1970; Seeley, 1983; Seeley and Visscher, 1988; Seeley and Towne, 1992; Riley et al., 2005; Seeley, 1995), we consider not to be an example of local control of division of labor, but an inefficiency in the waggle dance as a semiotic system. In other words, this scenario is not a failure of the social environment to produce a task switch in a given individual, but rather a task switch initiated and failed. Furthermore, this failure incurs the cost of the energy needed to complete the unrewarded flight. As the sparseness of recruitment networks that we found is consistent with decentralized control of division of labor as well as inefficiency recruitment, it would now be interesting to examine the relative contributions of these two principles to the form and function of recruitment networks.
Our results also highlight the importance of calculating and interpreting network metrics in the context of the behavior and biology of the organism under study (Makagon et al., 2012; Alves et al., 2023). The default baseline for calculating network density, a complete graph where every node is connected to every other node (Bang-Jensen and Gutin, 2018), could not occur in the context of honey bee behavior. A forager bee, once committed to a food source, could not then be recruited to it again by every other forager bee. The large difference we found between the default method versus our biologically-informed approach emphasizes that such system-specific customization of network analyses can help glean more relevant insights into biological systems.
In this study, the adaptation of the deterministic SI model to simulate maximally-efficient recruitment was an important piece of such system-specific customization of analysis. These kinds of models have been used previously to study the social network of trophallaxis in honey bees (Gernat et al., 2018; Sun et al., 2020, with the same dataset) modeling the spread of infection through the sharing of crop content. As we did, those authors also used a deterministic SI model to simulate a graph representing the upper-bound of infection rates within a trophallaxis network, parameterized with a likelihood of infection set to 1. Here, we further customized the parameterization of the model according to the biology of waggle dance communication and recruitment: we (1) specified directed edges, since dance information flows from dancer to follower, and (2) supplied a total number of individuals (1,000) based on what is known about the proportions of workers that may be engaged in foraging at any given time (approx. 1/3) (Seeley, 1995; Seeley, 2019), with our total observation colony size being 3,000. An important limitation, however, is that we only studied the recruitment network for one food source at a time (our feeder). In reality, the dance floor of a freely foraging honey bee colony may host a medley of waggle dance signals advertising a variety of resources (Seeley, 1995; Couvillon et al., 2014; Garbuzov et al., 2015), and one third of the workers are not simply waiting around to be recruited, as they are in our model. It would now be interesting to customize such a model to reflect more specifically the proportion of the workforce that is on the dance floor, otherwise unoccupied, and in such a volitional state as to amenable to being recruited. To our knowledge, this work is the first to apply deterministic SI models to the study of waggle dance recruitment networks, but we suggest that there are further opportunities to extend their usefulness in studying the flow of information in bee societies.
Bees danced steadily, not burstily
We found that honey bees tend to waggle dance at regular intervals. Burstiness values close to zero, such as we observed, indicate high inter-event homogeneity. In other words, once bees begin to dance, they keep up a regular rhythm of dance bouts. Importantly, however, the functional role of burstiness (or lack thereof, as we found) on the spread of information through the honey bee foraging workforce is as yet unknown. Burstiness as a feature of node behavior in networks can either increase or decrease information flow, depending on the context and constraints of the network in question (Karsai et al., 2011; Lambiotte et al., 2013; Rocha and Blondel, 2013; Bakhouya and Gaber, 2015; Evans et al., 2020; Unicomb et al., 2021; Doi et al., 2023). For instance, while burstiness is associated with slowed spread in some human communication networks (Karsai et al., 2011), burstiness in honey bee trophallaxis networks is associated with a speedier spread of a simulated pathogenic infection (Gernat et al., 2018). However, what role burstiness might play in the regulation of collective foraging and recruitment networks is still unknown (although see Campos et al., 2016).
It is important to note that, unlike in a real-world foraging landscape, the feeder provides a single, ad libitum source of higher quality food, which generates tight commitment to a feeder (Couvillon et al., 2015; Schürch et al., 2016, Schürch et al., 2019; Ohlinger et al., 2022; Couvillon et al., 2023). It is not surprising, then, that a feeder training scenario such as ours, with highly regular foraging visits, would also have highly regular dance bouts. During a natural foraging trip, however, bees must visit, probe, and collect nectar from many flowers (Ribbands, 1949; Goulson, 1999), that may be dispersed patchily (Beekman and Ratnieks, 2000; Goulson, 2000; Goulson, 2003; Dornhaus and Chittka, 2004; Dornhaus et al., 2006). The time required to fill a crop may therefore vary widely on successive foraging trips, which would then translate to a more irregular rhythm of waggle dance bouts. This is in stark contrast to the flow of a feeder training experiment, where bees can get into a tight rhythm, coming back and forth from the feeder every 3–4 minutes (Ohlinger et al., 2022). It is therefore possible that the low burstiness we found might be overstated compared to a natural foraging scenario. Even so, we suggest that future studies of burstiness in social behaviors may provide a new avenue for understanding the inner workings of the honey bee superorganism.
Individual calibrations promote information spread
We found that individuality in waggle dance calibrations is positively associated with the propagation of the waggle dance recruitment network (Figure 2). This finding is consistent with and builds upon previous work that tested the role of individuality on recruitment success (McHenry et al., 2025a). In the waggle dance, each forager translates the real-world distance she has flown into a waggle run duration, and she does this according to her own (Schürch et al., 2016), linear (Schürch et al., 2019) distance-to-duration calibration curve. As a result, different bees advertising the same location may produce different waggle run durations, and these individual calibrations can therefore lead to calibration mismatch between dancers and followers. If the dancer’s calibration < follower’s calibration, the follower would interpret a closer distance than intended by the dancer (negative mismatch condition) and would be likely to undershoot the resource. On the other hand, if the dancer’s calibration > follower’s calibration, the follower would interpret a farther distance than intended by the dancer (positive mismatch condition) and would be likely to overshoot the resource. The magnitude of this mismatch will also vary across dancer-follower dyads. In our previous study (McHenry et al., 2025a), we were surprised to find that low mismatch magnitude did not support recruitment success, but the positive mismatch condition did. At the dyad level, then, it is the relationship between calibrations in given dancer-follower pairs that matters, rather than any individual attribute of one of the communication partners, that impacts the likelihood of communication success. Consistent with this dyad-level effect, and in keeping with our predictions, we found that the propagation of the recruitment network was likewise supported by positive mismatch between dancers’ and followers’ calibrations (p = 0.008). In other words, the flow of information from bee to bee and the formation of the network was facilitated, not hindered, by individuality.
It would now be interesting to determine how variety in individual calibrations interacts with a honey bee colony’s collective foraging strategy. It is known that forager bees generally fall into one of two main categories related to foraging strategy and information use: scouts, who tend to rely on private information and search independently for floral resources on the landscape, dancing when they have found something profitable, and non-scouts (Liang et al., 2012), who tend rely on public information and wait for waggle dance information to direct them to a profitable resource (Seeley, 1983; Beekman et al., 2007; Liang et al., 2012; Grüter et al., 2013). A colony wishing to maximize their exploitation of the landscape by dispatching foragers efficiently should therefore have scouts who are effective recruiters, and non-scouts who are easy to recruit. As positive mismatch in calibrations is associated with recruitment success, we therefore wonder whether scout bees might have, on the whole, higher calibrations compared to non-scouts. In such a scenario, scout bees with higher calibrations would originate longer chains of recruitment (Figure 2), where waggle dance information flows more readily down what we might call the calibration gradient.
Furthermore, there also likely exists a “sweet spot” in waggle dance calibration, where for a given resource distance, there is a duration that is just long enough to gain the benefit of positive mismatch, but not long enough to send recruits too far afield. A dancer whose calibration is too high compared to those of her nestmates would send would-be recruits too far, incurring greater flight costs and a wider search radius needed to locate the resource intended by the dancer (Tautz, 2022, 2023). We suggest that those bees who contribute the most to downstream propagation of waggle dance information would have calibration values somewhere in that sweet spot: high enough that a large proportion of followers would fit the positive mismatch condition, but not so high that mismatch magnitudes would be too large, sending most followers too far to find the resource. At the same time, the benefit of positive calibration mismatch between dancers and followers implies that there may be a limit on the length of recruitment chains. Information should flow more readily down the calibration gradient at first, from bees with higher calibrations to bees with lower calibrations, but only up to a point: eventually, the most recent recruits’ calibrations would be relatively low, and most of their followers would have the negative mismatch condition, which does not support recruitment. It would now be interesting to test whether bees with relatively high calibration values originate longer chains of recruitment, which ultimately peter out when bees at the end of the chain have sufficiently low calibrations. Overall, our findings emphasize that there is still more to learn about the role of individuality in the collective regulation of the honey bee colony superorganism (Hölldobler and Wilson, 2009; Borofsky et al., 2020).
Future directions
Managing complexity is one of the greatest problems facing modern-day human organization (Beer, 1981; Espejo and Reyes, 2011). The honey bee colony has already inspired a wide variety of models and algorithms seeking to refine strategies to accomplish this goal in fields ranging from computing networks (Wedde et al., 2004, 2005; Chamoli et al., 2015; Sun et al., 2020; Doi et al., 2023), informatics (Beynon-Davies, 2010), and the management of big data with artificial intelligence (Foss and Espejo, 2018) to sustainable civil engineering (Sahai et al., 2025). However, lack of empirical knowledge about honey bee network structures and their real-world parameters has mostly restricted the bio-inspiration available to these algorithms and models to general roles associated with division of labor in a colony (Farooq, 2009). A critical concern in stream-based computing is achieving low latency, or temporal lag in data transmission, coupled with high throughput, or volume of data transmission (Sun et al., 2020). Recent attention has focused on the testing of parameterization conditions of bee-inspired algorithms and models, including various network density conditions, in order to achieve these goals (Bakhouya and Gaber, 2015; Verma et al., 2025).
As far as we are aware, our data are the first to offer density and burstiness parameterization guidance directly from in vivo bee networks. We therefore hope and anticipate that these results may be of interest to researchers wishing to test bio-inspired algorithm parameterizations. In particular, it would be interesting to test the behavior of stream-based computing models when parameterized according to the density and burstiness properties observed in real bee networks. Would bee-inspired parameterizations offer good latency and throughput, or would they result in inefficient networks, as we might predict based on the famous inefficiency of the waggle dance? Such studies could provide mutually valuable insights into both bee biology and bio-inspired computing.
Finally, we must acknowledge that our results reflect recruitment networks as they formed under our particular, experimentally controlled conditions. Recruitment network outcomes might plausibly be affected by any number of other factors that influence foraging and waggle dance behavior, including the concentration of the sucrose reward (Seeley et al., 2000), colony size (Eckert et al., 1994; Beekman et al., 2004; Donaldson-Matasci et al., 2013; Snyder et al., 2024), composition of the surrounding landscape (Seeley, 1995; Ohlinger et al., 2024), time of year (Carr-Markell et al., 2020; Steele et al., 1995), a colony’s nutritional status and needs (Seeley, 1995; Ohlinger et al., 2022a), and the presence of scent cues (Tautz, 2022) may well affect network outcomes. Additionally, this study gives results from fewer replicates than are typical in this field (two instead of three) due to the extreme labor demands of creating fully-marked colonies, and should therefore be considered an opening foray into the study of the waggle dance recruitment network. Future work to elucidate differences and similarities between recruitment networks in these different biological contexts, and with greater replication, will provide fruitful insights into the role of social networks in the lives of bees.
Data availability statement
The datasets presented in this study can be found in online repositories. The names of the repository/repositories and accession number(s) can be found below: Data and code underlying this manuscript are made accessible through the Virginia Tech Data Repository. DOI: 10.7294/29395904.
Ethics statement
The manuscript presents research on animals that do not require ethical approval for their study.
Author contributions
LM: Conceptualization, Data curation, Formal Analysis, Investigation, Methodology, Software, Validation, Visualization, Writing – original draft, Writing – review & editing. RS: Conceptualization, Formal Analysis, Funding acquisition, Investigation, Methodology, Software, Writing – review & editing. LJ: Investigation, Writing – review & editing. BO: Investigation, Methodology, Writing – review & editing. MC: Conceptualization, Data curation, Formal Analysis, Funding acquisition, Investigation, Methodology, Project administration, Resources, Supervision, Validation, Writing – original draft, Writing – review & editing.
Funding
The author(s) declare financial support was received for the research and/or publication of this article. The research was supported by the National Institute of Food and Agriculture (Project no. VA-160209 to M.J.C., and VA-160129 to R.S.), and the Foundation for Food & Agri-culture Research (grant no. VA-549004 to M.J.C. and R.S.).
Acknowledgments
We thank Dr. James Wilson, Courtney Walls, Chris Logan, and Taylore Sydnor for their assistance with honey bee husbandry, along with all who assisted the coauthors in bee marking: Chad Campbell, Dr. Rob Ostrom, Dr. Kyle Bekelja, Courtney Walls, Liv Andrews, Helen Oker, Holly Stilwell, and David Rodriguez.
Conflict of interest
The authors declare that the research was conducted in the absence of any commercial or financial relationships that could be construed as a potential conflict of interest.
Generative AI statement
The author(s) declare that Generative AI was used in the creation of this manuscript. Generative AI was used as a code drafting and debugging assistant. An initial rough draft version of the code underlying the simulation of the biologically-informed complete graphs (BICG) was drafted with ChatGPT. All code chunks drafted in this way were rigorously checked and debugged by LCM and coauthors before being used as an entryway into the coding challenge of network simulation.
Any alternative text (alt text) provided alongside figures in this article has been generated by Frontiers with the support of artificial intelligence and reasonable efforts have been made to ensure accuracy, including review by the authors wherever possible. If you identify any issues, please contact us.
Publisher’s note
All claims expressed in this article are solely those of the authors and do not necessarily represent those of their affiliated organizations, or those of the publisher, the editors and the reviewers. Any product that may be evaluated in this article, or claim that may be made by its manufacturer, is not guaranteed or endorsed by the publisher.
References
Allaire J. J., Xie Y., Dervieux C., McPherson J., Luraschi J., Ushey K., et al. (2024).rmarkdown: Dynamic Documents for r. Available online at: https://github.com/rstudio/rmarkdown.
Alves D. A., George E. A., Kaur R., Brockmann A., Hrncir M., and Grüter C. (2023). Diverse communication strategies in bees as a window into adaptations to an unpredictable world. Proc. Natl. Acad. Sci. U.S.A. 120, e2219031120. doi: 10.1073/pnas.2219031120
Anderson R. M. and May R. M. (1991). Infectious Diseases of Humans: Dynamics and Control (OUP Oxford).
Anderson C. and Ratnieks F. L. W. (1999). Worker allocation in insect societies: coordination of nectar foragers and nectar receivers in honey bee (Apis mellifera) colonies. Behav. Ecol. Sociobiol. 46, 73–81. doi: 10.1007/s002650050595
Aplin L. M., Farine D. R., Mann R. P., and Sheldon B. C. (2014). Individual-level personality influences social foraging and collective behaviour in wild birds. Proc. R. Soc. B: Biol. Sci. 281, 20141016. doi: 10.1098/rspb.2014.1016
Bakhouya M. and Gaber J. (2015). Approaches for engineering adaptive systems in ubiquitous and pervasive environments. J. Reliable Intell. Environ. 1, 75–86. doi: 10.1007/s40860-015-0010-6
Bang-Jensen J. and Gutin G. (2018). “Basic terminology, notation and results,” in Classes of Directed Graphs. Eds. Bang-Jensen J. and Gutin G. (Springer International Publishing, Cham), 1–34. doi: 10.1007/978-3-319-71840-8_1
Barabási A.-L. (2005). The origin of bursts and heavy tails in human dynamics. Nature 435, 207–211. doi: 10.1038/nature03459
Baude M., Danchin E., Mugabo M., and Dajoz I. (2011). Conspecifics as informers and competitors: an experimental study in foraging bumble-bees. Proc. R. Soc B-Biol. Sci. 278, 2806–2813. doi: 10.1098/rspb.2010.2659
Beekman M. and Ratnieks F. L. W. (2000). Long-range foraging by the honey-bee, Apis mellifera L. Funct. Ecol. 14, 490–496. doi: 10.1046/j.1365-2435.2000.00443.x
Beekman M., Sumpter D. J. T., Seraphides N., and Ratnieks F. L. W. (2004). Comparing Foraging Behaviour of Small and Large Honey‑Bee Colonies by Decoding Waggle Dances Made by Foragers. Funct. Ecol. 18, 829–835.
Beekman M., Gilchrist A. L., Duncan M., and Sumpter D. J. T. (2007). What makes a honeybee scout? Behav. Ecol. Sociobiol. 61, 985–995. doi: 10.1007/s00265-006-0331-9
Beisner B., Braun N., Pósfai M., Vandeleest J., D’Souza R., and McCowan B. (2020). A multiplex centrality metric for complex social networks: sex, social status, and family structure predict multiplex centrality in rhesus macaques. PeerJ 8, e8712. doi: 10.7717/peerj.8712
Beshers S. N. and Fewell J. H. (2001). Models of division of labor in social insects. Annu. Rev. Entomology 46, 413–440. doi: 10.1146/annurev.ento.46.1.413
Beynon-Davies P. (2010). Dances with bees: Exploring the relevance of the study of animal communication to informatics. Int. J. Inf. Manage. 30, 185–198. doi: 10.1016/j.ijinfomgt.2010.02.001
Biesmeijer J. C. and Seeley T. D. (2005). The use of waggle dance information by honey bees throughout their foraging careers. Behav. Ecol. Sociobiol 59, 133–142. doi: 10.1007/s00265-005-0019-6
Borofsky T., Barranca V. J., Zhou R., Von Trentini D., Broadrup R. L., and Mayack C. (2020). Hive minded: like neurons, honey bees collectively integrate negative feedback to regulate decisions. Anim. Behav. 168, 33–44. doi: 10.1016/j.anbehav.2020.07.023
Calderone N. W. (1998). Proximate mechanisms of age polyethism in the honey bee, Apis mellifera L. Apidologie 29, 127–158. doi: 10.1051/apido:19980108
Campos D., Bartumeus F., Mendez V., Andrade J. S., and Espadaler X. (2016). Variability in individual activity bursts improves ant foraging success. J. R. Soc. Interface 13, 20160856. doi: 10.1098/rsif.2016.0856
Carr-Markell M. K., Demler C. M., Couvillon M. J., Schürch R., and Spivak M. (2020). Do honey bee (Apis mellifera) foragers recruit their nestmates to native forbs in reconstructed prairie habitats? PloS One 15vvv. doi: 10.1371/journal.pone.0228169
Chamoli S., Rana D., and Dimri S. (2015). Fault Tolerance and Load Balancing algorithm in Cloud Computing: A survey. Int. J. advance Res. Comput. communication Eng. 4. doi: 10.17148/IJARCCE.2015.4720
Chatterjee A., George E. A., , P. M. V., Basu P., and Brockmann A. (2019). Honey bees flexibly use two navigational memories when updating dance distance information. J. Exp. Biol. 222, jeb195099. doi: 10.1242/jeb.195099
Cook C. N., Lemanski N. J., Mosqueiro T., Ozturk C., Gadau J., Pinter-Wollman N., et al. (2020). Individual learning phenotypes drive collective behavior. Proc. Natl. Acad. Sci. 117, 17949–17956. doi: 10.1073/pnas.1920554117
Cook C. N., Mosqueiro T., Brent C. S., Ozturk C., Gadau J., Pinter-Wollman N., et al. (2019). Individual differences in learning and biogenic amine levels influence the behavioural division between foraging honeybee scouts and recruits. J. Anim. Ecol. 88, 236–246. doi: 10.1111/1365-2656.12911
Couvillon M. J. (2012). The dance legacy of karl Von frisch. Insectes Sociaux 59, 297–306. doi: 10.1007/s00040-012-0224-z
Couvillon M. J., Al Toufailia H., Butterfield T. M., Schrell F., Ratnieks F. L. W., and Schürch R. (2015). Caffeinated forage tricks honeybees into increasing foraging and recruitment behaviors. Curr. Biol. 25, 2815–2818. doi: 10.1016/j.cub.2015.08.052
Couvillon M. J., Ohlinger B. D., Bizon C., Johnson L. E., McHenry L. C., McMillan B. E., et al. (2023). A volatilized pyrethroid insecticide from a mosquito repelling device does not impact honey bee foraging and recruitment. J. Insect Sci. 23, 11. doi: 10.1093/jisesa/iead079
Couvillon M. J., Pearce F. C. R., Harris-Jones E. L., Kuepfer A. M., Mackenzie-Smith S. J., Rozario L. A., et al. (2012). Intra-dance variation among waggle runs and the design of efficient protocols for honey bee dance decoding. Biol. Open 1, 467–472. doi: 10.1242/bio.20121099
Couvillon M. J., Schürch R., and Ratnieks F. L. W. (2014). Waggle Dance Distances as Integrative Indicators of Seasonal Foraging Challenges. PLoS ONE 9, e93495. doi: 10.1371/journal.pone.0093495
Croft D. P., Krause J., Darden S. K., Ramnarine I. W., Faria J. J., and James R. (2009). Behavioural trait assortment in a social network: patterns and implications. Behav. Ecol. Sociobiol 63, 1495–1503. doi: 10.1007/s00265-009-0802-x
Croft D. P., Madden J. R., Franks D. W., and James R. (2011). Hypothesis testing in animal social networks. Trends Ecol. Evol. 26, 502–507. doi: 10.1016/j.tree.2011.05.012
Csárdi G. and Nepusz T. (2006). The igraph software package for complex network research. InterJournal Complex Syst. 1695. doi: 10.5281/zenodo.3630268
Csárdi G., Nepusz T., Traag V., Horvát S., Zanini F., Noom D., et al. (2024). igraph: network analysis and visualization in r. doi: 10.5281/zenodo.7682609
Dall S. R. X., Giraldeau L. A., Olsson O., McNamara J. M., and Stephens D. W. (2005). Information and its use by animals in evolutionary ecology. Trends Ecol. Evol. 20, 187–193. doi: 10.1016/j.tree.2005.01.010
Danchin É., Giraldeau L. A., Valone T. J., and Wagner R. H. (2004). Public information:: From nosy neighbors to cultural evolution. Science 305, 487–491. doi: 10.1126/science.1098254
Doi I., Deng W., and Ikegami T. (2023). Spontaneous and information-induced bursting activities in honeybee hives. Sci. Rep. 13, 11015. doi: 10.1038/s41598-023-37785-8
Donaldson‑Matasci M. C., DeGrandi‑Hoffman G., and Dornhaus A. (2013). Bigger is better: honeybee colonies as distributed information‑gathering systems. Anim. Behav. 85, 585–592. doi: 10.1016/j.anbehav.2012.12.020
Dornhaus A. and Chittka L. (2004). Why do honey bees dance? Behav. Ecol. Sociobiology 55, 395–401. doi: 10.1007/s00265-003-0726-9
Dornhaus A., Klügl F., Oechslein C., Puppe F., and Chittka L. (2006). Benefits of recruitment in honey bees: effects of ecology and colony size in an individual-based model. Behav. Ecol. 17, 336–344. doi: 10.1093/beheco/arj036
Drosopoulos S. and Claridge M. F. (Eds.). (2005). Insect sounds and communication: physiology, behaviour, ecology, and evolution. CRC Press, Boca Raton. doi: 10.1201/9781420039337
Easter C., Leadbeater E., and Hasenjager M. J. (2022). Behavioural variation among workers promotes feed-forward loops in a simulated insect colony. R. Soc. Open Sci. 9, 220120. doi: 10.1098/rsos.220120
Eckert C. D., Winston M. L., and Ydenberg R. C. (1994). The relationship between population size, amount of brood, and individual foraging behaviour in the honey bee, Apis mellifera L.. Oecologia 97, 248–255. doi: 10.1007/BF00323157
Esch H. and Bastian J. A. (1970). How do newly recruited honey bees approach a food site? Z. Fur Vergleichende Physiologie 68, 175–181. doi: 10.1007/BF00297693
Esch H. E., Zhang S., Srinivasan M. V., and Tautz J. (2001). Honeybee dances communicate distances measured by optic flow. Nature 411, 581–583. doi: 10.1038/35079072
Espejo R. and Reyes A. (2011). Organizational Systems: Managing Complexity with the Viable System Model (Berlin, Germany: Springer Science & Business Media).
Evans J. C., Silk M. J., Boogert N. J., and Hodgson D. J. (2020). Infected or informed? Social structure and the simultaneous transmission of information and infectious disease. Oikos 129, 1271–1288. doi: 10.1111/oik.07148
Farooq M. (2009). Bee-Inspired Protocol Engineering: From Nature to Networks (Berlin, Germany: Springer Science & Business Media).
Fewell J. H. and Page R. E. (1993). Genotypic variation in foraging responses to environmental stimuli by honey bees, Apis mellifera. Experientia 49, 1106–1112. doi: 10.1007/BF01929923
Finn K. R., Silk M. J., Porter M. A., and Pinter-Wollman N. (2019). The use of multilayer network analysis in animal behaviour. Anim. Behav. 149, 7–22. doi: 10.1016/j.anbehav.2018.12.016
Firth J. A., Voelkl B., Farine D. R., and Sheldon B. C. (2015). Experimental evidence that social relationships determine individual foraging behavior. Curr. Biol. 25, 3138–3143. doi: 10.1016/j.cub.2015.09.075
Foss R. A. and Espejo R. (2018). Coping with complexity: Variety regulation by honey bee nectar foragers. Futures Futures Society: Interact. Revolution 103, 115–122. doi: 10.1016/j.futures.2018.07.008
Franklin E. L. (2014). The journey of tandem running: the twists, turns and what we have learned. Insect. Soc 61, 1–8. doi: 10.1007/s00040-013-0325-3
Franks N. R. and Richardson T. (2006). Teaching in tandem-running ants. Nature 439, 153–153. doi: 10.1038/439153a
Garbuzov M., Couvillon M. J., Schürch R., and Ratnieks F. L. (2015). Honey bee dance decoding and pollen-load analysis show limited foraging on spring-flowering oilseed rape, a potential source of neonicotinoid contamination. Agriculture Ecosyst. Environ. 203, 62–68. doi: 10.1016/j.agee.2014.12.009
Gernat T., Rao V. D., Middendorf M., Dankowicz H., Goldenfeld N., and Robinson G. E. (2018). Automated monitoring of behavior reveals bursty interaction patterns and rapid spreading dynamics in honeybee social networks. Proc. Natl. Acad. Sci. 115, 1433–1438. doi: 10.1073/pnas.1713568115
Gordon D. M. (2010). Ant encounters: Interaction Networks and Colony Behavior (Princeton, New Jersey, USA: Princeton University Press). doi: 10.1515/9781400835447
Gould J. L. (1975). Honey Bee Recruitment: The Dance-Language Controversy: Unambiguous experiments show that honey bees use an abstract language for communication. Science 189, 685–693. doi: 10.1126/science.1154023
Gould J. L., Henerey M., and MacLeod M. C. (1970). Communication of Direction by the Honey Bee: Review of previous work leads to experiments limiting olfactory cues to test the dance language hypothesis. Science 169, 544–554.
Goulson D. (1999). Foraging strategies of insects for gathering nectar and pollen, and implications for plant ecology and evolution. Perspect. Plant Ecology Evol. Systematics 2, 185–209. doi: 10.1078/1433-8319-00070
Goulson D. (2000). Why do pollinators visit proportionally fewer flowers in large patches? Oikos 91, 485–492. doi: 10.1034/j.1600-0706.2000.910309.x
Grüter C., Balbuena M. S., and Farina W. M. (2008). Informational conflicts created by the waggle dance. Proc. R. Soc. B: Biol. Sci. 275, 1321–1327. doi: 10.1098/rspb.2008.0186
Grüter C. and Farina W. M. (2009). The honeybee waggle dance: can we follow the steps? Trends Ecol. Evol. 24, 242–247. doi: 10.1016/j.tree.2008.12.007
Grüter C. and Leadbeater E. (2014). Insights from insects about adaptive social information use. Trends Ecol. Evol. 29, 177–184.
Grüter C. and Ratnieks F. L. W. (2011). Honeybee foragers increase the use of waggle dance information when private information becomes unrewarding. Anim. Behav. 81, 949–954. doi: 10.1016/j.anbehav.2011.01.014
Grüter C., Segers F. H., and Ratnieks F. L. (2013). Social learning strategies in honeybee foragers: do the costs of using private information affect the use of social information? Anim. Behav. 85, 1443–1449.
Hasenjager M. J. and Dugatkin L. A. (2015). Social network analysis in behavioral ecology, in: Advances in the Study of Behavior. Elsevier, pp. 39–114. doi: 10.1016/bs.asb.2015.02.003
Hasenjager M. J., Franks V. R., and Leadbeater E. (2022). From dyads to collectives: a review of honeybee signalling. Behav. Ecol. Sociobiol 76, 124. doi: 10.1007/s00265-022-03218-1
Hasenjager M. J., Hoppitt W., Cunningham-Eurich I., Franks V. R., and Leadbeater E. (2024). Coupled information networks drive honeybee (Apis mellifera) collective foraging. J. Anim. Ecol. 93, 71–82. doi: 10.1111/1365-2656.14029
Hasenjager M. J., Hoppitt W., and Leadbeater E. (2020). Network-based diffusion analysis reveals context-specific dominance of dance communication in foraging honeybees. Nat. Commun. 11, 1–9. doi: 10.1038/s41467-020-14410-0
Hasenjager M. J., Leadbeater E., and Hoppitt W. (2021a). Detecting and quantifying social transmission using network-based diffusion analysis. J. Anim. Ecol. 90, 8–26. doi: 10.1111/1365-2656.13307
Hasenjager M. J., Silk M., and Fisher D. N. (2021b). Multilayer network analysis: new opportunities and challenges for studying animal social systems. Curr. Zoology 67, 45–48. doi: 10.1093/cz/zoab006
Hölldobler B. and Wilson E. O. (2009). The Superorganism: The Beauty Elegance And Strangeness Of Insect Societies (New York, USA: W. W. Norton & Company).
Holt C. A. and Sullivan S. P. (2023). Permutation tests for experimental data. Exp. Econ 26, 775–812. doi: 10.1007/s10683-023-09799-6
Jenness S. M., Goodreau S. M., and Morris M. (2018). EpiModel: an R package for mathematical modeling of infectious disease over networks. J. Stat. Software 84, 1–47. doi: 10.18637/jss.v084.i08
Judd T. M. (1994). The waggle dance of the honey bee: Which bees following a dancer successfully acquire the information? J. Insect Behav. 8, 343–354. doi: 10.1007/BF01989363
Karsai M., Kivelä M., Pan R. K., Kaski K., Kertész J., Barabási A.-L., et al. (2011). Small but slow world: How network topology and burstiness slow down spreading. Phys. Rev. E 83, 25102. doi: 10.1103/PhysRevE.83.025102
Kietzman P. M. and Visscher P. K. (2015). The anti-waggle dance: use of the stop signal as negative feedback. Front. Ecol. Evol. 3. doi: 10.3389/fevo.2015.00014
Kietzman P. M. and Visscher K. (2019). Follower position does not affect waggle dance information transfer. Psyche 2019, 4939120. doi: 10.1155/2019/4939120
Krause J., Croft D. P., and James R. (2007). Social network theory in the behavioural sciences: potential applications. Behav. Ecol. Sociobiol 62, 15–27. doi: 10.1007/s00265-007-0445-8
Krause D. J., James R., Franks D. W., and Croft D. P. (2015). Animal Social Networks (Oxford, United Kingdom: Oxford University Press).
Krause J., Lusseau D., and James R. (2009). Animal social networks: an introduction. Behav. Ecol. Sociobiol 63, 967–973. doi: 10.1007/s00265-009-0747-0
Lambiotte R., Tabourier L., and Delvenne J. C. (2013). Burstiness and spreading on temporal networks. Eur. Phys. J. B 86, 320. doi: 10.1140/epjb/e2013-40456-9
Liang Z. S., Nguyen T., Mattila H. R., Rodriguez‑Zas S. L., Seeley T. D., and Robinson G. E. (2012). Molecular Determinants of Scouting Behavior in Honey Bees. Science 335, 1225–1228. doi: 10.1126/science.1213962
Liberti J., Kay T., Quinn A., Kesner L., Frank E. T., Cabirol A., et al. (2022). The gut microbiota affects the social network of honeybees. Nat Ecol Evol 6, 1471–1479. doi: 10.1038/s41559-022-01840-w
Loftus J. C., Perez A. A., and Sih A. (2021). Task syndromes: linking personality and task allocation in social animal groups. Behav. Ecol. 32, 1–17. doi: 10.1093/beheco/araa083
Makagon M. M., McCowan B., and Mench J. A. (2012). How can social network analysis contribute to social behavior research in applied ethology? Appl. Anim. Behav. Science Special Issue: Living In Large Groups 138, 152–161. doi: 10.1016/j.applanim.2012.02.003
McHenry L. C., Schürch R., Johnson L. E., Ohlinger B. D., and Couvillon M. J. (2025a). Individuality impacts communication success in honey bees. Curr. Biol. 35, R137–R138. doi: 10.1016/j.cub.2024.12.047
McHenry L. C., Schürch R., Council-Troche M., Gross A. D., Johnson L. E., Ohlinger B. D., et al. (2025b). Sublethal glyphosate exposure reduces honey bee foraging and alters the balance of biogenic amines in the brain. J. Exp. Biol. 228, jeb250124. doi: 10.1242/jeb.250124
Michener C. D. (1969). Comparative social behavior of bees. Annu. Rev. Entomology 14, 299–342. doi: 10.1146/annurev.en.14.010169.001503
Menzel R., Kirbach A., Haass W.‑D., Fischer B., Fuchs J., Koblofsky M., et al. (2011). A Common Frame of Reference for Learned and Communicated Vectors in Honeybee Navigation. Curr. Biol. 21, 645–650. doi: 10.1016/j.cub.2011.02.039
Nieh J. C. and Tautz J. (2000). Behaviour-locked signal analysis reveals weak 200–300 Hz comb vibrations during the honeybee waggle dance. J. Exp. Biol. 203, 1573–1579. doi: 10.1242/jeb.203.10.1573
O’Shea-Wheller T. A., Hunt E. R., and Sasaki T. (2021). Functional heterogeneity in superorganisms: emerging trends and concepts. Ann. Entomological Soc. America 114, 562–574. doi: 10.1093/aesa/saaa039
Ohlinger B. D., Couvillon M. J., and Schürch R. (2024). Agricultural grasslands provide forage for honey bees but only when nearby. Agric. Ecosyst. Environ. 359, 108722. doi: 10.1016/j.agee.2023.108722
Ohlinger B. D., Schürch R., Durzi S., Kietzman P. M., Silliman M. R., and Couvillon M. J. (2022). Honey bees (Hymenoptera: apidae) decrease foraging but not recruitment after neonicotinoid exposure. J. Insect Sci. 22, 16. doi: 10.1093/jisesa/ieab095
Ohlinger B. D., Schürch R., Silliman M. R., Steele T. N., and Couvillon M. J. (2022a). Dance-communicated distances support nectar foraging as a supply-driven system. Biol. Lett. 18, 20220155. doi: 10.1098/rsbl.2022.0155
Okada R., Ikeno H., Aonuma H., and Ito E. (2008). Biological insights into robotics: honeybee foraging behavior by a waggle dance. Advanced Robotics 22, 1665–1681. doi: 10.1163/156855308X368967
Perez A. and Johnson B. R. (2025). Centrality of hygienic honey bee workers in colony social networks. Insects 16, 58. doi: 10.3390/insects16010058
Pinter-Wollman N., Wollman R., Guetz A., Holmes S., and Gordon D. M. (2011). The effect of individual variation on the structure and function of interaction networks in harvester ants. J. R. Soc. Interface 8, 1562–1573. doi: 10.1098/rsif.2011.0059
Ravary F., Lecoutey E., Kaminski G., Châline N., and Jaisson P. (2007). Individual experience alone can generate lasting division of labor in ants. Curr. Biol. 17, 1308–1312. doi: 10.1016/j.cub.2007.06.047
R Core Team (2024). R: A language and environment for statistical computing (Vienna, Austria: R Foundation for Statistical Computing). Available online at: https://www.R-project.org/ (Accessed February 3, 2024).
Ribbands C. R. (1949). The foraging method of individual honey-bees. J. Anim. Ecol. 18, 47–66. doi: 10.2307/1581
Riley J. R., Greggers U., Smith A. D., Reynolds D. R., and Menzel R. (2005). The flight paths of honeybees recruited by the waggle dance. Nature 435, 205–207.
Robinson G. E. (2009). Division of labor in insect societies. Encyclopedia of Insects, 2nd edition. Ed. Resh V. H. and Carde R. T. (Boston, MA, USA: Elsevier).
Rocha L. E. C. and Blondel V. D. (2013). Bursts of vertex activation and epidemics in evolving networks. PloS Comput. Biol. 9, e1002974. doi: 10.1371/journal.pcbi.1002974
Rodríguez-Sánchez F. and Hutchins S. D. (2020). grateful: Facilitate citation of R packages (Opgehaal van). Available online at: https://github.com/Pakillo/grateful (Accessed June 1, 2024).
Rohrseitz K. and Tautz J. (1999). Honey bee dance communication: waggle run direction coded in antennal contacts? J. Comp. Physiol. A 184, 463–470. doi: 10.1007/s003590050346
Rosenthal M. F., Wilkins M. R., Shizuka D., and Hebets E. A. (2018). Dynamic changes in display architecture and function across environments revealed by a systems approach to animal communication. Evolution 72, 1134–1145. doi: 10.1111/evo.13448
Sahai P., Kumar R., and Mehrotra M. (2025). Bee swarm intelligence inspired sustainable swarm air purification agent system with K-means clustering. SN Comput. Sci. 6, 1–15. doi: 10.1007/s42979-025-04033-x
Sasaki T., Danczak L., Thompson B., Morshed T., and Pratt S. C. (2020). Route learning during tandem running in the rock ant Temnothorax albipennis. J. Exp. Biol. 223, jeb221408. doi: 10.1242/jeb.221408
Schmidt K. A., Dall S. R. X., and van Gils J. A. (2010). The ecology of information: an overview on the ecological significance of making informed decisions. Oikos 119, 304–316. doi: 10.1111/j.1600-0706.2009.17573.x
Schürch R., Couvillon M. J., Burns D. D. R., Tasman K., Waxman D., and Ratnieks F. L. W. (2013). Incorporating variability in honey bee waggle dance decoding improves the mapping of communicated resource locations. J. Comp. Physiol. A: Neuroethology Sensory Neural Behav. Physiol. 199, 1143–1152. doi: 10.1007/s00359-013-0860-4
Schürch R., Ratnieks F. L. W., Samuelson E. E. W., and Couvillon M. J. (2016). Dancing to her own beat: Honey bee foragers communicate via individually calibrated waggle dances. J. Exp. Biol. 219, 1287–1289. doi: 10.1242/jeb.134874
Schürch R., Rothenberger S., and Heg D. (2010). The building-up of social relationships: behavioural types, social networks and cooperative breeding in a cichlid. Philos. Trans. R. Soc. B Biol. Sci.. doi 10.1098/rstb.2010.0177
Schürch R., Zwirner K., Yambrick B. J., Pirault T., Wilson J. M., and Couvillon M. J. (2019). Dismantling Babel: creation of a universal calibration for honey bee waggle dance decoding. Anim. Behav. 150, 139–145. doi: 10.1016/j.anbehav.2019.01.016
Seeley T. D. (1983). Division of labor between scouts and recruits in honeybee foraging. Behav. Ecol. Sociobiol 12, 253–259. doi: 10.1007/BF00290778
Seeley T. D. (1985). Honeybee ecology: A study of adaptation in social life. (Princeton, NJ, USA: Princeton University Press).
Seeley T. D. (1989). Social foraging in honey bees: how nectar foragers assess their colony’s nutritional status. Behav. Ecol. Sociobiology 24, 181–199. doi: 10.1007/BF00292101
Seeley T. D. (1994). Honey bee foragers as sensory units of their colonies. Behav. Ecol. Sociobiology 34, 51. doi: 10.1007/BF00175458
Seeley T. D. (1995). The wisdom of the hive : the social physiology of honey bee colonies, the Social Physiology of Honey Bee Colonies (Cambridge: Harvard University Press).
Seeley T. D. (2019). The Lives of Bees: The Untold Story of the Honey Bee in the Wild. Princeton University Press. doi: 10.1515/9780691189383
Seeley T. D., Camazine S., and Sneyd J. (1991). Collective decision-making in honey bees: how colonies choose among nectar sources. Behav. Ecol. Sociobiology 28, 277–290. doi: 10.1007/BF00175101
Seeley T. D., Mikheyev A. S., and Pagano G. J. (2000). Dancing bees tune both duration and rate of waggle-run production in relation to nectar-source profitability. J. Comp. Physiol. - A Sensory Neural Behav. Physiol. 186, 813–819. doi: 10.1007/s003590000134
Seeley T. D. and Tovey C. A. (1994). Why search time to find a food-storer bee accurately indicates the relative rates of nectar collecting and nectar processing in honey bee colonies. Anim. Behav. 47, 311–316. doi: 10.1006/anbe.1994.1044
Seeley T. D. and Towne W. F. (1992). Tactics of dance choice in honey bees: do foragers compare dances? Behav. Ecol. Sociobiol. 30, 59–69.
Seeley T. D. and Visscher P. K. (1988). Assessing the benefits of cooperation in honeybee foraging: search costs, forage quality, and competitive ability. Behav. Ecol. Sociobiol 22, 229–237. doi: 10.1007/BF00299837
Snyder P., Martin J., Herman J. J., Franklin S., Wagoner K. M., Soroker V., et al. (2024). The impact of honey bee (Apis mellifera) group size on hygienic behavior performance. Behav. Ecol. Sociobiol. 78, 1–15. doi: 10.1007/s00265-024-03471-6
Srinivasan M. V. (1992). “How flying bees compute range from optical flow: behavioral experiments and neural models,” in Nonlinear Vision: Determination of Neural Receptive Fields, Function, and Networks (Boca Raton, FL, USA: CRC Press).
Steele P. (1995). Ecotourism: An economic analysis. J. Sustain. Tourism 3, 29–44. doi: 10.1080/09669589509510706
Sun D., Gao S., Liu X., Li F., and Buyya R. (2020). Performance-aware deployment of streaming applications in distributed stream computing systems. Int. J. Bio-Inspired Comput. 15, 52–62. doi: 10.1504/IJBIC.2020.105892
Tanner D. A. and Visscher P. K. (2008). Do honey bees average directions in the waggle dance to determine a flight direction? Behav. Ecol. Sociobiol 62, 1891–1898. doi: 10.1007/s00265-008-0619-z
Tautz J. (2022). Communication Between Honeybees: More than Just a Dance in the Dark (Cham: Springer International Publishing). doi: 10.1007/978-3-030-99484-6
Tautz J. (2023). The new three-phase model in honey bee recruiting. Bee World 100, 84–85. doi: 10.1080/0005772X.2022.2151743
Tautz J. and Rohrseitz K. (1998). What attracts honeybees to a waggle dancer? J. Comp. Physiol. A 183, 661–667. doi: 10.1007/s003590050289
Tautz J. and Sandeman D. C. (2003). Recruitment of honeybees to non-scented food sources. J. Comp. Physiol. A 189, 293–300. doi: 10.1007/s00359-003-0402-6
Unicomb S., Iniguez G., Gleeson J. P., and Karsai M. (2021). Dynamics of cascades on burstiness-controlled temporal networks. Nat. Commun. 12, 133. doi: 10.1038/s41467-020-20398-4
Verma A., Thakur S., Kumar A., and Prasad Mahato D. (2025). Routing algorithm for sparse unstructured P2P networks using honey bee behavior. Int. J. Communication Syst. 38, e5978. doi: 10.1002/dac.5978
Von Frisch K. (1967). The dance language and orientation of bees (Cambridge, Mass., USA: Belknap Press of Harvard University Press).
Wario F., Wild B., Rojas R., and Landgraf T. (2017). Automatic detection and decoding of honey bee waggle dances. PloS One 12, 1–16. doi: 10.1371/journal.pone.0188626
Wedde H. F., Farooq M., Pannenbaecker T., Vogel B., Mueller C., Meth J., et al. (2005). “BeeAdHoc: an energy efficient routing algorithm for mobile ad hoc networks inspired by bee behavior,” in Proceedings of the 7th Annual Conference on Genetic and Evolutionary Computation, GECCO ‘05, New York, NY, USA. 153–160 (Association for Computing Machinery). doi: 10.1145/1068009.1068034
Wedde H. F., Farooq M., and Zhang Y. (2004). “BeeHive: An Efficient Fault-Tolerant Routing Algorithm Inspired by Honey Bee Behavior,” in Ant Colony Optimization and Swarm Intelligence. Eds. Dorigo M., Birattari M., Blum C., Gambardella L. M., Mondada F., and Stützle T. (Springer, Berlin, Heidelberg), 83–94. doi: 10.1007/978-3-540-28646-2_8
Wey T., Blumstein D. T., Shen W., and Jordán F. (2008). Social network analysis of animal behaviour: a promising tool for the study of sociality. Anim. Behav. 75, 333–344. doi: 10.1016/j.anbehav.2007.06.020
Whitehead H. (2008). Analyzing animal Societies: Quantitative Methods for Vertebrate Social Analysis (Chicago, IL, USA: University of Chicago Press).
Wild B., Dormagen D. M., Zachariae A., Smith M. L., Traynor K. S., Brockmann D., et al. (2021). Social networks predict the life and death of honey bees. Nat. Commun. 12, 1110. doi: 10.1038/s41467-021-21212-5
Wilson E. O. (2000). Sociobiology: The New Synthesis, Twenty-Fifth Anniversary Edition (Cambridge, MA, USA: Harvard University Press).
Wray M. K., Klein B. A., and Seeley T. D. (2012). Honey bees use social information in waggle dances more fully when foraging errors are more costly. Behav. Ecol. 23, 125–131. doi: 10.1093/beheco/arr165
Xie Y. (2014). “knitr: A Comprehensive Tool for Reproducible Research in R,” in Implementing Reproducible Computational Research. Eds. Stodden V., Leisch F., and Peng R. D. (Hall/CRC, Chapman).
Xie Y. (2015). “Dynamic Documents with R and Knitr.” 2nd ed. Boca Raton, Florida: Chapman; Hall/CRC. Available online at: https://yihui.org/knitr/.
Xie Y. (2024). “knitr: A General-Purpose Package for Dynamic Report Generation in r.” Available online at: https://yihui.org/knitr/ (Accessed November 22, 2024).
Keywords: honey bee, waggle dance, recruitment network, network density, burstiness, individuality
Citation: McHenry LC, Schürch R, Johnson LE, Ohlinger BD and Couvillon MJ (2025) Dancing on the edge: honey bee recruitment networks are sparse and affected by individuality in waggle dance behavior. Front. Bee Sci. 3:1654032. doi: 10.3389/frbee.2025.1654032
Received: 25 June 2025; Accepted: 22 August 2025;
Published: 22 September 2025.
Edited by:
Susan E. Fahrbach, Wake Forest University, United StatesReviewed by:
Brian H. Smith, Arizona State University, United StatesDavid R. Tarpy, North Carolina State University, United States
Copyright © 2025 McHenry, Schürch, Johnson, Ohlinger and Couvillon. This is an open-access article distributed under the terms of the Creative Commons Attribution License (CC BY). The use, distribution or reproduction in other forums is permitted, provided the original author(s) and the copyright owner(s) are credited and that the original publication in this journal is cited, in accordance with accepted academic practice. No use, distribution or reproduction is permitted which does not comply with these terms.
*Correspondence: Laura C. McHenry, bWNoZW5yeWxjMjRAZ21haWwuY29t