 Mohamed Kalith Oli M.
 Jafar Ali Ibrahim Syed Masood
- 1School of Bio Sciences and Technology, Vellore Institute of Technology, Vellore, India
- 2Department of Quantum AI, School of Computer Science and Engineering, Vellore Institute of Technology, Vellore, India
Introduction: With increased drug resistance and tumor heterogeneity accounting for limited therapeutic strategies, gastric cancer remains one of the major causes of cancer-related mortality around the globe. Targeting the components of the tumor microenvironment (TME) has become a promising therapeutic strategy due to their crucial roles in cancer cell proliferation, progression, and metastasis. One of the limitations of the previously identified therapeutic targets is their limited applicability to a broader patient population.
Methods: This study aims to identify (TME)-related therapeutic targets using an integrated bioinformatics and molecular docking approach that involves a larger number of datasets to cover a broader cohort of gastric cancer patients. It analyzed multiple publicly available transcriptomic datasets using Robust Rank Aggregation (RRA) meta-analysis and Weighted Gene Co-expression Network Analysis (WGCNA) to identify significant hub genes. Furthermore, protein-protein interaction (PPI) network analyses, conducted using multiple methods such as Cytohubba topology analysis and ClusterONE module analysis, refined the potential therapeutic candidates. Functional enrichment analyses were performed to identify vital genes involved in TME interactions and ECM remodeling.
Results: The enriched genes were validated for their significant dysregulation in the Cancer Genome Atlas gastric adenocarcinoma dataset (TCGA-STAD) and three independent GEO datasets to ensure differential expression across distinct cohorts. Genes with consistent dysregulation were used in survival analyses across TCGA and two GEO datasets to prioritize hub genes with prognostic significance. Finally, a targeted literature survey ensured the exclusion of previously targeted genes, and molecular docking analyses conducted using phytocompounds identified potential therapeutic leads with strong affinities for the identified targets.
Discussion: This integrated approach revealed notable, promising targets in the TME and natural compounds for developing potential personalized therapeutic strategies in gastric cancer.
1 Introduction
Gastric cancer (GC) is one of the most prevalent malignancies, which ranks fifth in both incidence and mortality, with more than 968,000 new cases and 660,000 deaths around the globe (Bray et al., 2024). Endoscopy with biopsy remains the standard diagnostic procedure for gastric cancer, as it enables both visualization and histological confirmation (Vincze, 2023). Recent advancements in medical imaging, combined with the limited but evolving use of biomarkers, have improved the detection rates of gastric cancer. The treatment strategies for gastric cancer include surgical resection for the early stages and combinations of surgery, radiation therapy, and chemotherapy for the advanced stages, according to the molecular characteristics of the tumor (Mamun et al., 2024). With an increased understanding of GC pathogenesis mechanisms, targeted therapeutic options such as inhibiting HER2, EGFR, VEGF/VEGFR, and CLDN18.2 have become promising topics for research and clinical trials. Targeted therapeutic strategies inhibit the defective signaling pathways in cancer, thereby causing less damage to normal cells. Some of the widely tested targeted therapeutic strategies include targeting HER2 with trastuzumab or new agents like T-DXd (trastuzumab deruxtecan) and inhibiting angiogenesis by targeting VEGF/VEGFR with bevacizumab or ramucirumab (Javle et al., 2014; Ishii and Shitara, 2021). Another recently approved targeted therapy strategy is neutralizing the CLDN18.2 with the antibody zolbetuximab (Kubota and Shitara, 2024). Targeting EGFR with drugs like cetuximab and panitumumab combined with chemotherapy did not significantly improve patient survival in phase III clinical trials (Lordick et al., 2012; Waddell et al., 2012). The main challenges are that only a subset of gastric cancer patients express these targets, intratumor heterogeneity, and those who express these usually develop drug resistance (Luo et al., 2025). Recently, studies have identified numerous potential therapeutic targets by analyzing expression profiling datasets; however, only a small subset of the total datasets is generally selected. Thus, the chosen hub genes represent a small population of patients with GC (Wang R. et al., 2022; Hu et al., 2023; Wu et al., 2025). Therefore, the discovery of multiple novel therapeutic targets that many patients express could broaden the proportion of treatable gastric cancer cases and enable novel combination strategies for targeted therapy. Natural compounds have been considered important for cancer therapy due to their ability to regulate multiple cancer-related pathways and comparatively safe ADMET profiles (Nan et al., 2023). This study used various approaches to ensure that biologically significant targets were identified from the available GEO datasets. It utilized both microarray and RNA sequencing datasets that cover a considerable number of the gastric cancer population, integrated the aggregated differentially expressed genes from Robust Rank Aggregation (RRA) analysis with hits from tumor-correlated modules in Weighted Gene Co-expression Network Analysis (WGCNA), and used those genes for protein-protein interaction and enrichment analyses. This methodology ensured that the selected targets were expressed across a wide patient population and were pivotal to regulatory networks. Furthermore, to ensure the broad expression, the chosen targets were validated in TCGA and GEO datasets, followed by survival analyses to ensure that prognostically significant hub genes were chosen. Finally, the chosen targets were evaluated for interactions with natural compounds using molecular docking to identify potential therapeutic leads, thereby providing insights into their translational potential.
2 Materials and methods
2.1 Data sources and inclusion criteria
The Gene Expression Omnibus (GEO) database was used to retrieve expression profiling datasets using the search term ‘gastric cancer' (https://www.ncbi.nlm.nih.gov/geo/) (Barrett et al., 2012). The criteria for dataset selection are as follows:
i. Datasets from high-throughput sequencing and single-channel microarray experiments with proper gene annotations were included.
ii. Paired tumor and adjacent normal tissue datasets were selected with a minimum sample size of 6.
iii. Experiments involving non-coding RNA, as well as methylation profiling or studies involving metastatic samples and other conditions such as gastritis or cachexia, were excluded because they could introduce confounding variables that might affect the reliability of the results.
For validation of differential expression results and survival analyses, a large cancer genomics cohort from TCGA, as well as at least 2 external GEO datasets from geographically distinct populations, was obtained.
The integrative approach considered RNA sequencing experiments due to their high sensitivity and dynamic range. Additionally, it included extensive data obtained from microarray experiments to produce reliable results. Figure 1 depicts the workflow used in this study.
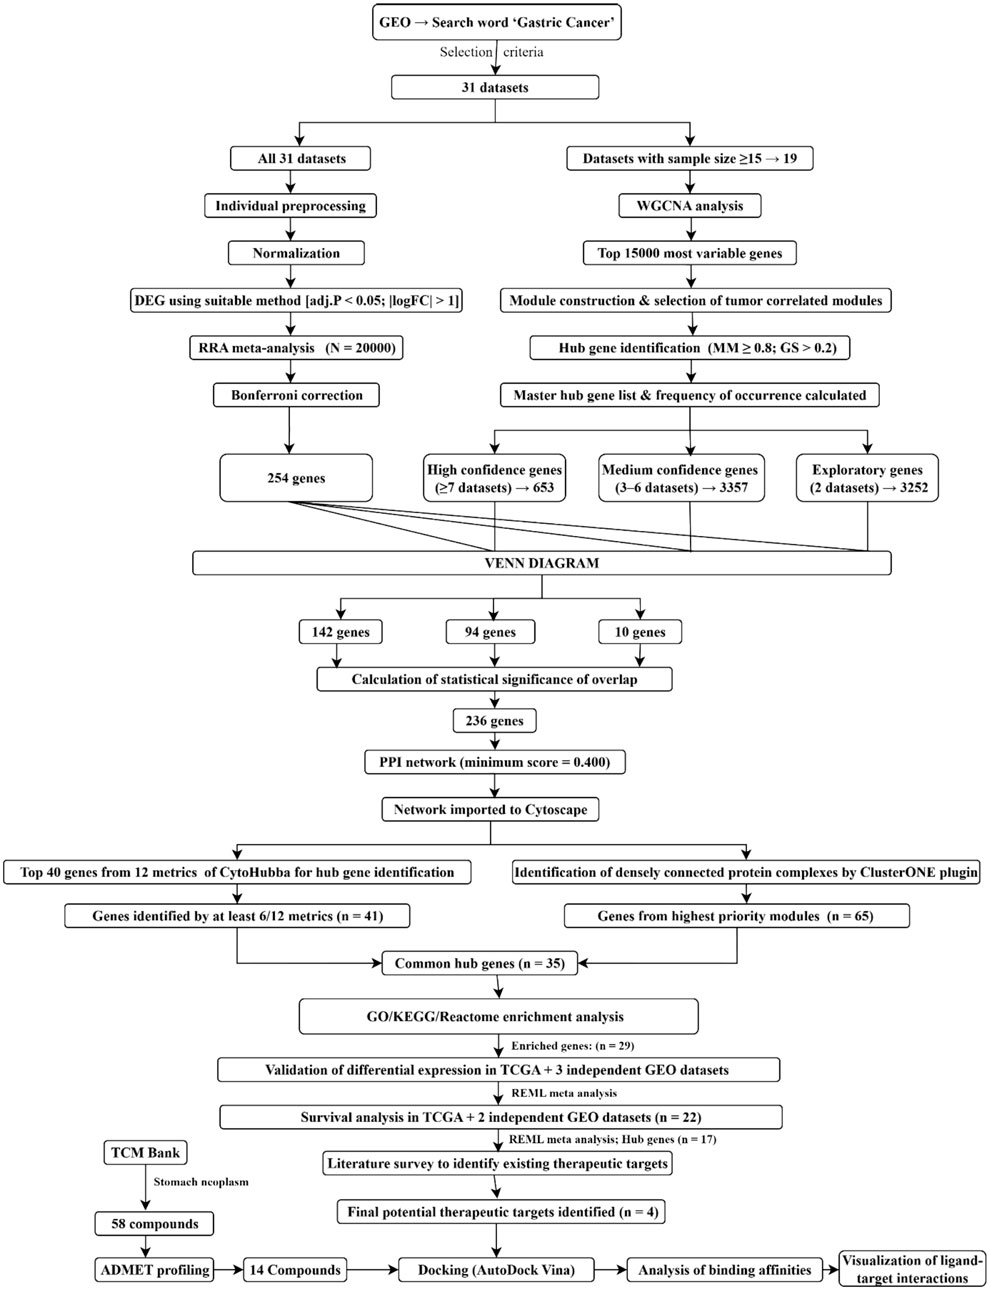
Figure 1. Integrative workflow used in this study to discover potential therapeutic targets and lead natural compounds. An integrative RRA meta-analysis and a WGCNA-based approach was utilized to identify hub genes. Protein-protein interaction network analysis, including Cytohubba metrics and ClusterONE, along with functional enrichment analyses, led to the selection of the final potential therapeutic targets. Furthermore, differential expression was independently validated in separate cohorts, followed by molecular docking analyses using active compounds from TCMBank to identify potential lead compounds and their interactions with the targets.
2.2 Differential expression analysis and meta-analysis using robust rank aggregation (RRA) algorithm
Selected datasets were preprocessed and normalized individually, and differentially expressed genes (DEGs) were assessed using methods such as limma, DeSeq2, and limma-voom (Law et al., 2014; Love et al., 2014; Ritchie et al., 2015). All analyses were conducted in R using Bioconductor packages. For each dataset, genes were given raw p-values, log2 fold changes, and adjusted p-values. All genes were sorted primarily by adjusted p-values and then by absolute log fold change to indicate statistical significance.
The ‘RobustRankAggreg’ package in R was used for the meta-analysis of DEG results, as it is useful for combining gene expression results from multiple datasets. Here, the RRA algorithm integrated and ranked the genes consistently across all datasets, ensuring that variation across different platforms was captured (Kolde et al., 2012). The parameter was set to N = 20,000 to include all the significant genes and reduce the noise. Furthermore, Bonferroni correction, as shown in Equation 2.1, was applied, and the genes with scores below this threshold were selected for further analysis.
2.3 WGCNA analysis and hub gene identification
The WGCNA algorithm was applied to all datasets that met the minimum sample size of 15 to identify significant gene co-expression networks and their correlation with the tumor phenotype (Langfelder and Horvath, 2008). Each dataset was preprocessed and normalized individually using appropriate methods, and the top 15,000 most variable genes were selected for the analysis using the WGCNA package in R. For each dataset, sample clustering was performed to remove outliers, ensuring high sample quality. Appropriate soft-threshold powers were chosen from the scale-free topology fit plot where R2 crosses 0.8. This was followed by signed weighted gene co-expression network construction and the detection of modules through hierarchical clustering with the dynamic tree-cut method. Furthermore, highly similar modules were merged to refine the assignment of modules. After analyzing module-trait relationships, modules with significant correlations with tumor samples were selected for further analysis to capture robust biological signals from all the datasets. From the tumor-correlated modules with module trait p-value less than 0.05 of each dataset, genes with module membership (MM) greater than 0.8 and gene significance (GS) more than 0.2 were chosen as hub genes. Unique gene symbols of tumor-associated hub genes from each dataset were combined to create a master hub gene list and a presence-absence logical matrix to indicate the gene occurrences across the selected datasets. After calculating the frequency of occurrence, genes were divided into three confidence categories: high-confidence genes, which appear in 7 or more datasets; medium-confidence genes, which appear in 3–6 datasets; and exploratory genes, which appear in at least 2 datasets. Genes present only in one dataset were considered low-support genes and were excluded from further analysis.
2.4 Integration of meta-DEG and WGCNA results
A common background universe (U) was defined as the set of unique genes common to the ranked genes from the RRA analysis and to the genes considered in the WGCNA analysis. All gene lists, including the universe list, were mapped to HGNC symbols using limma, HGNChelper and org.Hs.eg.db and duplicates were removed (Oh et al., 2020; Carlson et al., 2019). Later, for each category (High, medium, and exploratory), 2 × 2 contingency tables were constructed to count.
i. Genes present in both the RRA list and the WGCNA category (a)
ii. Genes present in the WGCNA category but not in the RRA list (b)
iii. Genes present in the RRA list but not in the WGCNA category (c)
iv. Remaining genes from the background (d); (|U| - (a+b + c))
Then, a one-sided Fisher’s exact test was applied as in Equation 2.2 to determine if the observed overlap is more than what would be expected by chance (Fisher, 1922). Along with the p-value, an odds ratio representing the strength of association between WGCNA category membership and presence in the RRA list was reported. Furthermore, a representation factor, calculated as the observed overlap divided by the expected overlap under random sampling, was calculated; values greater than 1 indicated over-representation. P-values across the three categories were adjusted by Benjamini-Hochberg false discovery rate (BH-FDR), and only those categories with significant over-representation (FDR<0.05) were chosen for downstream analyses (Benjamini and Hochberg, 1995).
2.5 Protein-protein interaction network and prioritization of hub genes
Overlapping genes with statistical significance were analyzed for protein-protein interactions using the STRING (https://string-db.org/) and STITCH (http://stitch.embl.de/) databases (Kuhn et al., 2007; Szklarczyk et al., 2019). Interaction networks with a minimum score of 0.400 or medium confidence were imported to Cytoscape software (version 3.10.3) (Shannon et al., 2003). All 12 metrics, such as Maximal Clique Centrality (MCC), Degree, Betweenness, and Maximum Neighborhood Component (MNC) and others from the CytoHubba plugin were used to select the top 40 genes for prioritizing the hub genes. The genes identified consistently by at least 50% of the metrics were chosen as hub genes from Cytohubba (Chin et al., 2014). Simultaneously, the PPI network was evaluated for overlapping protein complexes using ClusterONEweb (https://paccanarolab.org/clusteroneweb/) with a minimum module size of 3, a minimum density of 0.3, a maximum overlap of 0.6, and a penalty of 2 for larger clusters (Baez et al., 2025). The results with p-values were downloaded, and the top modules were selected based on size, density, and p < 0.05. Furthermore, the common genes from both analyses were visualized using the VennDiagram (1.7.3) package in R for finalizing targets for enrichment analyses, such as Kyoto Encyclopedia of Genes and Genomes (KEGG) and Gene Ontology (GO) (Oliveros, 2007).
2.6 Functional enrichment analysis and hub gene selection
Enrichment analyses, including GO molecular function (MF), cellular component (CC), and biological process (BP), KEGG, and Reactome pathway enrichment analyses, were conducted using the clusterProfiler, ReactomePA packages, org.Hs.eg.db, AnnotationDbi, and enrichplot in R (Yu et al., 2012; Yu and He, 2016; Pagès et al., 2017; Guangchuang et al., 2023). The overlapping genes from the cluster and topology PPI analyses were considered as target genes, and the initial set of genes from the PPI network was chosen as the background. Gene symbols were mapped to their Entrez IDs using the bitr function of the Annotation DBI package. Enrichments were calculated using the mapped background, BH correction, and thresholds such as p. Adjust ≤0.05, q-value ≤0.20, minimum gene set size of 3, and a maximum of 200. Gene ratios, background ratios, and fold enrichment values were reported; dot plots were generated for top terms, and the terms with p.adjust ≤0.05, q-value ≤0.2, fold enrichment ≥2, and a minimum gene count of 3 were considered significant. The candidates that contributed to significant terms in functional enrichment analysis were prioritized for validation and survival analyses.
2.7 Validation of differential expression
To validate the differential expression of the chosen candidates, datasets from distinct clinical populations were chosen. It included TCGA-STAD (RNA seq) (Colaprico et al., 2016), GSE54129 (GPL570; China), GSE13911 (GPL570; Italy) (D’Errico et al., 2009) and GSE66229 (GPL570; Asian Cancer Research Group (ACRG cohort)) (Oh et al., 2018). These cohorts were not utilized in the discovery data and were preprocessed with platform-specific methods and mapped to HGNC gene symbols using org.Hs.eg.db and hgu133plus2.DB before validating the dysregulation of the selected genes (Carlson et al., 2016). For the TCGA cohort, STAR counts were imported, and samples with ambiguous labels from the clinical metadata and genes with zero total counts were removed, and duplicates were collapsed after mapping to HGNC symbols. Later, the RNA sequencing data were analyzed for differential expression with DESeq2, which called on unshrunken log2 fold-changes with BH-FDR. The raw CEL files of the GEO microarray cohorts were RMA normalized with affy, and for genes with multiple probes, the probe with the largest interquartile range (IQR) across samples was retained (Irizarry et al., 2003). They were tested with limma and log2FC, standard errors (SE), p, and FDR values were recorded. Regardless of the significance of each study, meta-analysis combined the log2FC ± SE for each gene from each cohort using a random-effects model (REML) using metafor (Viechtbauer, 2010). This meta-analysis reported heterogeneity (Q, inconsistency index I2, and τ2), two-sided p-values, pooled log2FC, and 95% confidence intervals. Furthermore, BH-FDR was applied to the selected genes, and the REML model was refitted by excluding one cohort at a time (Leave-one-out; LOO) to assess sensitivity. Genes with no changes in the pooled effect’s sign were labeled as stable under LOO. Genes were validated as differentially expressed if they had FDR ≤0.05 and a CI excluding 0 in the REML model, and had a consistent sign in the LOO analysis and p ≤ 0.05.
2.8 Survival analysis and candidate gene selection
Three independent gastric cancer cohorts were used to evaluate the effect of the selected genes on overall survival (OS): TCGA-STAD (RNA sequencing), GSE62254 (microarray), and GSE15459 (microarray) (Ooi et al., 2009; Cristescu et al., 2015). OS was measured as the time from diagnosis to death, with event 1 indicating death and 0 indicating censoring. For TCGA, STAR counts were collapsed to HGNC symbols, normalized, and transformed using the standard size factor normalization of DESeq2 (Variance Stabilizing Transformation, VST), and RMA normalization (affy) was used for microarray datasets. Gene expression was standardized to a mean of 0 and a standard deviation of 1 before modeling in each cohort. Kaplan-Meier (KM) plots were created for visualization using the top 25% vs. the bottom 25% of expression (Q4 vs. Q1) within the cohorts to avoid dilution around the median, and log-rank p-values, along with n-at-risk tables, were added to plots for all genes.
Cox proportional-hazards models were applied to all candidate genes in each cohort. Univariate models related the OS to the standard expression of each gene, followed by multivariate models that adjusted for clinical covariates. For TCGA, the multivariate models were adjusted for age and sex, whereas for the GEO cohorts, age, sex, and stage were adjusted. Across all the models, hazard ratio (HR), 95% CI, the Wald p-value, a global Schoenfeld test p-value that checks the proportional hazards, and model discrimination using Harrell’s c-index were recorded. Moreover, BH-FDR correction was applied to each cohort in both univariate and multivariate analyses. For cohorts with stage data, gene × stage interactions were evaluated with stage Ⅰ as the reference and stages Ⅱ, Ⅲ, and Ⅳ as contrasts, followed by BH-FDR correction across genes. Interactions were considered significant only if they had FDR ≤0.05. The univariate Cox HRs for each gene across all three cohorts were combined in a meta-analysis using metafor, with a random-effects REML model. This analysis reported pooled HRs with 95% CI, p-values, and BH-FDR testing across the genes, along with heterogeneity values (Q, I2, and τ2). Genes were considered significant in the meta-analysis if they had an HR > 1 in at least 2 of the 3 cohorts, indicating that their higher expression was associated with worse overall survival. The REML model was refitted by dropping one cohort at a time (LOO), and genes were considered stable under LOO if there was no loss of significance and sign changes. The final candidate genes with survival significance were selected if the pooled HR > 1 and the pooled FDR ≤0.05, if the HR > 1 in ≥2/3 cohorts with no sign changes in LOO.
2.9 Molecular docking analysis
For the final candidate genes, a targeted literature survey was conducted to exclude the already validated therapeutic targets. Only those genes without prior in vitro or in silico targeting were chosen as final therapeutic candidates. TCMBank was selected as the compound library for docking, and the phytocompounds for the search term ‘stomach neoplasm’ were retrieved for ADMET profiling (Lv et al., 2023). The drug-likeness, pharmacochemical, and pharmacokinetic properties were evaluated using SWISS ADME (Daina et al., 2017). Toxicity profiling was performed using ProTox-III, and compounds with acceptable ADMET profiles were shortlisted; their 3D structures were downloaded from PubChem (Banerjee et al., 2024; Kim et al., 2025). The shortlisted phytocompounds were optimized and converted to the required PDBQT format using OpenBabel (O’Boyle et al., 2011).
i. When experimentally validated structures were available, 3D coordinates with high resolution were downloaded from the RCSB PDB (Berman, 2000). The coordinates were cleaned and protonated using MGL Tools.
ii. In the absence of experimentally validated structures, AlphaFold models were retrieved corresponding to the human Uniprot entries of the targets (UniProt Consortium, 2018). Regions of low confidence (pLDDT<50) were removed using PyMOL, and missing loops were remodeled using SWISS-MODEL (Schrodinger, 2015; Waterhouse et al., 2018; Jumper et al., 2021). The edited models were saved and used for cavity prediction.
Target preparations were performed using MGL tools, and primary binding pockets of the finalized receptors were predicted using the PrankWeb, which provided the grid center coordinates for further docking analysis (Polák et al., 2025). To maintain consistency across all receptor sets, no bound metal ions or cofactors were retained in any of the receptor files. AutoDock Vina was used to perform the docking analysis, where the grid of each target was centered on the Prankweb-predicted primary binding pocket (Trott and Olson, 2010). A uniform cubical box of 24 × 24 × 24 Å, exhaustiveness of 32, energy range of 5 kcal mol-1 and 20 modes were used consistently across all docking runs, and the highest-scoring Vina pose of all the ligands was retained. The targets and the ligands were docked in triplicate with different random seeds to confirm that the binding affinities did not vary much, and the top-scoring ligand pose was visualized with the corresponding target proteins in Biovia Discovery Studio Visualizer (v21.1.0.20298) (BIOVIA, 2021).
3 Results
3.1 Dataset selection
A total of 31 publicly available datasets that matched the inclusion criteria (discussed in Section 2.1) were retrieved from the GEO website for the comparative transcriptomic analysis. Of these, eighteen datasets were submitted from single-channel microarray experiments, and thirteen were generated from high-throughput RNA sequencing experiments. Across the chosen datasets, 927 tumor samples and 919 matched adjacent normal stomach tissues were included, providing a total of 1846 samples for the transcriptomic analysis. Cohorts chosen included different geographic regions and multiple platforms; for instance, microarray studies were frequently generated on Affymetrix platforms, such as GPL570 and GPL96, whereas RNA sequencing studies were mostly obtained from multiple Illumina-based platforms. Sample sizes varied widely, ranging from 3 pairs to 230 pairs of tumor-normal samples. This ensured that the study covered different technical and individual study settings. More details, including the accession IDs and individual sample counts for each dataset, are provided in Table 1.
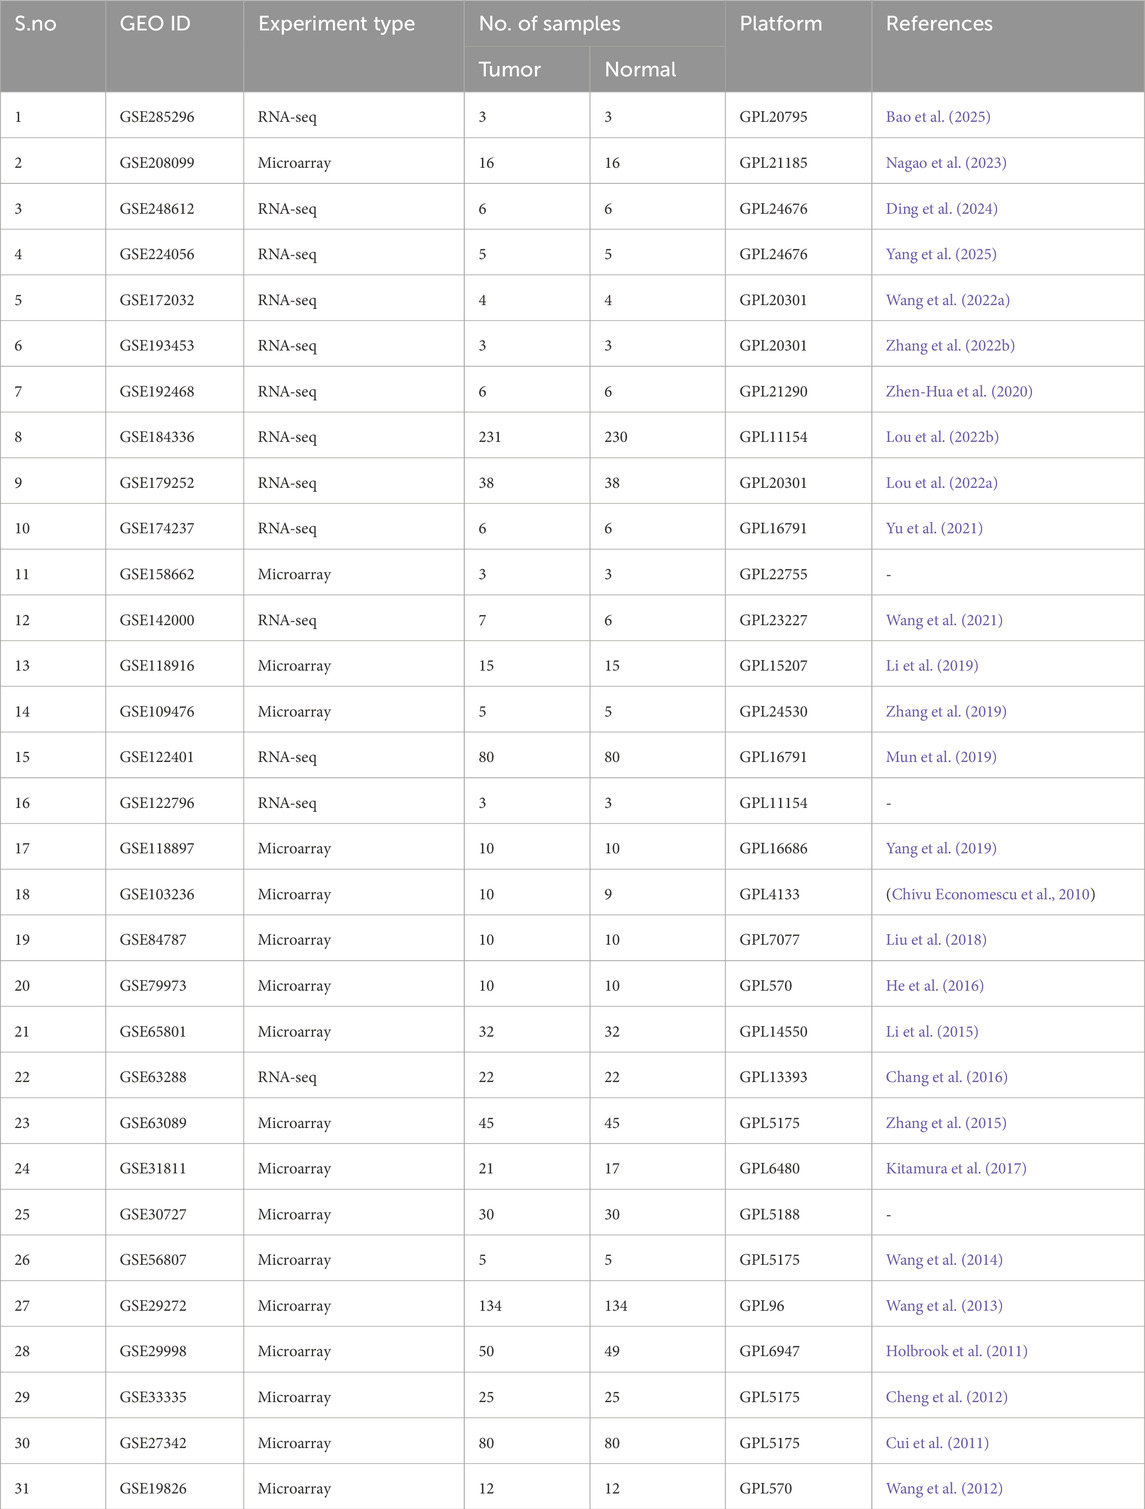
Table 1. Accession IDs, Sample counts, and expression profiling platforms of the datasets used in this study.
To validate the differential expression of candidate genes, four independent external cohorts were utilized that covered distinct clinical populations: TCGA-STAD, GSE54129, GSE13911, and GSE66229. The prognostic relevance of selected genes was evaluated across three independent cohorts with survival data: TCGA-STAD, GSE62254, and GSE15459.
3.2 DEG analysis and RRA meta-analysis
Differential expression testing was conducted using appropriate methods across all 31 datasets after proper preprocessing based on their data types. Data normalization in RNA sequencing studies generally included VST or log2 transformations of FPKM/CPM (Fragments per kilobase of transcript per million mapped reads/counts per million) values. Microarray data were frequently normalized using quantile normalization and robust multiarray average (RMA). Before differential expression (DE) analysis, outliers were searched for, and two datasets (GSE84787 and GSE79973) underwent outlier removal. Across datasets, Limma and DeSeq2 were primarily used for DE analysis, and the results exhibited considerable heterogeneity and size variations. Table 2 provides the preprocessing steps, testing methods, and resulting gene counts of each dataset.
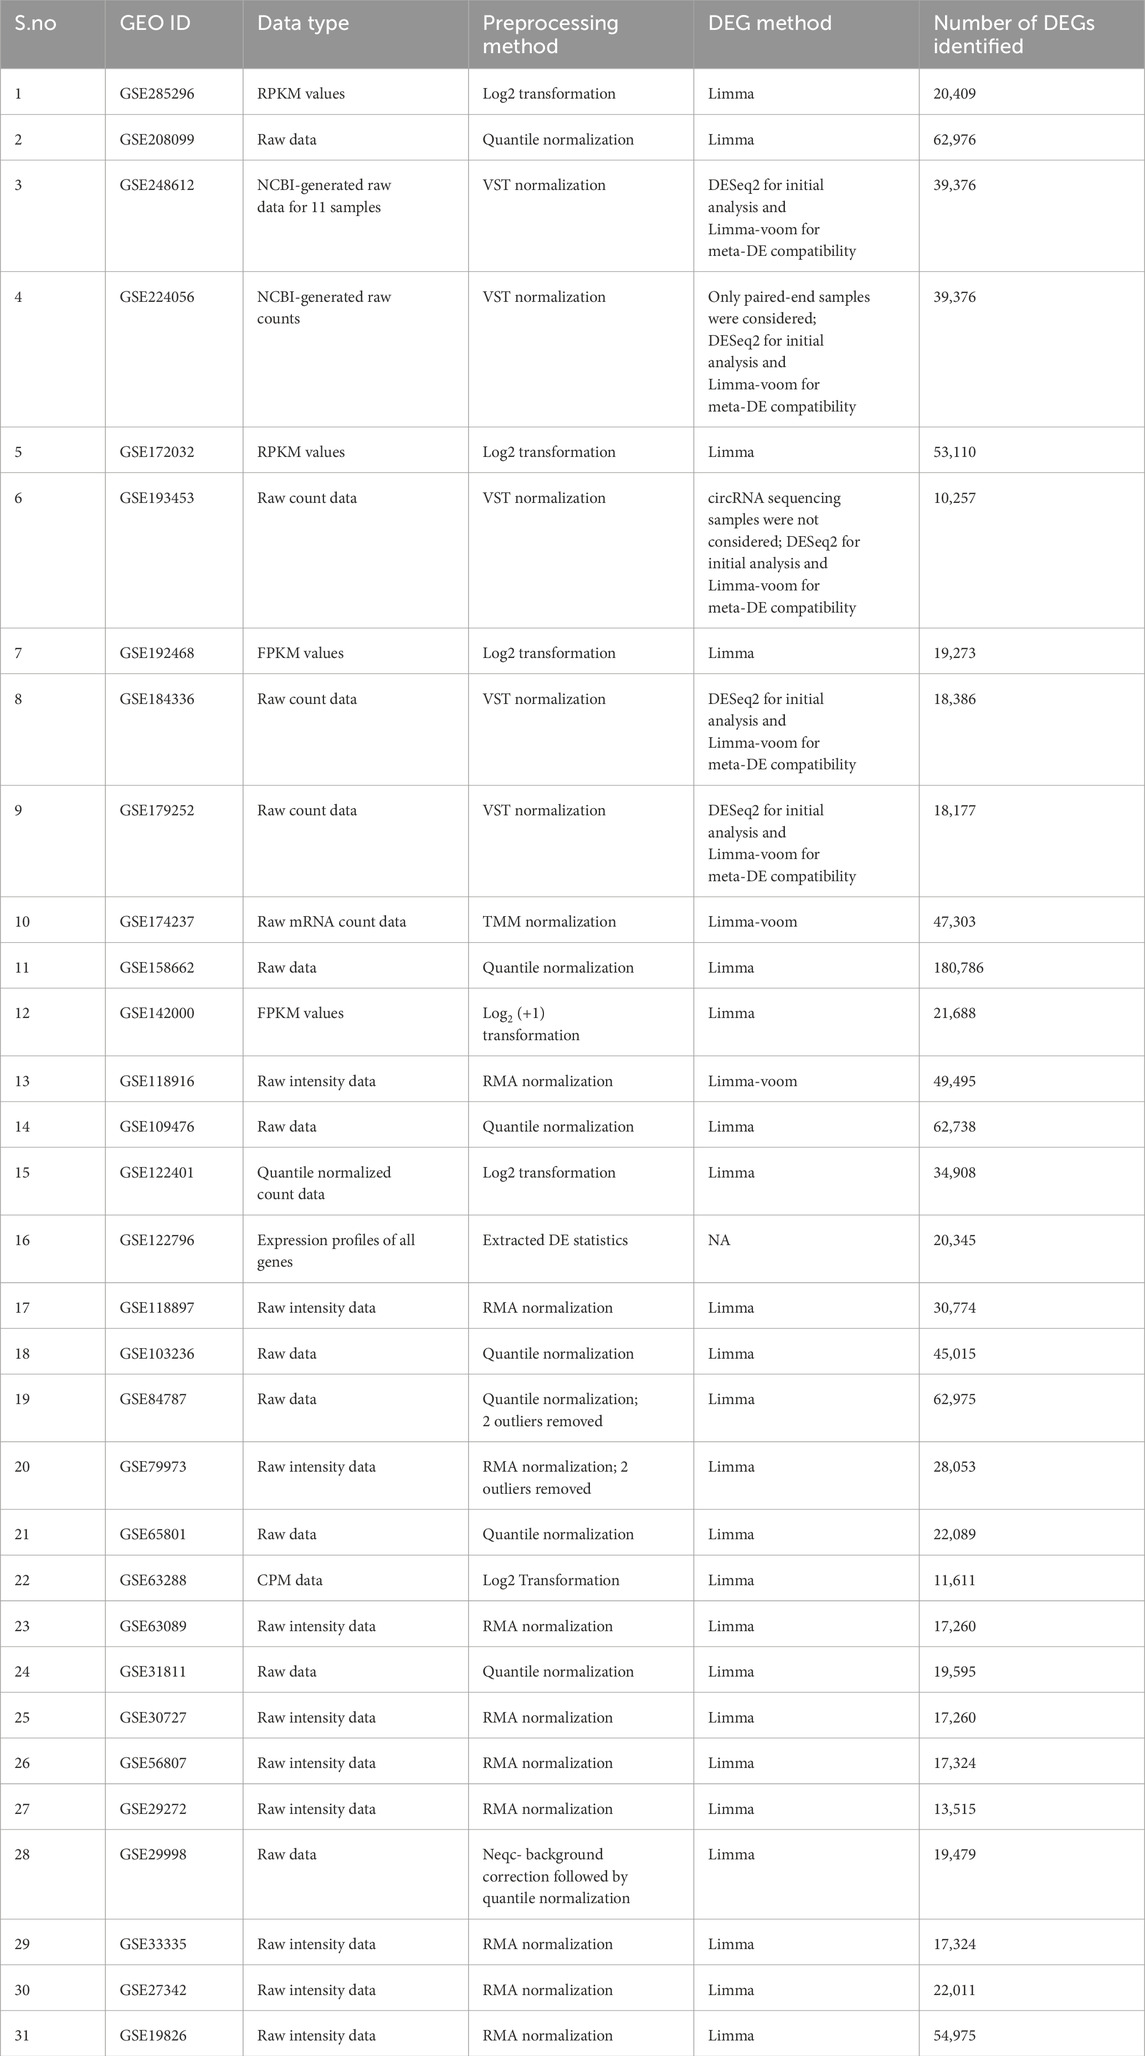
Table 2. Preprocessing steps, testing methods, and resulting gene counts from all 31 datasets.
The RobustRankAggreg algorithm (RRA) was used to integrate results across studies by ranking genes by adjusted p-value and then by log2 fold change (log2FC) in each dataset, and then combining the 31 ranked gene lists. Then, a score (RRA score) was assigned to all the genes, followed by Bonferroni correction to control multiple testing, where α was 0.05, m was 20,000 genes, producing a Bonferroni-adjusted threshold of 2.5 × 10⁻⁶. Following the RRA meta-analysis and the Bonferroni correction, 254 genes with consistent differential expression across both RNA-seq and microarray datasets were identified with significance. The uncorrected RRA scores of all the genes are provided in Supplementary Table 1A, and the list of Bonferroni-significant 254 genes and their scores is provided in Supplementary Table 1B.
3.3 WGCNA analysis and integration of RRA and WGCNA results
A total of 19 datasets met the criterion of a minimum sample size of 15 samples; each of these datasets was preprocessed and analyzed using the WGCNA R package. The pickSoftThreshold function was used to determine the optimal soft threshold power for each dataset. Signed networks were then constructed, modules were identified, and highly similar modules were merged. To identify tumor-correlated modules, module eigengenes (MEs) were correlated with the tumor-versus-normal trait, and genes with GS > 0.2 and MM > 0.8 were selected as hub genes from these modules. Table 3 summarizes the preprocessing methods and soft-threshold powers used, along with the number of hub genes from tumor-correlated modules in each dataset. A presence-absence matrix was constructed using the gene symbols of these hub genes to calculate their frequency of occurrence across datasets, and the genes were then categorized into three tiers: high confidence, medium-confidence and exploratory. The sizes of these three categories were defined at three levels through pre-processing:
i. Original sizes based on the presence-absence matrix: High/Medium/Exploratory- 655/3390/3273 (Supplementary Tables2A-C provides the dataset details and the frequencies of the genes from all three categories)
ii. Unique gene symbols after mapping to HGNC symbols, and removal of duplicates: High/Medium/Exploratory- 653/3357/3252
iii. Gene symbols after restricting to the common background universe (|U| = 27,740): High/Medium/Exploratory- 653/3355/3229

Table 3. Preprocessing methods, soft threshold powers used, and the number of hub genes from tumor-correlated modules from all 19 datasets.
To determine whether the overlaps were different from what would be expected by chance, one-sided Fisher tests were conducted to compare each WGCNA category with the RRA gene set, and the summarized effect sizes, along with OR and RF, were recorded. Of the 653 genes from the high-confidence WGCNA category, 142 overlapped with the RRA list with an OR of 66.80, RF of 23.75, p-value of 1.75 × 10 (−165), and FDR of 5.25 × 10 (−165), thus exhibiting significant enrichment. The 3355 genes from the medium-confidence WGCNA category exhibited a significantly enriched overlap of 94 genes with the RRA set with an OR of 4.36, RF of 3.06, p-value of 1.08 × 10 (−24), and FDR of 1.6 × 10 (−24). In contrast, among the 3,229 genes from the exploratory subset of WGCNA, only 10 genes overlapped with the RRA set, with an OR of 0.31, an RF of 0.34, a p-value, and an FDR approximately equal to 1. The contingency counts and other statistical values, including the a, b, c, and d values for each category and the lower bounds of the CI for the odds ratio, are provided in Supplementary Table 2D. The results of Fisher’s test demonstrated that the exploratory category did not exhibit significant enrichment, whereas the overlap between the high-confidence and medium categories was statistically significant. Thus, a total of 236 genes (142 from high-confidence overlap and 94 from medium-confidence overlap) were selected for further analysis, and Supplementary Table 2E lists these genes along with their WGCNA category and RRA scores.
3.4 PPI analysis and hub gene selection
The STRING database was employed to retrieve protein-protein interactions for the 236 overlapping genes, considering a minimum interaction score of 0.4. As STRING lacked entries for Aquaporin-4 (AQP4), its interactions were supplemented using the STITCH database, and the combined network was then imported into Cytoscape. Figure 2 shows the combined PPI network of the 236 hub genes.
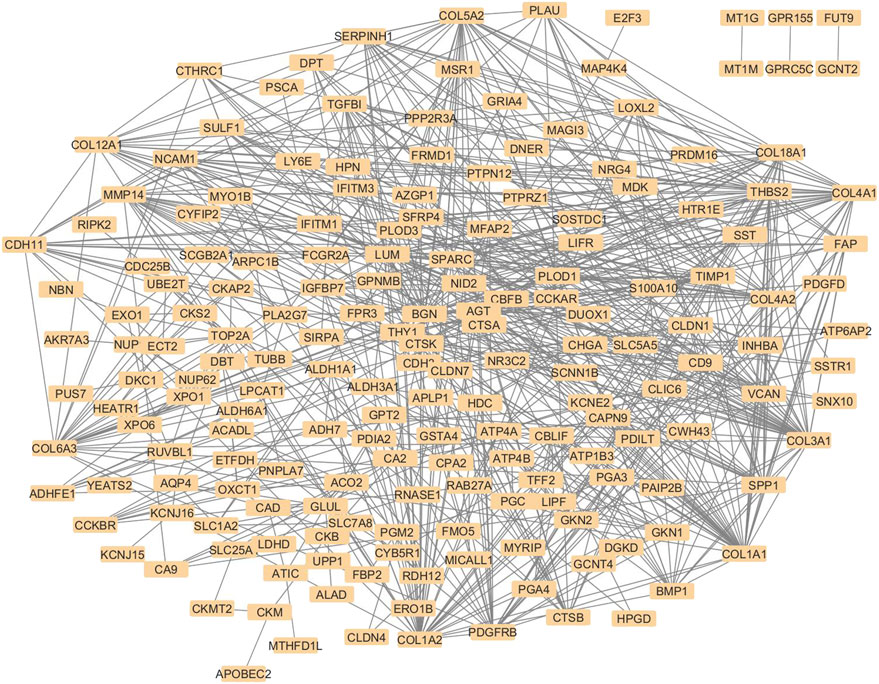
Figure 2. Protein-protein interaction network diagram with 236 nodes, where each node is a protein. Grey lines between the nodes represent their STRING interactions. The nodes are densely connected, and proteins like collagen family members, including COL1A1, COL1A2, COL5A2, COL 18A1 are among the major visible nodes with many edges. Weakly connected nodes like FUT9, MT1G, and GPRC5C appear towards the periphery of the diagram. The overall pattern of the diagram suggests a strong interconnection between the nodes.
All twelve metrics of the Cytohubba plugin were applied to the network to analyze and rank the topology of the nodes, and the top 40 genes identified by each measure are depicted in Supplementary Figures 1A-L. The 41 genes identified by at least six of the twelve metrics (≥50% consensus) were selected as Cytohubba-derived hub genes, and their details are provided in Supplementary Table 3A. Simultaneously, the same network was used to identify densely connected protein complexes using the ClusterONE web. Ten significant clusters were identified with a minimum density of 0.3 and p-values <0.05, as shown in Supplementary Table 3B, and were then prioritized based on a minimum size of 7 genes. Four clusters (Clusters 1,2, 5, and 6) with 65 component genes were chosen as key clusters due to their high quality and low p-values. For robust selection of hub genes, the 35 genes that overlapped between Cytohubba hub genes and genes from key ClusterONE modules were selected for further analysis. Figure 3 shows the Venn diagram used to visualize the overlapping hub genes from the analyses above.
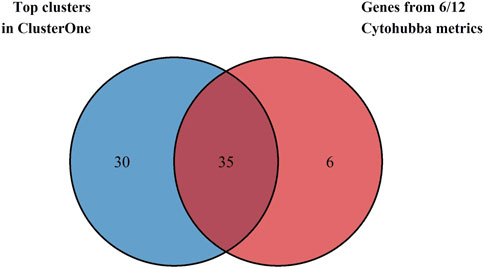
Figure 3. Venn diagram depicting the intersection between 41 Cytohubba-derived hub genes (blue) and 65 proteins from ClusterONE modules (red). Thirty-five genes were common to both methods and were selected as candidate genes for further analysis.
3.5 Functional enrichment analyses
To understand the biological roles of the 35 hub genes, GO (BP, CC, and MF), KEGG, and Reactome pathway enrichment analyses were conducted. In the GO-BP enrichment, genes involved in extracellular matrix (ECM) organization, cell adhesion, angiogenesis, blood vessel morphogenesis, cell migration and other related processes in tissue remodeling and tumor progression were significantly enriched. Some of the recurrently enriched genes include multiple collagen family members and other genes such as MMP14, TGFBI, SERPINH1, THY1, FAP, SULF1, PDGFRB, SPARC, NID2, LOXL2, and THBS2. Figure 4A shows the dot plot representation of the top enriched GO biological process terms.
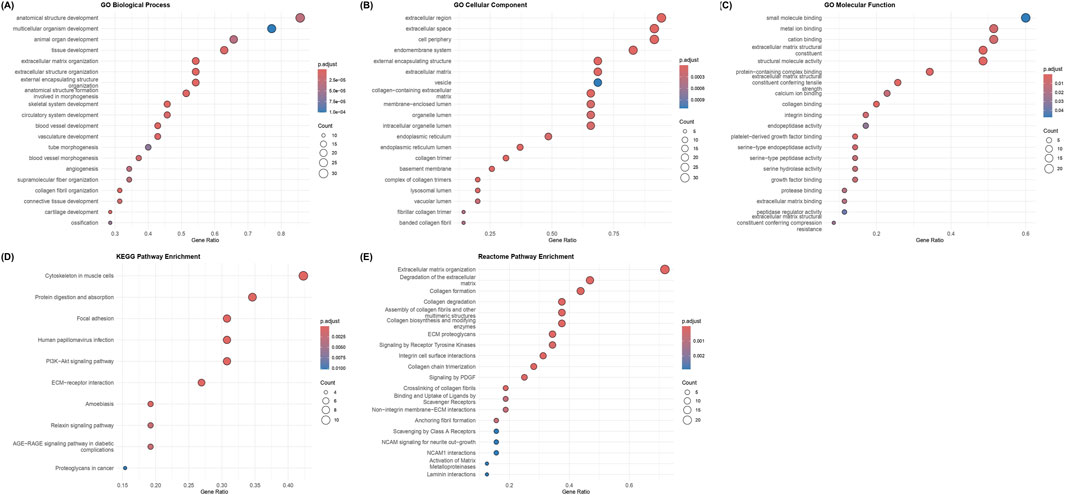
Figure 4. GO, KEGG, and Reactome enrichment analyses of the 35 chosen hub genes. Color indicates the adjusted p-value, and dot sizes are proportional to gene counts: (A) enriched GO Biological process (BP) terms, (B) enriched GO cellular component (CC) terms, (C) enriched GO molecular function (MF) terms, (D) enriched KEGG pathways, and (E) enriched Reactome pathways. Terms related to ECM organization, functions, and interactions are enriched in all five categories.
The cellular localization of the enriched genes was primarily in the extracellular matrix category, along with collagen-containing ECM, extracellular space, basement membrane, endoplasmic reticulum lumen, and collagen trimers. The key genes enriched in this category include VCAN, MMP14, SERPINH1, BGN, SPARC, TGFB1, CTSB, LOXL2, NID2 and collagen-family genes such as COL1A1, COL3A1, COL4A2, COL5A2, COL4A2 and COL18A1. Figure 4B displays the dot plot representing the enriched GO cellular component terms.
The molecular functions (MF) category mainly consisted of structural constituents of the ECM and binding activities to collagen and growth factors, both of which are related to matrix interactions and cell signaling. The key genes recurring in the top GO-MF terms were the collagen and ECM proteins like COL6A3, COL1A1, COL1A2, COL4A1, COL3A1, SPARC, NID2, and VCAN, contributing to the structural component function and genes like FAP, SERPINH1, PDGFBR, MMP14, LUM and CTSK contributing to growth factor and collagen binding functions. Figure 4C shows the dot plot of the top GO Molecular Function terms that were enriched in the analysis.
The KEGG pathway analyses revealed key pathways in cell-matrix interactions and cancer signaling, including the PI3K-Akt pathway, focal adhesion, ECM-receptor interactions, and protein digestion and absorption. Collagen family members like COL6A3, COL4A1, COL4A2, COL1A2, and COL1A1, along with genes such as THBS2, PDGFRB, LUM, and SPP1, were among the key genes in KEGG-enriched pathways. Figure 4D depicts the dot plot of the key pathways that were enriched in the KEGG analysis.
The Reactome pathway enrichment analysis revealed major pathways in the organization and degradation of ECM, the formation, assembly, biosynthesis, and degradation of collagen, and interactions, including integrin/non-integrin interactions and PDGF/RTK signaling pathways. Apart from major collagen genes such as COL1A2, COL1A1, COL3A1, COL4A2, COL5A2, COL18A1, and COL4A1, which are part of multiple pathways, other genes, such as BMP1, PLOD1, PDGFRB, SPP1, CTSK, and MMP14, were also members of the enriched ECM/growth factor pathways. Figure 4E displays the dot plot of the top Reactome pathways that were enriched.
The genes that were not enriched in any of the above analyses (p.adj ≤0.05) and the ones without at least 10 occurrences across the ECM/cancer-related significant terms and pathways were excluded from being considered as hub genes. Supplementary Tables 4A-E provides the results of the GO, KEGG and Reactome enrichment analyses. The final hub genes that were nominated as the final 29 potential therapeutic candidates were BMP1, COL1A2, LUM, SPP1, THBS2, VCAN, COL1A1, COL3A1, CTSK, MMP14, PDGFRB, SERPINH1, THY1, BGN, COL4A2, COL5A2, FAP, SPARC, TGFB1, COL12A1, COL18A1, COL4A1, CTSB, LOXL2, NID2, COL6A3, PLAU, PLOD1, and SULF1.
3.6 Validation of differential expression
For validation of the differential expression of the 29 hub genes, four independent cohorts from distinct populations were used: RNA sequencing data from TCGA-STAD (412 tumors and 36 normal samples) and three microarray datasets from GPL570. GSE54129 included 111 tumors and 21 normal samples from China; GSE13911 included 38 tumors and 31 normal samples from Italy; and GSE66229 included 300 tumors and 100 normal samples from the Asian Cancer Research Group (ACRG). All 29 hub genes were detected in the validation cohorts and quantified. Most of the candidates satisfied the |log2FC| ≥ 1 and FDR ≤0.05 in individual cohorts, and their expression results are provided in Supplementary Tables 5A-D. The volcano plots of these genes from all four cohorts are given in Figures 5A–D. Regardless of the individual results, a meta-analysis of the 29 genes was conducted using the REML model; 22 genes were significant (BH-FDR ≤0.05) with 95% CI and showed consistent dysregulation across cohorts. ECM and stromal genes, such as COL1A1, BGN, SPP1, MMP14, and PLOD1, were consistently higher in tumors with positive pooled log2FC values. Heterogeneity (I2) values were often high because the study combined RNA sequencing and microarray data from distinct populations, yet the pooled effects showed consistent direction. LOO studies were conducted for sensitivity, and most genes were retained as they did not exhibit any sign flips or p-values ≥0.05, regardless of which cohort was removed. CTSK, PLAU and TGFB1 were excluded from downstream analyses due to insignificant REML results, and COL3A1, COL4A2, COL6A3, and LUM were excluded due to insignificant p values in the LOO analysis. Supplementary Table 5E displays the REML and LOO results of the 29 genes. The 22 genes out of the 29 candidates with validated differential expression include BGN, BMP1, COL12A1, COL18A1, COL1A1, COL1A2, COL4A1, COL5A2, CTSB, FAP, LOXL2, MMP14, NID2, PDGFRB, PLOD1, SERPINH1, SPARC, SPP1, SULF1, THBS2, THY1, and VCAN. Forest plots of these genes were generated with log2FC per study, with pooled REML at the bottom, and are provided in Supplementary Figures 2A-Z, 2a-c.
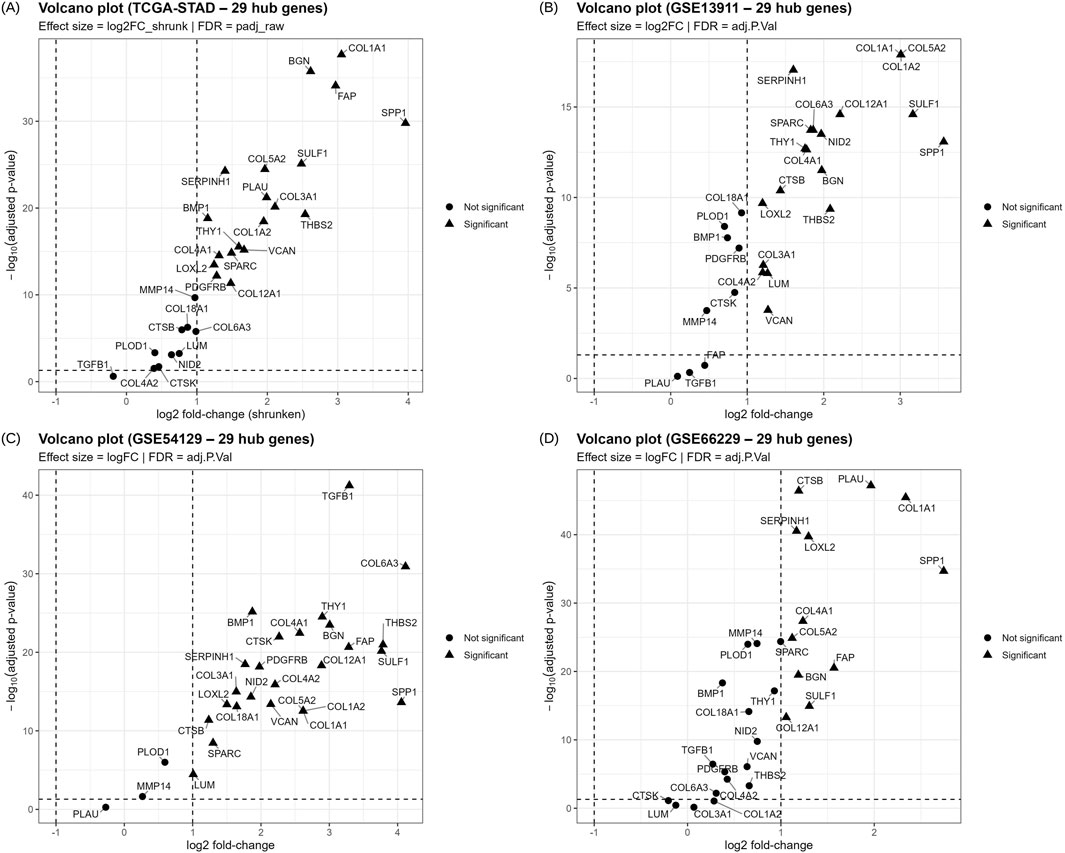
Figure 5. Volcano plots depicting the expression of 29 candidate therapeutic targets in 4 independent cohorts: (A) TCGA-STAD; (B) GSE13911; (C) GSE54129; and (D) GSE66229. X-axis is the log2FC and y-axis is the -log10 FDR; Each point represents a gene, where circles represent non-significant and triangles represent FDR-significant genes.
3.7 Survival analysis and final target selection
For analyzing the prognostic effects of the selected 22 genes, three independent cohorts were utilized: TCGA-STAD had 445 tumor samples with OS and covariates mentioned such as age (437/445), sex (445/445) and stage (77/445); GSE62254 had 300 tumors, GSE15459 had 192 tumors and covariates such as age, sex and stage were available for all the samples from both datasets. Gene expression for the 22 genes was standardized within each cohort, and KM plots were generated for visualization, with Q4 vs. Q1 for each gene. Supplementary figures 3A-V, 4A-V, and 5A-V show the KM plots of the 22 genes with the n-at-risk tables from all three cohorts.
Across all three cohorts, higher expression of the 22 genes was often associated with worse OS. In the univariate and multivariate Cox models adjusted for age and sex, TCGA data showed that many genes, including BGN, FAP, NID2, PDGFRB, THY1, VCAN and some collagen genes were significant with adjusted-HR >1 and FDR ≤0.05. Similarly, univariate and multivariate models adjusted for age, sex, and stage across both GSE62254 and GSE15459 showed independent associations between gene expression and adverse survival outcomes for many genes, including COL18A1, COL4A1, BGN, NID2, VCAN, and THBS2, among others. Supplementary Tables 6A-F provides the univariate and multivariate results of all three cohorts. The results from these cohorts indicated consistent associations between ECM-related gene dysregulation and poorer survival outcomes. The power of the interaction analyses among genes and stages in TCGA was restricted by the small number of cases with stage details (n = 77), and by the lack of significant interactions between any genes and stages with FDR ≤0.05. Within the GSE62254 cohort, some genes, like CTSB and SPP1, showed gene-level associations with multiple stages, but after BH correction, no genes had significant interactions. For the GSE15459 cohort, no interactions were significant after BH correction within genes or across genes. Thus, there was no consistent evidence that the pathological stages could change the prognostic significance of any of the genes.
REML analysis of the univariate results across all cohorts identified 17 of the 22 validated genes as consistent markers (FDR ≤0.05) whose higher expression was associated with worse OS. The percentage of variation across cohorts (I2) was low to moderate for most of these genes, and in the LOO analysis, there was no loss of significance or sign changes. Even though they exhibited consistent tumor-normal dysregulation, five genes (COL12A1, CTSB, PLOD1, SPP1, and SULF1) were excluded from the final candidate list as they did not satisfy the meta-analysis criteria and exhibited loss of prognostic significance. This discordance suggests that differential expression does not necessarily mean the gene would contribute to the prognostic significance. Supplementary Tables 6G-H provides the results of the REML and LOO analyses. Forest plots of all the 22 genes displaying the cohort-specific HRs with 95% CIs, pooled HRs, and other statistical values like I2, and c-indexes are provided as Supplementary Figures 6A-F. The significant genes in the survival analysis were shown to be key players in ECM remodeling with stromal significance, including collagen genes, matrix-processing genes, and cancer-associated fibroblasts (CAFs) or stromal markers. Thus, the 17 final potential therapeutic candidates with significant prognostic associations (the pooled HR > 1, pooled FDR ≤0.05, HR > 1 in ≥2/3 cohorts with no sign changes in LOO) are BGN, BMP1, COL18A1, COL1A1, COL1A2, COL4A1, COL5A2, FAP, LOXL2, MMP14, NID2, PDGFRB, SERPINH1, SPARC, THBS2, THY1, and VCAN.
3.8 ADMET profiling and ligand preparation
For the 17 chosen targets, a systematic literature search was conducted to identify prior in silico, in vitro, or animal model-based experiments targeting them in gastric cancer. It was found that there is limited data on reports of natural compound or drug testing for 4 of the selected genes in gastric cancer. As a result, those genes were retained for docking analysis, and the other 13 genes, which had been previously targeted, were excluded. The source of phytochemicals was TCMBank, where 58 compounds were retrieved for the search term ‘stomach neoplasm’. Figure 6 shows the interaction diagram of the 58 compounds obtained from TCMBank. SMILES strings for the 58 compounds were utilized for ADMET evaluation, and SwissADME was used for ADME evaluation to prioritize compounds that obeyed Lipinski’s rule of five, exhibited high gastrointestinal (GI) permeability, and showed favorable bioavailability scores. ProTox-III was used for toxicity profiling to retain compounds in toxicity classes IV and V (low acute toxicity). Only 14 compounds exhibited acceptable ADMET profiles, and their 3D structures were retrieved in SDF format from PubChem for docking. Supplementary Table 7 presents the ADMET profiles of the selected 14 compounds. The reference compound chosen was 5-fluorouracil (5-FU), a common small-molecule chemotherapeutic agent in the treatment of gastric cancer. These compounds were energy-minimized and converted to formats suitable for docking (PDBQT format) using OpenBabel.
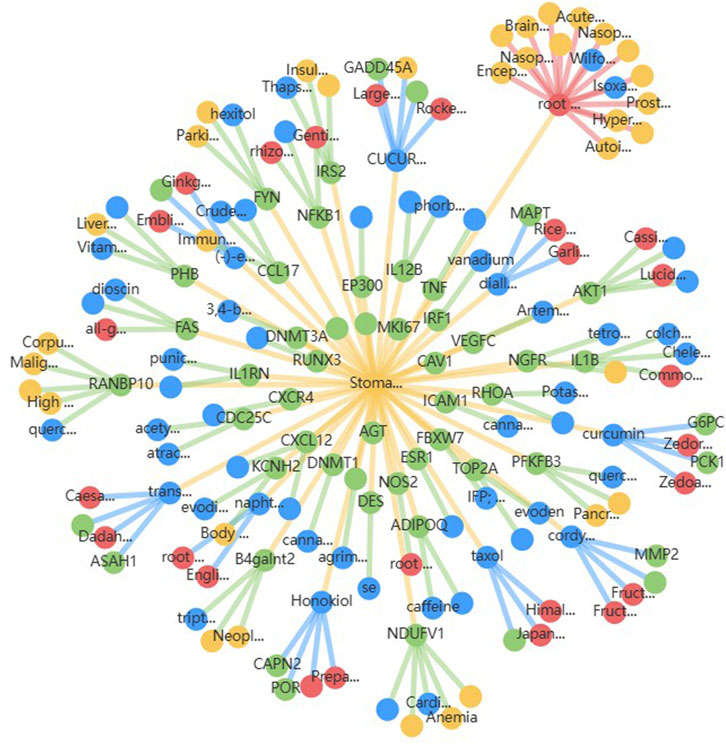
Figure 6. Compound-target interaction network for 58 stomach neoplasm-related phytochemicals retrieved from TCMBank, where blue represents the candidate compounds and green represents the potential targets. Red nodes represent the herbs in which these compounds are present, and yellow nodes represent other diseases where the candidate compounds may have potential roles.
3.9 Target structure selection and preparation
After the targeted literature search, it was shown that most of the final therapeutic candidates had already been studied as targets in in silico, in vitro, or in vivo settings, and four targets (THBS2, VCAN, THY1, and NID2) had limited information on their use as targets. For THBS2, PDB entry 1YO8 containing the C-terminal domain was used as it was the highest-quality entry available in the RCSB PDB. This PDB model was directly cleaned and protonated using MGL tools. As experimental structures were not available, AlphaFold models corresponding to the Uniprot entries were used for VCAN (D6RGZ6), THY1 (P04216), and NID2 (Q14112). For these models, residues with confidence scores less than 50 (pLDDT<50) were removed using PyMOL, and missing loops were remodeled using SWISS-MODEL. Additionally, steric clashes were repaired using PRAS for NID2, and the energy minimization was performed in SwissPDBViewer for the THY1 model (Nnyigide et al., 2022; Guex and Peitsch, 1997). The primary binding pocket information of all the finalized structures was obtained using PrankWeb. Finally, after protein preparation, all structures were saved in PDBQT format for docking.
3.10 Molecular docking and lead compound selection
AutoDock Vina was used for docking simulations against each protein’s primary binding pocket. Additionally, 5-FU was docked to these sites as a reference compound, and each ligand-target pair was run in triplicate with different random seeds. The best affinities were consistent across the runs (variation less than 1 kcal mol-1), and lead phytocompounds were chosen based on the lowest binding affinities. All selected compounds exhibited better binding scores than the reference drug 5-FU, and the phytocompound showed the highest affinity for VCAN, NID2, and THBS2. For VCAN, along with evoden, ursolic acid scored the best affinity of −9.5 kcal mol-1 in all triplicates. Evoden showed high affinities of −10.4, −10.4, −10.3 kcal mol-1 with NID2 and a binding affinity of −9.5 kcal mol-1 with THBS2 across all the runs. Ursolic acid scored best with the THY1 model with −6.9 kcal mol-1 across the runs, even though it is higher than the reference drug (−4.4 kcal mol-1); it is comparatively low, probably due to the shallow ectodomain of the protein. Table 4 summarizes the docking and interaction results with binding affinities (triplicate mean ± standard deviation, SD) of the four targets. The interactions between the top-scoring ligand model and targets were visualized using Discovery Studio Visualizer, and the interactions were noted. Figures 7A–E depicts the interaction diagrams of all the target-ligand complexes.
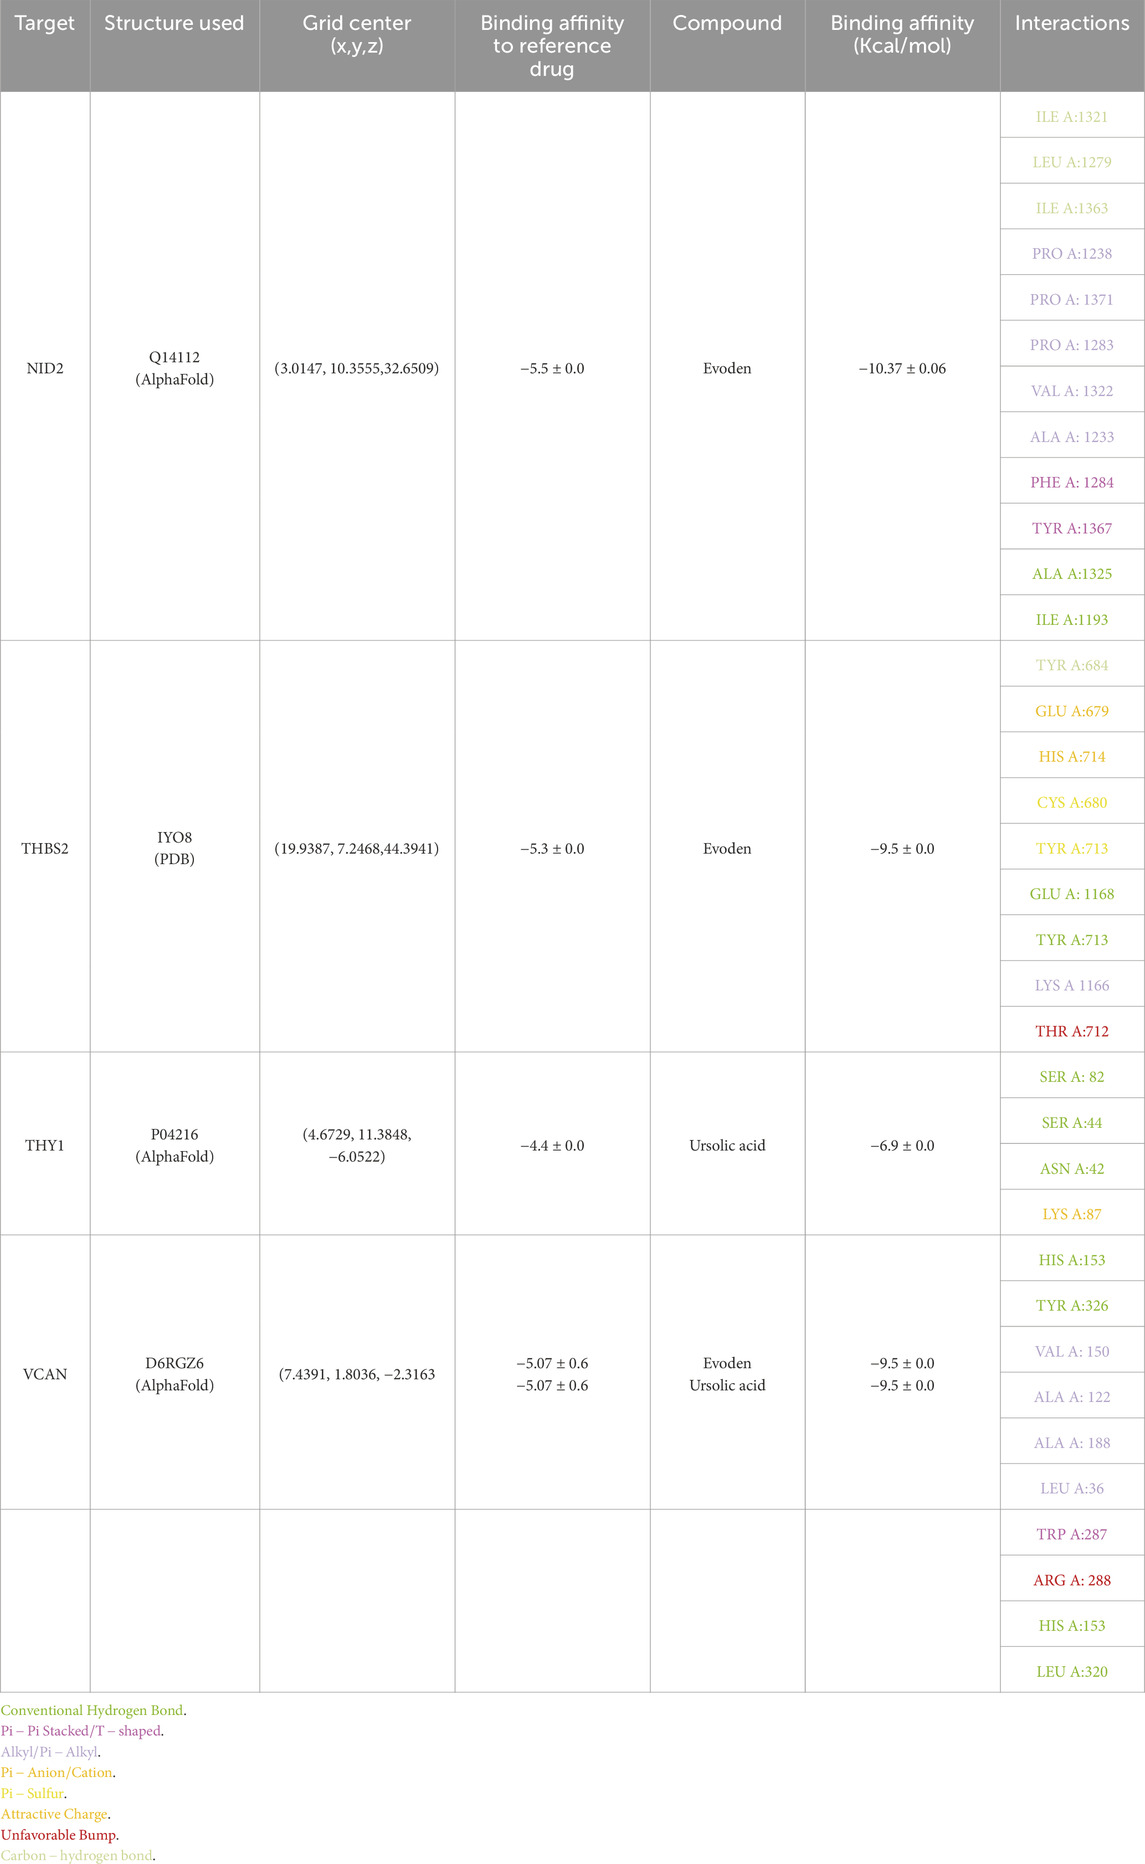
Table 4. Structure and grid information, binding affinities and interaction results of all 4 targets and their top-scoring ligands.
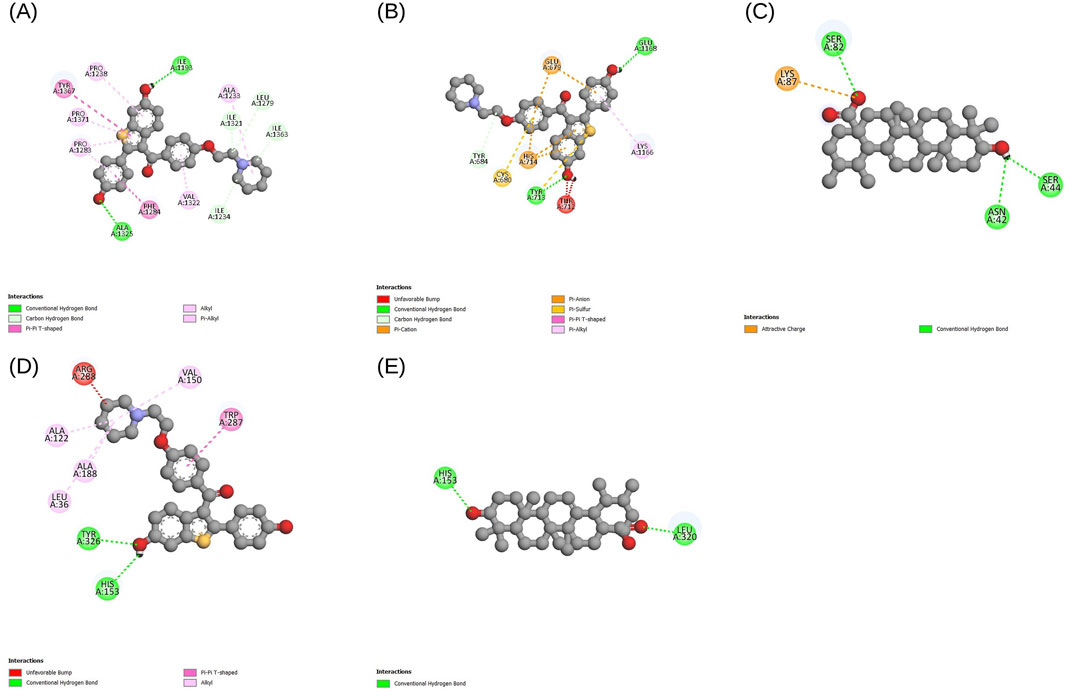
Figure 7. Docking interaction diagrams for the 4 final targets with their top-scoring ligands, visualized in Discovery Studio. Each panel shows the ligand bound in the protein’s primary pocket, defined using Prankweb: (A) NID2-Evoden; (B) THBS2-Evoden; (C) THY1-Ursolic acid; (D) VCAN-Evoden; (E) VCAN-Ursolic acid. All lead compounds achieved more binding affinities than the reference molecule 5-FU.
Across these targets, the docked complexes exhibited non-classical interactions, including alkyl, pi-alkyl, and carbon-hydrogen bonds in addition to the standard donor-acceptor hydrogen bonds. Unfavorable bumps may be due to shallow geometry, imperfections in the modeled regions, or the absence of cofactors and metal ions, suggesting areas for further model refinement and experimental validation. However, triplicate runs produced reproducible results across the targets, where ursolic acid and evoden showed good binding affinities to the chosen targets.
4 Discussion
This study utilized an integrative pipeline to finalize seventeen potential therapeutic targets with prognostically adverse effects in gastric cancer: BGN, BMP1, COL18A1, COL1A1, COL1A2, COL4A1, COL5A2, FAP, LOXL2, MMP14, NID2, PDGFRB, SERPINH1, SPARC, THBS2, THY1, and VCAN. It combined the Bonferroni-corrected RRA genes with hub genes from WGCNA modules, followed by network analysis combining topological and clustering analyses, expression validation, and survival meta-analysis to narrow down to 17 potential therapeutic targets with druggable roles in GC. Functionally, all final genes were either part of stromal/ECM or tumor-microenvironment regulation, and the presence of collagen pathways, matrix proteolysis and cross-linking, along with fibroblast signaling, provided further evidence that ECM remodeling promotes GC tumor as well as immune invasion and therapy resistance (Moreira et al., 2020).
The first category identified had basement membrane-related functions and included multiple collagen genes, including COL1A1, COL4A1, COL1A2, COL5A2, and COL18A1, along with the linker NID2. The collagen genes are often upregulated in GC; collagen type Ⅰ alpha 1 chain (COL1A1) and collagen type Ⅰ alpha 2 chain (COL1A2) upregulation are shown to be associated with poor survival, and collagen type Ⅳ alpha 1 chain (COL4A1) is shown to promote the progression of GC and multidrug resistance. (Li J. et al., 2016; Qian et al., 2025). Enhanced migration and a worse prognosis are often associated with collagen type Ⅴ alpha 2 chain (COL5A2) overexpression, and Nidogen 2 (NID2) is shown to remodel the basement membrane to facilitate metastasis. (Yu et al., 2019; Tan et al., 2021). Meanwhile, high collagen type XVIII alpha 1 chain (COL18A1) expression and higher serum levels of endostatin encoded by this gene are suggested to be correlated with metastasis and unfavorable prognosis. This gene has also been tested as an anti-angiogenic target, along with chemotherapy, using recombinant human endostatin (Endostar) due to its ability to inhibit angiogenesis (Lee et al., 2010; Zhou et al., 2011; Wang et al., 2015). The second category, represented by the selected genes, is collagen processing, with components such as BMP1, SERPINH1, MMP14, and LOXL2 that enable ECM invasion. It is demonstrated that bone morphogenetic protein 1 (BMP1) overexpression is common in GC, and when suppressed, it inhibits tumor cell motility (Hsieh et al., 2018). Serpin family H member 1 (SERPINH1) enables collagen maturation, and thus its knockdown is shown to reduce the proliferation, invasion, and migration of GC cells (Tian et al., 2020). Other selected members of this category are matrix metallopeptidase 14 (MMP14), whose serum levels are often associated with adverse survival outcomes in GC, and lysyl oxidase-like 2 (LOXL2), which mediates the progression of GC (Kasashima et al., 2014; Kasurinen et al., 2018). Additionally, a TME-related category involving growth factor and CAF activity was identified, with genes such as FAP and PDGFRB; high platelet-derived growth factor receptor beta (PDGFRB) is associated with reduced survival outcomes when receiving S-1 adjuvant chemotherapy. (Higuchi et al., 2017). Meanwhile, fibroblast activation protein-positive (FAP+) CAFs are shown to promote GC cell growth and confer resistance to immune checkpoint inhibitors in xenograft models. (Wen et al., 2017). Another important category of selected genes is the modulators that enable cross-talk between cells and the matrix: VCAN, SPARC, THBS2, BGN, and THY1. Secreted protein acidic and cysteine-rich (SPARC) overexpression is correlated with poorer OS in GC patients. Meanwhile, thrombospondin-2 (THBS2) has been shown to promote stemness and the progression of GC through activation of the Notch pathway. It was found that THBS2 can act as a prognostic and diagnostic marker due to its roles in ECM regulation and angiogenesis (Li Z. et al., 2016; 2021; Chang et al., 2024). The dysregulation of versican (VCAN) leads to tumor invasion. It has a significant correlation with worsened outcomes; its upregulation in gastric cancer is shown to promote cancer cell proliferation and is associated with enhanced tumor invasion and HER2 positivity (Li et al., 2020). Recent studies also suggested the combined effect of VCAN and THBS2 to accelerate the growth of gastric cancer (Wang et al., 2023). Additionally, biglycan (BGN) upregulation has shown potential association with immune infiltration and worse survival outcomes in GC (Zhang S. et al., 2022). Another therapeutic target identified is the glycoprotein Thymus cell antigen 1 (THY1), also known as CD90, which is suggested to be a potential immunotherapy target that could be used for assessing the TME status (Hu et al., 2020). High expression of THY1 has also demonstrated evidence of modulating SPARC expression and thereby, inhibition of apoptosis of GC cells (ZHU et al., 2015).
The 17 identified targets are central to the druggable aspects of the tumor microenvironment; anti-PDGFR approaches, LOXL2 inhibitors, MMP14 targeting, and FAP are well-studied strategies in GC treatment. ECM components such as VCAN, THBS2, SPARC, BGN and collagen modulators are generally easily targetable by small molecules. A literature survey confirms that there is limited information on studies testing natural compounds or small-molecule drugs against four of these targets, thereby leaving a therapeutic targeting gap that this study aimed to address. The molecular docking analyses conducted identified evoden and ursolic acid as promising lead compounds against these targets. However, the study was limited by the restricted scope of compounds, which involved a single natural compound library. Thus, the lead compounds were suggested as potential therapeutic leads that need extensive testing in the future. Another limitation was the target models, which lacked bound cofactors and ions, which may have contributed to weak interactions; thus, they require further structural modifications to display their potential interactions accurately. Furthermore, the study did not include single-cell datasets that would have reflected the localized expression of the hub genes. The study recommends expanding chemical screening to include diverse natural product databases and drug libraries, as well as molecular dynamics simulations, and to include crucial in vitro and in vivo validations in the future. It also recommends including analyses of single-cell GC data to confirm the stromal and pericellular localization of the hub genes to ensure effective targeting of GC cells. To conclude, this study identified 17 targets that could lead to more effective, personalized therapeutic interventions. However, as the study is entirely computational, the expression patterns and prognostic significance of the hub genes can be confirmed only through future experimental validation, including qPCR/Western blotting and immunohistochemistry analyses of tissue samples.
Data availability statement
The original contributions presented in the study are included in the article/Supplementary Material, further inquiries can be directed to the corresponding author.
Author contributions
MO: Writing – original draft, Formal Analysis, Methodology, Data curation. JS: Supervision, Writing – review and editing, Conceptualization.
Funding
The author(s) declare that financial support was received for the research and/or publication of this article. The authors declare that financial support was received for the Article Processing Charge (APC) of this article from Vellore Institute of Technology.
Acknowledgements
The authors would like to take this opportunity to thank the management of Vellore Institute of Technology (VIT), Vellore, India, for providing the necessary facilities and encouragement to carry out this work.
Conflict of interest
The authors declare that the research was conducted in the absence of any commercial or financial relationships that could be construed as a potential conflict of interest.
Generative AI statement
The author(s) declare that no Generative AI was used in the creation of this manuscript.
Any alternative text (alt text) provided alongside figures in this article has been generated by Frontiers with the support of artificial intelligence and reasonable efforts have been made to ensure accuracy, including review by the authors wherever possible. If you identify any issues, please contact us.
Publisher’s note
All claims expressed in this article are solely those of the authors and do not necessarily represent those of their affiliated organizations, or those of the publisher, the editors and the reviewers. Any product that may be evaluated in this article, or claim that may be made by its manufacturer, is not guaranteed or endorsed by the publisher.
Supplementary material
The Supplementary Material for this article can be found online at: https://www.frontiersin.org/articles/10.3389/fbinf.2025.1654326/full#supplementary-material
References
Baez, M., Jimenez, R., Cernuzzi, L., and Paccanaro, A. (2025). ClusterONE web: a tool for discovering and analyzing overlapping protein complexes. Nucleic Acids Res. 53, W172–W177. doi:10.1093/nar/gkaf368
Banerjee, P., Kemmler, E., Dunkel, M., and Preissner, R. (2024). ProTox 3.0: a webserver for the prediction of toxicity of chemicals. Nucleic Acids Res. 52, W513–W520. doi:10.1093/nar/gkae303
Bao, B., Tian, M., Wang, X., Yang, C., Qu, J., Zhou, S., et al. (2025). SNORA37/CMTR1/ELAVL1 feedback loop drives gastric cancer progression via facilitating CD44 alternative splicing. J. Exp. & Clin. Cancer Res. 44, 15. doi:10.1186/s13046-025-03278-x
Barrett, T., Wilhite, S. E., Ledoux, P., Evangelista, C., Kim, I. F., Tomashevsky, M., et al. (2012). NCBI GEO: archive for functional genomics data sets—Update. Nucleic Acids Res. 41, D991–D995. doi:10.1093/nar/gks1193
Benjamini, Y., and Hochberg, Y. (1995). Controlling the false discovery rate: a practical and powerful approach to multiple testing. J. R. Stat. Soc. Ser. B Stat. Methodol. 57, 289–300. doi:10.1111/j.2517-6161.1995.tb02031.x
Berman, H. M. (2000). The protein data bank. Nucleic Acids Res. 28, 235–242. doi:10.1093/nar/28.1.235
Bray, F., Laversanne, M., Sung, H., Ferlay, J., Siegel, R. L., Soerjomataram, I., et al. (2024). Global cancer statistics 2022: GLOBOCAN estimates of incidence and mortality worldwide for 36 cancers in 185 countries. CA Cancer J. Clin. 74, 229–263. doi:10.3322/caac.21834
Carlson, M., Falcon, S., Pages, H., and Li, N. (2016). hgu133plus2. Db: affymetrix human genome U133 plus 2.0 array annotation data (chip hgu133plus2). R. package version 3. doi:10.18129/B9.bioc.hgu133plus2.db
Carlson, M., Falcon, S., Pages, H., and Li, N. (2019). Org. Hs. Eg. Db: genome wide annotation for human. R. package version 3, 3. doi:10.18129/B9.bioc.org.Hs.eg.db
Chang, H. R., Nam, S., Kook, M.-C., Kim, K.-T., Liu, X., Yao, H., et al. (2016). HNF4α is a therapeutic target that links AMPK to WNT signalling in early-stage gastric cancer. Gut 65, 19–32. doi:10.1136/gutjnl-2014-307918
Chang, Z., Gao, Y., Chen, P., Gao, W., Zhao, W., Wu, D., et al. (2024). THBS2 promotes gastric cancer progression and stemness via the notch signaling pathway. Am. J. Cancer Res. 14, 3433–3450. doi:10.62347/UXWK4038
Cheng, L., Yang, S., Yang, Y., Zhang, W., Xiao, H., Gao, H., et al. (2012). Global gene expression and functional network analysis of gastric cancer identify extended pathway maps and GPRC5A as a potential biomarker. Cancer Lett. 326, 105–113. doi:10.1016/j.canlet.2012.07.031
Chin, C.-H., Chen, S.-H., Wu, H.-H., Ho, C.-W., Ko, M.-T., and Lin, C.-Y. (2014). cytoHubba: identifying hub objects and sub-networks from complex interactome. BMC Syst. Biol. 8, S11. doi:10.1186/1752-0509-8-S4-S11
Chivu Economescu, M., Necula, L. G., Dragu, D., Badea, L., Dima, S. O., Tudor, S., et al. (2010). Identification of potential biomarkers for early and advanced gastric adenocarcinoma detection. Hepatogastroenterology 57, 1453–1464.
Colaprico, A., Silva, T. C., Olsen, C., Garofano, L., Cava, C., Garolini, D., et al. (2016). TCGAbiolinks: an R/Bioconductor package for integrative analysis of TCGA data. Nucleic Acids Res. 44, e71. doi:10.1093/nar/gkv1507
Cristescu, R., Lee, J., Nebozhyn, M., Kim, K.-M., Ting, J. C., Wong, S. S., et al. (2015). Molecular analysis of gastric cancer identifies subtypes associated with distinct clinical outcomes. Nat. Med. 21, 449–456. doi:10.1038/nm.3850
Cui, J., Chen, Y., Chou, W.-C., Sun, L., Chen, L., Suo, J., et al. (2011). An integrated transcriptomic and computational analysis for biomarker identification in gastric cancer. Nucleic Acids Res. 39, 1197–1207. doi:10.1093/nar/gkq960
Daina, A., Michielin, O., and Zoete, V. (2017). SwissADME: a free web tool to evaluate pharmacokinetics, drug-likeness and medicinal chemistry friendliness of small molecules. Sci. Rep. 7, 42717. doi:10.1038/srep42717
Ding, P., Wu, J., Wu, H., Li, T., Niu, X., Yang, P., et al. (2024). Transcriptomics-based liquid biopsy for early detection of recurrence in locally advanced gastric cancer. Adv. Sci. 11, 2406276. doi:10.1002/advs.202406276
D’Errico, M., de Rinaldis, E., Blasi, M. F., Viti, V., Falchetti, M., Calcagnile, A., et al. (2009). Genome-wide expression profile of sporadic gastric cancers with microsatellite instability. Eur. J. Cancer 45, 461–469. doi:10.1016/j.ejca.2008.10.032
Fisher, R. A. (1922). On the interpretation of χ 2 from contingency tables, and the calculation of P. J. R. Stat. Soc. 85, 87. doi:10.2307/2340521
Guangchuang, Y., Erqiang, H., and Chun-Hui, G. (2023). Visualization of functional enrichment result. Enrichplot 10, B9. doi:10.18129/B9.bioc.enrichplot
Guex, N., and Peitsch, M. C. (1997). SWISS-MODEL and the swiss-pdb viewer: an environment for comparative protein modeling. Electrophoresis 18, 2714–2723. doi:10.1002/elps.1150181505
He, J., Jin, Y., Chen, Y., Yao, H.-B., Xia, Y.-J., Ma, Y.-Y., et al. (2016). Downregulation of ALDOB is associated with poor prognosis of patients with gastric cancer. Onco Targets Ther. 9, 6099–6109. doi:10.2147/OTT.S110203
Higuchi, A., Oshima, T., Yoshihara, K., Sakamaki, K., Aoyama, T., Suganuma, N., et al. (2017). Clinical significance of platelet-derived growth factor receptor-β gene expression in stage II/III gastric cancer with S-1 adjuvant chemotherapy. Oncol. Lett. 13, 905–911. doi:10.3892/ol.2016.5494
Holbrook, J. D., Parker, J. S., Gallagher, K. T., Halsey, W. S., Hughes, A. M., Weigman, V. J., et al. (2011). Deep sequencing of gastric carcinoma reveals somatic mutations relevant to personalized medicine. J. Transl. Med. 9, 119. doi:10.1186/1479-5876-9-119
Hsieh, Y.-Y., Tung, S.-Y., Pan, H.-Y., Yen, C.-W., Xu, H.-W., Deng, Y.-F., et al. (2018). Upregulation of bone morphogenetic protein 1 is associated with poor prognosis of late-stage gastric cancer patients. BMC Cancer 18, 508. doi:10.1186/s12885-018-4383-9
Hu, Y., Jin, D., Zhou, Y., Cheng, Y., Cao, H., Ma, Y., et al. (2020). Multiple roles of THY1 in gastric cancer based on data mining. Transl. Cancer Res. 9, 2748–2757. doi:10.21037/tcr.2020.02.51
Hu, J., Song, Y., Cai, X., Halina, H., Qiao, K., Lu, J., et al. (2023). A novel pyroptosis gene expression-based risk score for survival in gastric cancer. Front. Endocrinol. (Lausanne) 14, 1120216. doi:10.3389/fendo.2023.1120216
Irizarry, R. A., Gautier, L., and Cope, L. M. (2003). “An R package for analyses of affymetrix oligonucleotide arrays,” in The analysis of gene expression data: methods and software (Springer), 102–119.
Ishii, T., and Shitara, K. (2021). Trastuzumab deruxtecan and other HER2-targeting agents for the treatment of HER2-positive gastric cancer. Expert Rev. Anticancer Ther. 21, 1193–1201. doi:10.1080/14737140.2021.1982698
Javle, M., Smyth, E. C., and Chau, I. (2014). Ramucirumab: successfully targeting angiogenesis in gastric cancer. Clin. Cancer Res. 20, 5875–5881. doi:10.1158/1078-0432.CCR-14-1071
Jumper, J., Evans, R., Pritzel, A., Green, T., Figurnov, M., Ronneberger, O., et al. (2021). Highly accurate protein structure prediction with AlphaFold. Nature 596, 583–589. doi:10.1038/s41586-021-03819-2
Kasashima, H., Yashiro, M., Kinoshita, H., Fukuoka, T., Morisaki, T., Masuda, G., et al. (2014). Lysyl oxidase-like 2 (LOXL2) from stromal fibroblasts stimulates the progression of gastric cancer. Cancer Lett. 354, 438–446. doi:10.1016/j.canlet.2014.08.014
Kasurinen, A., Tervahartiala, T., Laitinen, A., Kokkola, A., Sorsa, T., Böckelman, C., et al. (2018). High serum MMP-14 predicts worse survival in gastric cancer. PLoS One 13, e0208800. doi:10.1371/journal.pone.0208800
Kim, S., Chen, J., Cheng, T., Gindulyte, A., He, J., He, S., et al. (2025). PubChem 2025 update. Nucleic Acids Res. 53, D1516–D1525. doi:10.1093/nar/gkae1059
Kitamura, S., Tanahashi, T., Aoyagi, E., Nakagawa, T., Okamoto, K., Kimura, T., et al. (2017). Response predictors of S-1, cisplatin, and docetaxel combination chemotherapy for metastatic gastric cancer: microarray analysis of whole human genes. Oncology 93, 127–135. doi:10.1159/000464329
Kolde, R., Laur, S., Adler, P., and Vilo, J. (2012). Robust rank aggregation for gene list integration and meta-analysis. Bioinformatics 28, 573–580. doi:10.1093/bioinformatics/btr709
Kubota, Y., and Shitara, K. (2024). Zolbetuximab for Claudin18.2-positive gastric or gastroesophageal junction cancer. Ther. Adv. Med. Oncol. 16, 17588359231217967. doi:10.1177/17588359231217967
Kuhn, M., von Mering, C., Campillos, M., Jensen, L. J., and Bork, P. (2007). STITCH: interaction networks of chemicals and proteins. Nucleic Acids Res. 36, D684–D688. doi:10.1093/nar/gkm795
Langfelder, P., and Horvath, S. (2008). WGCNA: an R package for weighted correlation network analysis. BMC Bioinforma. 9, 559. doi:10.1186/1471-2105-9-559
Law, C. W., Chen, Y., Shi, W., and Smyth, G. K. (2014). Voom: precision weights unlock linear model analysis tools for RNA-seq read counts. Genome Biol. 15, R29. doi:10.1186/gb-2014-15-2-r29
Lee, K. S., Park, G. S., Hong, S. H., Byun, J. H., Woo, I. S., Jeon, H.-M., et al. (2010). Prognostic relevance of collagen XVIII expression in metastatic gastric carcinoma. Tumor Biol. 31, 165–170. doi:10.1007/s13277-010-0022-z
Li, H., Yu, B., Li, J., Su, L., Yan, M., Zhang, J., et al. (2015). Characterization of differentially expressed genes involved in pathways associated with gastric cancer. PLoS One 10, e0125013. doi:10.1371/journal.pone.0125013
Li, J., Ding, Y., and Li, A. (2016a). Identification of COL1A1 and COL1A2 as candidate prognostic factors in gastric cancer. World J. Surg. Oncol. 14, 297. doi:10.1186/s12957-016-1056-5
Li, Z., Li, A.-D., Xu, L., Bai, D.-W., Hou, K.-Z., Zheng, H.-C., et al. (2016b). SPARC expression in gastric cancer predicts poor prognosis: results from a clinical cohort, pooled analysis and GSEA assay. Oncotarget 7, 70211–70222. doi:10.18632/oncotarget.12191
Li, L., Zhu, Z., Zhao, Y., Zhang, Q., Wu, X., Miao, B., et al. (2019). FN1, SPARC, and SERPINE1 are highly expressed and significantly related to a poor prognosis of gastric adenocarcinoma revealed by microarray and bioinformatics. Sci. Rep. 9, 7827. doi:10.1038/s41598-019-43924-x
Li, W., Han, F., Fu, M., and Wang, Z. (2020). High expression of VCAN is an independent predictor of poor prognosis in gastric cancer. J. Int. Med. Res. 48, 0300060519891271. doi:10.1177/0300060519891271
Li, L., Dong, J., Fu, L., Xia, X., Pan, F., and Ning, Y. (2021). Clinical value of serum Thrombospondin-2 combined with CA19-9 in early diagnosis of gastric cancer. J. Oncol. 2021, 1–7. doi:10.1155/2021/2483964
Liu, J., Ben, Q., Lu, E., He, X., Yang, X., Ma, J., et al. (2018). Long noncoding RNA PANDAR blocks CDKN1A gene transcription by competitive interaction with p53 protein in gastric cancer. Cell Death Dis. 9, 168. doi:10.1038/s41419-017-0246-6
Lordick, F., Bodoky, G., Chung, H., Kurteva, G., Kang, Y., Oh, S. C., et al. (2012). Cetuximab in combination with capecitabine and cisplatin as first-line treatment in advanced gastric cancer: randomized controlled phase III expand study. Ann. Oncol. 23, ixe11. doi:10.1016/S0923-7534(20)34321-0
Lou, S., Wang, Y., Zhang, J., Yin, X., Zhang, Y., Wang, Y., et al. (2022a). Patient-level DNA damage repair pathway profiles and anti-tumor immunity for gastric cancer. Front. Immunol. 12, 806324. doi:10.3389/fimmu.2021.806324
Lou, S., Zhang, J., Yin, X., Zhang, Y., Fang, T., Wang, Y., et al. (2022b). Comprehensive characterization of tumor purity and its clinical implications in gastric cancer. Front. Cell Dev. Biol. 9, 782529. doi:10.3389/fcell.2021.782529
Love, M. I., Huber, W., and Anders, S. (2014). Moderated estimation of fold change and dispersion for RNA-Seq data with DESeq2. Genome Biol. 15, 550. doi:10.1186/s13059-014-0550-8
Luo, D., Liu, Y., Lu, Z., and Huang, L. (2025). Targeted therapy and immunotherapy for gastric cancer: rational strategies, novel advancements, challenges, and future perspectives. Mol. Med. 31, 52. doi:10.1186/s10020-025-01075-y
Lv, Q., Chen, G., He, H., Yang, Z., Zhao, L., Zhang, K., et al. (2023). TCMBank-the largest TCM database provides deep learning-based Chinese-Western medicine exclusion prediction. Signal Transduct. Target Ther. 8, 127. doi:10.1038/s41392-023-01339-1
Mamun, T. I., Younus, S., and Rahman, Md. H. (2024). Gastric cancer—Epidemiology, modifiable and non-modifiable risk factors, challenges and opportunities: an updated review. Cancer Treat. Res. Commun. 41, 100845. doi:10.1016/j.ctarc.2024.100845
Moreira, A. M., Pereira, J., Melo, S., Fernandes, M. S., Carneiro, P., Seruca, R., et al. (2020). The extracellular matrix: an accomplice in gastric cancer development and progression. Cells 9, 394. doi:10.3390/cells9020394
Mun, D.-G., Bhin, J., Kim, S., Kim, H., Jung, J. H., Jung, Y., et al. (2019). Proteogenomic characterization of human early-onset gastric cancer. Cancer Cell 35, 111–124.e10. doi:10.1016/j.ccell.2018.12.003
Nagao, S., Takahashi, Y., Denda, T., Tanaka, Y., Miura, Y., Mizutani, H., et al. (2023). Reduced DEFA5 expression and STAT3 activation underlie the submucosal invasion of early gastric cancers. Digestion 104, 480–493. doi:10.1159/000531790
Nan, Y., Su, H., Zhou, B., and Liu, S. (2023). The function of natural compounds in important anticancer mechanisms. Front. Oncol. 12, 1049888. doi:10.3389/fonc.2022.1049888
Nnyigide, O. S., Nnyigide, T. O., Lee, S.-G., and Hyun, K. (2022). Protein repair and analysis server: a web server to repair PDB structures, add missing heavy atoms and hydrogen atoms, and assign secondary structures by amide interactions. J. Chem. Inf. Model 62, 4232–4246. doi:10.1021/acs.jcim.2c00571
Oh, S. C., Sohn, B. H., Cheong, J.-H., Kim, S.-B., Lee, J. E., Park, K. C., et al. (2018). Clinical and genomic landscape of gastric cancer with a mesenchymal phenotype. Nat. Commun. 9, 1777. doi:10.1038/s41467-018-04179-8
Oh, S., Abdelnabi, J., Al-Dulaimi, R., Aggarwal, A., Ramos, M., Davis, S., et al. (2020). HGNChelper: identification and correction of invalid gene symbols for human and mouse. F1000Res 9, 1493. doi:10.12688/f1000research.28033.2
Oliveros, J. C. (2007). VENNY. An interactive tool for comparing lists with venn diagrams. Available online at: https://bioinfogp.cnb.csic.es/tools/venny/.
Ooi, C. H., Ivanova, T., Wu, J., Lee, M., Tan, I. B., Tao, J., et al. (2009). Oncogenic pathway combinations predict clinical prognosis in gastric cancer. PLoS Genet. 5, e1000676. doi:10.1371/journal.pgen.1000676
O’Boyle, N. M., Banck, M., James, C. A., Morley, C., Vandermeersch, T., and Hutchison, G. R. (2011). Open babel: an open chemical toolbox. J. Cheminform 3, 33. doi:10.1186/1758-2946-3-33
Pagès, H., Carlson, M., Falcon, S., Li, N., Maintainer, M. B. P., Imports, D. B. I., et al. (2017). Package ‘annotationDbi. Bioconductor Packag. Maint. doi:10.18129/B9.bioc.AnnotationDbi
Polák, L., Škoda, P., Riedlová, K., Krivák, R., Novotný, M., and Hoksza, D. (2025). PrankWeb 4: a modular web server for protein–ligand binding site prediction and downstream analysis. Nucleic Acids Res. 53, W466–W471. doi:10.1093/nar/gkaf421
Qian, X., Jia, W., Li, Y., Chen, J., Zhang, J., and Sun, Y. (2025). COL4A1 promotes gastric cancer progression by regulating tumor invasion, tumor microenvironment and drug sensitivity. Curr. Med. Chem. 32. doi:10.2174/0109298673351943250314074632
Ritchie, M. E., Phipson, B., Wu, D., Hu, Y., Law, C. W., Shi, W., et al. (2015). Limma powers differential expression analyses for RNA-Sequencing and microarray studies. Nucleic Acids Res. 43, e47. doi:10.1093/nar/gkv007
Shannon, P., Markiel, A., Ozier, O., Baliga, N. S., Wang, J. T., Ramage, D., et al. (2003). Cytoscape: a software environment for integrated models of biomolecular interaction networks. Genome Res. 13, 2498–2504. doi:10.1101/gr.1239303
Szklarczyk, D., Gable, A. L., Lyon, D., Junge, A., Wyder, S., Huerta-Cepas, J., et al. (2019). STRING v11: protein-protein association networks with increased coverage, supporting functional discovery in genome-wide experimental datasets. Nucleic Acids Res. 47 (D1), D607–D613. doi:10.1093/nar/gky1131
Tan, Y., Chen, Q., Xing, Y., Zhang, C., Pan, S., An, W., et al. (2021). High expression of COL5A2, a member of COL5 family, indicates the poor survival and facilitates cell migration in gastric cancer. Biosci. Rep. 41. doi:10.1042/BSR20204293
Tian, S., Peng, P., Li, J., Deng, H., Zhan, N., Zeng, Z., et al. (2020). SERPINH1 regulates EMT and gastric cancer metastasis via the Wnt/β-catenin signaling pathway. Aging 12, 3574–3593. doi:10.18632/aging.102831
Trott, O., and Olson, A. J. (2010). AutoDock vina: improving the speed and accuracy of docking with a new scoring function, efficient optimization, and multithreading. J. Comput. Chem. 31, 455–461. doi:10.1002/jcc.21334
UniProt Consortium, T. (2018). UniProt: the universal protein knowledgebase. Nucleic Acids Res. 46, 2699. doi:10.1093/nar/gky092
Viechtbauer, W. (2010). Conducting meta-analyses in R with the metafor package. J. Stat. Softw. 36. doi:10.18637/jss.v036.i03
Vincze, Á. (2023). Endoscopic diagnosis and treatment in gastric cancer: current evidence and new perspectives. Front. Surg. 10, 1122454. doi:10.3389/fsurg.2023.1122454
Waddell, T. S., Chau, I., Barbachano, Y., Gonzalez de Castro, D., Wotherspoon, A., Saffery, C., et al. (2012). A randomized multicenter trial of epirubicin, oxaliplatin, and capecitabine (EOC) plus panitumumab in advanced esophagogastric cancer (REAL3). J. Clin. Oncol. 30, LBA4000. doi:10.1200/jco.2012.30.18_suppl.lba4000
Wang, Q., Wen, Y.-G., Li, D.-P., Xia, J., Zhou, C.-Z., Yan, D.-W., et al. (2012). Upregulated INHBA expression is associated with poor survival in gastric cancer. Med. Oncol. 29, 77–83. doi:10.1007/s12032-010-9766-y
Wang, G., Hu, N., Yang, H. H., Wang, L., Su, H., Wang, C., et al. (2013). Comparison of global gene expression of gastric cardia and noncardia cancers from a high-risk population in China. PLoS One 8, e63826. doi:10.1371/journal.pone.0063826
Wang, J., Ni, Z., Duan, Z., Wang, G., and Li, F. (2014). Altered expression of hypoxia-inducible Factor-1α (HIF-1α) and its regulatory genes in gastric cancer tissues. PLoS One 9, e99835. doi:10.1371/journal.pone.0099835
Wang, Z.-H., Zhu, Z.-T., Xiao, X.-Y., and Sun, J. (2015). Correlation of serum levels of endostatin with tumor stage in gastric cancer: a systematic review and meta-analysis. Biomed. Res. Int. 2015, 1–12. doi:10.1155/2015/623939
Wang, D.-P., Zhao, R., Qi, Y.-H., Shen, J., Hou, J.-Y., Wang, M.-Y., et al. (2021). High expression of Interleukin-2 receptor subunit gamma reveals poor prognosis in human gastric cancer. J. Oncol. 2021, 1–8. doi:10.1155/2021/6670834
Wang, Q., Chen, C., Xu, X., Shu, C., Cao, C., Wang, Z., et al. (2022a). APAF1-Binding long noncoding RNA promotes tumor growth and multidrug resistance in gastric cancer by blocking apoptosome assembly. Adv. Sci. 9, 2201889. doi:10.1002/advs.202201889
Wang, R., Chen, X., Huang, C., Yang, X., He, H., OuYang, C., et al. (2022b). Identification of key genes with prognostic value in gastric cancer by bioinformatics analysis. Front. Genet. 13, 958213. doi:10.3389/fgene.2022.958213
Wang, L., Feng, L., Liu, L., Han, J., Zhang, X., Li, D., et al. (2023). Joint effect of THBS2 and VCAN accelerating the poor prognosis of gastric cancer. Aging 15, 1343–1357. doi:10.18632/aging.204520
Waterhouse, A., Bertoni, M., Bienert, S., Studer, G., Tauriello, G., Gumienny, R., et al. (2018). SWISS-MODEL: homology modelling of protein structures and complexes. Nucleic Acids Res. 46, W296–W303. doi:10.1093/nar/gky427
Wen, X., He, X., Jiao, F., Wang, C., Sun, Y., Ren, X., et al. (2017). Fibroblast activation Protein-α-Positive fibroblasts promote gastric cancer progression and resistance to immune checkpoint blockade. Oncol. Res. Featur. Preclin. Clin. Cancer Ther. 25, 629–640. doi:10.3727/096504016X14768383625385
Wu, X., Hou, S., Ye, Y., and Gao, Z. (2025). CXCR2P1 enhances the response of gastric cancer to PD-1 inhibitors through increasing the immune infiltration of tumors. Front. Immunol. 16, 1545605. doi:10.3389/fimmu.2025.1545605
Yang, Z., Li, C., Yan, C., Li, J., Yan, M., Liu, B., et al. (2019). KIF14 promotes tumor progression and metastasis and is an independent predictor of poor prognosis in human gastric cancer. Biochimica Biophysica Acta (BBA) - Mol. Basis Dis. 1865, 181–192. doi:10.1016/j.bbadis.2018.10.039
Yang, B., Xie, X., Jin, X., Huang, X., He, Y., Yin, K., et al. (2025). Identification and validation of serum MUC17 as a non-invasive early warning biomarker for screening of gastric intraepithelial neoplasia. Transl. Oncol. 51, 102207. doi:10.1016/j.tranon.2024.102207
Yu, G., and He, Q.-Y. (2016). ReactomePA: an R/Bioconductor package for reactome pathway analysis and visualization. Mol. Biosyst. 12, 477–479. doi:10.1039/C5MB00663E
Yu, G., Wang, L.-G., Han, Y., and He, Q.-Y. (2012). clusterProfiler: an R package for comparing biological themes among gene clusters. OMICS 16, 284–287. doi:10.1089/omi.2011.0118
Yu, Z., Wang, Y., Jiang, Y., Ma, S., Zhong, Q., Wan, Y., et al. (2019). NID2 can serve as a potential prognosis prediction biomarker and promotes the invasion and migration of gastric cancer. Pathol. Res. Pract. 215, 152553. doi:10.1016/j.prp.2019.152553
Yu, Z., Rong, Z., Sheng, J., Luo, Z., Zhang, J., Li, T., et al. (2021). Aberrant non-coding RNA expressed in gastric cancer and its diagnostic value. Front. Oncol. 11, 606764. doi:10.3389/fonc.2021.606764
Zhang, X., Ni, Z., Duan, Z., Xin, Z., Wang, H., Tan, J., et al. (2015). Overexpression of E2F mRNAs associated with gastric cancer progression identified by the transcription factor and miRNA Co-Regulatory network analysis. PLoS One 10, e0116979. doi:10.1371/journal.pone.0116979
Zhang, G., Wang, Q., Lu, J., Ma, G., Ge, Y., Chu, H., et al. (2019a). Long non-coding RNA FLJ22763 is involved in the progression and prognosis of gastric cancer. Gene 693, 84–91. doi:10.1016/j.gene.2019.01.028
Zhang, S., Yang, H., Xiang, X., Liu, L., Huang, H., and Tang, G. (2022a). BGN may be a potential prognostic biomarker and associated with immune cell enrichment of gastric cancer. Front. Genet. 13, 765569. doi:10.3389/fgene.2022.765569
Zhang, Y., Liu, W., Feng, W., Wang, X., Lei, T., Chen, Z., et al. (2022b). Identification of 14 differentially-expressed metabolism-related genes as potential targets of gastric cancer by integrated proteomics and transcriptomics. Front. Cell Dev. Biol. 10, 816249. doi:10.3389/fcell.2022.816249
Zhen-Hua, W., Yi-Wei, G., Li-Qin, Z., Jie-Yun, Z., Zhe, G., and Wei-Jian, G. (2020). Silencing of LncRNA C1RL-AS1 suppresses the malignant phenotype in gastric cancer cells via the AKT/β-Catenin/c-Myc pathway. Front. Oncol. 10, 1508. doi:10.3389/fonc.2020.01508
Zhou, J.-F., Bai, C.-M., Wang, Y.-Z., Li, X.-Y., Cheng, Y.-J., and Chen, S.-C. (2011). Endostar combined with chemotherapy for treatment of metastatic colorectal and gastric cancer: a pilot study. Chin. Med. J. Engl. 124, 4299–4303. doi:10.3760/cma.j.issn.0366-6999.2011.24.031
Keywords: gastric cancer, differentially expressed genes, extracellular matrix, molecular docking, therapeutic targets, personalized medicine
Citation: Oli M. MK and Syed Masood JAI (2025) Identification and validation of tumor microenvironment-related therapeutic targets in gastric cancer using integrated multi-omics and molecular docking approaches. Front. Bioinform. 5:1654326. doi: 10.3389/fbinf.2025.1654326
Received: 27 June 2025; Accepted: 27 October 2025;
Published: 10 December 2025.
Edited by:
Paolo Martini, University of Brescia, ItalyReviewed by:
Do Young Hyeon, Boston Children’s Hospital, United StatesMeiqin Zheng, Wenzhou Medical University, China
Copyright © 2025 Oli M. and Syed Masood. This is an open-access article distributed under the terms of the Creative Commons Attribution License (CC BY). The use, distribution or reproduction in other forums is permitted, provided the original author(s) and the copyright owner(s) are credited and that the original publication in this journal is cited, in accordance with accepted academic practice. No use, distribution or reproduction is permitted which does not comply with these terms.
*Correspondence: Jafar Ali Ibrahim Syed Masood, amFmYXJhbGkuc0B2aXQuYWMuaW4=