 Ana Stolnicu
 Peter Eckhardt-Bellmann
 Angelika M. R. Kestler
 Hans A. Kestler
- 1Institute of Medical Systems Biology, Ulm University, Ulm, Germany
- 2Department of Internal Medicine I, Ulm University Hospital, Ulm, Germany
- 3Leibniz Institute on Aging – Fritz Lipmann Institute, Jena, Germany
Introduction: Numerous biological systems exhibit ordinal connections between categories. Developmental and time-series information inherently depict sequences like “early,” “intermediate,” and “late” phases, showing that these specific processes follow a progression. Ordinal classification techniques are often applied in biological and medical contexts, ranging from the evaluation of pain intensity, to the detection of evolving diseases, such as cancer. These ranking systems may assist clinicians in establishing diagnoses and developing tailored treatment plans. For instance, tumor staging might guide early detection strategies and targeted therapies, improving patient outcomes. However, applying ordinal classification to biological data presents considerable challenges. In addition to their high dimensionality, these datasets can be highly heterogeneous, often reflecting branching processes that occur simultaneously during progression. Factors such as intratumoral diversity, asynchronous progress, and context-specific signaling activity may interfere with the identification of such alternative development routes.
Methods: To address these challenges, we propose a framework for uncovering ordinal relationships within molecular data. Specifically, directed threshold classifiers are introduced as base learners for ordinal classifier cascades, enabling the detection of both total and partial orderings between molecular states.
Results: This approach preserves the inherent ordinal structure by projecting high-dimensional data onto one single dimension while simultaneously decreasing complexity. Additionally, the distinct features of the resulting thresholds allow the prediction of potential alternative paths among the suborders.
1 Introduction
Various physiological processes and health conditions naturally follow an ordinal arrangement, in which stages progress hierarchically (Prigogine and Nicolis, 1971). Organizing disease phases into meaningful semantic groups can be a valuable predictive tool in clinical practice (Lee et al., 2004). In oncology, tumor classification aids in prognosis and treatment strategies, guiding the choice of interventions and targeted therapies based on predicted tumor behavior (Beadsmoore and Screaton, 2003; Forner et al., 2014; Cortés et al., 2014). Similarly, categorizing the stages of neurodegenerative disorders, such as Alzheimer’s disease (Sperling et al., 2011; Davis et al., 2018; Tahami Monfared et al., 2022) might facilitate prompt therapeutic decisions and patient monitoring (Scharre, 2019). Pain classification adheres to comparable principles, where pain intensity reported by patients can be arranged into numerical or categorical scales (Hadjistavropoulos and Craig, 2002; Haefeli and Elfering, 2006). These may also be used in anesthesiology and pain management to guide treatment suitability (Breivik et al., 2008). Despite its clinical utility, ordinal classification in biological and medical data presents considerable computational challenges. Molecular datasets, such as gene expression profiles, are not only high-dimensional, consisting of thousands of interrelated features, but also may encode multiple, potentially parallel biological processes, each with its own progression dynamics (Brody, 2009; Wu et al., 2019; Yang et al., 2022; Gerlinger et al., 2012). Additionally, high-throughput data often suffer from noise introduced by experimental variability, batch effects, and underlying biological diversity, which can hinder ordinal relationships and complicate model training (Tu et al., 2002; Goh et al., 2017). Moreover, numerous biological processes lack clear stage transitions, exhibiting overlapped molecular signatures and divergent trajectories, leading to ambiguous classification boundaries and partial ordering of states (Seoane and De Mattos-Arruda, 2014). Further suggesting that these mechanisms could potentially evolve through various parallel pathways (Olschwang et al., 1997; Traverso et al., 2002).
The proposed architecture is tailored for the detection of ordinal structures within one-dimensional data, derived from high-throughput datasets. The categories, i.e., classes, are delineated by thresholds that partition the input space into distinct intervals. An essential aspect of this method is the ability to recreate potential alternative ordinal trajectories from the resulting suborders. This can be accomplished based on the properties of the decision boundaries. As a result, the model can provide a distinct benefit in scenarios in which the ordinal structure may not be strictly predefined, allowing for more nuanced and adaptable classification decisions. However, note that our introduced architecture is designed for the detection of ordinal structures and (parallel) substructures, not for the classification process at hand.
2 Related work
Ordinal classification is a type of supervised learning in which the classes exhibit an intrinsic order that does not necessarily adhere to specific numerical intervals (Frank and Hall, 2001). In contrast to conventional ordinal classification approaches, which typically assume a fixed class order and often fail to capture the optimal ordinal correlations between classes, ordinal classifier cascades (OCCs) (Lattke et al., 2015) decompose the task into a series of simplified binary classification problems. In this framework, a cascade of classifiers is used, where each classifier determines whether a given instance belongs to a specific category or a higher-ranked one. The cascade approach evaluates samples sequentially, attributing a label according to the first classifier that provides a confident prediction. This structure not only streamlines the classification problem at each stage, but also allows the exploration of potential class sequences. In this context, the CASCADES algorithm (Lausser et al., 2019) extends the sequential framework by improving its efficiency, replacing the exhaustive search with exploratory screening of candidate orders. To handle the computational complexity of this search, it employs early rejection criteria based on class-wise sensitivity limits, discarding underperforming cascades prior to complete training. Additionally, binary classifiers in the cascade are trained to distinguish between a class and its successor, enabling pairwise trained classifiers to be stored and reused for different input orders, thus decreasing runtime and minimizing redundant computations. Because the algorithm is independent of the classifier type, allowing the integration of any suitable binary training method, this approach enhances both efficiency and flexibility. Finally, it produces a set of candidate cascades that satisfy the established performance criteria, which can be further evaluated for ensemble integration or downstream model selection.
Formally, in the context of ordinal classification, we are given a set of
The index
In order to guide the selection of the most effective cascades, the class-wise sensitivity serves as primary efficiency criterion for the classifiers. An example of an OCC architecture is depicted in Figure 1.
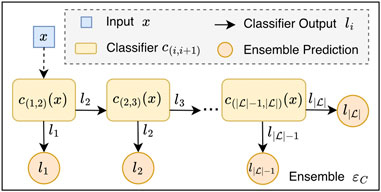
Figure 1. Ordinal classifier cascade (OCC) ensemble. The OCC architecture consists of
Bellmann and Schwenker (2020) proposed another approach for the detection of ordinal class structures, in which it is not necessary to explicitly evaluate all possible class orderings. The idea is to determine the performance (resubstitution accuracy) of linear Support Vector Machines (SVMs) (Vapnik, 2000) for each class pair, i.e.,
Bellmann and Schwenker (2020) further extended their work in (Bellmann et al., 2022). They generalized their working definition of ordinal classification tasks by introducing a theoretical framework which makes it possible to detect ordinal class structures without utilizing any classification model. As an example, they proposed using a multidimensional adaptation of Fisher’s discriminant ratio (Fisher, 1936). Using their framework, they proved that, in general, 3-class classification problems can be regarded as ordinal classification tasks consisting of two edge classes and a class identified as the central one. Note that the authors reduced the detection complexity from evaluating all possible class orderings,
3 Materials and methods
3.1 Directed threshold classifiers
The purpose of the Directed Threshold Classifiers (DTCs) introduced in this work is to recognize ordinal relations within univariate data
The threshold
3.2 Data transformation to one dimension
As univariate data rarely appear in real-world scenarios, the first step of the method involves dimension reduction, for which supervised and non-supervised techniques exist. Principal components analysis (PCA) (Kambhatla and Leen, 1997), Linear discriminant analysis (LDA) (Fisher, 1936), t-distributed stochastic neighbor embedding (t-SNE) (Van der Maaten and Hinton, 2008), and uniform manifold approximation and projection (UMAP) (McInnes and Healy, 2018) are just a few of the numerous applicable methods that can be used. In this section, we provide a different strategy tailored to meet the specific objective of our study. The process is summed up in the following main steps: From the available category set we select a pair of classes,
Note that we prioritized SVM models for the mapping of the high-dimensional data onto one dimension for the following main reasons. First, SVM models are supervised, i.e., classes play an important role during projection. Second, SVMs are deterministic, ensuring reproducibility. In addition, SVM models maximize the margin between the classes of the chosen projection class pair, which we consider to be important when mining for ordinal structures in the one-dimensional space. However, users of our introduced approach can replace the SVM-based projection by any projection of their preferred choice.
Given that the selection of the initial data mapping most likely affects the direction of the DTCs during the overall screening process, a key aspect to take into account is the choice of this class pair. Despite appearing trivial, it is important to notice that the two classes are maintained apart from each other in the classification process. Consequently, the resulting projection is likely to highlight distinctions between these selected classes, potentially overlooking variations or correlations in the other classes. In the experiments reported in this work, we examined every possible pairwise combination. We observed that using the two least related categories in the developmental process described by the dataset, generally produced the most consistent results.
3.3 Alternative progressions
In the cascaded system, both total orders and potential suborders can be identified. When partial configurations emerge, it may be particularly valuable to investigate whether they reflect alternative advancements of the same underlying progression. In this context, the afore described properties of the thresholds can help uncover and characterize competing developmental paths. For suborders to be considered as potential parallel trajectories of the same process, they must share a subset of thresholds. In the following, we formally define the criteria that determine when a threshold qualifies as shared between suborders. Let
where
then
In a wider framework, in which incorrect sample classifications are allowed with a misclassification rate of
Two suborders are required to have a common minimal class sensitivity for each involved class to qualify as viable alternatives, thus left- and right-shared thresholds can be adapted to account for the same amount of misclassifications as outlined below:
This ensures that the decision boundaries retain a consistent level of ambiguity across class transitions. The concept of shared thresholds is illustrated in Figure 2.
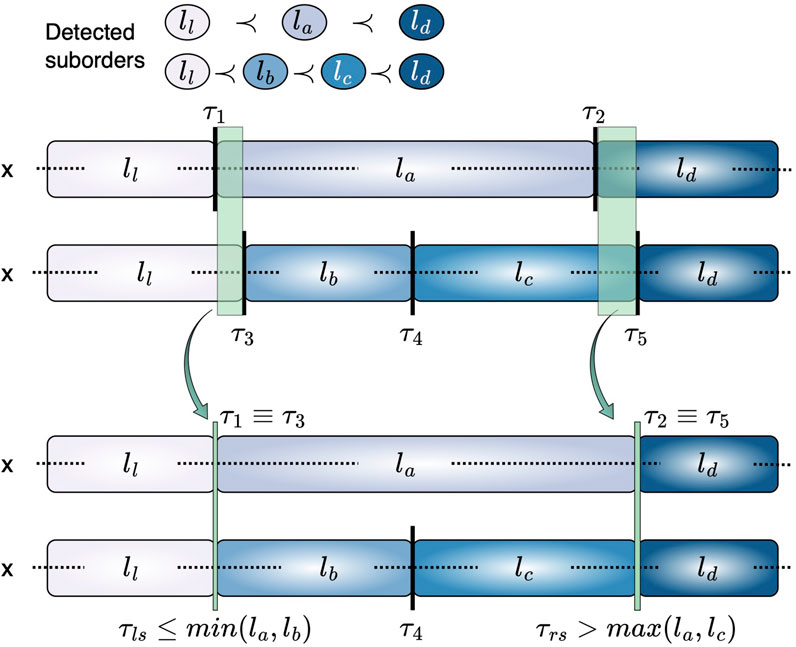
Figure 2. Representation of equivalent thresholds across suborders. For suborders
A visual representation of the designed procedure is provided in Figure 3, beginning with the data projection (A–B), followed by the application of DTCs and the screening procedure to extract ordinal substructures (C–D), and concluding with their aggregation for the retrieval of potential alternative structures (E).
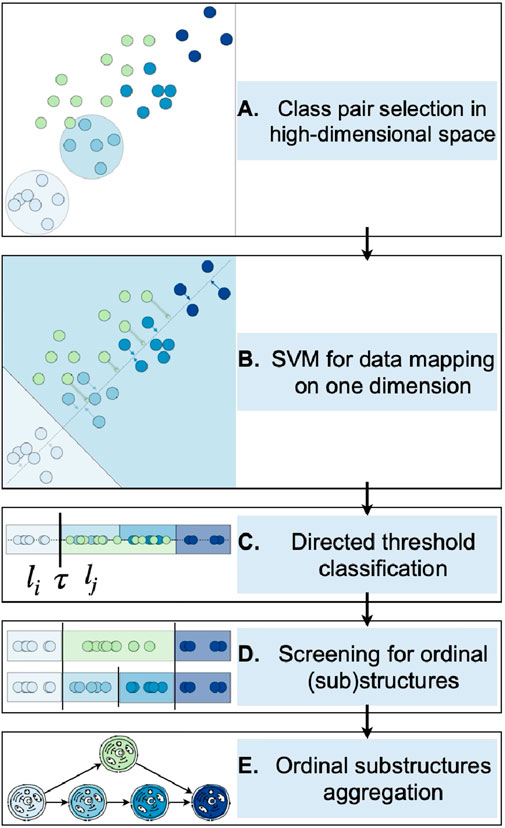
Figure 3. Depiction of the entire process for identifying ordinal structures in molecular high-throughput data. Steps A to B illustrate the data projection, beginning with the selection of a pair of classes (A) on which a binary linear classifier is utilized, followed by the projection of the data onto the boundary’s perpendicular (B). Consequently, the directed threshold classifiers are applied on the one-attribute observations (C). Ordinal patterns are found using an extensive screening procedure by means of ordinal classifier cascades (D) which are subsequently analyzed to ascertain potential alternative trajectories (E).
3.4 Reversed orders
Another feature of this approach lies in the implicit retrieval of inverted suborders. More precisely, for a specific class pair
3.5 Analyzed datasets
The method was initially evaluated using synthetic data comprising 10 distinct categories,
To validate our approach, we used two publicly available developmental datasets from the Gene Expression Omnibus (GEO) (Barrett et al., 2012). The expression measurements of 4028 genes of Drosophila melanogaster (D. melanogaster) (Arbeitman et al., 2002) (included in GEO accession number: GSE4347) were taken at various stages of the fruit fly’s life cycle. The developmental phases can be arranged as
Furthermore, we used two tumor datasets to test our methodology. The pancreatic ductal adenocarcinoma (PDAC) (Buchholz et al., 2005) which includes 21521 gene expression profiles from human microdissected cells, with 38 samples split into 5 classes: normal ductal cells (6 samples), three intermediate pancreatic intraepithelial neoplasia (PanIN), PanIN-1 (6 samples), PanIN-2 (8 samples) and PanIN-3 (10 samples), as well as the metastatic stage (PDAC) (8 samples). This process is assumed to develop according to the sequence normal
For all non-synthetic datasets analyzed in this work, we utilized the normalized versions of the samples provided by the original authors to ensure reproducibility. Details of the normalization procedures can be found in the respective dataset publications (Arbeitman et al., 2002; Toyama et al., 2009; Buchholz et al., 2005; Sadanandam et al., 2015). For the zebrafish dataset (Toyama et al., 2009) we additionally applied a
4 Results
4.1 Synthetic data simulations
Upon considering either dimension of the simulated data, no ordinal arrangement encompassing all classes can be discerned with minimal class sensitivity of 1, as illustrated in Figure 4. To investigate the impact of the data projection on the final outcome, we employed all pair combinations of the categories which is the design of the linear decision boundary. The class pairings that returned orders of length six or five are shown in Figure 5. The suborders are illustrated in a concise graph where overlapping categories, or groups, are shown layered atop each other. For example, in the first graph, the sequence
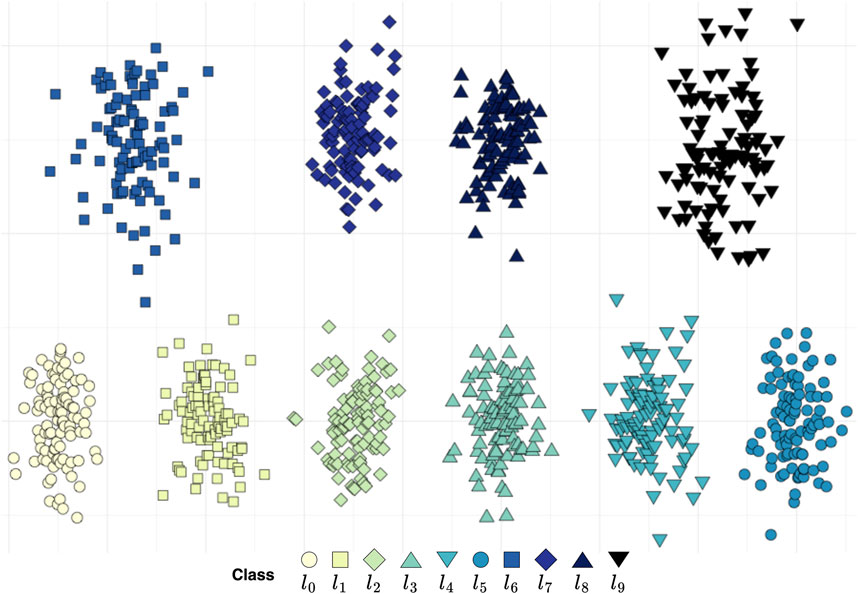
Figure 4. Synthetic two-dimensional data. Within the ten classes, no total order can be found, yet four suborders of length six are present:
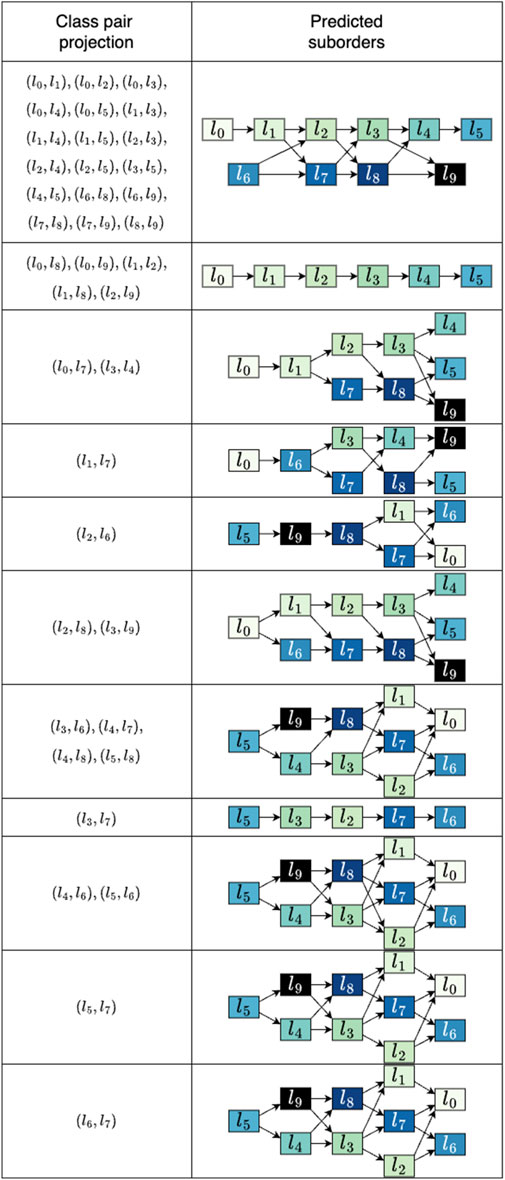
Figure 5. Predicted suborders for the synthetic data. For every outcome the corresponding pairs of classes used to project the data are listed. The resulting suborders are depicted as aggregated graphs where overlapping classes can be seen as alternatives. Only results that produced sequences of lengths six and five are shown. The average runtime for suborder screening across the 45 projections was 0.10 s.
It can be seen that the suborders
4.2 Empirical datasets
We additionally analyzed our approach using the developmental datasets. Alongside the employed projection class pair, Figure 6 presents the outcomes of length four and three achieved for D. melanogaster and of lengths from five to three for D. rerio. After projecting the data based on class pair (embryo, adult), being the first and last stages in the maturation process, our classification strategy accurately provided the fruit fly’s development,
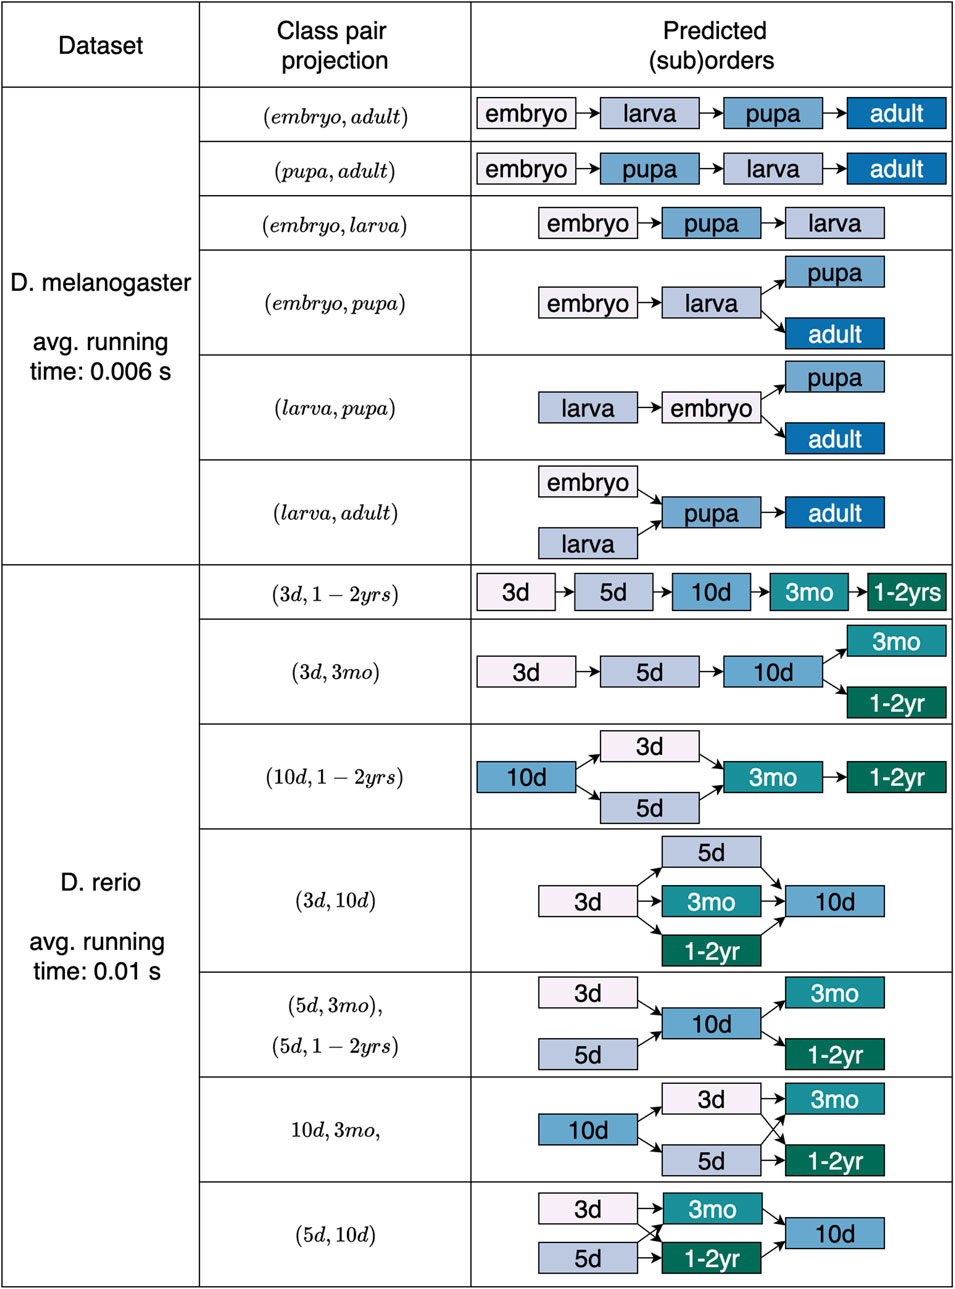
Figure 6. Predicted overall and partial sequences for the two developmental datasets. The projecting class pairs that returned orders either matching the length of the expected order or one element shorter (assumed length
The proposed approach was further applied on the two datasets pertaining pancreatic cancer, the human PDAC and mouse PanNET. The results displayed in Figure 7 were obtained with minimal class-wise sensitivity of 1. Here, we employed projecting pairs that describe remote stages of the process under consideration. The pairs (normal, PDAC), (PanIN-1, PDAC), (normal, PanIN-3) and (PanIN-1, PanIN-3) were examined for PDAC. For PanNET we investigated (NM, MET), (HI, MET), (NM, MLP) and (HI, MLP). Each of these class combinations returned partial orders of length not greater than three for PDAC and not greater than four for PanNET.
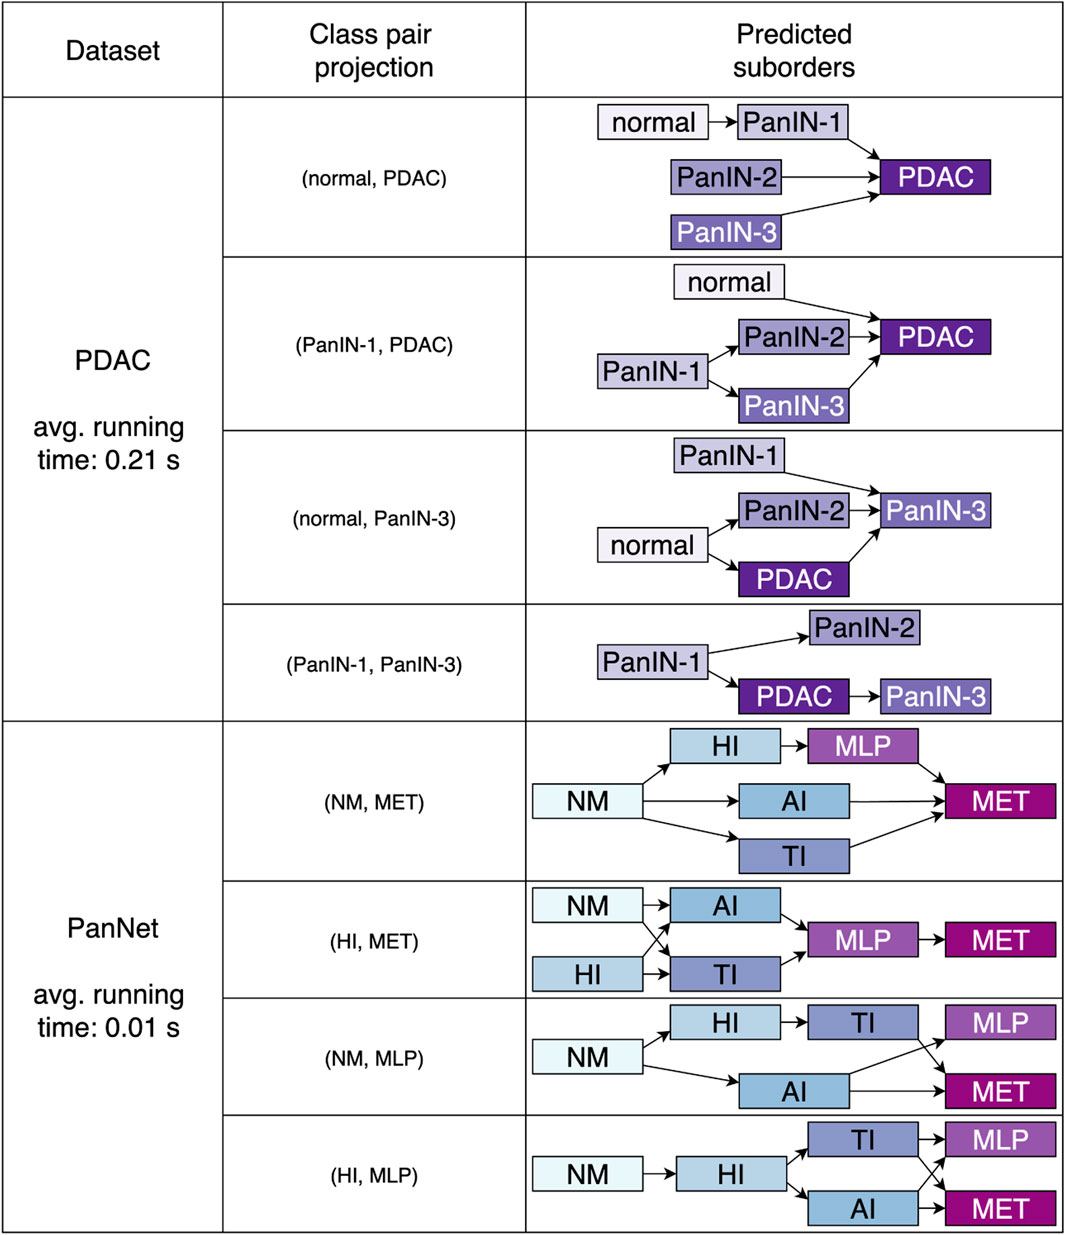
Figure 7. Predicted partial sequences related to pancreatic cancer, namely human PDAC and PanNET derived from the mouse model. In either case, no comprehensive orders of the entire process were predicted. However, we can observe that early phases are located in initial spots, whereas later stages are more distributed in final positions. The average runtime for the detection of suborders in all projections is also stated.
It can be noticed that in both scenarios, no orders, comprising transitions from normal tissue to the metastatic disease, were predicted following a fully continuous or linear sequence. The observed sequences are characterized by gaps, where certain precursor lesions are noticeably absent.
4.3 Validation of detected structures
To validate the ordinal structures and substructures detected by our approach, we also applied the detection method introduced in (Bellmann et al., 2022). Since the method proposed by Bellmann et al. (2022) is limited to detecting total orders, we utilized it as follows. First, the complete datasets were analyzed. Subsequently, we evaluated all data subsets that contained only samples from the classes that constitute the longest substructures detected by our architecture. The evaluation led to the following outcomes.
As with our current approach, for the synthetic dataset, no total order was detected. The longest substructure consisting of six classes was confirmed, which is
The most interesting case was observed for dataset D. melanogaster. While we were able to detect the conventional total structure embryo
In summary, the comparison to the detection method introduced in (Bellmann et al., 2022) validated our detection architecture, emphasizing the benefit that our proposed approach is not limited to the analysis of total orders.
5 Discussion and conclusion
Uncovering ordinal correlations concealed within high-throughput data might significantly enhance our understanding of genetic alterations underlying various biological processes and assist in predicting plausible disease progression. This paper introduces a methodology to retrieve univariate representations from high-throughput datasets and further analyze them using an advanced ordinal classification framework. This approach is especially suitable when examining intricate biological mechanisms concerning, for instance, cancer progressions such as pancreatic ductal adenocarcinomas (PDACs) or pancreatic neuroendocrine tumors (PanNETs). Alongside their unpredictable non-linear progressions, these tumors often exhibit heterogeneous staging among different patients, as well as within an individual (Jones et al., 2008; Raphael et al., 2017; Witkiewicz et al., 2015; Adamo et al., 2017), indicating the likely presence of distinct alternative developmental trajectories. In order to investigate these possibilities we integrate our novel directed threshold classifiers with the existent ordinal classifier cascades. The combination of these two techniques enables the detection of underlying ordinal substructures, which can be further aggregated into partial orders to reveal potential coexisting transition routes.
The approach used for projecting the data into a single-dimensional space plays a critical role in determining the effectiveness of the identified ordinal patterns. Specifically, we observed that selecting biologically distant class pairs for the initial binary separation results in a more pronounced separability of the categories throughout the entire progression. Although the approach could benefit from additional domain expertise concerning the definition of remote stages, it still proves effective, also in its absence. One option to choose an effective projection class pair, without focusing on the biological meaning of the classes, is to conduct an exhaustive search over all possible class pairs and to select the two most distant classes, based on the provided feature space. If the biological order or possible (parallel) suborders are reflected in the provided feature space, the exhaustive search is expected to lead to a meaningful initial projection class pair. Note that, despite choosing a well-founded data transformation to one dimension, ordinal detection may be influenced by class imbalance.
The method was validated on both, synthetic and biological datasets. When applied to the artificially generated dataset, engineered to include multiple suborders, the method accurately recovered all alternative sequences. Furthermore, we successfully rebuilt known linear stage orders in developmental data from Drosophila melanogaster and Danio rerio. These preliminary findings support the suggestion that employing projection pairs describing biologically distant stages in a specific developmental process, may more effectively direct the classifier in recognizing also intermediate phases, unlike using closely related stages that might hide certain transitions. Moreover, the results also prove that the methodology is suitable for detecting overall orders encompassing all classes, as well as suborders within data that lack an underlying total order.
Predicting the staging and progression becomes more challenging when investigating oncological datasets, such as PDACs and PanNETs (Buchholz et al., 2005; Ro et al., 2013; Chan et al., 2018; Mpilla et al., 2020). In these cases, the classifiers failed to recognize a uniform and stepwise course of the diseases from the onset to the ending phase. For the human pancreatic cancer, the pancreatic intraepithelial neoplasia of degree 1 (PanIN-1) as well as dysplasias of degrees 2 (PanIN-2) and 3 (PanIN-3) appear to be followed by PDAC. This observation is consistent with the current literature characterizing pancreatic carcinomas as mostly heterogeneous tumors with a complex evolution, whereby different tumor regions can develop independently of each other (Felsenstein et al., 2018). On the cellular level, PanINs arise from neoplastic transformation of normal cells like ductal, acinar, central acinar and normal stem cells in the exocrine part of the pancreas. Various molecular changes, as well as mutations in different signaling pathways (Hedgehog, Wnt, EGF, Notch and IL-17), contribute to varying degrees to the evolution of PanIN lesions in PDAC with a key role for Notch signalling (Pian et al., 2025). This leads to the formation of many subclonal populations, supporting the hypothesis that some malignancies might not follow a single linear progression model, but rather develop through multiple, parallel evolutionary routes (Notta et al., 2017; Wu et al., 2019). Previous transcriptional profiles analyses revealed a substantial difference between lesions and malignant pancreatic tumors, with the earliest lesions resembling more closely normal tissues (Buchholz et al., 2005). This is also evident in the arrangements that result from our detection technique. The research conducted by Notta et al. (2016) revealed that approximately 65% of PDAC tumors exhibit complex chromosomal rearrangements, including chromothripsis, a phenomenon in which chromosomes massively split and rejoin in a single event (Stephens et al., 2011). Multiple tumor suppressor genes, including TP53, CDKN2A, and SMAD4, can be simultaneously inactivated by this process, leading to rapid development and spread of tumors. These findings further challenge the conventional model of incremental genetic alterations in PDAC progression, suggesting that in some cases, the disease may advance rapidly due to such genomic failures. These molecular insights also align with the sudden onset of an advanced disease and the transition of duct lesions to invasive carcinoma that have been documented in clinical settings of certain patients (Hruban et al., 1999; Al-Sukhni et al., 2012). The observation of patients undergoing yearly magnetic resonance imaging screenings revealed that although imaging could detect small pancreatic tumors and cystic lesions, some participants still developed higher stage PDAC with minimal or no prior symptoms. Pancreatic neuroendocrine tumors can be clinically differentiated into functionally active and inactive types, and further subdivided into well-differentiated and poorly differentiated subgroups. Further subtyping of this clinically heterogeneous tumor entity can be achieved by integrating molecular information that may be relevant to tumor development and progression (Shen et al., 2022). Despite the fact that PDAC and PanNETs are distinct entities, several studies highlight the role of chromatin remodeling and genomic alterations in pancreatic tumorigenesis, showing both similarities and differences between the two (De Wilde et al., 2012; Iacobuzio-Donahue et al., 2012; Jiao et al., 2011).
A valuable foundation for comprehending tumor heterogeneity was provided by examining the RIP1-TAG2 mouse model as a representation of human PanNETs (Sadanandam et al., 2015). The integration of transcriptomic and metabolic profiling across human and mouse models led to the identification of multiple tumor subtypes, each characterized by unique molecular and clinical features. This work reveals concurrent routes of PanNET carcinogenesis, exhibiting distinctive cells of origin that result in tumor islets and metastasis-like primary subtypes, strengthening the concept of non-linear development of these tumor types.
In conclusion, the approach we introduce offers a foundation for examining variability in the development of diseases, effectively unveiling underlying potential ordinal patterns. Additional research into intricate biological and pathological mechanisms, particularly understanding the distinct developmental routes in both PanNETs and PDAC may have significant implications for prognostic evaluations and tailored treatment plans. While the presented outcomes were obtained from relatively small datasets, further research will focus on external validation with larger sample cohorts, together with the analysis of additional technical modifications. An example could be to complement the OCC sensitivity by alternative OC measures, such as the weighted
Data availability statement
The original contributions presented in the study are included in the article/supplementary material, further inquiries can be directed to the corresponding author.
Author contributions
AS: Conceptualization, Data curation, Formal Analysis, Investigation, Methodology, Software, Validation, Visualization, Writing – original draft, Writing – review and editing. PE-B: Formal Analysis, Methodology, Writing – original draft, Writing – review and editing. AK: Writing – review and editing. HK: Conceptualization, Formal Analysis, Funding acquisition, Investigation, Project administration, Resources, Supervision, Writing – original draft, Writing – review and editing.
Funding
The author(s) declare that financial support was received for the research and/or publication of this article. HK acknowledges funding from the German Science Foundation (DFG, SFB 1506, Aging at Interfaces, no. 450627322 and GRK 3012, KEMAI, no. 520750254) and the German Federal Ministry of Education and Research (BMFTR, Medical Informatics Initiative, project Private AIM, no. 01ZZ2316N).
Conflict of interest
The authors declare that the research was conducted in the absence of any commercial or financial relationships that could be construed as a potential conflict of interest.
Generative AI statement
The author(s) declare that no Generative AI was used in the creation of this manuscript.
Any alternative text (alt text) provided alongside figures in this article has been generated by Frontiers with the support of artificial intelligence and reasonable efforts have been made to ensure accuracy, including review by the authors wherever possible. If you identify any issues, please contact us.
Publisher’s note
All claims expressed in this article are solely those of the authors and do not necessarily represent those of their affiliated organizations, or those of the publisher, the editors and the reviewers. Any product that may be evaluated in this article, or claim that may be made by its manufacturer, is not guaranteed or endorsed by the publisher.
References
Adamo, P., Cowley, C. M., Neal, C. P., Mistry, V., Page, K., Dennison, A. R., et al. (2017). Profiling tumour heterogeneity through circulating tumour dna in patients with pancreatic cancer. Oncotarget 8, 87221–87233. doi:10.18632/oncotarget.20250
Al-Sukhni, W., Borgida, A., Rothenmund, H., Holter, S., Semotiuk, K., Grant, R., et al. (2012). Screening for pancreatic cancer in a high-risk cohort: an eight-year experience. J. Gastrointest. Surg. 16, 771–783. doi:10.1007/s11605-011-1781-6
Arbeitman, M. N., Furlong, E. E., Imam, F., Johnson, E., Null, B. H., Baker, B. S., et al. (2002). Gene expression during the life cycle of drosophila melanogaster. Science 297, 2270–2275. doi:10.1126/science.1072152
Barrett, T., Wilhite, S. E., Ledoux, P., Evangelista, C., Kim, I. F., Tomashevsky, M., et al. (2012). NCBI GEO: archive for functional genomics data sets–update. Nucleic Acids Res. 41, D991–D995. doi:10.1093/nar/gks1193
Beadsmoore, C., and Screaton, N. (2003). Classification, staging and prognosis of lung cancer. Eur. J. Radiology 45, 8–17. doi:10.1016/s0720-048x(02)00287-5
Bellmann, P., and Schwenker, F. (2020). Ordinal classification: working definition and detection of ordinal structures. IEEE Access 8, 164380–164391. doi:10.1109/access.2020.3021596
Bellmann, P., Lausser, L., Kestler, H. A., and Schwenker, F. (2022). A theoretical approach to ordinal classification: feature space-based definition and classifier-independent detection of ordinal class structures. Appl. Sci. 12, 1815. doi:10.3390/app12041815
Breivik, H., Borchgrevink, P.-C., Allen, S.-M., Rosseland, L.-A., Romundstad, L., Breivik Hals, E., et al. (2008). Assessment of pain. Br. J. Anaesth. 101, 17–24. doi:10.1093/bja/aen103
Brody, J. (2009). Parallel routes of human carcinoma development: implications of the age-specific incidence data. Nat. Preced. 4, e7053. doi:10.1371/journal.pone.0007053
Buchholz, M., Kestler, H. A., Bauer, A., Böck, W., Rau, B., Leder, G., et al. (2005). Specialized dna arrays for the differentiation of pancreatic tumors. Clin. Cancer Res. 11, 8048–8054. doi:10.1158/1078-0432.ccr-05-1274
Chan, C. S., Laddha, S. V., Lewis, P. W., Koletsky, M. S., Robzyk, K., Da Silva, E., et al. (2018). Atrx, daxx or men1 mutant pancreatic neuroendocrine tumors are a distinct alpha-cell signature subgroup. Nat. Commun. 9, 4158. doi:10.1038/s41467-018-06498-2
Cohen, J. (1968). Weighted kappa: nominal scale agreement provision for scaled disagreement or partial credit. Psychol. Bull. 70, 213–220. doi:10.1037/h0026256
Cortés, J., Calvo, E., Vivancos, A., Perez-Garcia, J., Recio, J. A., and Seoane, J. (2014). New approach to cancer therapy based on a molecularly defined cancer classification. CA a Cancer J. Clin. 64, 70–74. doi:10.3322/caac.21211
Davis, M., O’Connell, T., Johnson, S., Cline, S., Merikle, E., Martenyi, F., et al. (2018). Estimating alzheimer’s disease progression rates from normal cognition through mild cognitive impairment and stages of dementia. Curr. Alzheimer Res. 15, 777–788. doi:10.2174/1567205015666180119092427
De Wilde, R. F., Edil, B. H., Hruban, R. H., and Maitra, A. (2012). Well-differentiated pancreatic neuroendocrine tumors: from genetics to therapy. Nat. Rev. Gastroenterology and Hepatology 9, 199–208. doi:10.1038/nrgastro.2012.9
Felsenstein, M., Hruban, R. H., and Wood, L. D. (2018). New developments in the molecular mechanisms of pancreatic tumorigenesis. Adv. Anatomic pathology 25, 131–142. doi:10.1097/pap.0000000000000172
Fisher, R. A. (1936). The use of multiple measurements in taxonomic problems. Ann. Eugen. 7, 179–188. doi:10.1111/j.1469-1809.1936.tb02137.x
Forner, A., Díaz-González, Á., Liccioni, A., and Vilana, R. (2014). Prognosis prediction and staging. Best Pract. and Res. Clin. Gastroenterology 28, 855–865. doi:10.1016/j.bpg.2014.08.002
Frank, E., and Hall, M. (2001). “A simple approach to ordinal classification,” in Machine learning: ECML 2001: 12th european conference on machine learning Freiburg, Germany, September 5–7, 2001 proceedings 12 (Springer), 145–156.
Gerlinger, M., Rowan, A. J., Horswell, S., Larkin, J., Endesfelder, D., Gronroos, E., et al. (2012). Intratumor heterogeneity and branched evolution revealed by multiregion sequencing. N. Engl. J. Med. 366, 883–892. doi:10.1056/nejmoa1113205
Goh, W. W. B., Wang, W., and Wong, L. (2017). Why batch effects matter in omics data, and how to avoid them. Trends Biotechnol. 35, 498–507. doi:10.1016/j.tibtech.2017.02.012
Hadjistavropoulos, T., and Craig, K. D. (2002). A theoretical framework for understanding self-report and observational measures of pain: a communications model. Behav. Res. Ther. 40, 551–570. doi:10.1016/s0005-7967(01)00072-9
Haefeli, M., and Elfering, A. (2006). Pain assessment. Eur. Spine J. 15, S17–S24. doi:10.1007/s00586-005-1044-x
Hruban, R. H., Wilentz, R., Goggins, M., Offerhaus, G., Yeo, C., and Kern, S. (1999). Pathology of incipient pancreatic cancer. Ann. Oncol. 10, S9–S11. doi:10.1093/annonc/10.suppl_4.s9
Iacobuzio-Donahue, C. A., Velculescu, V. E., Wolfgang, C. L., and Hruban, R. H. (2012). Genetic basis of pancreas cancer development and progression: insights from whole-exome and whole-genome sequencing. Clin. Cancer Res. 18, 4257–4265. doi:10.1158/1078-0432.ccr-12-0315
Jiao, Y., Shi, C., Edil, B. H., De Wilde, R. F., Klimstra, D. S., Maitra, A., et al. (2011). Daxx/atrx, men1, and mtor pathway genes are frequently altered in pancreatic neuroendocrine tumors. Science 331, 1199–1203. doi:10.1126/science.1200609
Jones, S., Zhang, X., Parsons, D. W., Lin, J. C.-H., Leary, R. J., Angenendt, P., et al. (2008). Core signaling pathways in human pancreatic cancers revealed by global genomic analyses. Science 321, 1801–1806. doi:10.1126/science.1164368
Kambhatla, N., and Leen, T. K. (1997). Dimension reduction by local principal component analysis. Neural Comput. 9, 1493–1516. doi:10.1162/neco.1997.9.7.1493
Kendall, M. G. (1938). A new measure of rank correlation. Biometrika 30, 81–93. doi:10.1093/biomet/30.1-2.81
Lattke, R., Lausser, L., Müssel, C., and Kestler, H. A. (2015). “Detecting ordinal class structures,” in Multiple classifier systems: 12Th international workshop, MCS 2015, günzburg, Germany, June 29-July 1, 2015, proceedings 12 (Springer), 100–111.
Lausser, L., Schäfer, L. M., Schirra, L.-R., Szekely, R., Schmid, F., and Kestler, H. A. (2019). Assessing phenotype order in molecular data. Sci. Rep. 9, 11746. doi:10.1038/s41598-019-48150-z
Lausser, L., Schäfer, L. M., Kühlwein, S. D., Kestler, A. M. R., and Kestler, H. A. (2020). Detecting ordinal subcascades. Neural Process. Lett. 52, 2583–2605. doi:10.1007/s11063-020-10362-0
Lee, J.-S., Chu, I.-S., Heo, J., Calvisi, D. F., Sun, Z., Roskams, T., et al. (2004). Classification and prediction of survival in hepatocellular carcinoma by gene expression profiling. Hepatology 40, 667–676. doi:10.1002/hep.20375
McInnes, L., and Healy, J. (2018). UMAP: uniform manifold approximation and projection for dimension reduction. Corr. abs/1802, 03426. doi:10.48550/arXiv.1802.03426
Mpilla, G. B., Philip, P. A., El-Rayes, B., and Azmi, A. S. (2020). Pancreatic neuroendocrine tumors: therapeutic challenges and research limitations. World J. Gastroenterology 26, 4036–4054. doi:10.3748/wjg.v26.i28.4036
Notta, F., Chan-Seng-Yue, M., Lemire, M., Li, Y., Wilson, G. W., Connor, A. A., et al. (2016). A renewed model of pancreatic cancer evolution based on genomic rearrangement patterns. Nature 538, 378–382. doi:10.1038/nature19823
Notta, F., Hahn, S. A., and Real, F. X. (2017). A genetic roadmap of pancreatic cancer: still evolving. Gut 66, 2170–2178. doi:10.1136/gutjnl-2016-313317
Olschwang, S., Hamelin, R., Laurent-Puig, P., Thuille, B., De Rycke, Y., Li, Y.-J., et al. (1997). Alternative genetic pathways in colorectal carcinogenesis. Proc. Natl. Acad. Sci. 94, 12122–12127. doi:10.1073/pnas.94.22.12122
Pian, L.-l., Song, M.-h., Wang, T.-f., Qi, L., Peng, T.-l., and Xie, K.-p. (2025). Identification and analysis of pancreatic intraepithelial neoplasia: opportunities and challenges. Front. Endocrinol. 15, 1401829–1402024. doi:10.3389/fendo.2024.1401829
Prigogine, I., and Nicolis, G. (1971). Biological order, structure and instabilities. Q. Rev. Biophysics 4, 107–148. doi:10.1017/s0033583500000615
Raphael, B. J., Hruban, R. H., Aguirre, A. J., Moffitt, R. A., Yeh, J. J., Stewart, C., et al. (2017). Integrated genomic characterization of pancreatic ductal adenocarcinoma. Cancer Cell 32, 185–203.e13. doi:10.1016/j.ccell.2017.07.007
Ro, C., Chai, W., Victoria, E. Y., and Yu, R. (2013). Pancreatic neuroendocrine tumors: biology, diagnosis,and treatment. Chin. J. Cancer 32, 312–324. doi:10.5732/cjc.012.10295
Sadanandam, A., Wullschleger, S., Lyssiotis, C. A., Grötzinger, C., Barbi, S., Bersani, S., et al. (2015). A cross-species analysis in pancreatic neuroendocrine tumors reveals molecular subtypes with distinctive clinical, metastatic, developmental, and metabolic characteristics. Cancer Discov. 5, 1296–1313. doi:10.1158/2159-8290.cd-15-0068
Scharre, D. W. (2019). Preclinical, prodromal, and dementia stages of alzheimer’s disease. Pract. Neurol. 15, 36–47.
Seoane, J., and De Mattos-Arruda, L. (2014). The challenge of intratumour heterogeneity in precision medicine. J. Intern. Med. 276, 41–51. doi:10.1111/joim.12240
Shen, X., Wang, X., Lu, X., Zhao, Y., and Guan, W. (2022). Molecular biology of pancreatic neuroendocrine tumors: from mechanism to translation. Front. Oncol. 12, 967071–2022. doi:10.3389/fonc.2022.967071
Sperling, R. A., Aisen, P. S., Beckett, L. A., Bennett, D. A., Craft, S., Fagan, A. M., et al. (2011). Toward defining the preclinical stages of alzheimer’s disease: recommendations from the national institute on aging-alzheimer’s association workgroups on diagnostic guidelines for alzheimer’s disease. Alzheimer’s and Dementia 7, 280–292. doi:10.1016/j.jalz.2011.03.003
Stephens, P. J., Greenman, C. D., Fu, B., Yang, F., Bignell, G. R., Mudie, L. J., et al. (2011). Massive genomic rearrangement acquired in a single catastrophic event during cancer development. Cell 144, 27–40. doi:10.1016/j.cell.2010.11.055
Tahami Monfared, A. A., Byrnes, M. J., White, L. A., and Zhang, Q. (2022). Alzheimer’s disease: epidemiology and clinical progression. Neurology Ther. 11, 553–569. doi:10.1007/s40120-022-00338-8
Toyama, R., Chen, X., Jhawar, N., Aamar, E., Epstein, J., Reany, N., et al. (2009). Transcriptome analysis of the zebrafish pineal gland. Dev. Dyn. Official Publ. Am. Assoc. Anatomists 238, 1813–1826. doi:10.1002/dvdy.21988
Traverso, G., Shuber, A., Levin, B., Johnson, C., Olsson, L., Schoetz Jr, D. J., et al. (2002). Detection of apc mutations in fecal dna from patients with colorectal tumors. N. Engl. J. Med. 346, 311–320. doi:10.1056/nejmoa012294
Tu, Y., Stolovitzky, G., and Klein, U. (2002). Quantitative noise analysis for gene expression microarray experiments. Proc. Natl. Acad. Sci. 99, 14031–14036. doi:10.1073/pnas.222164199
Vapnik, V. N. (2000). The nature of statistical learning theory, second edition. Statistics for engineering and information science. Springer.
Witkiewicz, A. K., McMillan, E. A., Balaji, U., Baek, G., Lin, W.-C., Mansour, J., et al. (2015). Whole-exome sequencing of pancreatic cancer defines genetic diversity and therapeutic targets. Nat. Commun. 6, 6744. doi:10.1038/ncomms7744
Wu, R.-C., Wang, P., Lin, S.-F., Zhang, M., Song, Q., Chu, T., et al. (2019). Genomic landscape and evolutionary trajectories of ovarian cancer precursor lesions. J. Pathology 248, 41–50. doi:10.1002/path.5219
Keywords: alternative progression patterns, classifier cascades, directed threshold classifiers, ordinal classification, high-throughput data
Citation: Stolnicu A, Eckhardt-Bellmann P, Kestler AMR and Kestler HA (2025) Identification of ordinal relations and alternative suborders within high-dimensional molecular data. Front. Bioinform. 5:1665892. doi: 10.3389/fbinf.2025.1665892
Received: 14 July 2025; Accepted: 13 October 2025;
Published: 03 November 2025.
Edited by:
Tao Zeng, Guangzhou Labratory, ChinaReviewed by:
Dola Sundeep, Indian Institute of Information Technology Design and Manufacturing, IndiaMichiel Stock, Ghent University, Belgium
Copyright © 2025 Stolnicu, Eckhardt-Bellmann, Kestler and Kestler. This is an open-access article distributed under the terms of the Creative Commons Attribution License (CC BY). The use, distribution or reproduction in other forums is permitted, provided the original author(s) and the copyright owner(s) are credited and that the original publication in this journal is cited, in accordance with accepted academic practice. No use, distribution or reproduction is permitted which does not comply with these terms.
*Correspondence: Hans A. Kestler, aGFucy5rZXN0bGVyQHVuaS11bG0uZGU=
†These authors have contributed equally to this work