 Vladimir N. Uversky
- Department of Molecular Medicine, USF Health Byrd Alzheimer’s Research Institute, Morsani College of Medicine, University of South Florida, Tampa, FL, United States
The discovery of intrinsically disordered proteins (IDPs) (and, therefore, the establishment of the field of protein intrinsic disorder) was initially driven by low-resolution techniques, which overturned the established “lock-and-key” paradigm of structural biology by showing that some proteins exist as a dynamic conformational ensemble rather than a single fixed structure. Though unable to provide atomic-level detail offered by X-ray crystallography or NMR, these methods were the first to reveal that many functional proteins exist as a dynamic ensemble of conformations rather than a single fixed structure. Furthermore, these techniques highlighted a limitation of high-resolution methods such as X-ray crystallography, which often could not resolve disordered regions. Curiously, despite the fact that X-ray crystallography requires rigid, crystalized samples and portrays the proteins as aperiodic crystals, this technique provided some early hints of intrinsic disorder that came from the “missing residues” in X-ray structures. Ultimately, by identifying proteins that lacked stable structures, these initial experiments utilizing low-resolution techniques drove the development of advanced approaches, such as specialized NMR techniques, to better characterize the dynamics of these proteins. The goal of this review is to emphasize the roles of low-resolution structural techniques in establishing the IDP field by showing some illustrative examples of IDPs they helped to discover in the years preceding the formal acceptance of the protein intrinsic disorder concept.
1 Introduction
1.1 The intrinsic disorder phenomenon in a few words
Intrinsically disordered proteins (IDPs) and intrinsically disordered regions (IDRs) do not have unique rigid structures that typically observed in globular proteins/domains. Instead, they exist as dynamic ensembles of conformations, varying at both secondary and tertiary levels (Dunker et al., 1998; Wright and Dyson, 1999; Uversky et al., 2000a; Dunker et al., 2001; Tompa, 2002; Daughdrill et al., 2005; Uversky and Dunker, 2013). Based on their global structural properties at the whole protein/region level, IDPs/IDRs can be broadly categorized as containing collapsed disorder (forming molten globule-like structures) or extended disorder (resembling random coils or pre-molten globules) (Dunker et al., 2001; Uversky, 2003; Daughdrill et al., 2005). Proteins and regions can also exhibit semi-disorder with an approximately equal likelihood of being ordered or disordered (Zhang et al., 2013). These semi-disordered regions are crucial for various physiological and pathological processes, such as protein aggregation and protein-protein interactions, often folding upon binding to other molecules (Zhang et al., 2013).
However, one should keep in mind that with a very few exceptions, a real protein (not necessary an IDP) has a very sophisticated structural organization characterized by an intricate spatiotemporal heterogeneity, akin to a mosaic or a kaleidoscope, encompassing different functional units with various levels of disorderedness: foldons (independently foldable units), inducible foldons (IDRs that fold upon binding partners), inducible morphing foldons (IDRs that fold differently upon binding to different partners), non-foldons (non-folded regions essential for function), semi-foldons (always partially folded), and unfoldons (ordered regions that must unfold to become active) (Uversky, 2013c;a;b;Jakob et al., 2014). This intricate structural diversity, where differently (dis)ordered structural elements might have well-defined and specific functions, enables IDPs/IDRs to perform multiple functions and interact with, regulate, and be regulated by numerous diverse partners (Uversky, 2015b).
Being complex systems with sophisticated structurally and functionally heterogeneous organization, IDPs/IDRs are central to the structure-function continuum concept, demonstrating a shift from the simplistic “one gene-one protein-one function” model to a more complex “one gene-many proteins-many functions” model (Uversky, 2015b; 2016). This is crucial for understanding the proteoform concept (Smith et al., 2013) highlighting the idea that the complexity of biological systems is not solely dictated by their genome size, but rather by the vast and functionally diverse proteome, consisting of a multitude of unique proteoforms derived from a relatively small number of genes (Schluter et al., 2009). This diverse array of proteoforms is generated through several key mechanisms, including genetic variations, alternative splicing that produces different mRNA transcripts, and various post-translational modifications (PTMs) that chemically alter proteins (Uhlen et al., 2005; Farrah et al., 2013; Farrah et al., 2014; Kim et al., 2014; Reddy et al., 2015). Furthermore, IDPs/IDRs are critical contributors to this proteoform diversity, as they further amplify this protein variability through their unique disordered nature (Uversky, 2016).
A brief summary of some key facts about IDPs/IDRs is offered below in a form of short bullets.
• The biological activities of IDPs and IDRs are not dependent on a unique, fixed structure (Dunker et al., 1998; Wright and Dyson, 1999; Uversky et al., 2000a; Dunker et al., 2001; Tompa, 2002; Daughdrill et al., 2005; Uversky and Dunker, 2010).
• IDPs/IDRs are ubiquitous across all known proteomes (Dunker et al., 2000; Dunker et al., 2001; Ward et al., 2004; Uversky, 2010; Uversky and Dunker, 2010).
• The amino acid makeup of IDPs/IDRs is fundamentally different from that of ordered proteins, defining their inability to form stable structure (Dunker et al., 1998; Garner et al., 1998; Uversky et al., 2000a; Dunker et al., 2001; Romero et al., 2001; Williams et al., 2001; Uversky, 2002b; Radivojac et al., 2007; Vacic et al., 2007; Uversky and Dunker, 2010).
• Differences in the amino acid compositions between ordered proteins/domains and IDPs/IDRs allow for the prediction of intrinsic disorder based solely on the primary sequence (He et al., 2009).
• Because of the lack of stable 3D-structures, IDPs can sustain exposure to extremely harsh environmental conditions that would typically denature or unfold ordered proteins and render them dysfunctional (Uversky, 2017b).
• Extended IDPs are characterized by a “turned out” response to heat and changes in pH, where high temperatures or extreme pH values induce their partial folding (Uversky, 2009).
• IDPs and IDRs are structurally highly variable. They exhibit significant structural diversity, varying in compactness, the amount of flexible secondary structure they possess, and the number of tertiary contacts they form (Dunker and Obradovic, 2001; Uversky, 2002b; Daughdrill et al., 2005; Uversky and Dunker, 2010).
• IDPs and IDRs are highly flexible, constantly shifting their conformations (Dunker and Uversky, 2010). However, despite this dynamic nature, their structures can be adequately characterized by a limited collection of relatively stable, low-energy conformations that effectively describe their overall structural preferences (Choy and Forman-Kay, 2001; Huang and Stultz, 2008).
• IDPs and IDRs perform functions that synergize with the roles of ordered proteins and domains (Iakoucheva et al., 2002; Dunker et al., 2005; Uversky et al., 2005).
• IDPs/IDRs serve diverse functions, which can be broadly classified into various overarching groups, such as assemblers, chaperones, display sites, effectors, entropic chains, and scavengers (Tompa, 2002).
• The functions of some IDPs/IDRs, categorized as entropic chain activities, are based solely on the continuous movement of their flexible, random-coil-like polypeptide chains (Dunker et al., 2001).
• IDPs/IDRs rarely exhibit enzymatic catalysis, with a few exceptions where collapsed IDPs show catalytic activity (Uversky et al., 1996; Pervushin et al., 2007; Vamvaca et al., 2008; Woycechowsky et al., 2008).
• The flexible nature of IDPs and IDRs makes them particularly susceptible to a wide range of PTMs (Dunker et al., 2002; Iakoucheva et al., 2004).
• IDPs/IDRs are versatile binders, interacting with a diverse range of targets such as nucleic acids, metal ions, heme groups, other small molecules, proteins, polysaccharides, and membrane bilayers (Uversky et al., 2000a; Dunker et al., 2002).
• The remarkable adaptability of some IDPs and IDRs allows them to specifically interact with multiple partners, even if those partners are structurally dissimilar (Oldfield et al., 2008).
• Many IDPs/IDRs exhibit both one-to-many and many-to-one binding capabilities (Dunker et al., 2005; Uversky et al., 2005).
• IDPs frequently play a central role in protein interaction networks, acting as hubs that connect to many other proteins (Dunker et al., 2005; Uversky et al., 2005).
• Binding to specific partners can induce a disordered-to-ordered transition in IDPs/IDRs (Dyson and Wright, 2002; Oldfield et al., 2005).
• Some IDPs/IDRs can assume different structures upon interaction with different partners (Oldfield et al., 2008).
• IDPs/IDRs exhibit a wide variety of ways of interacting with other molecules, resulting in many unconventional complexes (Uversky, 2011).
• Some IDPs/IDRs bind to other molecules without undergoing a complete or partial folding process, resulting in the formation of dynamic, disordered, or fuzzy complexes (Nash et al., 2001; Mittag et al., 2008; Mittag et al., 2010; Uversky, 2011).
• IDPs/IDRs, with their multifunctionality, binding promiscuity, and binding plasticity, are crucial players in the rapid and well-organized adaptation to changing conditions and in the efficient orchestration of complex cellular responses vital for survival and function (Bondos et al., 2022; Chakrabarti and Chakravarty, 2022; Hsiao, 2024).
• Due to their ability to interact with multiple partners, IDPs/IDRs can act scaffolds that orchestrate activities of partners (Cortese et al., 2008; Buday and Tompa, 2010; Barbar and Nyarko, 2015; Clark et al., 2015).
• Many human diseases are characterized by the involvement of IDPs/IDRs in their pathogenesis (Uversky et al., 2008; Uversky, 2014a;b; Uversky et al., 2014; Uversky, 2022).
• IDPs/IDRs, being complex ‘edge of the chaos’ systems, exhibit emergent behavior through intricate self-organization, meaning they develop unexpected new structures, patterns, and properties (Uversky, 2013c).
• IDPs/IDRs play crucial roles in cellular liquid-liquid phase separation (LLPS) and in the biogenesis of various membraneless organelles (MLOs) and biomolecular condensates (BMCs) (Uversky, 2015b; 2017a;c).
• Being complex systems, IDPs/IDRs exhibit a basic form of “intelligence”, being capable of processing information, adapting to their environment, changing their environment, and showing memory-like behavior (Tripathi et al., 2025).
All these facts clearly emphasize that IDPs/IDRs are blurry or fuzzy subjects by default, and this blurriness/fuzziness is manifested in both structure (manifested by highly dynamic and heterogeneous spatiotemporal organization) and function (displayed by multifunctionality and binding promiscuity). In other words, IDPs/IDRs, with their fuzzy structures and blurry functions, contrast with classic globular proteins with crisp structures and specific functions, thereby challenging the traditional “structure-function paradigm”. Furthermore, due to their intrinsically dynamic nature, IDPs and IDRs do not exhibit a single, well-defined conformation under experimental conditions. This inherent conformational heterogeneity reflected in a “cloud-like” representation of their conformational ensembles poses a significant obstacle to conventional structural determination techniques, as it prevents the resolution of a unique, high-resolution structure. This idea is demonstrated by Figure 1 which compares the NMR solution structures of several IDPs serving as illustrations of the “blurry view” of IDP conformational ensembles from low-resolution methods with the “crisp view” of ordered proteins generated by high-resolution methods, such as X-ay crystallography and NMR. Consequently, a diverse array of advanced experimental methods is required to obtain constraints and gain insights into the ensemble of states sampled by these disordered polypeptide chains (Uversky and Dunker, 2012c; Uversky, 2015a).
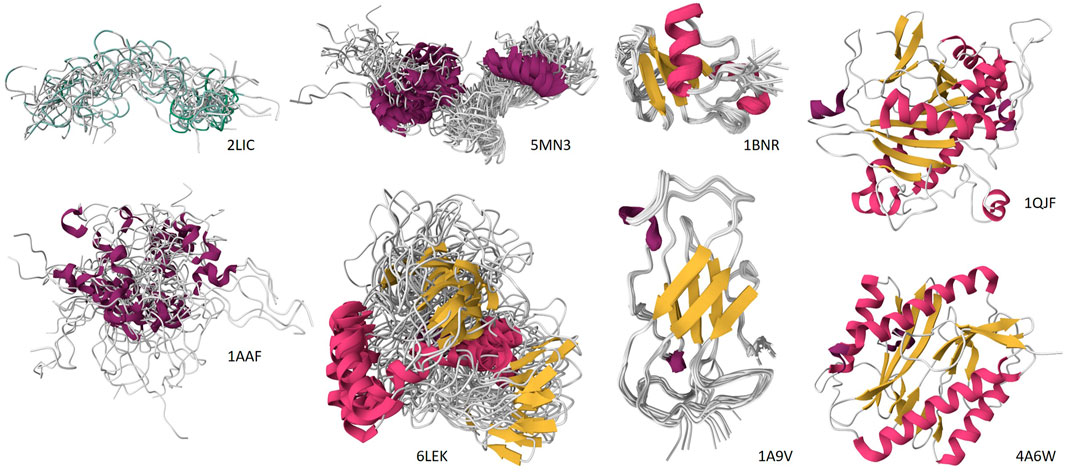
Figure 1. Comparison of the “blurry view” of IDP conformational ensembles from low-resolution methods with the “crisp view” of ordered proteins generated by high-resolution methods, such as X-ay crystallography and NMR. Top row: NMR structure of the polyserine tract of Apis mellifera vitellogenin, residues 358–392 (PDB ID: 2LIC) (Havukainen et al., 2012), NMR structure of the Littorina littorea metallothionein (PDB ID: 5MN3) (Baumann et al., 2017), NMR structure of barnase from Bacillus amyloliquefaciens (PDB ID: 1BNR) (Bycroft et al., 1991), and X-ray crystal structure of isopenicillin N synthase (IPNS) from Emericella nidulans (strain FGSC A4/ATCC 38163/CBS 112.46/NRRL 194/M139) (PDB ID: 1QJF) (Burzlaff et al., 1999). Bottom row: NMR solution structure of the nucleocapsid protein from human immunodeficiency virus type 1 group M subtype B (isolate MN) (PDB ID: 1AAF) (Summers et al., 1992), NMR structure of Megabalanus rosa Cement Protein 20 (PDB ID: 6LEK) (Mohanram et al., 2019), NMR structure of the major house dust mite allergen Der p 2 (PDB ID: 1A9V) (Mueller et al., 1998), and X-ray crystal structure of E. coli methionine aminopeptidase (PDB ID: 4A6W) (Huguet et al., 2012). The corresponding structures are shown exclusively for the illustrative purposes and ar not discussed in the text.
1.2 A multiparametric approach in structural biology
The ultimate goal of structural biology is to obtain information on the structure of a biological macromolecule with the highest possible resolution. Ultra-high resolution structures can provide an unparalleled level of detail, showing individual atoms and their arrangement within the protein molecule, capturing the dynamic nature of proteins and showing their regions with multiple conformations, as well as allowing evaluation of hydrogen bonding and solvent networks. Even for a well-folded protein, achieving this goal is challenging and requires special techniques, such as X-ray crystallography and cryo-electron microscopy. A recently reported 0.70 Å, room-temperature crystal structure of a small globular protein crambin (4.7 kDa) that was refined to an R factor of 0.0591 represents the highest-resolution ambient-temperature structure of a protein achieved to date (Chen et al., 2024). The resolution can be further increased by using crystallography at low temperature. For example, for the same protein crambin, diffraction data were measured to ultra-high resolution (0.54 Å) at low temperature with short-wavelength synchrotron radiation, which is close to a diffraction resolution limit dmin ≈ 0.5 Å (Jelsch et al., 2000). The highest resolution achieved in cryo-EM for protein structure determination is currently 1.25 Å (as reported for apoferritin, which is composed of 24 subunits arranged in a symmetrical structure, with a total molecular mass of 440–480 kDa) (Yip et al., 2020).
Recent breakthroughs in instrumentation and analytical techniques are rapidly pushing both X-ray crystallography and cryo-EM closer to their theoretical diffraction limits. However, in addition to the advanced instrumentation and analytical techniques, the quality and behavior of the biological samples remain crucial for successful structure determination using both methods, with flexibility and conformational dynamics being the usual reasons for decreasing resolution. In X-ray crystallography, protein flexibility can hinder the formation of high-quality crystals with well-ordered structures necessary for high-resolution diffraction. Even if crystals form, internal motions within the protein can lead to averaged electron density maps, blurring out the finer details and limiting the resolution of the determined structure (Hekstra, 2023). In cryo-EM, flexibility and conformational heterogeneity present challenges during image processing. Averaging thousands of particle images with differing conformations can blur the structural details and decrease resolution. This is particularly problematic for symmetric complexes, where flexibility within individual subunits can be difficult to resolve (Suder and Gonen, 2024). Therefore, in both techniques, getting a crisp image of protein structure with high resolution typically requires reduction of protein mobility on multiple time and spatial scales.
It is clear that neither X-ray crystallography nor cryo-EM can obtain a high resolution structure for intrinsically disordered proteins (IDPs) and intrinsically disordered regions (IDRs) because of a very simple reason: unlike ordered, well-folded proteins and domains, IDPs/IDRs do not adopt a single, stable three-dimensional structure.
Protein structural characterization methods all have limitations. As mentioned above, the traditional structural biology techniques X-ray crystallography and cryo-EM are not suitable for the analysis of highly flexible macromolecules existing as rapidly interconverting conformational ensembles.
The highly varied structures and complex, multi-timescale dynamic fluctuations of IDPs make it impossible to characterize their full range of properties with a single experimental or computational technique. A comprehensive understanding requires a multi-pronged approach utilizing various methods (Uversky and Dunker, 2012c; Uversky, 2015a). Just as the compound eyes of insects provide a much wider field of view and excel at detecting rapid movement compared to simpler eyes (Völkel et al., 2003), a multiparametric analysis provides a more comprehensive and dynamic understanding of IDPs. This implies that examining multiple characteristics simultaneously allows researchers to gain insights that would not be possible with a single approach (Uversky and Dunker, 2012c; Uversky, 2015a). A range of biophysical tools, forming a multiparametric approach, were developed to analyze various aspects of a protein’s structure, including its overall shape, folding patterns (secondary structure), temporary interactions (long-range contacts), stability, and how flexible different regions are. As no single technique can reveal the complete picture, to fully understand a protein, it is essential to use multiple techniques that are sensitive to these different structural details simultaneously.
2 Low-resolution techniques in the discovery of IDPs
Although the role of NMR in understanding the dynamic nature of IDPs/IDRs and characterization of their conformational ensembles is undeniable and it “illuminates intrinsic disorder” (Dyson and Wright, 2021), very important information, especially in the early days of the IDP field, was derived using a wide spectrum of low-resolution techniques. Furthermore, these low-resolution techniques were used long before the scientific community fully accepted the concept of biologically active proteins lacking a fixed 3D structure, and were instrumental in laying the groundwork for this vital discovery, played a crucial role in the discovery of the protein intrinsic disorder phenomenon and, later, offered tremendous help with establishing the IDP/IDR field.
Various biophysical techniques suitable for the analysis of the dynamic structures of IDPs/IDRs have been thoroughly explained in comprehensive reviews and books (Daughdrill et al., 2005; Receveur-Brechot et al., 2006; Eliezer, 2009; Jensen et al., 2010; Longhi and Uversky, 2010; Uversky and Dunker, 2012a; Uversky and Dunker, 2012b; Uversky and Dunker, 2012c; Gibbs and Showalter, 2015; Uversky, 2015a; Schramm et al., 2019; Evans et al., 2023; Maiti et al., 2024), and the focus of the present review is on the roles of different low-resolution techniques in the discovery of the protein intrinsic disorder phenomenon. To this end, Figure 2 introduces a timeline of key discoveries linking specific techniques to the acceptance of the IDP concept, whereas Table 1 summarizes information on low-resolution techniques discussed in this review and briefly discusses their physical principles, specific parameters they measure, as well as their advantages and limitations in the context of the IDP analysis.
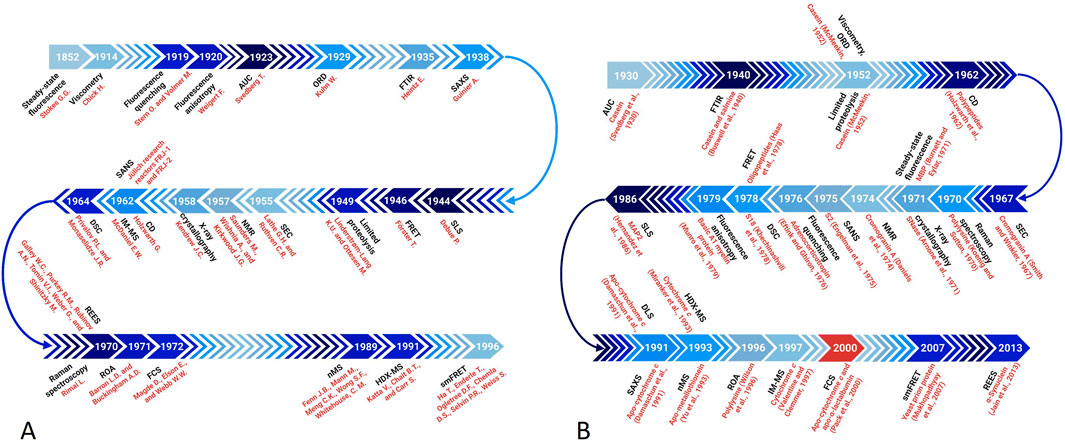
Figure 2. A timeline of key discoveries linking specific techniques to the acceptance of the IDP concept. (A) Timing of the introduction of biophysical techniques. (B) Timing of the first use of these techniques in the IDP analysis.
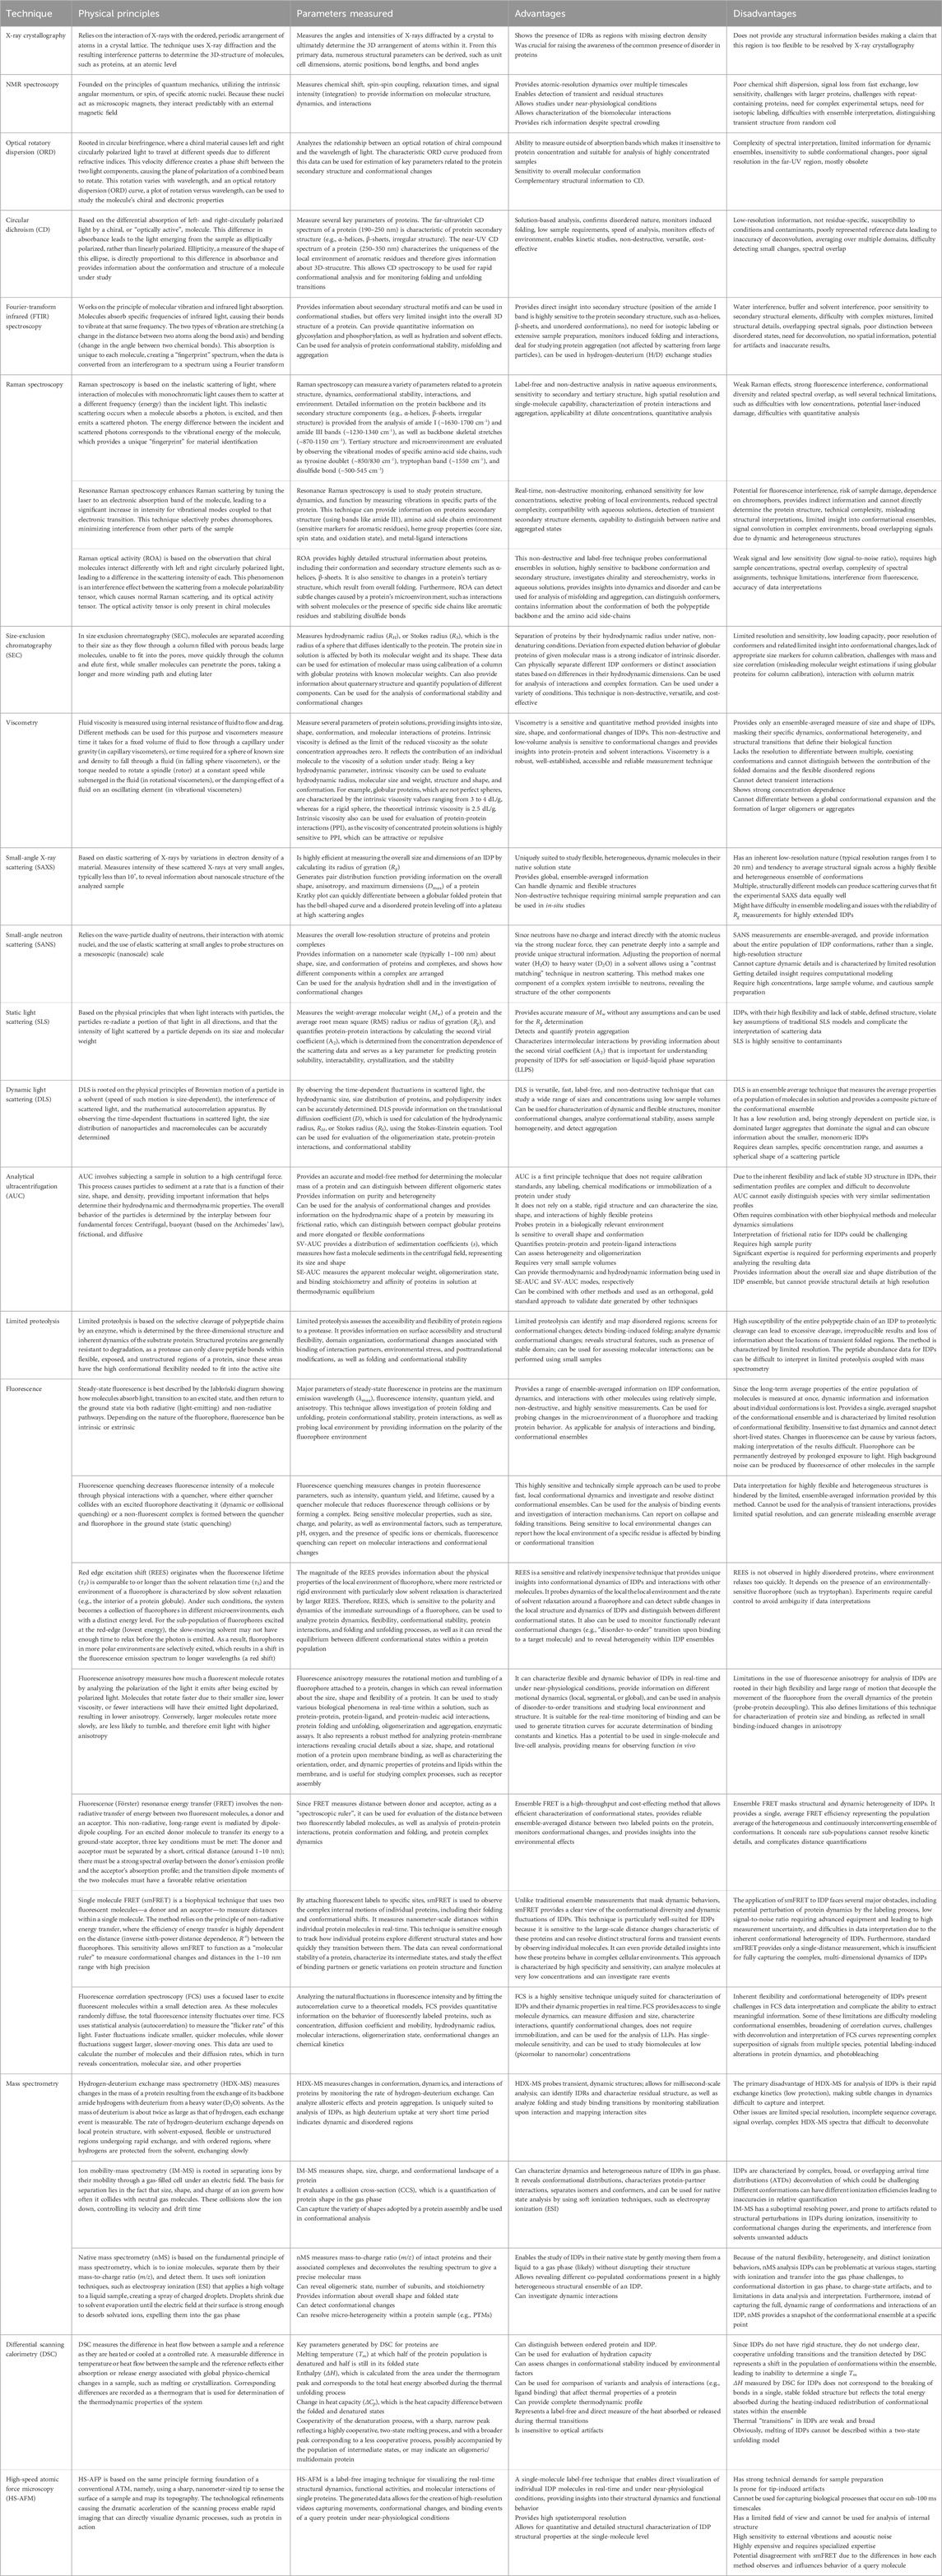
Table 1. Characteristics of low-resolution biophysical techniques contributed to the discovery and initial characterization of IDPs.
2.1 X-ray crystallography on intrinsic disorder: the lowest possible limit of low-resolution data
One should keep in mind that none of the structure-centered experimental approaches of structural biology was specifically designed for the analysis of disorder. In fact, because of the then-dominating “lock-and-key” model of protein action and the associated central paradigm of structural biology stating that a unique 3D structure of a protein determines its function, all techniques for protein analysis were specifically designed for the analysis of the structural properties, conformational behavior, and thermodynamic stability of ordered proteins. Therefore, when using most of these techniques, the information on the presence of intrinsic disorder in a protein was derived from the absence of a signal characteristic for an ordered protein.
The best illustration of this fact is given by X-ray crystallography, which serves as the primary tool for determining the 3D atomic structure of proteins. This technique is rooted in the classical experiments of Walther Otto Ernst Friedrich (1883–1958), Paul Knipping (1883–1935), and Max von Laue (1879–1960), who, in 1912, showed that the X-rays passing through a crystal produced a diffraction pattern on a photographic plate (Friedrich et al., 1912). Interpretation of the X-ray scattering patterns connecting the X-ray wavelength and diffraction angles to the atomic spacing within a crystal and design of the first X-ray spectrometer by William Henry Bragg (1862–1942) and William Lawrence Bragg (1890–1971) have opened a way for determination of crystal structures. These important developments happened long before the X-ray crystallography became a go-to tool for protein structure analysis. In fact, protein crystallography was started by the pioneering work of John Desmond Bernal (1901–1971) and Dorothy Crowfoot Hodgkin (1910–1994), who reported the first X-ray photographs of crystalline pepsin in 1934 (Bernal and Crowfoot, 1934). This study, while not leading to the determination of protein structure, provided crucial evidence that proteins possess a definite, ordered atomic arrangement that could theoretically be decoded. The very first protein crystal structure (myoglobin) was solved in 1958 by John Cowdery Kendrew (1917–1997) and colleagues (Kendrew et al., 1958).
The resolution of the diffraction pattern depends on the degree of order in the crystal, and where the disordered regions are “invisible”, since the flexibility of their atoms results in the non-coherent X-ray scattering, making them regions with missing electron density. Often, these regions with missing electron density correspond to loops, tails, hinges, and linkers of a protein. When protein crystallographers first observed “missing electron density” is not a single, documented event with a specific date because it is inherent to the process of X-ray crystallography, especially when working with biological macromolecules. However, in 1968, missing electron density was reported in the C-terminal residues of hemoglobin, suggesting the presence of flexibility or disorder in this region (Perutz et al., 1968). Already in 1971 [i.e., 13 years after the first crystal structure of a protein, myoglobin, was solved in 1958 (Kendrew et al., 1958), and when only seven protein crystal structures were known (Minor et al., 2016)], a study on the X-ray crystal structure of staphylococcus nuclease first used the term “disordered” to describe two regions of missing electron density (Arnone et al., 1971). Therefore, the initial awareness of disorder in protein crystallography can be traced back to the early 1970s, and it was pointed out early on that many proteins in the Protein Data Bank (PDB) contain regions with missing electron density (Bloomer et al., 1978; Bode et al., 1978).
More recent analyses confirmed the prevalence of regions with missing electron density in protein structures deposited in the PDB (Le Gall et al., 2007; Djinovic-Carugo and Carugo, 2015; DeForte and Uversky, 2016). In one of these studies, it was reported that “more than 80% of the structures refined at a resolution lower than 1.75 Å contain at least one missing string and about 20% of the structures refined at a resolution better than 0.75 Å contain at least one missing string” (Djinovic-Carugo and Carugo, 2015). Clearly, the fact of missing electron density in a region of a protein molecule does not provide any structural information besides making a claim that this region is too flexible to be resolved by X-ray crystallography. Perhaps this represents one of the lowest possible limits of the low-resolution information about disorder. However, one should not take this lack of structural information lightly, as while missing electron density might seem like a simple absence of information, it in fact does offer important insights into the dynamics and function of a protein.
Curiously, in 1984 it was recognized that the actual reasons for the electron density missing from a protein structure can be very different (Bennett and Huber, 1984). In some cases, missing electron density arises from perpetual motion at the backbone level, characterizing dynamic disorder. In other cases, missing electron density corresponds to regions with static disorder that have multiple conformations within the crystal (Bennett and Huber, 1984). Still other regions with missing electron density correspond to domain wobble (a concept introduced by Garner et al., in 1998 (Garner et al., 1998)), i.e., the wholesale movement of a structured domain facilitated by a flexible hinge.
2.2 NMR spectroscopy
Atomic-resolution studies of ordered protein structures have been possible through the use of nuclear magnetic resonance (NMR) since 1957, when the first proton resonance spectrum was reported for a small globular protein, bovine pancreatic ribonuclease (Saunders et al., 1957). Historically, NMR spectroscopy primarily targeted the structure determination of globular proteins with regular secondary structure motifs, following the path laid by X-ray crystallography. And similar to X-crystallography, protein NMR studies prioritized the 3D structure determination, mostly neglecting flexible regions, such as linkers, loops, and sequence termini (Marion, 2013). As a result, the entire protein NMR toolbox has been developed over about 3 decades for applications on folded proteins (Bolik-Coulon et al., 2019). For example, a crucial move toward solving high resolution protein structures by NMR was made in 1976, when the two-dimensional (2D) NMR was introduced by Aue et al. (Aue et al., 1976) followed by the transfer of the 2D NMR analysis to the field of biomolecules by the group of Kurt Wüthrich, who, in 1982, outlined the framework for using NMR to determine protein structures (Wuthrich et al., 1982) followed by actually solving the first protein structure (proteinase inhibitor IIA from bull seminal plasma) by 1H-NMR in 1985 (Williamson et al., 1985; Wüthrich, 1990).
Since the information on molecular conformations in NMR experiments is retrieved from the analysis of the unique chemical shift signals generated by the local environment of each atomic nucleus, and since no stable local environment for chemical groups is present in IDPs/IDRs, NMR spectra of IDPs are different from those of ordered proteins and contain some peculiar characteristics, such as the limited dispersion in proton NMR (Bolik-Coulon et al., 2019). Although it is impossible to pinpoint when an IDP was analyzed by NMR for the first time, it is likely that the recognition of the distinct spectral properties of IDPs/IDRs coincided with the emergence of awareness and research interest in IDPs themselves. In his 1962 survey of the proton magnetic resonance spectra of a number of globular proteins (ribonuclease, bovine serum albumin, insulin, aldolase, myoglobin, chymotrypsin, pepsinogen, and cytochrome c) under various conditions, Arthur Kowalsky reported that although the peaks in the proton NMR spectra of native proteins are broad, they became sharper under various denaturing conditions (Kowalsky, 1962). These observations were further elaborated by McDonald and Phillips, who reported in 1969 that the experimental NMR spectra of many denatured proteins (lysozyme, ribonuclease, pepsin, trypsin, apoferredoxin, apo-flavodoxin, oxytocin, and cytochrome c) were closely matched by the spectra computed by summing the spectra of the equivalent free amino acids, indicating the random coil-like structure of unfolded forms of globular proteins (McDonald and Phillips, 1969; Smith, 1999).
In 1974, the team of R. J. P. Williams reported the results of the 1D 1H-NMR analysis of the intact chromaffin granule of the adrenal gland and isolated from it a mixture of chromogranin proteins (largely chromogranin A) and noted that “the n.m.r. spectrum of these chromogranin proteins is in fact similar to that of the sum of its component amino acids. Its profile is readily recognizable as that of a random coil protein” (Daniels et al., 1974). The fact that the authors recognized the NMR spectrum of a random coil protein indicates that the characteristic features of the random coil spectra were already well-known by that time.
Several reviews were dedicated to the description of how the application of NMR was involved in the discovery and characterization of intrinsic disorder (Mittag and Forman-Kay, 2007; Marsh et al., 2012; Kosol et al., 2013; Felli and Pierattelli, 2014; Konrat, 2014; Novacek et al., 2014; Brutscher et al., 2015; Dunker and Oldfield, 2015; Kurzbach et al., 2015; Bolik-Coulon et al., 2019; Dyson and Wright, 2019; 2021; Camacho-Zarco et al., 2022; Shahrajabian and Sun, 2024). While NMR spectroscopy excels at providing high-resolution structural details of IDPs in solution (Daughdrill et al., 2005; Eliezer, 2009; Jensen et al., 2010), it is not without its own drawbacks. Some of these limitations, challenges, and shortcomings include (Uversky and Dunker, 2012c):
• Size constraints: as protein size increases, molecular tumbling becomes slower, leading to shorter spin-spin relaxation times and more complex spectra, making analysis challenging.
• Challenges with sequence redundancy: tandem repeats in IDPs/IDRs can create redundancy in NMR spectra, making it harder to assign specific signals to individual amino acids.
• Limited spectral dispersion: due to the relatively uniform environments experienced by residues within IDPs/IDRs, their NMR spectra often exhibit poor dispersion, hindering the ability to resolve individual signals.
• Dynamics and line broadening: rapid conformational fluctuations within IDPs/IDRs, particularly on the millisecond to microsecond timescale, can lead to significant line broadening in NMR spectra, sometimes preventing direct studies of partially folded intermediates like molten globules.
• Limited global information: NMR primarily focuses on nuclei and their local environments, providing less information about the overall size and shape of IDPs, though some estimations of size can be gleaned from diffusion data derived from line broadening.
Furthermore, other structural biology techniques suggested the existence of IDPs and IDRs before they were actually described by NMR and X-ray crystallography. For example, in their paper reporting the random coil-like appearance of the 1D 1H-NMR spectrum of chromogranin A, Daniels et al. (1974) indicated that physical properties of this protein evaluated in 1967 by a set of biophysical techniques, such as gel-filtration chromatography, viscometry, and optical rotatory dispersion (ORD) have led to the conclusion that chromogranin A has a conformation approaching that of a random-coil polypeptide (Smith and Winkler, 1967).
2.3 Optical rotatory dispersion (ORD) spectroscopy
Optical Rotatory Dispersion (ORD) is one of the unique spectroscopic techniques that can be used for the analysis of molecule stereochemistry and explore the world of chiral molecules and their unique properties (Djerassi, 1960). ORD measures the wavelength dependence of the optical rotation (i.e., the rotation of the plane of polarization of light when it passes through a chiral substance), which, in relation to proteins, can be used for evaluation of protein secondary structure (Jirgensons, 1964). This technique has long pre-history, being observed for the first time in 1811 by François Arago (1786–1853) who noticed that quartz crystals produced colors in sunlight that had passed through two polarizing filters (Arago, 1811). In 1812, Jean-Baptiste Biot (1774–1862) described rotation of the plane of polarized light by a substance and made first observations of ORD; i.e., that optical rotation varied depending on the wavelength (color) of the light (Biot, 1812). Although Werner Kuhn (1899–1963) demonstrated the possibilities of studying molecular structure by ORD in 1929 (Kuhn, 1929), the actual exploration of these possibilities started much later.
In 1952, Thomas LeRoy McMeekin (1900–1979) conducted a systematic ORD-based analysis of milk proteins and established that that the milk protein casein exists in an “unfolded configuration” (McMeekin, 1952). He also noted that “As compared with other proteins, casein is remarkably stable. In solution it may be heated, or treated with organic solvents, specific denaturing agents such as urea and guanidine hydrochloride, and small amounts of acid or alkali without apparent change in properties. In vitro, however, casein is digested with the greatest ease by proteolytic enzymes … Since casein cannot be denatured, it is frequently considered to be already denatured or to have an unfolded structure. Studies of physical properties of casein solutions, such as viscosity and streaming birefringence are consistent with the idea that casein is a long molecule resembling denatured proteins (McMeekin, 1952).
Bruno Jirgensons (1904–1982) was a very noticeable figure in the field of protein ORD, making significant contributions to the development and application of ORD as a technique for investigating the structure of proteins and other macromolecules (Jirgensons, 1964; Jirgensons, 2012). In relation to the subject of this review, it seems that Prof. Jirgensons was one of the first researchers who conducted the biophysical characterization of an intrinsically disordered protein. In fact, in 1958, he reported the results of the analysis of a highly phosphorylated protein from egg yolk, phosvitin (curiously, with more than 90% of its serine amino acids being phosphorylated and with 10% phosphorus content, phosvitin is considered as the most phosphorylated protein in nature (Yilmaz and Agagunduz, 2020)), by viscometry and ORD, and suggested that this protein is characterized by a flexible, disordered structure, which is similar to that of disordered polyglutamate (Jirgensons, 1958).
Poly-L-lysine (polylysine) and poly-L-glutamic acid (polyglutamic acid) have long been used as models for the spectroscopic identification of secondary structure sequences in proteins since, being disordered at neutral pH, they adopt well-defined conformations under certain conditions of temperature and pH (Adler et al., 1973; Yu and Krimm, 1977). In fact, polylysine at alkaline pH and polyglutamic acid at acid pH form α-helical conformations, since under these conditions they have neutral side chains, whereas at high pH and high temperature, polylysine adopts an extended, flat, multistranded β-sheet conformation, and polyglutamic acid forms β-sheet structure at low pH.
In 1965, Bruno Jirgensons and Lubomir S. Hnilica reported that in aqueous solutions, the unfractionated calf-thymus histone and its four main fractions (F1, F2a, F2b and F3) were in the form of disordered chains (Jirgensons and Hnilica, 1965). In 1966 (the manuscript was actually received by the journal on 10 April 1965), Bruno Jirgensons reported a comprehensive analysis of multiple proteins by optical rotatory dispersion (ORD) to classify them according to the conformation of their polypeptide chains (Jirgensons, 1966). Based on the result of this analysis, a database was created which grouped proteins based on their secondary structure and which contained a “disordered” category for some of the proteins (Jirgensons, 1966). Furthermore, some proteins were described as containing ordered secondary structure and some disorder (Jirgensons, 1966). Illustrative examples of the fully disordered proteins in that database are phosvitin and histones in water (Jirgensons, 1966). Jirgensons also indicated that the disordered nature of phosvitin and histones in water is supported by their anomalous behavior during viscosity measurements. One of the conclusions in the 1966 study by Jirgensons reads: “There is no doubt that large portions of the polypeptide chains of all of the proteins are disordered, and that in all cases of proteins which have compact macromolecules (yielding solutions of low viscosity) the disorder is more or less fixed” (Jirgensons, 1966).
2.4 Circular dichroism (CD) spectroscopy
Similar to ORD, circular dichroism (CD) is rooted in the analysis of optical activity, with CD measuring the difference in absorption of left and right circularly polarized light by a chiral molecule. Due to this difference, an elliptically polarized light wave results when a linearly polarized light wave passes through an optically active chiral compound (Rogers et al., 2019). The phenomenon was first observed and named by Aimé Cotton (1869–1951) who, in 1895, reported that certain materials, known as chiral molecules, absorb left- and right-circularly polarized light at different rates (Cotton, 1895). However, the technique and instrumentation for modern CD spectroscopy were developed later (see below).
Although ORD studies of polypeptides and proteins were conducted prior to CD, the dominance of ORD lasted only a few years, as in 1960, a French group presented an innovative approach to measure CD based on the use of a Pockel’s cell as an electro-optic retardation modulator (Grosjean and Legrand, 1960), which in combination with the adoption of the photoelastic modulator in 1966 (Billardon and Badoz, 1966), led to the development of accurate CD instruments. This instrumental breakthrough resulted in the widespread application of CD spectroscopy, making this method one of the major tools in protein structure investigation. Because of the relatively low cost compared to NMR instrumentation and ability to work on a wide range of proteins and under diverse conditions providing a wealth of structural information (such as the secondary and tertiary structures of proteins in solution, as well as details about protein folding, interactions, and conformational changes induced by environmental factors or ligand binding) by using relatively small amounts of protein sample, spectropolrimetry became a very popular technique, and spectropolarimeters are commonly found in many structural biology laboratories.
An advantage of CD in the analysis of protein structure is determined by the ability of this technique to provide complementary structural information from different spectral regions (Kelly et al., 2005). In fact, since the peptide bond acts as the chromophore in the far-UV region (also known as “peptide region”), CD spectra measured in this spectral range are used to characterize protein secondary structure. On the other hand, CD spectra in the near-UV region (also known as “aromatic region”) report on the asymmetry of the environment of aromatic residues and therefore provide information about protein tertiary structure (Kelly et al., 2005; Rogers et al., 2019). Similar to ORD, the shape of the CD spectrum in the peptide region (240 nm and below) is determined by the contributions of different secondary structure elements (with α-helices, β-sheets, β-turns, and unordered/random coil being the most frequently considered structural motifs) and can therefore be used for the estimation of the secondary structure composition of a protein (Kelly et al., 2005; Greenfield, 2006; Whitmore and Wallace, 2008; Rogers et al., 2019). Qualitative analysis of the far-UV CD spectra is based on their decomposition into contributions of various secondary structure elements. The procedure requires CD reference spectra for different types of secondary structure and depends on the crystallographically determined fraction of each secondary structural element present in globular proteins. In their seminal paper published in 1969, Norma J. Greenfield and Gerald D. Fasman (1925–2003), demonstrated how CD spectra could be computationally analyzed to estimate the secondary structural composition of proteins (Greenfield and Fasman, 1969).
Highly disordered proteins can be readily recognized by CD, since they lack any significant organized secondary structure and therefore have a peculiar far-UV CD spectrum resembling that of an unordered polypeptide, with a strong negative band near 200 nm and either a weak negative shoulder or a weak positive maximum near 220 nm (Woody, 2010). The very first descriptions of the far-UV CD spectra of “randomly disordered polypeptides” (which can be served as an oversimplified IDP) can be found in a 1962 paper by George Holzwarth (1937–2024), Walter Bruno Gratzer (1932–2021), and Paul Mead Doty (1920–2011) (Holzwarth et al., 1962), and in follow-up 1965 papers by Holzwarth and Doty (Holzwarth and Doty, 1965) and Léon Velluz (1904–1981) and Michel Legrand (Velluz and Legrand, 1965), who reported corresponding data for the poly-L-glutamic acid and poly-L-lysine at neutral pH.
Phosvitin, with its unique amino acid composition (this protein contains only 15% nonpolar amino acids but has 66% anionic and 17% cationic residues), was expected to behave similarly to highly charged polypeptides, such as polyglutamic acid. In line with this hypothesis, the far-UV CD analysis of this protein reported in 1967 by Serge N. Timasheff (1926–2019), Robert Townend, and Gertrude E. Perlmann (1912–1974) was qualitatively similar to spectra observed with polypeptides in unordered conformation, indicating a mostly disordered nature (Timasheff et al., 1967). In 1972, Earle Stellwagen, Richard Rysavy, and George Babul used far-UV CD spectroscopy as one of the techniques to characterize the structural properties of apo-cytochrome c (Stellwagen et al., 1972). Based on the results of their analysis, the authors concluded that this protein is in a randomly coiled conformation and that the apoprotein retains none of the conformational features of the native holo-protein (Stellwagen et al., 1972). In 1976, Colin Crane-Robinson et al. revealed that in aqueous media, chicken erythrocyte histone H5 is mostly disordered (it is essentially in the form of a flexible random coil) but the N-terminal part of this protein gains globular helical structure in the presence of salts (Crane-Robinson et al., 1976). Importantly, the C-terminal region of this protein (residues 59–197) remains mostly disordered even in the presence of 1 M kF (Crane-Robinson et al., 1976).
In a 1978 study, R. Wade Warrant and Sung-Hou Kim revealed that the protamine molecule is characterized by a random coil conformation in the unbound form, but folds to a structure containing α helices on binding to tRNA (Warrant and Kim, 1978). A monograph published in 1981 by Venyaminov et al. assembled far-UV CD spectra of all the ribosomal proteins from Escherichia coli, many of which showed characteristic features of mostly disordered proteins (Venyaminov et al., 1981). CD was used by Bonora et al. to investigate how various factors, including pH, salt concentration, helix-promoting solvents, and temperature, affect the structure of a protamine, salmine AI (Bonora et al., 1981). This small, basic protein was found to be largely unstructured in water. However, introducing certain counter-ions, particularly perchlorate and the solvent 2-chloroethanol, led to varying degrees of α-helical structure formation (Bonora et al., 1981). Similar behavior was also described for the fowl protamine, galline (Nakano et al., 1989).
This list can be expanded, indicating that the overall importance of far-UV CD for establishing and advancing the IDP field cannot be overstated. Especially in early days of this filed, most of the experimentally validated IDPs were those found using CD. This is reflected, for example, by the fact that in 2002, CD data for more than 100 IDPs were compiled and analyzed, leading to the conclusion that highly disordered proteins can be classified into two groups: coil-like and pre-molten globule-like (Uversky, 2002a). CD continues to be a popular tool for IDP analysis, as evidenced by more than 650 papers published since 1999, where the use of CD in IDP discovery and characterization is discussed. Furthermore, several amendments were introduced to make this approach more accurate while estimating the secondary structure of IDPs (Miles et al., 2023; Nagy et al., 2024).
The first systematic study on IDPs that triggered the interest of the scientific community to these proteins by claiming their abundance was published in 2000 (Uversky et al., 2000a). This study assembled a set of 91 “natively unfolded” proteins (i.e., IDPs with extended disorder, such as native coils and native pre-molten globules), which at physiological conditions have been reported to have the NMR chemical shifts of a random-coil, and/or lack significant ordered secondary structure (as determined by CD or FTIR), and/or show hydrodynamic dimensions close to those typical of an unfolded polypeptide chain (Uversky et al., 2000a). The disorder status of most of the protein in this dataset (72 of 91) was established or confirmed by far-UV CD (Uversky et al., 2000a), indicating crucial importance of this low-resolution technique in the establishing the IDP field.
2.5 Fourier-transform infrared (FTIR) spectroscopy
Infrared (IR) spectroscopy is a method for studying molecules by observing how they absorb infrared light. Since each molecule has a distinct set of vibrating bonds, the absorption pattern, or “fingerprint”, can be used to identify unknown compounds and determine their structure. IR is a powerful tool for analysis of secondary structure and dynamics of proteins. This is primarily done by analyzing the Amide I band (around 1600-1700 cm-1 originating from the C=O stretching and N-H in-phase bending vibration of the amide group), which is sensitive to protein secondary structure due to the variations in hydrogen bonding and dipole-dipole interactions within α-helices, β-sheets, and disordered regions (Sutherland, 1952; Schwaighofer and Lendl, 2023). As a result, different elements of protein secondary structure are characterized by different frequencies of C=O vibrations and absorb in specific sections of the amide I band, which is reflected in the characteristic band maxima and shapes (Sutherland, 1952; Schwaighofer and Lendl, 2023).
The use of IR in protein/polypeptide structure analysis has a long history, with the first spectra of proteins being reported as early as 1935 (Heintz, 1935; Stair and Coblentz, 1935), and in 1940, Buswell et al. analyzed the IR spectra of 16 proteins, including three IDPs, acid casein, rennet casein, and salmine, and pointed out that presence of characteristic bands in the spectra of all the proteins studied suggest the important role that the hydrogen bond plays in protein structure (Buswell et al., 1940). In 1947, S.E. Darmon and Gordon Brims Black McIvor Sutherland (1907–1980) reported the IR spectra of high molecular weight synthetic polypeptides [protein analogs synthesized by Robert Burns Woodward (1917–1979) and Charles H. Schramm (Woodward and Schramm, 1947)] and noted that they showed a noteworthy similarity to a film of denatured keratin (Darmon and Sutherland, 1947). This was a remarkable conclusion, since the actual elements of protein secondary structure were introduced in 1951 by Linus Carl Pauling (1901–1994) and Robert Corey (1897–1971), who predicted the α-helix and β-sheet based on the hydrogen bonding of the protein backbone (Pauling and Corey, 1951), whereas the concept of “secondary structure” itself was formalized by Kaj Ulrik Linderstrøm-Lang (1896–1959) in 1952 (Linderstrøm-Lang, 1952). Structural transitions in a synthetic polypeptide from α-structure to β-structure were shown to be accompanied by the noticeable changes in the C=O frequency (Elliott and Ambrose, 1950), and dramatic changes in the IR spectra were shown to accompany insulin denaturation (Elliott et al., 1950).
Since those early days, the use of infrared spectroscopy to explore the conformation of proteins and polypeptides is well-documented (Sutherland, 1952; Elliott, 1954; Susi, 1972; Cooper and Knutson, 1995; Jackson and Mantsch, 1995; Barth, 2007; Glassford et al., 2013; Lorenz-Fonfria, 2020). The popularity of this approach increased dramatically after introduction of the Fourier-transform infrared spectrometers in 1950s that combined mathematical theory with advancements in optical engineering, followed by further instrumental improvements that made FTIR systems more compact and user-friendly. In the field of protein science alone, this popularity is reflected in almost 36,500 papers on infrared spectroscopy of proteins published between 1949 and 2025.
IR spectroscopy played an important role in establishing the IDR field by providing information on synthetic polypeptides and natural proteins lacking regular structure. Some of the first reports have already been mentioned above. Additional examples of IDPs characterized by IR in years preceding publications of the first systematic study on natively unfolded protein in 2000 (Uversky et al., 2000a) include coil-like structure reported for:
• soluble form of elastin by Mammi et al. (1968),
• the high-mobility-group chromosomal protein HMG 17 by Abercrombie et al. (1978),
• myelin basic protein by Cynthia S. Randall and Zand (1985),
• the chromosomal protein MC1 from the archaebacterium Methanosarcina barkeri by Imbert et al. (1990),
• the heat-stable inhibitor of the cAMP-dependent protein kinase by Thomas et al. (1991),
• Alzheimer’s disease-related tau protein by Schweers et al. (1994),
• non-Aβ component of Alzheimer’s disease amyloid plaque precursor (NACP), now known as α-synuclein by Weinreb et al. (1996),
• the photosystem II manganese-stabilizing protein of the thermophilic cyanobacterium Synechococcus elongates by Sonoyama et al. (1996),
• and αs-casein by Byler and Susi (1986), Bhattacharyya and Das (1999).
This list is likely far from being complete. Although IDPs characterized by IR represented a small fraction of the experimentally characterized “natively unfolded proteins” included in the original study (6 of 91; 6.6%) (Uversky et al., 2000a), the role of this technique in establishing the IDP field is indisputable.
2.6 Raman spectroscopy
Raman spectroscopy is based on the Raman effect discovered in 1928 by Chandrasekara Venkataraman (known as C.V. Raman, 1888–1970) and Kariamanikkam Srinivasa Krishnan (1898–1961) (Raman and Krishnan, 1928) and independently by Grigory V. Landsberg (1890–1957) and Leonid I. Mandelstam (1879–1944), who described this effect also in 1928 as an inelastic combinational scattering of light (Landsberg and Mandelstam, 1928). Since the phenomenon of inelastic light scattering was predicted by Adolf Gustav Stephan Smekal (1895–1959) in 1923 (Smekal, 1923), it has been referred to as the Smekal-Raman-Effekt in older German-language literature (Kohlrausch, 1931). By detecting the frequency shifts from the frequency of the incident light caused by the inelastic scattering of laser light, Raman spectroscopy can produce a unique vibrational “fingerprint” of a protein molecule, which reveals its specific structure and dynamics. This method enables the characterization of individual amino acids, the observation of secondary and tertiary structural elements, the investigation of protein folding and unfolding pathways, and the detection of conformational transitions driven by external influences such as temperature or other molecular binding events. Furthermore, being complementary to CD, Raman spectroscopy is immune to the effects of light scattering, and can therefore be used for the analysis of proteins in micelles and other scattering media (Chi et al., 1998). Although Raman spectroscopy has been used for the analysis of proteins since the 1960s following the invention of the laser [in 1970, Rimai et al. reported the visible resonance Raman spectra of the rhodopsin from frozen bovine retinae (Rimai et al., 1970)], the use of the technique in early days was restricted by the need to use concentrated protein samples of 20–50 mg/mL because of low instrument sensitivity (Tu, 1982; Wen, 2007; Carey, 2012).
The sensitivity and selectivity of this approach are dramatically enhanced by utilizing resonance Raman spectroscopy that uses an excitation wavelength within an analyte absorption band. As a result of selective enhancement of vibrations coupled to the resonant electronic transition, resonance Raman spectroscopy (RR spectroscopy) can achieve up to 108-fold signal enhancement relative to the non-resonance Raman spectroscopy (Jakubek et al., 2018). Another modification of the method is Raman optical activity (ROA) that detects chiral molecules by measuring a small difference in their vibrational Raman scattering intensity when illuminated with right- and left-circularly polarized light (incident circular polarization, ICP) (Zhu et al., 2005). Alternatively, it can measure the small circularly polarized component within the scattered light itself, using a fixed-polarization incident light source (scattered circular polarization, SCP). Being discovered in 1971 by Laurence D. Barron and A. David Buckingham (1930–2021) (Barron and Buckingham, 1971) and discussed in detail in 1973 (Barron et al., 1973), ROA became a powerful tool for the structural analysis of proteins and other biomolecules (Barron et al., 2000; Barron et al., 2004; Zhu et al., 2005).
Since the Raman spectra are dominated by the amide bands of the peptide backbone, similar to ORD and CD, it can be used for the analysis of protein secondary structure by finding correlations between the positions of the amide I and amide III vibrations and fraction of each secondary structural element present in globular proteins determined from X-ray crystal structures (Williams, 1986; Berjot et al., 1987; Miura and Thomas Jr, 1995; Sane et al., 1999; Rygula et al., 2013). In 1970, Jack L. Koenig and Preston Sutton analyzed Raman spectra of poly-L-lysine in both aqueous solution and solid state, and showed that although this homopolymer behaves as a random coil in aqueous solutions, it folds into α-helical structure in solid state (Koenig and Sutton, 1970). In 1971, Ramachandran et al. demonstrated that the polypeptide having the repealing sequence (Tyr-Ala-Glu)n (where n ∼175) was in a helical conformation at low pH and a random coil conformation at high pH (Ramachandran et al., 1971).
Although this tool was successfully used for the analysis of secondary structure in globular proteins, it was pointed out that “extrapolating empirical Raman parameters from globular proteins to natively unfolded proteins will presumably lead to significant errors, as some of the features that necessarily typify globular proteins are not present in natively unfolded proteins” (Maiti et al., 2004). Human α-synuclein, a disordered protein linked to the pathogenesis of Parkinson’s disease and several other neurodegenerative diseases collectively known as synucleinopathies, was likely one of the first IDPs analyzed by Raman spectroscopy (Maiti et al., 2004). Since disordered α-synuclein can be induced to adopt both extensive α-helical and β-sheet conformations, this single protein can be used to characterize features in the Raman spectra that are associated with these secondary structures (Maiti et al., 2004). These observations showed that Raman spectroscopy can be used for the analysis of conformational changes induced in IDPs by environmental cues, as well as for the identification of the conformational constituents of IDPs in their conformational ensembles (Maiti et al., 2004). These authors also analyzed Raman spectra of three other IDPs, phosvitin, α-casein, and β-casein, as well as ionized polyglutamate and polylysine, and showed that a three-component band fitting can characterize their Raman amide I band (Maiti et al., 2004).
ROA is also used in the characterization of secondary structure of proteins and polymers, as illustrated by early studies on α-helical and unordered polylysine (Wilson et al., 1996), polyglutamic acid in α-helical and disordered conformations, bovine α-lactalbumin in native and acid molten globule states, and human immunoglobulin (Hecht et al., 1999). A comprehensive review on the use of ROA in the analysis of solution structure and dynamics of different biomolecules was given by Barron et al. (2000), where it was indicated that ROA can provide important information on the structural organization of IDPs, such as hen phosvitin, rat metallothionein, soybean Bowman–Birk inhibitor, bovine α-casein, and yeast invertase (Barron et al., 2000). An important feature of ROA is that this technique is well-suited to measure the extent of polyproline II (PPII) conformation (Smyth et al., 2001), which could be dominant in unfolded peptides and proteins (Shi et al., 2002).
2.7 Size-exclusion chromatography (SEC)
Size-exclusion chromatography (SEC), also known as gel-filtration or gel-permeation chromatography, is a hydrodynamic technique that separates proteins based on their size and shape. The basic physical principle behind the separation power of this tool is the use of the porous beads with a well-defined range of pore sizes as the stationary phase. When a solution containing molecules (mobile phase) is passed through a column packed with those porous beads (stationary phase), solutes are separated based on their size. Here, molecules that are too large to fit inside any pore of stationary phase only have access to the mobile phase between the beads. Because of their size, these molecules are excluded from the stationary phase and will follow the shortest path through the column. On the other hand, small molecules with hydrodynamic dimensions smaller than the lower limit of the pore size can fit inside all the pores in the beads. They will be drawn in pores by the force of diffusion, where they will stay for a short time and then move out. All these molecules are included into the stationary phase as they have the complete access to all the mobile phase inside and between the beads. As a result, these molecules will have the largest retention on the column, and will therefore elute last during the gel filtration separation. All other molecules with sizes between these two extremes are partially included, as they can fit inside some but not all of the pores in the beads, and therefore possess an intermediate retention on the column and elute between the large (“excluded”) and small (“totally included”) molecules. This range of the pore sizes in the beads defines the fractionation range of a column, and within this range, molecules are eluted in order of decreasing size.
This technique was invented in 1955 by Grant H. Lathe and Colin R. Ruthven who used starch gel as the column matrix to separate substances “on the basis of their molecular weights” (Lathe and Ruthven, 1955; Lathe and Ruthven, 1956). This makes SEC a relatively novel approach in comparison to classical hydrodynamic methods such as viscometry (early work on the viscosity of globulin protein solutions was conducted by Harriette Chick (1875–1977) in 1914 (Chick, 1914; Chick and Lubrzynska, 1914)) and sedimentation [Théodor Svedberg (1884–1971) developed the first analytical ultracentrifuge in 1923 (Svedberg and Nichols, 1923; Svedberg and Rinde, 1924)]. As early as 1959, it was recognized that the SEC-based fractionation of macromolecules is determined by their molecular sizes (Porath and Flodin, 1959). This brought the molecular sieve hypothesis of the gel-forming polymer action to existence. SEC is now considered as a general separation technique, where the size and shape of molecules are the prime separation parameters (Porath, 1968). Therefore, the elution behavior of proteins on SEC column is determined by their Stokes radii rather than by molecular masses (Andrews, 1965; Ackers, 1967; Ackers, 1970; Fish et al., 1970; Corbett and Roche, 1984; Le Maire et al., 1986; Le Maire et al., 1987; Potschka, 1987; Uversky, 1993; Uversky, 1994). One should keep in mind, however, that since the hydrodynamic radii of similarly shaped and chemically similar molecules are proportional to the molecular mass, one can consider SEC as a mass-based separation technique, even though this is not strictly true. Based on these premises, estimation of molecular mass of a globular protein by a column calibrated using a set of globular proteins with known molecular masses is among the most frequent uses of SEC in the protein field.
A protein’s hydrodynamic volume is a key structural feature that changes significantly when the globular protein denatures and unfolds (Tanford, 1968; Uversky, 1993; Uversky, 1994; Uversky, 2003). Therefore, assessing the hydrodynamic dimensions of a protein—whether it is compact, extended, or partially expanded—is essential for accurate classification of its conformation. Therefore, it is not surprising that SEC is broadly used for estimating a molecule’s dimensions and monitoring how these dimensions change under different conditions. For example, it can be used to track the unfolding of globular proteins by observing changes in their retention time, which corresponds to changes in their Stokes radius (Corbett and Roche, 1983; Endo et al., 1983; Corbett and Roche, 1984; Lau et al., 1984; Brems et al., 1985; Uversky, 1993; Uversky, 1994) or by following the appearance of a new elution peak corresponding to some intermediate forms (Corbett and Roche, 1983; Endo et al., 1983; Gupta, 1983; Corbett and Roche, 1984; Withka et al., 1987; Uversky et al., 1992; Uversky, 1993; Uversky, 1994; Uversky and Ptitsyn, 1994; Uversky and Ptitsyn, 1996).
Hydrodynamic dimensions of IDPs can be studied by SEC as well. In fact, due to their lack of compact structure and extended conformations, IDPs are known to migrate faster on an SEC column than globular proteins of similar molecular mass (Uversky et al., 1999; Uversky et al., 2001; Uversky et al., 2002a; Uversky et al., 2002b; Receveur-Brechot et al., 2006). For example, in their 1967 study describing purification and properties of an acidic protein from chromaffin granules of bovine adrenal medulla (chromogranin A), Albert David Smith and Hans Winkler reported that although this protein was shown to have a molecular weight of 77 kDa based on the sedimentation, diffusion, and approach-to-equilibrium measurements, results of chromatography on a Sephadex G-200 column calibrated with globular proteins gave a molecular weight 7 times that given above. Based on the careful analysis of the outputs of several biophysical tools, these authors have made a set of very important conclusions: “…good agreement between the ultracentrifuge and Sephadex experiments was obtained on the assumption that Sephadex chromatography depends on the effective hydrodynamic radii of proteins and not on their molecular weights. The hydrodynamic properties of the protein differed from those of a typical globular protein. Thus the protein had a high intrinsic viscosity, a high frictional ratio and a large effective hydrodynamic volume. The hydrodynamic properties of the protein, but not its molecular weight, were dependent on the ionic strength of the solvent. Increasing the ionic strength caused an increase in the sedimentation and diffusion coefficients, but a decrease in the intrinsic viscosity and in the frictional ratio of the protein… These results are compatible with the protein’s having a conformation approaching that of a random-coil polypeptide, the volume occupied by the molecule being determined by electrostatic repulsion between the excess of negative charges” (Smith and Winkler, 1967).
In 1978, Gilllian A. Nimmo and Philip Cohen reported purification of protein phosphatase inhibitor-1 (PPI-1) from rabbit skeletal muscle utilizing an approach that includes heat treatment at 90 °C as one of the purification steps (Nimmo and Cohen, 1978). Based on the gel-filtration analysis, PPI-1 was shown to have an apparent molecular weight of 60 kDa, which is more than 3 time larger that the molecular weight measured by sedimentation equilibrium centrifugation (19.2 kDa). Based on the observed experimental features (gel-filtration behavior, stability to heating at 100 °C, and amino acid) the authors concluded that PPI-1 possesses little ordered structure (Nimmo and Cohen, 1978). The G-substrate isolated in 1981 by Dana W. Aswad and Paul Greengard from cytosol of rabbit cerebellum was shown to be characterized by an unfolded, nonglobular structure based on its hydrodynamic properties (it has a Stokes radius of 31 Å that corresponds to an apparent molecular mass of 54 kDa, whereas sedimentation analysis showed that the actual molecular weight of this protein is 21.7 kDa), heat stability, and acid solubility (Aswad and Greengard, 1981). In 1996, based on the analysis of the circularly permuted variants of dihydrofolate reductase from E. coli by SEC (among many other biophysical techniques) it was concluded that permuteins, being intrinsically disordered, are characterized by high compactness degree, as evidenced by their Stokes radii exceeding those of globular proteins with the same molecular weight by a factor ∼1.2 (Uversky et al., 1996), which is a characteristic feature of the molten globule-like folding intermediate of globular proteins (Uversky, 1993; Uversky, 1994; Ptitsyn, 1995).
The 2000 survey of the experimentally verified IDPs included 16 proteins, whose extended conformation was evidenced by the abnormal mobility on gel-filtration column (Uversky et al., 2000a), supporting the idea that SEC played an important role in establishing the commonness of IDPs. These proteins are:
• horse heart apocytochrome c (Stellwagen et al., 1972),
• protein phosphatase inhibitor-1 from rabbit skeletal muscle (19.2 kDa by sedimentation and 60.0 kDa by gel-filtration) (Nimmo and Cohen, 1978),
• a dopamine-and adenosine 3’:5′-monophosphate-regulated phosphoprotein from bovine caudate nucleus, DARPP-32 (27.6 kDa by sedimentation and 59 kDa by gel-filtration) (Hemmings et al., 1984),
• bovine cardiac troponin C in the absence of calcium (McCubbin and Kay, 1985), heat-stable microtubule-associated protein MAP2 (Hernandez et al., 1986),
• smooth muscle caldesmon (Lynch et al., 1987),
• brain-specific 14-kDa protein (14 kDa by Sodium Dodecyl Sulfate-polyacrylamide gel electrophoresis (SDS-PAGE) and 57 kDa by gel filtration) (Nakajo et al., 1990),
• carboxyl-terminal transactivation domain of Vmw65 from herpes simplex virus type 1 (11.0 kDa from sedimentation and 55.0 kDa from gel-filtration) (Donaldson and Capone, 1992),
• prothymosin α (Stokes radius is 1.77 larger than those expected for a compactly folded protein consisting of 109 amino acid residues) (Gast et al., 1995),
• chromogranin B (∼100 kDa by SDS-PAGE and 220 kDa by gel-filtration) (Yoo, 1995),
• human topoisomerase I (∼66 kDa by sedimentation and ∼300 kDa by gel-filtration) (Stewart et al., 1996),
• N-terminal domain of human topoisomerase I (198 residues, ∼66 kDa by sedimentation and ∼96 kDa by gel filtration) (Stewart et al., 1996),
• oncoprotein 18 (Op18)/stathmin from fetal calf thymus (17.22 kDa by mass-spectrometry and ∼64 kDa by gel-filtration) (Schubart et al., 1987; Belmont and Mitchison, 1996),
• human cardiac troponin I (Ferrieres et al., 1998), and
• N-terminal domain of the Pf1 gene 5 protein (theoretical mass is 31 kDa vs 53 kDa by gel-filtration) (Bogdarina et al., 1998).
2.8 Viscometry
Viscometry is a technique to measure the viscosity of fluids, which is a resistance of fluid to flow or the internal friction within a fluid that opposes its motion when subjected to stress, such as pouring or stirring. The concept of viscosity has a long history, dating back to the 17th century, when Isaak Newton (1643–1727) provided a qualitative description of viscosity in his 1687 publication Philosophiæ Naturalis Principia Mathematica as “the lack of slipperiness of the parts of the liquid” reflecting internal friction of fluids and developed a formal description of the relation between the shear stress of fluid and its flow rate (Newton, 1687). A formal description of the laminar flow rate of an incompressible, viscous fluid through a cylindrical tube, which is known as the Hagen-Poiseuille equation was independently proposed by Jean Léonard Marie Poiseuille (1797–1869) in 1838 (Poiseuille, 1838) and Gotthilf Heinrich Ludwig Hagen (1797–1884) in 1839 (Hagen, 1839; Sutera and Skalak, 1993). This long historical excursion is concluded by a work of George Gabriel Stokes (1819–1903), who, in 1851, provided a formal description of the force of viscosity on a small sphere moving through a viscous fluid at a low speed in a form now known as Stokes’ law (Stokes, 1851).
The concept of intrinsic viscosity as a measure of the contribution a polymer or macromolecule to the viscosity of a solution, independent of its concentration was introduced in the second half of the 1930s based on works by Elmer O. Kraemer (1898–1943) and William D. Lansing, who used the symbol [η] for limiting the value of
As already indicated, Harriette Chick (1875–1977) was one of the first researchers who started using viscometry for protein analysis. In 1914, she published two papers where viscometry was used to analyze several proteins, including horse serum albumin, ovalbumin (egg-albumin), pseudoglobulin, and euglobulin from horse serum (Chick, 1914; Chick and Lubrzynska, 1914). These studies formed grounds for using the viscosity measurement of proteins as a biochemical tool. In 1916, Emil Hatschek (1869–1944) used viscometry to evaluate how the physical properties of colloids including proteins (albumin and gelatin), such as their hydration and particle volume, affect their viscosity (Hatschek, 1916). In the following year, Svante August Arrhenius (1859–1927) published a paper on the viscosity of colloidal solutions (including proteins), where he used physical chemistry principles to explain how the concentration and denaturation of proteins affect the viscosity of biological fluids (Arrhenius, 1917). In 1926, Moses Kuntz (1887–1978) proposed an empirical formula correlating viscosity of solution and volume of solute (Kunitz, 1926). Wilfrid James Loughlin published two papers in 1932, in which the effect of denaturation on the viscosity of protein solutions was analyzed and demonstrated that the unfolding of proteins increases the viscosity of their solutions, resulting in an increase in protein volume (Loughlin, 1932; Loughlin and Lewis, 1932).
These and many other early experiments that used viscometry to study protein denaturation and unfolding laid the groundwork for understanding intrinsically disordered states by showing that a rigid, compact, globular protein has a small effect on viscosity because it occupies a small hydrodynamic volume (they typically have a low intrinsic viscosity, in the range of 3–4 mL/g, which is independent of protein molecular mass), whereas an unfolded, flexible, or disordered protein adopts a random coil-like conformation, creating a much larger hydrodynamic volume that increases the solution’s viscosity (intrinsic viscosity of unfolded proteins increases with increase in molecular mass). In 1966, based on the viscosity measurements for a set of 12 proteins unfolded in 5–6 M GdmCl, Charles Tanford (1921–2009), Kazuo Kawahara, and Savo Lapanje (1925–1997) concluded that unfolded proteins demonstrate random coil behavior (Tanford et al., 1966).
Since intrinsic viscosity serves as a specific characteristic of the overall size and shape of a protein, and since this parameter can be accurately measured in a relatively straightforward and cost-effective way, viscometry became a rather broadly used method in protein studies, leading to the early observation that some proteins lacked the defined, globular structures in their native states. For example, in 1950, Eugene L. Hess and Aspascia Cobure, while measuring the intrinsic viscosity of mixed proteins, including blood plasma and serum, observed that pathological samples had a higher intrinsic viscosity than normal ones, reflecting the increase in large, flexible proteins such as fibrinogen, α2-globulins, and γ-globulins in the disease states (Hess and Cobure, 1950). In 1952, Thomas LeRoy McMeekin reported that casein is characterized by high viscosity and therefore resembles denatured proteins (McMeekin, 1952). In 1958, based on the viscometric analysis of aforementioned phosvitin, Bruno Jirgensons concluded that this protein is similar to that of disordered polyglutamate, being characterized by a flexible, disordered structure (Jirgensons, 1958). In 1966, Jirgensons pointed out that the anomalous behavior of phosvitin and histones during viscosity measurements reflects their disordered nature in water (Jirgensons, 1966). Based on the viscometry results (among the outputs of several other techniques), Albert David Smith and Hans Winkler concluded that conformation of chromogranin A approaches that of a random-coil polypeptide (Smith and Winkler, 1967). As per results reported by Earle Stellwagen, Richard Rysavy, and George Babul in 1972, apo-cytochrome c intrinsic viscosity of 15.5 mL/g and sedimentation behavior consistent with monomeric protein (Stellwagen et al., 1972).
2.9 Scattering
2.9.1 Small-angle X-ray scattering (SAXS)
Small-angle X-ray scattering (SAXS) was introduced in 1938 by André Guinier (1911–2000), who showed the ability of this technique to produce structural information from the metallic alloys (Guinier, 1938) and developed, together with Peter Joseph William Debye (1884–1966), Otto Kratky (1902–1995), and other scientists, the foundational theory and techniques for small-angle scattering, transforming SAXS into an essential tool for materials science and crystallography. SAXS and its complementary tool small-angle neutron scattering (SANS) are small-angle scattering (SAS) techniques. SAS involves the analysis of scattering patterns obtained at small angles, typically a few degrees. This method provides structural information within a resolution range of 1–25 nm, and it can reveal repeat distances in partially ordered systems up to 150 nm in size.
The first SAXS experiments on proteins were performed in 1950s. These utilized the standard X-ray tubes with low X-ray flux, required long exposure times, and were originally limited to the evaluation of the radius of gyration (Rg) for easily purified proteins such as hemoglobin and ovalbumin (Guinier et al., 1955). A systematic application of this tool to study the biological macromolecules in solution began in the 1960s, as SAXS provided low-resolution structural data on molecular shape and internal features without requiring crystallization (Svergun and Koch, 2003). Currently, SAXS is often used to analyze the structure of a variety of biological objects, such as solutions of biological macromolecules, nanocomposites, alloys, and synthetic polymers (Doniach, 2001; Svergun and Koch, 2003). The development of synchrotron radiation in the 1970s significantly advanced SAXS, transforming it into a powerful and accessible tool in structural biology. Synchrotron light sources provide X-rays with exceptional properties that dramatically improve the speed, quality, and versatility of SAXS experiments compared to traditional laboratory X-ray tubes (Svergun and Koch, 2003).
SAXS measures the scattering of X-rays as they pass through a solution of the protein, delivering low-resolution information about the overall size, shape, and flexibility of the molecule. It can be used for evaluation of the radius of gyration (Rg), maximum dimension (Dmax), distance distribution functions (p(r)), hydrated volume, 3D molecular envelope, and molecular mass (Mr) (Glatter and Kratky, 1982; Svergun and Koch, 2003). The Rg indicates the average root-mean-square distance of the electrons from the center of mass of a protein and thereby provides a measure of overall compactness, with higher Rg values for a protein with a given molecular mass indicating a more elongated or unfolded shape. The Dmax, which is the maximum distance between any two points within the protein, can be obtained by analyzing the pair-wise distance distribution function, p(r) that represents the probability of finding two atoms within a molecule separated by a specific distance and can be derived from the scattering data.
Hydrated volume is a key measurement for estimating a protein’s molecular mass because it accounts for the total volume the protein occupies in a solution, which includes the protein itself and the surrounding layer of associated water molecules. The 3D molecular envelope represents a computationally-generated low-resolution 3D model of the shape of a protein, which is consistent with the scattering data. The Mr of a protein in solution can be accurately determined by SAXS, and conducting SAXS analysis at a range of protein concentrations can be used for evaluation of the self-association equilibria (Glatter and Kratky, 1982; Svergun and Koch, 2003). Furthermore, SAXS offers a unique opportunity to evaluate the globularity of a protein. To this end, the scattering intensity (I(q)) is presented in a form of a Kratky plot (q2I(q), against the scattering vector q) (Heine et al., 1962), which contains characteristic peaks or plateaus indicating the protein conformation (where compact and globular proteins show a bell-shaped peak, whereas extended, random coil peptides (or homopolypeptides) produce a curve that increases at higher scattering angles) (Glatter and Kratky, 1982; Bernado and Svergun, 2012; Kikhney and Svergun, 2015).
Since a SAXS pattern is sensitive to the size, shape, and internal electron density distribution of a scattering molecule, this technique provides important means to measure the change in the overall dimensions of a protein molecule (Glatter and Kratky, 1982). As a result, for decades, SAXS was successfully used for the analysis of intramolecular protein folding (Stamatoff, 1979; Phillips et al., 1988; Tsuruta et al., 1989; Tsuruta et al., 1990; Eliezer et al., 1993; Kataoka et al., 1993; Koide et al., 1999; Segel et al., 1999; Kojima et al., 2000), characterization of various conformational states of globular proteins (Damaschun et al., 1991a; Damaschun et al., 1991b; Eliezer et al., 1995; Konno et al., 1995; Semisotnov et al., 1996; Zhou et al., 1997; Uversky et al., 1998; Gualfetti et al., 1999; Koide et al., 1999), and even analysis of the enzyme behavior, including subtle domain movements (Byer et al., 2023) and structural characterization of chaperones and their complexes (Shi et al., 1996).
SAXS is a rather widely used technique for characterizing IDPs. It is particularly powerful for studying the global dimensions and conformational heterogeneity of IDPs that lack a single, stable 3D structure. The technique can reveal the presence of disordered regions and the flexibility of multidomain proteins by observing characteristics, such as large Rg, expanded distance distribution functions (p(r)), and, for highly disordered proteins, the lack of a characteristic bell-shaped peak in Kratky plot (Bernado and Svergun, 2012).
Among the first SAXS-based studies of disordered proteins was structural characterization of the acid-denatured form of apo-cytochrome c, which was shown to behave as a random coil, being characterized by high Rg (evaluated by SAXS) and Stokes’ radius Rs values (determined by dynamic light scattering), the Rg/Rs ratio of 1.55 typical for a random-coil polymer, and the lack of the peak in the Kratky plot (Damaschun et al., 1991a). Furthermore, it was shown that the Rg of apo-cytochrome c at pH 2.3 strongly depends on the quality of the solvent (Damaschun et al., 1991b).
In a comprehensive SAXS-based study, Semisotnov et al. (1996) compared globular (native and “molten globular”) and non-globular states (unfolded protein and randomly coiled, partially α-helical, and partially β-structural synthetic polypeptides) of several proteins and model polypeptides using Guinier (used for the Rg evaluation) and Kratky plots, as well as analyzed the globularization process in protein folding using the integrated SAXS intensity (Semisotnov et al., 1996). This analysis revealed that the unfolded polypeptides (proteins or synthetic polypeptides) have high Rg values and are invariantly characterized by the lack of a peak in Kratky plot. Furthermore, in synthetic polypeptides, the formation of the intramolecular α-helical elements joined by flexible coils without the formation of a hydrophobic core does not affect the shape and intensity of the SAXS pattern including the shape of the Kratky plot (Semisotnov et al., 1996). It was pointed out that this behavior was in line with the previously reported data for poly (D-glutamic acid) in random coil, helical, and a mixture of helix and coil forms (Muroga et al., 1988). By analyzing different partially folded conformations induced by various anions in the acid-unfolded staphylococcal nuclease using a set of biophysical techniques including SAXS, it was shown that the acid-unfolded and pre-molten globule states of this protein are not globular (their Kratky plots devoid a characteristic peak) (Uversky et al., 1998).
Prothymosin α was likely the first actual IDP characterized by SAXS (Gast et al., 1995; Uversky et al., 1999; Uversky et al., 2000b). It was shown that this protein, which is characterized by a global charge of −54 at neutral pH, is completely unfolded at neutral pH but can gain some helical structure at acidic pH (Gast et al., 1995; Uversky et al., 1999) or in the presence of Zn2+ ions (Uversky et al., 2000b). Acid pH- or Zn2+-induced forms of this protein were classified as pre-molten globules characterized by a dramatic decrease in Rg (from 37.8 ± 0.9 Å at neutral pH to 27.6 ± 0.9 Å at acidic pH or 28.1 ± 0.8 Å at neutral pH in the presence of Zn2+) and lack of globular structure (based on the absence of a bell-shaped peak in the corresponding Kratky plots) (Uversky et al., 1999; Uversky et al., 2000b). Among other IDPs subjected to SAXS analysis in the early 2000s were the members of the human synuclein family, α-synuclein (Uversky et al., 2001) and its mutants associated with the familiar form of Parkinson’s disease (Li J. et al., 2001), as well as β- and γ-synucleins (Uversky et al., 2002a).
Interestingly, introduction and eventual acceptance of IDPs (which do not have unique structure and exist as highly dynamic conformational ensembles) played an important role in the subsequent SAXS developments reflected in the elaboration of approaches for characterization of protein mobility and flexibility by generating realistic ensemble models of unstructured states (Bernado and Svergun, 2012; Kikhney and Svergun, 2015). Among these SAXS-based ensemble-generating approaches are the Ensemble Optimization Method (EOM) (Bernado et al., 2007; Tria et al., 2015), the Minimal Ensemble Search (MES) (Pelikan et al., 2009), Basis-Set Supported SAXS (BSS-SAXS) (Yang et al., 2010), and the Ensemble Refinement of SAXS (EROS) (Rozycki et al., 2011). The logics behind these ensemble-generating methods is based on the assumption that the experimental SAXS profile originates from a number of coexisting conformational states. In these approaches, at the first step, a large set of static random models of various possible conformations of a given protein is computationally generated, from which a sub-ensemble of conformations that collectively describe the experimental profile is selected (Bernado and Svergun, 2012; Kikhney and Svergun, 2015).
Therefore, combined with ensemble modeling, SAXS can help define the range of conformations consistent with experimental data, offering insights into the degree of disorder and compaction within the protein. Furthermore, SAXS is currently efficiently combined with other techniques, such as NMR, to provide a more comprehensive structural picture of flexible systems, such as a tumor suppressor p53 (Wells et al., 2008). For example, one of the commonly used methods, ENSEMBLE, generates ensembles of IDPs that collectively describe SAXS curves in addition of several NMR experimental constrains (Marsh et al., 2007; Marsh and Forman-Kay, 2009).
2.9.2 Small-angle neutron scattering (SANS)
Small-angle neutron scattering (SANS) is another small-angle scattering (SAS) technique that uses neutrons to probe the structure of materials on a mesoscopic scale, typically from 0.5 to 500 nm. The technique was developed in 1960s, with the first specialized SANS diffractometers being developed at the Jülich research center in Germany in the early 1970s (Jacrot, 1976). However, the first experiments on biological samples were conducted in 1969 using less-specialized neutron scattering instruments at early research reactor, with the membrane myelin (Parsons and Akers, 1969), haemoglobin solutions (Schneider et al., 1969), and a myoglobin single crystal (Schoenborn, 1969) being the first such subjects. A key benefit of small-angle neutron scattering (SANS) is its ability to use selective deuteration and contrast variation. By leveraging the significant difference in how hydrogen and deuterium scatter neutrons, researchers can precisely alter the scattering contrast of specific components within a system. This makes it possible to highlight one molecule, such as a protein, against a surrounding solvent or a binding partner.
Not surprisingly, among the first applications of SANS in biology was analysis of the structure of larger complexes, such the nucleosomes (Hjelm et al., 1977; Uberbacher et al., 1983; Hammermann et al., 2000; Sugiyama et al., 2015) or ribosomes (Engelman et al., 1975; Crichton et al., 1977; Laughrea et al., 1978; Osterberg et al., 1980; Malhotra and Harvey, 1994; Svergun et al., 1994; Svergun et al., 1996). For example, based on the analysis of the SANS curves of nucleosomes in various H2O/D2O solvents, the overall organization of this fundamental subunit of chromatin was described as “a spherically averaged structure with most of the histones closely packed into a core of radius 3.2 nm surrounded by a loosely packed DNA-rich shell of 2.0 nm thickness resulting in a particle of 5.2 nm average radius” (Hjelm et al., 1977).
Furthermore, using contrast variation, it was shown that the nucleosome unfolding induced by a decrease in ionic strength represents a complex process, where DNA became partially unfolded below the transition point, whereas only small conformational changes occur in the protein core (Uberbacher et al., 1983). Curiously, in 1975, the analysis of the 30S ribosomal subunit of E. coli, where a specific pair of ribosomal proteins were deuterated (S2-S5, S5-S8, and S3-S7) not only provided information on the distances between the centers of gravity of three protein pairs, but also showed that S5 and S8 were compact and S2 was extended (Engelman et al., 1975).
Although the capability of SANS to selectively analyze a query protein using contrast variation and specific deuterium-labeling seems to be particularly powerful for investigating IDPs within complex, biologically relevant environments that mimic cellular conditions, this method was not broadly applied in IDP analysis until quite recently (Gabel, 2012) and therefore did not contribute much to the establishing of the IDP field. However, since this tool is ideally suited for the analysis of the properties of a protein of interest in the presence of very high concentrations of other macromolecules, especially proteins, SANS is efficiently used for the analysis of the effects of molecular crowding on IDPs (Johansen et al., 2011; Goldenberg and Argyle, 2014; Balu et al., 2016; Moreno et al., 2016; Fagerberg et al., 2020). In the 21st century, hybrid approaches unlocked the full potential of SANS for studying IDPs (Gabel, 2012). This involved integrating SANS data with complementary techniques such as NMR and computational modeling to map an entire structural ensemble of an IDP, as well as utilization of contrast variation, which employs deuteration to selectively visualize specific components within IDP-containing complexes or residue-specific deuterium labeling with the remaining hydrogenated portion contrast matched out (Chen et al., 2023).
2.9.3 Static light scattering (SLS)
Static light scattering (SLS) is a physical chemistry technique for molecular characterization that measures the average intensity of scattered light to determine a weight-average (or absolute) molecular weight Mw and size (radius of gyration, Rg) of a macromolecule, such as a polymer or a protein in solution. The theoretical foundation for SLS was laid by a classic paper published in 1908 by Gustav Mie (1868–1957), where the first mathematically rigorous and complete solution for the scattering of an electromagnetic plane wave by a homogeneous sphere was presented (Mie, 1908). This formalism successfully explained the optical properties of colloidal metal solutions, particularly the different colors seen in suspensions of gold nanoparticles of various sizes (Mie, 1908; Horvath, 2009). In 1944, Peter Debye (1884–1966) published a paper detailing the first measurements of Mw of small polymers using single-angle SLS (Debye, 1944). This work formed the theoretical foundation for applying light scattering to macromolecules. Finally, Bruno Hasbrouck Zimm (1920–2005) further advanced the SLS technology by developing the theory of the angular dependence of light scattering. In 1948, he reported in a single paper both the theoretical basis for a technique that measures the angular dependence of light scattered by large molecules in solution and the design of a new photometer that improved the accuracy of light-scattering measurements at different angles (Zimm, 1948). The method described in that paper is now known as the Zimm plot, which allows determination of Mw, Rg, and second virial coefficient (A2) of a macromolecule in a solution by measuring light scattering across various angles and concentrations.
The very first paper describing the determination of molecular weights of proteins (ovalbumin, amandin, exelsin, and hemocyanin) was published in 1935 by P. Putzeys and Jeanne Brosteaux (Putzeys and Brosteaux, 1935), and in 1941 these authors reported the Mw values for more than 20 proteins (Putzeys and Brosteaux, 1941). These and many other early SLS studies of proteins, including the application of this technique to determine the molecular weights of proteins, were comprehensively summarized in a 1951 paper by Paul Mead Doty (1920–2011) and John Tileston Edsall (1902–2002) (Doty and Edsall, 1951).
The development of goniometers and photometers in the 1950s and the invention of the laser in the 1960s, which provided a monochromatic, well-collimated light source, significantly improved the accuracy and ease of light scattering measurements. Subsequent technological advances included the introduction of online light scattering detection, development of low-angle laser light scattering, and multi-angle laser light scattering (MALS) combined with size-exclusion chromatography (SEC-MALS). All this improved the utility of SLS which became a standard method for the analysis of molecular properties of proteins and protein aggregation (Wyatt, 1993). In 1986, Hernandez et al. conducted a comprehensive multiparametric analysis of microtubule-associated protein 2 (MAP2), with SLS being one of the techniques to show that it was not a compact globular protein, being instead a monomeric, highly elongated, and flexible protein (Hernandez et al., 1986). A clear example of using light scattering to define a protein as disordered prior to the modern understanding of IDPs is given by 1995 study of prothymosin α by Gast et al. (Gast et al., 1995). In 2016, it was emphasized that hundreds of publications have appeared in which SEC-MALS was “employed as a routine tool for quality control during the process of purification or production of a biological macromolecule, i.e., to ensure the homogeneity and lack of aggregation of the source material” (Minton, 2016).
2.9.4 Dynamic light scattering (DLS)
Dynamic light scattering (DLS) (also known as quasi-elastic light scattering, QELS) is another physical chemistry technique for molecular characterization based on the analysis of light scattering. DLS measures the fluctuations in scattered light intensity over time to assess the speed at which particles move due to Brownian motion. This information is then used for evaluation of the translational diffusion coefficient (DT) used via the Stokes-Einstein equation for calculation of the hydrodynamic radius (Rh or RS) of particles in a liquid (which is the effective size of a particle as it moves through a solution, including any associated solvent molecules), finding a distribution of particle sizes within a sample that allows for the calculation of the size distribution/polydispersity index (PDI), as well as providing estimates for the relative amount of mass or number of particles in a given size range.
Conceptually, this method is rooted in the quantitative explanation of Brownian (i.e., the random movement of particles in a fluid) independently provided in 1905, by Albert Einstein (1879–1955) (Einstein, 1905) and in 1906, by Marian von Smoluchowski (1872–1917) (Von Smoluchowski, 1906), who presented what is known now as the Smoluchowski equation, which is a cornerstone of stochastic process theory, that details the time-dependent behavior of the probability density function for a particle experiencing Brownian motion under the influence of both external forces and diffusion. However, despite the theory, measuring Brownian motion to determine particle size remained impractical for several decades due to technological limitations. In fact, it took more than 50 years to transform these ground-breaking theoretical considerations into a practical tool, DLS, which measures the speed of this motion to determine particle size. In 1964, Robert Pecora developed the formalism showing that the diffusion of macromolecules in solution could cause a broadening of the frequency spectrum of scattered light, thereby laying a framework for interpreting experiments on Doppler shifts in light scattering from pure liquids and polymer solutions and indicating that “Doppler shift measurements should yield information about the shape of the polymer molecule, and its translational and rotational diffusion coefficients” and pointing out that “the recently developed optical maser has made such experiments practical” (Pecora, 1964). The validity of this formalism and assumption was experimentally demonstrated by Cummins et al., who were the first to employ the use of a laser (a continuous wave (CW) optical maser) in the study of polymer solutions (Cummins et al., 1964).
The practicality of DLS requires the use of a high-intensity, monochromatic light source creating a reliable scattering signal and is therefore rooted in using lasers, which were invented in late 1960s. Another key component for the efficient analysis of the intensity fluctuations in scattered light was a digital autocorrelator (a means for data analysis), the foundation for which was laid by Eric Jakeman and Edward Roy Pike (1929–2025), who, in 1969, reported a method to analyze the temporal correlation of photon events in light scattering experiments (Jakeman and Pike, 1969). In 1970, the successful application of this method for determination of the diffusion coefficients of haemocyanin at low concentration was reported by Foord et al. (1970), becoming the first experimental study on using intensity fluctuation spectroscopy of scattered laser light in the study of protein solutions. A 2019 review by Anthony Wishard and Bruce C. Gibb provides a more detailed description of a historical background of DLS development, summarizes the strengths and limitations of the technique, introduces data interpretation, and outlines some important features of DLS in the analysis of supramolecular structures (Wishard and Gibb, 2019).
It was also suggested that DLS can be successfully applied to monitor changes in the molecular size of proteins upon their unfolding and refolding (Nicoli and Benedek, 1976; Gast et al., 1986; Damaschun et al., 1991a). Furthermore, DLS was shown to provide useful information on the time-dependent conformational changes taking place during the unfolding-refolding reactions of proteins that proceed with time constants in the range of seconds or minutes (Gast et al., 1992). Combining a stopped-flow system with a dynamic light scattering apparatus allowed for reduction of the time-resolution of the method to the order of 1 s (Gast et al., 1997).
Since SLS and DLS provide complementary information on protein size, shape, and aggregation state, these techniques are commonly used together. In fact, the ratio of the Rg (measured by SLS) to Rh (evaluated by DLS) is known as a shape factor, as it reveals the shape or conformation of a macromolecule. Here, an Rg/Rh value of ∼0.775 is characteristic of a compact, globular protein (sphere), whereas the larger values indicate a less compact or elongated structure, approaching 1.55 for a random-coil polymers (Tanford, 1966; Damaschun et al., 1991a). Changes in Rg and Rh can reflect aggregation or conformational changes, and evaluating the shape factor under different conditions can be used for the analysis of protein stability and folding status. Furthermore, the combined use of SLS and DLS generates a more complete picture than either method alone, especially for complex systems, such as self-associating proteins or proteins forming aggregates. This is illustrated, for example, by Parupudi et al. who demonstrated the power of fitting DLS and SLS data jointly to determine protein-protein interactions, as a global fit of both DLS and SLS data is necessary to obtain meaningful interaction parameters, since DLS alone can lead to different interpretations (Parupudi et al., 2021).
In 2016, Allen P. Minton provided a comprehensive review on recent applications of light scattering measurement in the biological and biopharmaceutical sciences and indicated that “measurements of both SLS and DLS have been used extensively to monitor unfolding and aggregation of proteins in solution under a variety of conditions” (Minton, 2016). This review also contains numerous recent examples of the use of these two techniques (often in combination with other methods) for characterization of mass and size of individual macromolecular solutes, protein conformational and colloidal stability, nonspecific protein-protein interactions in slightly concentrated solutions, reversible specific associations in dilute solutions, and macromolecular interactions in concentrated protein solutions, as well as analysis of supermolecular assemblies (Minton, 2016).
Reported in 1991 by Damaschun et al., structural characterization of the acid unfolded apocytochrome c by DLS and SAXS (in combination with other biophysical approaches) likely represent one of the first applications of this approach for analysis of IDPs (Damaschun et al., 1991a). In 1995, the same group reported structural characterization of a prototypical IDP, prothymosin α, using SLS and DLS in combination with SAXS, circular dichroism, and mass spectrometry, indicating that the protein is a biologically active protein with random coil conformation characterized by the shape factor of 1.55 and complete lack of ordered secondary structure and concluding: “The finding that a biologically active protein molecule with 109 amino acid residues adopts a random coil conformation under physiological conditions raises the question whether this is a rare or a hitherto-overlooked but widespread phenomenon in the field of macromolecular polypeptides” (Gast et al., 1995).
2.10 Analytical ultracentrifugation (AUC)
Analytical ultracentrifugation (AUC) was invented in the 1920s by Theodor Svedberg (1884–1971), who developed the first analytical ultracentrifuge to determine the molecular weight and analyze the sedimentation behavior of disperse systems and macromolecules, such as proteins and colloids (Svedberg and Nichols, 1923; Svedberg and Rinde, 1924). The power of this approach was demonstrated by the first paper published in 1926, where Svedberg described the sedimentation equilibrium study of hemoglobin and determined the molecular weight of this protein (Svedberg and Fåhraeus, 1926). Since AUC sedimentation velocity (SV-AUC, where the rotor is spun at sufficiently high speed to allow measurement of the rate at which macromolecules move through a solution under high centrifugal force) and sedimentation equilibrium (SE-AUC, where the rotor speed is lower permitting to reach a state of equilibrium, where the centrifugal force driving sedimentation is balanced by diffusion) provide crucial information about the macromolecular properties, such as molecular weight, sedimentation, diffusion, frictional coefficients, shape, and formation of protein complexes, this technique rapidly became a major tool for the analysis of polymers, colloids, and proteins (Cölfen, 2023). The use of AUC in protein studies has undergone two major phases of popularity: a period of initial growth between the 1950s and 1970s (caused by the appearance of commercially available ultracentrifuges), and a resurgence period in the 1990s fueled by significant technological advances including computerized data acquisition, rotor speed, and temperature regulation.
AUC can be used for the analysis of unfolded proteins and IDPs because of their specific hydrodynamic properties, such as larger hydrodynamic radius and slower sedimentation velocity than compact proteins of the comparable molecular mass (Salvay et al., 2012; Scott and Winzor, 2015). A brief description of the parameters measured by AUC in application to IDPs is provided below.
SV-AUC is the most common and versatile AUC method for protein analysis, which provides rich hydrodynamic information, such as sedimentation coefficient (s), diffusion coefficient (D), size, shape, and oligomeric state. Being a measure of the sedimentation rate per unit of centrifugal field (i.e., the rate of boundary movement per unit centrifugal force), sedimentation coefficient, s, is the migration parameter that characterizes size and density of a protein molecule, where larger and more compact molecules sediment faster and have higher s value. Since IDPs/unfolded proteins have larger size and lower packing density than the folded proteins of the same molecular mass, they are characterized by lower sedimentation coefficients.
As the diffusion coefficient (D) characterizing the random motion (diffusion) of the particles is size-dependent, extended IDPs have smaller D compared to their compact, well-folded counterparts. Furthermore, the diffusion coefficient can be used to calculate the hydrodynamic (Stokes) radius Rh (or RS, which is the radius of the equivalent hydrodynamic sphere) of a protein using the Stokes-Einstein equation relating the diffusion of a spherical particle in a fluid to its size and the properties of the fluid. Furthermore, since the derived Rh value can be used for the evaluation of the frictional coefficient, f, and the theoretical minimum frictional coefficient f0 can be calculated for a perfect, unhydrated/unsolvated sphere with a radius of Ru and a volume equivalent to that of the macromolecule being studied, one can obtain information about the frictional ratio, f/f0 = RS/Ru, which is independent of molecular mass and provides information on the shape of a studied protein, being equal to unity for a spherical unsolvated protein. A high f/f0 is characteristic of an extended, flexible, and unfolded protein. Finally, since SV-AUC separate species based on their size, this technique can distinguish between monomers, oligomers, and aggregates in a sample. For IDPs, this can confirm whether a protein exists as a monomer or is undergoing self-association (Scott and Winzor, 2015).
SE-AUC is used to direct measure of the buoyant molecular mass of a particle/protein from the concentration gradient at equilibrium. Furthermore, for proteins that reversibly associate, SE-AUC can be used to determine the equilibrium constants (Ka or Kd) and stoichiometry of the interacting species (Schuck, 2013).
In its early days, AUC was intensively used by Svedberg’s team for evaluation of the molecular mass of proteins, such as hemoglobin (Svedberg and Fåhraeus, 1926), egg albumin (Svedberg and Nichols, 1926), phycoerythrin and phycocyan (Svedberg and Lewis, 1928), serum albumin and of serum globulin (Svedberg and Sjögren, 1928), hemocyanin (Svedberg and Chirnoaga, 1928; Svedberg and Heyroth, 1929), Bence-Jones protein (Svedberg and Sjögren, 1929), edestin (Svedberg and Stamm, 1929), casein (Svedberg et al., 1930a; Svedberg et al., 1930b), amandin and excelsin (Svedberg and Sjögren, 1930), legumin (Sjögren and Svedberg, 1930), insulin (SVEDBERG, 1931), and the blood pigments of the invertebrates (Svedberg and Eriksson, 1932; Svedberg and Hedenius, 1933). Since that time, AUC was widely used to characterize proteins in their native state, providing information on their molecular weight, homogeneity, and interactions.
Although casein was one of the first proteins subjected to the AUC analysis as early as 1930 (Svedberg et al., 1930a; Svedberg et al., 1930b), originally, no conclusion was made about its disordered nature. However, Svedberg and his colleagues reported that instead of being a single, homogeneous protein, casein samples contained components of different sizes, the prevalence of which was strongly dependent on the method used for preparation of protein samples, and that calcium caseinate formed a very polydisperse suspension with colloidal properties (Svedberg et al., 1930a; Svedberg et al., 1930b). Later studies showed that the colloidal particles in milk known as casein micelles represent a complex aggregate of individual casein proteins, stabilized by calcium phosphate (Svedberg and Pedersen, 1940). Furthermore, the analysis of the frictional ratio for casein provided early insights into the non-globular and flexible nature of the casein molecule (Svedberg and Pedersen, 1940).
In 1968, a comprehensive analysis of the lysine-rich fraction of calf thymus histones by sedimentation equilibrium and other physicochemical techniques indicated that this protein had a high frictional ratio and an extended shape, whereas the ORD measurements indicated that it had a low helical content (Haydon and Peacocke, 1968). Later, AUC was used to measure the size and salt-dependent assembly state of histones and to identify and characterize the core histone octamer, a complex of eight histone proteins (two each of H2A, H2B, H3, and H4), with derived results being essential for developing the nucleosome model of chromatin organization (Kornberg, 1974; Elgin and Weintraub, 1975; Thomas and Kornberg, 1975; Weintraub et al., 1975).
In 1981, Pretorius et al. showed that human clathrin extracted from the coated pits of the plasma membrane was characterized by a very large frictional ratio of 3.06 ± 0.18 (Pretorius et al., 1981). Since this protein was shown to contain high levels of ordered secondary structure (49% α-helical structure, 17% β-structure, and 34% random coil structure) it was pointed out that clathrin, being characterized by a very large frictional ratio, cannot represent a random coil polypeptide chain, and it was therefore hypothesized that this protein consisted of several globular (likely α-helical) domains connected by flexible polypeptide sequences to form a common locus (Pretorius et al., 1981). In 1988, Haritos et al. used AUC to characterize the solution state of prothymosin α, paratymosin α, thymosin α1, and thymosin β4, resolving early contradictory gel-filtration findings, according to which these proteins appeared as oligomers which were 4–5 times larger than those calculated from their amino acid sequences (Haritos et al., 1989). It was also pointed out that thymosin α1 was characterized by a frictional ratio of 1.3 indicating its extended, non-globular shape, which differs significantly from an ordered protein (Haritos et al., 1989). Several more recent studies reported large f/f0 values for several IDPs, such as nucleoporin (Denning et al., 2003), securin (Sánchez-Puig et al., 2005), plasmid partition protein KorB (Rajasekar et al., 2010), and neuroligin (Paz et al., 2008), for which the corresponding f/f0 values were 2.8, 2.1, 1.9, and 1.6, respectively.
2.11 Limited proteolysis
Limited proteolysis involves controlled digestion of a protein with a protease under specific conditions to see which parts of a protein are flexible or exposed and therefore more accessible to protease, and which are protected and rigid. The resulting fragments provide insight into the overall structure of a protein, its domain organization, and conformational dynamics. Limited proteolysis, which results in the accumulation of specific fragments corresponding to the more rigid parts of a protein, is different from the total proteolysis (also through the action of proteases) leading to the complete or near-complete degradation of a protein into its constituent amino acids, which is useful for determination of amino acid sequence. Because of its ease from the viewpoint of both the theory (flexible parts are digested, rigid parts are not) and practice (mix a query protein with a limited quantity of a protease, wait for a limited time, and separate the components of the resulting mixture) and usefulness of the generated information, this approach has a long history of useful utilization in protein research.
In the aforementioned study describing the analysis of milk proteins by ORD, Thomas LeRoy McMeekin also mentioned: “In vitro, casein is digested with the greatest ease by proteolytic enzymes. It is well-known that the ease of digestion of some proteins is greatly increased by denaturation or cooking, which appears to make a more accessible molecular structure by unfolding” (McMeekin, 1952). In this quote, McMeekin cited a study by Hans Lineweaver (1907–2009) and Sam R. Hoover published in 1941, were the action of pepsin on native and urea-denatured proteins were compared (Lineweaver and Hoover, 1941). However, these authors themselves pointed out that a number of investigators have shown earlier that the denatured proteins are digested by enzymes more rapidly than native ones. Among the rather long list of their predecessors, the authors mentioned Mortimer Louis Anson (1901–1968) and Alfred Ezra Mirsky (1900–1974), who, in 1934, reported that denatured hemoglobin can be digested by trypsin, which does not attack the native protein (Anson and Mirsky, 1934).
However, the actual “father” of limited proteolysis as a research tool was Kaj Ulrik Linderstrøm-Lang, who, together with Martin Ottesen, coined the term in 1949, to differentiate the restricted specificity of certain enzymes under certain conditions from the random proteolysis accompanying total protein degradation (Linderstrøm-Lang and Ottesen, 1949). The fact that ordered parts of a protein molecule are insensitive to proteolysis gives raise to the sequence/structure paradigm of limited proteolysis, where “higher order structure and not primary sequence is the main determinant of the site of initial hydrolysis” (Hubbard, 1998). Hans Neurath (1909–2002) emphasized that in addition to being a useful tool for protein structure analysis, limited proteolysis (in a form of proteolytic processing) represents a very important biological process leading to the activation of many proteins (including many proteases themselves), which are synthesized as precursors (Neurath and Walsh, 1976; Neurath, 1979; Neurath, 1986; Neurath, 1999).
It was also pointed out that limited proteolysis represents “a convenient and accurate method for determining the “ratio of denaturation” – quantitative determination of denatured and native states–of partially denatured proteins” (Okunuki et al., 1956). This opens a possibility to use limited proteolysis as a tool for conformational analysis of proteins, where a very significant role was played by the laboratory of Angelo Fontana, who emphasized that the proteolytic probes can pinpoint the sites of local unfolding in a protein chain (Fontana et al., 1986; Fontana et al., 1993), as well as to analyze the partially folded states of globular proteins (such as molten globules) induced in several proteins by specific conditions (Fontana et al., 1997a; Fontana et al., 1997b; Fontana et al., 1999; Polverino de Laureto et al., 2002; Fontana et al., 2004).
Finally, in relation to the subject of this review, observation of faster proteolysis rates in certain proteins, compared to structured counterparts, provided an early indicator of intrinsic disorder. For example, high proteolytic sensitivity of casein was reported by McMeekin in 1952 (McMeekin, 1952). In 1970, James Bartley and Roger Chalkley showed that histones of calf thymus nucleohistone are protease resistant when complexed with DNA, whereas when freed from DNA, they rapidly degraded, indicating the presence of DNA-binding-induced structure (Bartley and Chalkley, 1970). In 1973, Russell Doolittle (1931–2019) indicated that a large disordered region of fibrinogen enabled its cleavage and activation, indicating functional importance of IDR (Doolittle, 1973). In 1978, T. S. K. Chang and Barry R. Zirkin showed that protamine released during the rabbit sperm nuclei decondensation is rapidly degraded, with degradation reaching maximum extent before the decondensation was completed (Chang and Zirkin, 1978).
Ignacio V. Sandoval and Klaus Weber reported in 1978 that large microtubule-associated proteins MAP1 and MAP2 (that are crucial for tubulin assembly) are rapidly degraded in crude brain extracts by a calcium-dependent protease, which does not affect tubulin, and this event results in the permanent loss of tubulin polymerization (Sandoval and Weber, 1978). This study supported the earlier observation of Richard B. Vallee and Gary G. Borisy that MAP1 and MAP2, which form the projections from cytoplasmic microtubules, are rapidly degraded by trypsin, with tubulin being little affected under the conditions employed (Vallee and Borisy, 1977). In 1980, Allan et al. used trypsin digestion to show that only a central domain of a lysine-rich histone H1 from calf thymus (residues 37–120) is in a folded conformation, whereas N- and C-terminal regions (residues 1–36 and 121–213, respectively) are very accessible in chromatin and therefore likely not in a compact, folded conformation (Allan et al., 1980).
Grzelczak et al. reported in 1982 that the most abundant cytosolic wheat embryo protein, early-methionine-labelled (Em) polypeptide, characterized a distinctive amino acid composition, with Gly and Glx accounting for almost 40% of the total amino acids, is rapidly and completely degraded soon after the first contact of the embryo with water (Grzelczak et al., 1982). In 1986, Sohar et al. demonstrated that although the calcium-binding proteins troponin C and calmodulin are protected from digestion by the chymotrypsin-like serine proteinase in the presence of the elevated calcium levels, both proteins are rapidly degraded by the same protease in the absence of calcium (Sohar et al., 1986), indicating that the structures of these proteins are calcium-dependent. In line with these observations, Mamoru Ohnishi and Reinhart A. F. Reithmeier showed in 1987 that the structure of another calcium-binding protein, calsequestrin (which binds 40-50 calcium ions and is characterized by high levels of acidic residues), is calcium-sensitive as well, as this protein was rapidly degraded by trypsin in the absence of calcium, but showed remarkable stability in calcium-loaded form (Ohnishi and Reithmeier, 1987).
In 1988, Kashima et al. demonstrated that a very significant part of high molecular weight (300 kDa) histidine-rich protein from rat epidermis is rapidly degraded by the epidermal proteinases, leading to the accumulation of a 56 kDa fragment (Kashima et al., 1988). In 1993, Leontiev et al. showed that while the dihydrofolate reductase from E. coli variants with the Thr35 → Asp and Thr35 → Asp/Asn37 → Ser/Arg57 → His mutations in the active site were compact and have pronounced secondary structure, they did not possess rigid 3D structure and were ∼10 times more susceptible to limited trypsinolysis in comparison with the wild type protein, emphasizing low proteolytic stability of these intrinsically disordered molten globular mutants (Leontiev et al., 1993).
Cohen et al. showed that in the absence of DNA, a member of the basic/helix-loop-helix/zipper family of DNA-binding proteins, transcription factor Max, is rapidly digested by several endoproteases, indicating an open and flexible structure of the protein in the unbound form (Cohen et al., 1995). On the other hand, dimerization and DNA binding were shown to facilitate α-helix formation in this protein, making it less susceptible to proteolytic degradation (Horiuchi et al., 1997). The lack of defined three-dimensional structure in the native state of dehydrin-like desiccation stress protein from the resurrection plant Craterostigma plantagineum was supported by fast proteolytic degradation (Lisse et al., 1996). Based on the comprehensive structural analysis using proteolytic mapping, circular dichroism spectropolarimetry, and nuclear magnetic resonance spectroscopy, Kriwacki et al. revealed that the cyclin-dependent kinase (Cdk) inhibitor p21Waf1/Cip1/Sdi1 lack stable secondary or tertiary structure in the free solution state, but its N-terminal region adopts an ordered stable conformation when bound to Cdk2, thereby providing a mechanical explanation to the remarkable ability of p21Waf1/Cip1/Sdi1 to bind and inhibit a diverse family of cyclin-Cdk complexes, including cyclin A-Cdk2, cyclin E-Cdk2, and cyclin D-Cdk4 (Kriwacki et al., 1996). Interaction between the eukaryotic translation initiation factor eIF4G and the cap-binding protein eIF4E was shown to be accompanied by the unfolded to folded transition of the 98-amino acid domain of Saccharomyces cerevisiae eIF4G1, as evidenced by multiple biophysical techniques, including limited proteolysis (Hershey et al., 1999).
Admittedly, the presented list of the proteins characterized by limited proteolysis as rapidly digestible polypeptides with limited structure is far from complete. Also, all the cases described here cover a “pre-IDP” period; i.e., a time-frame before the publication of our survey in 2000 (Uversky et al., 2000a). Among the experimentally characterized “natively unfolded proteins” included in that study (Uversky et al., 2000a), there were 7 proteins (7.8%), whose disordered status was confirmed by limited proteolysis, indicating the important role of this technique in establishing the IDP field.
2.12 Fluorescence
2.12.1 A brief introduction to fluorescence and its major characteristics
Fluorescence is the instant emission of absorbed light at a longer wavelength. This phenomenon occurs when a substance absorbs a high-energy photon, prompting its electrons to move to a higher energy level. As the electrons return to their ground state, they emit the energy as a photon of light with a longer wavelength. Historically, work on fluorescence is rooted in studies of “epipolic dispersion” by John Herschel (1792–1871), who described a blue glow emanating from a thin, superficial layer (“epipolic stratum” from Greek έπίπόλη, a surface) of a colorless quinine solution near the surface where the light enters, with such “epipolized light” been changed in some way, as it was incapable of being epipolized again, indicating that epipolic dispersion is different from scattering (Herschel, 1845a; Herschel, 1845b).
However, other researchers of the 19th century also observed the luminescence phenomena in various materials. For example, in 1819, Edward Daniel Clarke (1769–1822) reported that certain varieties of fluorite crystals had different color depending on the direction of illumination; i.e., when viewed by reflected light versus transmitted light (Clarke, 1819). Similar observations on some varieties of fluorites were reported by René Just Haüy (1743–1822) in 1822, but the effect was incorrectly interpreted as a form of light scattering, similar to opalescence (Haüy, 1822). While describing a similar effect in chlorophyll, David Brewster (1781–1868) also considered it as a form of opalescence (Brewster, 1834). Finally, in 1843, Alexandre-Edmond Becquerel (1820–1891) described the emission of light by calcium sulfide deposited on paper when exposed to solar light beyond the violet part of the spectrum, being, therefore, the first to state that the emitted light is of longer wavelength than the incident light (Becquerel, 1843). In 1852, George Gabriel Stokes (1819–1903) summarized the accumulated information about these optical effects and provided the first detailed description of the phenomenon, which he named “fluorescence”, where certain materials, such as fluorspar and uranium glass, convert invisible ultraviolet light into visible light of a longer wavelength (Stokes, 1852; 1853). The observed phenomenon, where the wavelength of the fluorescent (emitted) light is always longer than the wavelength of the exciting (absorbed) light, represents a fundamental principle is now known as the Stokes shift.
The physics of fluorescence is best illustrated by Jabłoński diagram (Jablonski, 1933; Jabłoński, 1935) showing electronic and vibrational energy states of a molecule, as well as the radiative and non-radiative transitions after light absorption. This diagram serves as an effective visual tool demonstrating the energy transitions and relaxation processes that occur in molecules after the absorption of light and showing corresponding processes, such as absorption, fluorescence and delayed fluorescence (from singlet states), phosphorescence (from triplet states after intersystem crossing), and non-radiative transitions. Although being commonly known as Jabłoński diagram, the more correct name of this model is the Perrin-Jabłoński diagram (after Jean Baptiste Perrin (1870–1942), Francis Perrin (1901–1992), and Aleksander Jabłoński (1898–1980)) modified by Alexander N. Terenin (1896–1967), Gilbert N. Lewis (1875–1946), and Michael Kasha (1920–2013) to emphasize the contribution of other researchers to the development of this concept.
Fluorescence is characterized by several parameters, such as the fluorescence quantum yield, fluorescence intensity, extinction coefficient, peak excitation wavelength, peak emission wavelength, Stokes shift, fluorescence lifetime, fluorescence anisotropy, and fluorescence resonance energy transfer (FRET). Fluorescence quantum yield quantifies the efficiency of the fluorescence process, being the ratio of the number of photons emitted to the number of photons absorbed. The idea is rooted in a series of papers by Emil Gabriel Warburg (1846–1931) reporting quantitative experiments on photochemical reactions [e.g. (Warburg, 1920)], which were crucial for subsequent establishment of the method for the quantum yield determination as described by Sergey I. Vavilov (1891–1951) (Wawilow, 1924). Fluorescence lifetime provides a measure of the average time spent by a fluorophore in an excited state before emitting a photon and returning to its ground state. For the first time, luminescence decay times characterizing the duration of phosphorescence of uranyl salts were measured by Edmond Becquerel in 1859 (Becquerel, 1859). In 1926, Ramón Enrique Gaviola (1900–1989) developed a first instrument for measuring fluorescence decay in the nanosecond range (Gaviola, 1926), and in the same year, Francis Perrin derived a mathematical relationship between fluorescence lifetime and molecular rotation, thereby contributing to the theoretical understanding of fluorescence lifetime (Perrin, 1926).
Fluorescence anisotropy measures the rotational motion of a fluorophore-labeled molecule by analyzing the polarization of its emitted light. Although the modern definition and use of fluorescence anisotropy were introduced by Aleksander Jabłoński (Jablonski, 1960) and independently by Gregorio Weber (1916–1997) (Weber, 1952; 1967), this work was built upon the earlier studies of Fritz Weigert (1876–1947) (Weigert, 1920) and Francis Perrin (Perrin, 1926). For a flexible or non-rigid protein, the intrinsic fluorophores (tryptophan residues) have freedom to rotate independently of the rest of the molecule. This faster, local rotational motion causes a significant and measurable decrease in fluorescence anisotropy. By contrast, in a rigid protein, the tryptophan is held in place, and its rotation is constrained, leading to higher anisotropy.
Fluorescence resonance energy transfer (FRET, also known as Förster resonance energy transfer) is the radiationless transfer of energy from an excited donor fluorophore to a suitable acceptor fluorophore, a physical process that depends on spectral overlap and proper dipole alignment of the two fluorophores. Although it was observed for the first time in 1922, in the experiments on fluorescence behavior of a vapor composed of mercury and thallium atoms conducted by Günther Cario (1897–1984) and James Franck (1882–1964) (Cario and Franck, 1922) and the finalized theory was introduced in 1940s by Theodor Förster (1910–1974) (Forster, 1946) following the earlier work by Francis Perrin (Perrin, 1932), FRET became a go-to technique in the 1960s, when it was demonstrated that FRET measurements could be carried out with fluorescently labeled peptides, and thereby the ruler for molecular interactions was discovered (Stryer and Haugland, 1967; Szabo et al., 2022).
2.12.2 Fluorescence and protein flexibility
Despite all these developments, the actual use of fluorescence in life sciences did not start before the 1950s, when the first spectrophotofluorometer was invented by Robert L. Bowman (1916–1995) (Bowman et al., 1955) and when it was established that some naturally occurring amino acids, such as tryptophan, tyrosine and phenylalanine, were responsible for the ultraviolet fluorescence observed in proteins (Weber, 1953; Duggan and Udenfriend, 1956; Shore and Pardee, 1956; Konev, 1957; Teale and Weber, 1957). A book “Fluorescence and Phosphorescence of Proteins and Nucleic Acids” published in 1967 by Sergei V. Konev (1931–2005), being the first book written specifically about luminescence of biopolymers, contains a comprehensive overview of the then-major achievements in the field of protein fluorescence and describes the use of fluorescence as a means to analyze the structure and conformation of macromolecules in intact cells (Konev, 1967).
As per PubMed, the current literature on protein fluorescence includes more than 475,000 studies. The power of fluorescence spectroscopy in application to proteins is reflected in the ability of this technique to provide characterization of protein flexibility across a wide range of timescales, from picoseconds to seconds and even minutes, with the specific timescale observed being dependent on the type of motion being measured and the fluorescence method used. As a result, fluorescence methods allow for detection and analysis of rapid, local motions, such as fluctuations of individual amino acid side chains and the local relaxation of the protein matrix (10-12 to 10-9 s), capturing structural changes, such as domain motions or transitions between different protein states (10-6 to 10-3 s), as well as analysis of slower, large-scale motions and conformational changes, ranging from folding-unfolding processes to binding or dissociation of other molecules (10-3 s to minutes).
Fluorescence spectroscopy was crucial for discovery of protein conformational breathing, which was the foundation of the shift of the traditional view of proteins as rigid, static structures to a more accurate model of flexible, fluctuating molecules essential for biological function. For example, in 1973, Joseph R. Lakowicz and Gregorio Weber reported that despite their common location in the interior of the protein matrix and the apparent inaccessibility to solvent, no tryptophan residues were excluded from quenching by oxygen (which is an “ideal” quencher of the fluorescence of singlet excited states, as every collision with an excited fluorophore results in quenching), indicating that “proteins, in general, undergo rapid structural fluctuations on the nanosecond time scale which permit diffusion of oxygen” (Lakowicz and Weber, 1973). Based on these observations, Gregorio Weber pointed out in 1975: “From these results it can be definitely concluded that the time-average structure observed by X-ray diffraction is something of an abstraction, since it is not itself widely–or even sparsely–represented at any given time in the population of molecules … Indeed the protein molecule model resulting from the X-ray crystallographic observations is a “platonic” protein, well removed in its perfection from the kicking and screaming “stochastic” molecule that we infer must exist in solution. The great importance of the former lies in that it has permitted us to see the origin of the “bulk properties” of the protein, which result from averaging over the whole population, However, when it comes to the conversion of one structure into another, and to render account of any dynamic function of the protein, consideration of the “stochastic” species is indispensable” (Weber, 1975). Fluorescence-based analysis also revealed the conformational inhomogeneity of protein structure, as evidenced, for example, by the multiexponential fluorescence decay in single-tryptophan proteins (Grinvald and Steinberg, 1976).
2.12.3 Intrinsic fluorescence
Depending on their origin, fluorophores are classified as intrinsic (occurring naturally in the system under study) and extrinsic (fluorophores that do not occur in nature), which are further subdivided to fluorescent dyes (fluorophores that can interact with biomolecules but are not covalently attached to them) and fluorescent labels/probes/tags (fluorophores that are covalently attached to the biomolecules). One should keep in mind that obtaining fluorescent characteristics of a protein is typically not sufficient for its structural classification, and fluorescence analysis is therefore commonly complemented by other techniques, such as CD or FTIR, to obtain at least information about protein secondary structure.
Long before IDPs were widely studied, intrinsic fluorescence was used to analyze the unfolding of globular proteins, which helped establish a foundation for understanding large-scale protein conformational changes. In fact, the most common application of intrinsic protein fluorescence is to detect and monitor conformational changes in a query protein. This is because the parameters of intrinsic fluorescence (particularly those of tryptophan (Trp) fluorescence), such as intensity, lifetime, anisotropy, and peak emission wavelength, are highly sensitive to the local environment and provides valuable, label-free insights into protein structure, dynamics, and conformational changes. This sensitivity arises from the indole ring of Trp, which is characterized by a relatively large dipole moment both in the ground and excited states it extensively interacts with polar and charged groups in its environment, and whose photophysical properties are affected by surrounding residues, solvent exposure, and molecular motion (Lakowicz, 1983; Permyakov, 2018). As a result, proteins can be classified based on their tryptophan fluorescence parameters, such as shape and position of their intrinsic fluorescence spectra, which indicate location and environment of a tryptophan residue within a protein (Eftink, 1991; Chen and Barkley, 1998; Engelborghs, 2003).
The more hydrophobic and rigid the environment, the shorter the wavelength of the fluorescence maximum, the phenomenon known as a blue-shift (Vivian and Callis, 2001). One of the most extreme blue-shifts was reported for azurin, whose tryptophan residue is in an unusual rigid environment within the β-barrel structure lacking hydrogen bonding or other polar interactions. The resulting fluorescence spectrum was notable for its distinct vibrational structure and a maximum emission (λmax) at an unusually short wavelength of 308 nm (Burstein et al., 1977). Conversely, as the environment becomes more polar and flexible, the maximum shifts to a longer wavelength, known as a red-shift, and unfolded proteins are typically characterized by fluorescence spectra with λmax at 350–353 nm (Eftink, 1991). It was also indicated that the fluorescence properties of Trp residues in the proteins can be described based on the existence of three discrete spectral classes, a buried in nonpolar regions of the protein (λmax = 330–332 nm, spectral band width Δλ = 48–49 nm, quantum yield q = 0.11, and lifetime τ = 2.1 ns), a completely exposed to water (λmax = 350–353 nm, Δλ = 59–61 nm, q = 0.2, τ = 5.4 ns); and in limited contact with water (λmax = 340–342 nm, Δλ = 53–55 nm, q = 0.3, τ = 4.4 ns) (Burstein et al., 1973).
2.12.4 Quenching of fluorescence
A very promising spectroscopic technique for evaluation of solvent accessibility of aromatic residues in a protein involves the quenching of their intrinsic fluorescence by the addition of various low molecular weight agents (Lehrer, 1971; Eftink and Ghiron, 1976; Lehrer and Leavis, 1978), whose efficiency can be evaluated using Stern-Volmer plot (named after Otto Stern (1888–1969) and Max Volmer (1885–1965) who proposed this approach in 1919) correlating changes in fluorescence intensity with the concentration of quencher, and whose slope gives the Stern-Volmer constant, KSV, a quantitative measure of fluorescence quenching efficiency (Stern and Volmer, 1919). The quenching reaction involves physical contact between the quencher and an excited indole ring, and can be kinetically described in terms of a collisional and a static component (Eftink and Ghiron, 1976). In 1976, Maurice R. Eftink and Camillo A. Ghiron published a comprehensive study utilizing acrylamide as quencher and showed that this approach is very discriminating in sensing the degree of exposure of tryptophan residue in proteins, including a randomly coiled peptide adrenocorticotropin (Eftink and Ghiron, 1976). The power of fluorescence at the single molecule level was demonstrated in 2000 by Zhuang et al., who showed that fluorescence self-quenching (i.e., fluorescence quenching between identical fluorophores) is sensitive to the collapse of intrinsically disordered protein titin (Zhuang et al., 2000).
2.12.5 Red edge excitation shift
Combining Vavilov’s law stating that the fluorescence quantum yield is constant regardless of the excitation wavelength, and as a result, emission energy is independent of the excitation energy within the absorption band (Wawilow, 1924; Wawilow, 1927) with Kasha’s rule emphasizing that “the emitting level of a given multiplicity is the lowest excited level of that multiplicity” (Kasha, 1950) gives rise to an important principle that the shape of the fluorescence spectrum is independent of the excitation wavelength. However, in 1970, it was found that the spectroscopic properties of the fluorescence spectra of aromatic fluorophores embedded into rigid and highly viscous media do not conform to classical rules and can depend on excitation wavelength and the excited-state energy transfer between identical molecules can be undetectable on excitation at the red edge of the absorption spectrum (Galley and Purkey, 1970; Rubinov and Tomin, 1970; Weber and Shinitzky, 1970). These and subsequent observations were described as “red-edge effects” (REE), and the analysis of these phenomena, especially red edge excitation shift (REES) provided a useful approach for the investigation of protein structure and dynamics by analyzing how its intrinsic fluorescence spectrum shifts when excited by different wavelengths of light (Demchenko, 2002).
The appearance of REES is linked to the reorientation time of the polar solvent molecules (water) surrounding an excited polar fluorophore (tryptophan) with changed electronic state (and, thus, changed dipole moment) to reach a new, lower-energy equilibrium with the excited fluorophore. The timescale of such solvent relaxation depends on the environment, being very fast in non-viscous solvent (happening well within the excited-state lifetime of the fluorophore) but being much slower in motionally restricted environments, such as viscous solvents or the compact, tightly packed interior of a folded protein. Under such conditions, a shift of the excitation wavelength towards the “red edge” (lower energy) of the absorption spectrum causes excitation of only a sub-population of fluorophores that are already in a lower-energy ground state. At the excitation of such red-edge molecules, their surrounding solvent cannot fully relax before fluorescence emission occurs, leading to the red-shift of the emission spectrum compared to the emission observed when exciting at the absorption maximum (Demchenko, 2002). This shift provides information about the local environment’s polarity, dynamics, and rigidity, making it useful for monitoring protein stability, conformational changes, and ligand binding.
A comprehensive analysis of REE in single-Trp proteins revealed that the effects can be found in proteins possessing fluorescence emission spectra with λmax ranging from 320 to 340 nm, whereas in proteins and peptides with fluorescence spectra above 340 nm, REE are not observable because of the high flexibility of these proteins and the access of tryptophan residues to the rapidly relaxing solvent. In proteins with λmax below 320 nm REE is not observed as well, likely due to the highly hydrophobic Trp environment where dielectric effects are not significant (Demchenko, 1988; Demchenko, 2002; Demchenko, 2013). A recent comprehensive review by Rupasree Brahma and H. Raghuraman provides a detailed description of using REES for linking solvent relaxation dynamic and protein conformation and emphasizes that this technique can be used as a sensitive tool to monitor the structural plasticity of IDPs and distinguish subtle but important structural alterations in these proteins (Brahma and Raghuraman, 2021). However, most REES-based studies of IDPs were conducted very recently and therefore did not contribute to the establishing of the IDP field [for example, REES was used for analysis of α-synuclein and amyloidogenic k-casein in 2013 and 2014, respectively (Jain et al., 2013; Arya and Mukhopadhyay, 2014)].
2.12.6 Analysis of IDPs by steady-state fluorescence
Because of their known amino acid biases, IDPs are commonly depleted in aromatic residues. Therefore, intrinsic fluorescence-based studies are typically restricted to a limited number of aromatic residue-containing IDPs, which are usually characterized by surface location of Trp residues characterized by the red-shifted intrinsic fluorescence spectra with λmax at 340 – 353 nm (Permyakov and Uversky, 2010). Often, the fluorescence spectrum of an IDP coincides with that of free Trp in water. However, interactions of such IDPs with partners can promote transfer of Trp residues to a more hydrophobic or more rigid environment, leading to a blue shift of fluorescence maximum position. For example, the intrinsically disordered C-terminal domain of chicken gizzard caldesmon (CD136) has a λmax of 350.2 nm, but interaction with its binding partner, calmodulin, results in a pronounced (17 nm) blue shift of the CaD136 fluorescence spectrum (Permyakov et al., 2003). Analysis of the intrinsically disordered N-terminal fragment of human glucocorticoid receptor fragments revealed that it is characterized by the λmax of 340 nm, suggesting an external location of Trp residues, whereas trimethylamine N-oxide-induced folding of this fragment resulted in a blue shift of fluorescence maximum by more than 10 nm (Baskakov et al., 1999).
In 1971, Paul R. Rurnett and I. H. Eplar showed that the myelin basic protein (MBP) is characterized by red-shifted intrinsic fluorescence (Burnett and Eylar, 1971). In 1975, Jones and Rumsby reported that the tyrosine and tryptophan residues of this protein are largely exposed to the solvent and that the addition of 8 M urea had little effect on the fluorescence properties of the protein (Jones and Rumsby, 1975). Furthermore, the resonance energy transfer from tyrosine to tryptophan was very inefficient (Jones and Rumsby, 1975), suggesting that MBP is characterized by extended conformation. Later, Monferran et al. showed that the intrinsic fluorescence of MBP is characterized by the λmax of 346 nm and this maximum remains practically unchanged in chemically modified (acetylated and succinylated) MBP (Monferran et al., 1986). These authors also showed that only non-modified protein was able to efficiently interact with membranes, and this interaction resulted in a dramatic blue-shift of intrinsic fluorescence below 335 nm (Monferran et al., 1986). In 1991, Cavatorta et al. used intrinsic fluorescence to characterize interaction of MBP with divalent cations and showed that Zn2+ can bind to MBP (Cavatorta et al., 1991).
In 1975, Kevin N. Pearce showed that the intrinsic fluorescence of bovine β-casein A1 at low temperature (where a protein is known to be a monomer with random coil conformation) is characterized by λmax of 340 nm, but the spectrum became noticeably blue-shifted as a result of temperature-induced micelle formation (Pearce, 1975). Conformational analysis of the extracellular domain of the low affinity NGF receptor (LNGFR or gp75) revealed that this protein is mostly disordered, as evidenced by its low content of regular secondary structure and red-shifted intrinsic fluorescence with λmax of 345 nm (Timm et al., 1992). However, this protein was shown to undergo a temperature-induced transition to a more disordered state with the emission peak shifted to ∼353 nm (Timm et al., 1992).
Based on the steady-state and time-resolved fluorescence analysis, Neyroz et al. concluded that a potent inhibitor of protein phosphatase 1, DARPP-32 (dopamine- and CAMP-regulated phosphoprotein with an apparent molecular mass, of 32,000 on SDS- polyacrylamide gel electrophoresis), although this protein is characterized by mostly random coil conformation, has a λmax of 352 nm, low fluorescence anisotropy values indicative of the independent segmental motions of the peptide chain surrounding fluorophore, and is characterized by accessibility to quencher comparable to that of proteins containing exposed fluorophores, it can be further unfolded by 8 M urea, as evidenced by further decrease of fluorescence anisotropy (Neyroz et al., 1993). Josefsson et al. revealed that the B-repeat segment of a cell surface protein of Staphylococcus aureus SdrD is capable of binding of 14 Ca2+ ions, and that, based on the circular dichroism and Trp fluorescence analysis, concluded that although the metal-free form is strongly disorganized, the Ca2+-bound form is well folded (Josefsson et al., 1998).
2.12.7 Fluorescence anisotropy in analysis of IDPs
Fluorescence anisotropy was used to characterize the flexibility and conformational changes of IDPs in several early studies [see, e.g., aforementioned DARPP-32 analysis (Neyroz et al., 1993)]. In 1973, Munro et al. used time-resolved tryptophan fluorescence polarization spectroscopy to analyze the dynamics of several proteins in the subnanosecond and nanosecond time range (Munro et al., 1979). This analysis revealed that the tryptophan residues of the analyzed proteins exhibit different degrees of rotational freedom, ranging from almost no mobility to nearly complete freedom in the subnanosecond time range, as evidenced by an intrinsically disordered bovine basic A1 myelin protein (Munro et al., 1979). Y. Gloria Chu and Charles R. Cantor used static and nanosecond fluorescence polarization techniques to analyze the ribosomal protein S1 fluorescently labeled by iodoacetylethylenediamine (1,5)-napthol sulfonate (IAEDANS) and revealed that this protein is characterized by segmental flexibility, suggesting that it contains at least two domains that can rotate independently (Chu and Cantor, 1979). In 1981, Lubert Stryer (1938–2024) emphasized that protein molecules are not inflexible crystal-like entities, but are characterized by very rapid motions of selected regions, since nanosecond fluorescence polarization analysis revealed that segmental flexibility, where domains can rotate over an appreciable angular range of times of nanoseconds, is a characteristic feature of multidomain proteins, whereas time-resolved fluorescence polarization studies have demonstrated that internal tryptophan residues can be flexible in the subnanosecond time range (Stryer, 1981).
Based on the steady-state and lifetime-resolved fluorescence anisotropy measurements of intrinsic protein fluorescence, Lakowicz et al. showed that tryptophan residues of carbonic anhydrase, carboxypeptidase A, alpha-chymotrypsin, trypsin, pepsin, and bovine and human serum albumins are characterized by the remarkable freedom of motion within the protein matrix, which implies that these matrices are highly flexible on the nanosecond time scale (Lakowicz et al., 1980). Fluorescence polarization studies of dansylcadaverine-labeled fibronectin indicated that this protein has a significant degree of chain flexibility under physiologic conditions and may assume an unfolded conformation upon binding to collagen in the tissue matrix (Williams et al., 1982).
Hauer et al. used time-resolved fluorescence anisotropy to analyze the 8 kDa protein kinase inhibitor (PKI alpha) of cAMP-dependent protein kinase (cAPK) free in solution and bound to cAPK (Hauer et al., 1999). To this end, three single mutants of PKI alpha were created (V3C, S28C, and S59C) and labeled with iodoacetamide. Analysis revealed that in the unbound state, all three variants were characterized by high flexibility, whereas binding to the catalytic (C) subunit of cAPK caused local folding of the N-terminal region of PKI alpha, whereas the segment around Ser59 remained highly flexible when bound to the C-subunit (Hauer et al., 1999), suggesting the “fuzzy” nature of the resulting PKI alpha-cAPK complex. Over the years, fluorescence anisotropy was successfully used for characterization of protein flexibility. However, the unique power of this technique was revealed in a 2010 study of Mattheyses et al., who used fluorescence polarization microscopy to analyze fluorescence anisotropy of fluorescently tagged specific domains of individual (Mattheyses et al., 2010). The analysis resolved order and disorder of individual protein domains nucleoporins within the nuclear pore complex (NPC) and showed that “the tips of the FG domains are disordered, whereas the NPC-anchored domains are ordered” (Mattheyses et al., 2010).
2.12.8 Fluorescence (Förster) resonance energy transfer (FRET)
Fluorescence (Förster) resonance energy transfer (FRET) analysis is used to measure protein flexibility by tracking changes in distance between two fluorescent molecules (fluorophores) attached to a protein. In early studies, the proximity of fluorescently labeled sites on biological macromolecules was analyzed by the ensemble FRET, which provided averaged information about the distances between labeled parts of proteins. A comprehensive review published by Lubert Stryer in 1978 entitled “Fluorescence energy transfer as a spectroscopic ruler” provided a description of the Förster’s theory and of the experimental tests of its validity, systemized experimental strategy for the measurements of transfer efficiency, and summarized data on using energy transfer for elucidation of the proximity relationships in a wide variety of biological macromolecules and assemblies, and thereby represented FRET as a powerful tool in the analysis of protein structure and interactions (Stryer, 1978).
Although most of the FRET applications in the early days were related to the estimation of distances between interacting partners, in 1978, Elisa Haas, Ephraim Katchalski-Katzir, and Izchak Z. Steinberg analyzed the translational dynamics of the ends of oligopeptides by measuring energy transfer between chromophores attached to the N- and C-termini (Haas et al., 1978). The logics of this approach, where FRET is enhanced due to the translational diffusion as a donor-acceptor pair that is too far apart for efficient transfer at the instant of excitation may diffuse toward each other during the excited-state lifetime so that the distance between them becomes short enough for efficient transfer (Elkana et al., 1968; Steinberg and Katchalski, 1968), is a founding principle of the single molecule FRET (smFRET) that become one of the most efficient tools for evaluation of flexibility and conformational dynamics of proteins. Though smFRET was demonstrated for the first time by Ha et al., in 1996 by obtaining simultaneous dual color images and emission spectra from donor and acceptor fluorophores linked by a short DNA molecule (Ha et al., 1996), the first actual application of this tool in analysis of IDPs was reported in 2007 by Mukhopadhyay et al., who demonstrated that the natively unfolded yeast prion protein adopts an ensemble of collapsed and rapidly fluctuating structures (Mukhopadhyay et al., 2007). Although it did not contribute to the establishment of the protein intrinsic disorder concept, this powerful technology rapidly became a popular tool in the IDP field (Ferreon et al., 2010; Lee et al., 2015; Schuler et al., 2016; Gomes and Gradinaru, 2017; LeBlanc et al., 2018; Nasir et al., 2019; Metskas and Rhoades, 2020).
2.12.9 Fluorescence correlation spectroscopy (FCS)
An important technique for the analysis of molecular dynamics is fluorescence correlation spectroscopy (FCS) that measures spontaneous fluorescence intensity fluctuations in a microscopic detection volume. Being, in essence, the fluorescent counterpart to the dynamic light scattering, FCS provides information about diffusion coefficients and hydrodynamic radii (Rigler et al., 1979; Sorscher et al., 1980; Kask et al., 1987) of even a single fluorescent molecule (Krichevsky and Bonnet, 2002). FCS was introduced in 1972 by Douglas Magde, Elliot Elson, and Watt W. Webb who analyzed the binding of ethidium bromide to DNA (Magde et al., 1972).
Currently, FCS is used for the analysis of the photodynamic properties of fluorescent dyes, study of translational and rotational diffusion, in various binding assays, as well as investigation of conformational fluctuations of biomolecules, and even analysis of living cells (e.g., counting fluorescence particle in vivo, probing cellular organelles, and analysis of nuclear structure) (Maiti et al., 1997; Krichevsky and Bonnet, 2002). Most frequently, FCS, which, in addition to the translational diffusion time of the molecules through the small detection volume provides information on the average number of fluorescent molecules in the detection volume, is utilized in detection and identification of single molecules in solution (Eigen and Rigler, 1994; Kinjo, 1998) and in the analysis of molecular interactions (Sterrer and Henco, 1997; Widengren and Rigler, 1998; Hink et al., 2002; Berland, 2004; Levin and Carson, 2004), providing a means for molecular recognition at the single molecule level (Van Craenenbroeck and Engelborghs, 2000), even in living cells (Lippincott-Schwartz et al., 2001; Hink et al., 2002; Pramanik, 2004).
An illustrative example of using FCS in interactions of IDPs is given by a study published in 2000 by Pack et al., where the peculiarities of binding of disordered substrates (apo-cytochrome c and disulfide-reduced apo-α-lactalbumin) to GroEL was analyzed (Pack et al., 2000). One of the first applications of FCS in structural IDP analysis was reported in 2006, when Crick et al. quantified the hydrodynamic sizes of monomeric polyglutamine (which acts as a model IDP) as a function of chain length and showed that this homopolypeptide exists as a heterogeneous conformational ensemble of collapsed structures (Crick et al., 2006). In the aforementioned 2007 study, Mukhopadhyay et al. used FCS in combination with smFRET to analyze the conformational behavior of yeast prion protein (Mukhopadhyay et al., 2007).
2.13 Mass spectrometry
2.13.1 Hydrogen-deuterium exchange mass spectrometry (HDX-MS)
Time-resolved spontaneous hydrogen-deuterium exchange (HDX) of covalently bonded hydrogens of a protein with deuterium in solution provides information about protein conformation, flexibility, and solvent accessibility (Englander et al., 2016). In fact, since protected regions exchange more slowly than exposed, flexible regions, protein secondary and tertiary structure can be deduced from the rate at which backbone amide protons exchange with solvent deuterium. Application of HDX for analysis of proteins was pioneered by Kaj Ulrik Linderstrøm-Lang (1896–1959), who, in addition to the aforementioned development of the protein secondary structure concept and elaboration of the limited proteolysis as a research tool, proposed the foundational theory for the use of this technique in studying protein structure and dynamics (Hvidt and Linderstrom-Lang, 1954; Hvidt and Linderstrom-Lang, 1955; Linderstrom-Lang, 1955; Berger and Linderstrøm-Lang, 1957; Benson and Linderstrøm-Lang, 1959; Englander et al., 1997).
Although in those early studies, HDX was analyzed for insulin, β-lactoglobulin, myoglobin, and poly-DL-alanine, because of the use of densitometry as analytical technique, the application of this method was limited by poor spatial resolution (early densitometric analysis measured average deuterium incorporation over large segments of a protein, which made it impossible to pinpoint specific sites of exchange). The situation changed dramatically when it was proposed to use NMR as a method for HDX detection (Dempsey, 2001), and NMR-based HDX detection was the leading technique in the field until the early 2000s, when mass spectrometry (MS) emerged as an extremely powerful alternative (Deng et al., 2016; Masson et al., 2019; James et al., 2022; Stofella et al., 2022), although the first report demonstrating the use of MS to monitor hydrogen-deuterium exchange in intact proteins was published by Viswanatham Katta, Brian T. Chait, and Steven Carr in 1991 who also mentioned that this technique can efficiently detect conformational changes of proteins in solutions (Katta et al., 1991).
In HDX analysis, NMR relies on the different magnetic properties of hydrogen and deuterium and provides residue-specific information, whereas MS utilizes change in mass due to deuteration and offers information that is specific to peptides obtained by proteolytic digestion. While HDX-MS is characterized by somewhat lower spatial resolution than HDX-NMR [although there are several computational strategies to extract single-residue protection factors from peptide-level HDX-MS data (Zhang et al., 2012; Kan et al., 2013; Gessner et al., 2017; Saltzberg et al., 2017; Babic et al., 2019; Skinner et al., 2019; Zhang, 2020; Salmas and Borysik, 2021; Smit et al., 2021)], mass spectrometry has several important advantages, such as no sample size limitations, no labeling required, low protein concentration, low costs, and highly automated processing (Stofella et al., 2022).
There are more than 540 studies describing the application of HDX-NMR for characterization of structure, dynamics, and interactions of proteins, investigation of protein folding, analysis of hydrogen bond formation within the intermediate on protein folding pathways, and evaluation of the global and local folding free energies in proteins. Similarly, more than 2200 studies represent the outputs of the HDX-MS utilization for similar purposes. Although the use of HDX-NMR dates back to the 1970s and 1980s, the corresponding studies were primarily focused on the analysis of ordered proteins and their folding and interactions. Based on the timing of its invention, HDX-MS, which began to replace HDX-NMR around the early 2000s, did not contribute much to the early studies of IDPs. However, the ability of this technique to follow the structural evolution of a protein from an unfolded to a folded state, providing insight into the flexibility of folding intermediates, was demonstrated in 1993 by Miranker et al. using cytochrome c folding as an example (Miranker et al., 1993). In 1999, Eyles et al. showed that unfolding of cellular retinoic acid-binding protein I (CRABP I) is characterized by the formation of transiently populated intermediate states (Eyles et al., 1999).
Furthermore, several recent studies show power of this technique in application to IDPs. For example, in 2006, Hamuro et al. reported the use of HDX-MS in analysis of a ligand-dependent transcription factor involved in glucose homeostasis and adipocyte differentiation, a nuclear receptor peroxisome proliferator-activated receptor gamma (PPARγ) (Hamuro et al., 2006). These authors showed that a ligand-free ligand binding domain (LBD) of PPARγ is significantly more flexible than the rest of the LBD, indicating that this binding pocket is intrinsically disordered in order to accommodate different ligands (Hamuro et al., 2006).
MacDonald et al. generated HDX-MS and NMR-based model for the tropomyosin-binding domain of the calponin homology-associated smooth muscle (CHASM) protein, where the CHASM intrinsically disordered N-terminal region interacts with the globular C-terminal calponin homology (CH) domain and the cooperativeness between these regions is required for CHASM binding to smooth muscle tropomyosin (MacDonald et al., 2012). Kumar et al. used HDX-MS to demonstrate that the structurally dynamic N-terminal domain of progesterone receptor is regulated through folding coupled to binding to the TATA-binding protein (TBP) (Kumar et al., 2013). In 2013, Diana Resetca and Derek J. Wilson provided a comprehensive review outlining the use of time-resolved electrospray ionization mass spectrometry (TRESI-MS) and HDX in analysis of rapid, activity-linked conformational transitions in proteins (Resetca and Wilson, 2013). In the same year, Deepa Balasubramaniam and Elizabeth A. Komives presented a comprehensive review discussing the utility of HDX-MS in discovery of IDRs in proteins, monitoring coupled folding and binding, and characterization of protein aggregates and oligomers (Balasubramaniam and Komives, 2013).
2.13.2 Ion mobility-mass spectrometry (IM-MS)
Ion mobility-mass spectrometry (IM-MS) is an analytical technique that separates ions based on their collision cross-section (CCS, which is a measure of the size and shape of ion that defines its collision rate) in the gas phase. In application to proteins, IM-MS provides information about the protein conformational landscape, and can be used for characterizing its size, shape, and dynamics, analyzing different conformational states of a protein, and tracking how it folds, interacts with other molecules, or responds to changes in its environment, such as salt concentration. Although biomolecule-focused IM-MS is one of the relatively recently commercialized MS-based analytical tools (Causon, 2021), this method represents a combination of two well-established technologies, ion mobility spectrometry (IMS) and MS, both with long individual histories of application.
IMS, which studies the movement of ions in gases under the influence of an electric field, is rooted in the seminal work of Joseph J. Thomson (1856–1940) and Ernest Rutherford (1871–1937), who investigated the relationship between electrical conductivity and gaseous media in 1896 (Thomson and Rutherford, 1896). However, movement of ions through a gas under the influence of an electric field was described for the first time by John Zeleny (1872–1951) in 1898, who indicated that “the positive and negative ions, which take part in the conduction of gases exposed to Röntgen rays, move with different velocities when in the same electric field” (Zeleny, 1898). MS was invented in 1913 by Joseph J. Thomson (1856–1940) as a method to discover non-radioactive isotopes by separating ions based on their mass-to-charge ratio (Thompson and Thomson, 1913), with the first fully functional mass spectrograph being built in 1919 by Francis William Aston (1877–1946) (Aston, 1919). For some time, these techniques developed in parallel. For example, IMS, which is characterized by high sensitivity and fast screening capabilities, became a major technology behind detection of explosives and chemical warfare agents in military operations, sporting events, and airports (Makinen et al., 2010; Dodds and Baker, 2019).
In its early years (until the 1940s), MS played crucial role in the field of physics being used to resolve questions about the fundamental nature of the atom, to discover and analyze isotopes and atomic weights, as well as to separate uranium-235 from the more abundant uranium-238 using “calutrons”, which were large, industrial-scale mass spectrometers (Griffiths, 2008; Smoluch and Silberring, 2019). At that time, MS technology was also utilized by industrial chemists, who knew the identities and structures of most of the molecules in their mixtures, and used MS for measuring the abundances of small hydrocarbons in process streams (to ensure the correct ratios of components for high-quality fuels and synthetic rubber production), improving quality control, and process monitoring (Griffiths, 2008; Smoluch and Silberring, 2019).
Powered by advances in commercial technology, mass spectrometry grew from a physics/industrial chemistry tool into a major method for organic chemistry by the mid-1950s. Its applications initially focused on hydrocarbon analysis, and later progressed to the study of complex organic molecule fragments (Griffiths, 2008). Application of MS to large polar organic molecules, such as proteins and other biomolecules, was originally limited by the fact that the ionization techniques available at the time were too violent (Clarke, 2019). The situation changed in the late 1980s with the advent of the so-called “soft” ionization techniques of electrospray ionization (ESI) (Fenn et al., 1989) and matrix-assisted laser desorption/ionization (MALDI) (Clarke, 2019). This eventually made MS the cornerstone technology in the field of proteomics (Aebersold and Mann, 2003; Malmstrom et al., 2006; Prakash et al., 2006; Prakash et al., 2007; Griffiths, 2008; Gstaiger and Aebersold, 2009; Bodenmiller and Aebersold, 2010; Pan et al., 2011; Bensimon et al., 2012; Sabido et al., 2012; Guo and Aebersold, 2023).
Combination of IMS with MS gave rise to the ion mobility mass spectrometry (IM-MS), which, being an electrophoretic gas-phase technique, provides a means for distinguishing and separation of analytes based on their charge (z), mass (m), and mobility (K) in a given buffer gas (Harvey et al., 2011). The invention of IM-MS is ascribed to Earl Wadsworth McDaniel (1926–1997), who, in the early 1960s, coupled a low-field ion mobility drift cell to a sector mass spectrometer (McDaniel et al., 1962). Some of the first studies discussing application of IM-MS include identification and mobility of ions in a Townsend discharge by time-resolved mass spectrometry (McAfee Jr and Edelson, 1963), analysis of the ionic polymerization of ethylene at near atmospheric pressures (Kebarle and Hogg, 1965), and analysis of ammonium ions produced by the alpha radiolysis of ammonia and their solvation in the gas phase by ammonia and water molecules (Hogg and Kebarle, 1965). Importantly, different forms of MS can be coupled with IMS (e.g., Fourier transform ion cyclotron resonance (ICR) (Solouki et al., 1994a; Solouki et al., 1994b;Bluhm et al., 2000), linear quadrupoles (Lawrence et al., 1991), magnetic sector spectrometers (Koizumi et al., 1980; Kemper and Bowers, 1990), time-of-flight (TOF) (Hoaglund et al., 1998; Henderson et al., 1999), and trapping devices (Valentine and Clemmer, 1997)), which dramatically increases the potential for analysis of complex samples (Harvey et al., 2011).
In application to proteins, IM-MS provides information about protein shape by measuring how fast protein ions move through a gas-filled chamber. This determines a rotationally averaged collision cross-section (CCSIM), which reflects the size of a protein and its 3D shape, thereby providing a structural snapshot. The technique is useful for distinguishing between different protein shapes, studying protein dynamics, and providing experimental data on shape and size that can enhance computational protein prediction (Turzo et al., 2022; Christofi and Barran, 2023). Furthermore, it was shown that IM-MS can be used for the analysis of protein conformation dynamics (Yang et al., 2023).
One of the first IM-MS-based analyses of protein structure was investigation of the conformations of cytochrome c ions (+8 through +18) in the gas phase by simultaneous ion-mobility and hydrogen−deuterium exchange measurements (Valentine and Clemmer, 1997). In 1998, IM-TOFMS analysis of bradykinin and ubiquitin ions formed by ESI revealed that it is possible to simultaneously record mass-resolved mobilities for all ions present in ESI distributions, thereby providing a means for direct measurement of conformer- and mass-to-charge (m/z)-resolved abundances for the total distribution of ions and generating 3D spectra that contain collision cross section, mass-to-charge, and ion abundance information (Hoaglund et al., 1998). In the late 1990s, research conducted in groups of David E. Clemmer (Clemmer et al., 1995; Clemmer and Jarrold, 1997; Hoaglund et al., 1998; Hoaglund-Hyzer et al., 1999), Michael T. Bowers (von Helden et al., 1995; Wyttenbach et al., 1996), Martin F. Jarrold (Hudgins et al., 1999; Mao et al., 1999; Jarrold, 2000), and David H. Russell (Gillig et al., 2000) demonstrated that IM-MS can be used to analyze the structures of peptides and proteins, as well as to study changes in the collision cross-section (CCS) of a protein (which is related to its size and shape) associated with the changes in its charge state.
Since IDPs have a range of flexible, unfolded conformations, this ability to measure different protein shapes was critical for their subsequent characterization by this technique. Because of the timing of the IM-MS development, this technique did not contribute to the discovery of the protein intrinsic disorder phenomenon and was not used in early studies on IDPs. However, it does represent a powerful tool for the structural characterization of IDPs and for the evaluation of the extent of disorder in proteins (Jurneczko et al., 2012; Beveridge et al., 2013; Beveridge et al., 2014; Beveridge et al., 2015; Stuchfield and Barran, 2018). It was also indicated that the applicability of IM-MS, which provides rotationally averaged CCSs of molecular ions that can be correlated with conformation, to the study of IDPs is further enhanced by the ability of this technique to examine absolute conformation(s), populations of conformation, and conformational changes (Jurneczko et al., 2012).
Several early studies of IDPs by IM-MS are outlined below. In 2004, Bernstein et al. conducted conformational analysis of human α-synuclein by IM-MS and nano-electrospray ionization-mass spectrometry (N-ESI-MS) and revealed the presence of stable compact and extended monomeric structures (Bernstein et al., 2004). IM-MS-based analysis of high mobility group A (HMGA) chromatic architectural factors serves as an important illustration of the power of this approach, which, in combination with limited proteolysis and electrospray ionization-mass spectrometry (ESI-MS), revealed that this protein can assume a compact form with the degree of compactness being dependent on the presence of the acidic tail and its constitutive phosphorylation (Maurizio et al., 2011). In 2011, Brocca et al. used IM-MS to investigate the conformational properties of an intrinsically disordered cell-cycle regulator from S. cerevisiae, Sic1, and its kinase-inhibitor domain, and showed that the isolated Sic1 KID populates collapsed states of different compactness, including a metastable, highly compact species (Brocca et al., 2011). Canon et al. investigated the folding of an intrinsically disordered human salivary proline-rich protein IB5 induced by binding of the epigallocatechin gallate (EgCG) tannin (Canon et al., 2011).
2.13.3 Native mass spectrometry (nMS)
Native mass spectrometry (nMS, which is a form of electrospray ionization mass spectrometry (ESI-MS)), being a relatively recent addition to the analytical toolbox of mass spectrometry, can be used to measure the size, stoichiometry, and interactions of macromolecules (such as proteins) in their native, folded state, thereby directly exploring the different conformational components in terms of geometry and structural compactness (Konijnenberg et al., 2015; Leney and Heck, 2017; Li et al., 2017; Natalello et al., 2017; van Dyck et al., 2017; Keener et al., 2021; Webb, 2022). Development of nMS is rooted in the development of the electrospray ionization (ESI), a soft ionization method permitting the transfer of intact, fragile macromolecules, such as proteins, from a solution into the gas phase for MS analysis. ESI was introduced in 1989 by John B. Fenn as “a powerful technique for producing intact ions in vacuo from large and complex species in solution”, thereby acting as a crucial means for MS-based analysis of large biomolecules (Fenn et al., 1989). In that study, it was also indicated that this technology allows obtaining mass spectra “for biopolymers including oligonucleotides and proteins, the latter having molecular weights up to 130,000, with as yet no evidence of an upper limit” (Fenn et al., 1989).
In 1990, a group of Brian T. Chait reported ESI-MS results for thirteen proteins with molecular masses ranging from 5000 to 77,000 Da (Chowdhury et al., 1990a), and in 1991, this group demonstrated that ESI-MS represents an effective method for probing conformational changes of proteins in solutions, since the charge state distribution (CSD) observed in an ESI mass spectrum provides insights into the protein’s solution-phase conformation (Katta and Chait, 1991). In the same year, the group of Joseph A. Loo also reported that the solvent-induced conformational changes of polypeptides can be probed by electrospray-ionization mass spectrometry (Loo et al., 1991). Following these initial observations, several groups expanded nMS (note that the term “native mass spectrometry” was coined in 2004 by Albert J. R. Heck and coauthors (Van den Heuvel and Heck, 2004)) into a powerful analytical technique for structural biology.
By preserving non-covalent interactions and analyzing intact complexes, nMS is an important analytical technique that provides details on protein folding, protein-protein interactions, protein-ligand binding, post-translational modifications, proteoform characterization, as well as complex heterogeneity, stability, and assembly, composition and identity of subunits, and assembly and dissociation pathways (Heck, 2008; Struwe and Robinson, 2019; Chen et al., 2021; Tao et al., 2021; Tamara et al., 2022). nMS can also be used for evaluation of the solvent accessible surface area (SASA) of a protein in solution by analyzing its charge state distribution (CSD) in the gas phase (Yang et al., 2025). In fact, a correlation between SASA and the average charge state (zav) of a protein derived from its CSD was independently established by Igor Kaltashov (Kaltashov and Mohimen, 2005; Abzalimov et al., 2007), Rita Grandori (Testa et al., 2011), and Carol V. Robinson (Hall et al., 2012). The foundation of CSD analysis is that the spatial arrangement of a protein in solution determines its ionization pattern during the electrospray process and subsequent transfer to the gas phase (Chowdhury et al., 1990b; Kaltashov et al., 2006; Benesch et al., 2007). Deconvolution of MS spectra by Gaussian fitting can identify main conformers present in sample (Dobo and Kaltashov, 2001; Borysik et al., 2004; Frimpong et al., 2010), and the average charge state and the relative abundance can then be retrieved for each conformer (Santambrogio et al., 2022), making possible SASA estimation (Kaltashov and Mohimen, 2005; Abzalimov et al., 2007; Testa et al., 2011; Hall et al., 2012).
The structural studies of proteins by nMS via CSD analysis started in 1990 (Chowdhury et al., 1990b; Katta and Chait, 1991; Loo et al., 1991), and the 1993 description of a high charge state of the intrinsically disordered metal-free apo-metallothionein and lower charge states of the folded metallothionein-metal complexes (Yu et al., 1993) likely represents the first report on application of this technique to the analysis of IDPs. Although similar to IM-MS, because of the timing of its invention and development, nMS was not broadly used in early IDP studies; nonetheless, this technique represents a powerful addition to the modern arsenal of IDP analytic tools. Several recent reviews outlined various applications of nMS in the IDP field (Testa et al., 2013; Natalello et al., 2017; Mitra, 2019; Santambrogio et al., 2019; Santambrogio et al., 2022; Reid et al., 2023; Osterholz et al., 2025).
2.14 Differential scanning calorimetry (DSC)
Being a tool that provides a thermodynamic profile of protein unfolding/denaturation process by measuring the heat absorbed or released by a protein sample as its temperature is changed, differential scanning calorimetry (DSC) is different from the biophysical technique discussed so far, all of which provide information on some structural features of a protein, such as its secondary structure, flexibility, hydrodynamic dimensions, or solvent/protease accessibility. Instead of looking at some peculiar structural features, DSC gives information on the stability of the overall structure or structural elements. In other words, scanning microcalorimetry is a technique that is capable of revealing folded polypeptide chains without showing preference for special structural features, thereby serving as a macroscopic indicator of folding (Privalov, 1979).
The idea of DSC was invented by Emmett S. Watson and Michael J. O'Neill in 1962 to measure the heat flow of solid materials and determine phase transitions, melting, crystallization, and heat capacity (Watson and O'Neill, 1962), whereas in 1964, Peter L. Privalov (1932–2020) and Jamlet (Damlet) R. Monaselidze created the first adiabatic scanning microcalorimeter to study biopolymers (Privalov et al., 1964). Since globally disordered proteins lack rigid tertiary structure, they do not reveal cooperative endothermic thermal denaturation, which is reflected as a positive peak characteristic for folded proteins (Privalov, 2009). However, IDPs exhibit characteristic values of specific heat capacity Cp, which are elevated at all temperatures due to greater solvent-exposed surface area, and which exceed the Cp values of folded proteins, and in the case of extensively disordered proteins, reaching the values characteristic for fully unfolded protein (Privalov and Makhatadze, 1990). Furthermore, due to the lack of a cooperative transition from a single, stable conformation, IDPs are characterized by the lack of a large unfolding enthalpy ΔH. These features, lack of heat absorption heat, lack of large ΔH, and high specific heat capacity values are considered as the DSC hallmarks of globally disordered proteins (Permyakov, 2012).
Based on the calorimetric analysis of several ribosomal proteins from E. coli (S4, S7, S8, S16, S18, and L11) conducted in 1978 by Khechinashvili et al., it was concluded that although S4, S7, S8, S16, and L11 possessed a cooperative tertiary structure in solution as evidenced by their cooperative melting, S18 did not show conformational transitions in the range of 10–100 °C, suggesting that this protein was disordered (Khechinashvili et al., 1978).
Colin Crane-Robinson and Peter L. Privalov revealed in 1983 that intrinsically disordered histones H1 and H5 (defined by these authors as “denatured random coil proteins”) can partially fold in the presence of salt, with folding taking place within their N-terminal 80-residue-long fragments that can be derived from both proteins by trypsin digestion in high salt (Crane-Robinson and Privalov, 1983). Analysis of these proteins by DSC revealed that the folded structures are located entirely within these peptides, whereas a thermorgram of the C-terminal domain of H1 contains no peak and shows high Cp values, thereby indicating that this domain is not folded (Crane-Robinson and Privalov, 1983). In 1990, Marie Paulsson and Petr Dejmek analyzed the calorimetric behavior of several whey proteins and pointed out that, contrarily to other whey proteins whose melting produced a distinct thermal peak, pure caseins showed no endotherms within the analyzed temperature range (25–140 °C), suggesting that thermal behavior of caseins is fundamentally different from the unfolding of globular whey proteins (Paulsson and Dejmek, 1990).
In 1996, Uversky et al. conducted the multiparametric analysis of circularly permuted dihydrofolate reductase variants from E. coli and revealed that these proteins behave as native molten globules, being compact disordered molecules with high degree of secondary structure but without rigid 3D-structure as evidenced by the lack of heat absorption peak in their DSC thermograms and the high Cp values. However, after addition of ligands, these permutants gained specific activity and the native-like structural properties, including a large change in their melting behavior, such as lower Cp values at low temperatures and the presence of a distinct heat absorption peak (Uversky et al., 1996). Based on these observations it was concluded that folding of permuted dihydrofolate reductase variants was terminated at the stage of the molten globule formation, whereas their interaction with ligands promoted structural adjustments and formation of active protein molecules, indicating ligand-induced transition from the molten globule to the native state (Uversky et al., 1996). In 1997, our comparative analysis of ligand-containing and ligand-free forms of human α-fetoproteins by several techniques including DSC revealed the release of ligands converted this protein into the molten globular form, which was evidenced by the absence of any visible heat absorption in the DSC thermograms and high Cp values (Uversky et al., 1997).
In 2003, Soulages et al. reported that a group 2 late embryogenesis abundant (LEA) protein from soybean does not display a cooperative unfolding transition upon heating in DSC experiments (Soulages et al., 2003). DSC-based analysis of the C-terminal domain of chicken gizzard caldesmon CaD, (CaD136, residues 636–771) and series of its single tryptophan mutants (W674A, W707A, and W737A) and a double tryptophan mutant (W674A/W707A) revealed that all these proteins are characterized by high specific heat capacity values (ranging from ∼2–3 J/(g K)) and the absence of distinct heat absorption peaks within the temperature region from 10 to 100 °C suggested that their structure is predominantly unfolded (Permyakov et al., 2015).
2.15 High-speed atomic force microscopy (AFM)
Atomic force microscopy (AFM) is a very-high-resolution imaging technique (in some instances, it can have a resolution on the order of fractions of a nanometer) based on using a mechanical probe consisting of a cantilever and a sharp tip, which can be modified in many ways to investigate surface properties, to gather information by “sensing”, “feeling”, or “touching” the surface of a sample. AFM was invented in 1985 by IBM scientists Gerd Binnig, Calvin Forrest Quate (1923–2019), and Christoph Gerber, who reported a development of a new type of microscope, which, being a combination of the principles of the scanning tunneling microscope [STM that was invented in 1981 by Gerd Binnig, Heinrich Rohrer (1933–2013), Christoph Gerber, and Edi Weibel (Binnig et al., 1982)] and the stylus profilometer, achieved a lateral resolution of 30 Å and a vertical resolution less than 1 Å (Binnig et al., 1986). The major difference between STM and AFM is in the basic principles of their operation, where STM measures a tunneling current between a conductive tip and sample (thus being limited to the analysis of conductive and semiconducting samples), whereas AFM measures forces, such as van der Waals forces, between a tip and the surface and can be used for analysis of any material, conductive or not. Since AFM can visualize and manipulate individual molecules, study their properties, and measure their interactions, it is considered as a single-molecule technique.
Biomedical applications of AFM, which can operate in ambient air, high vacuum, and liquid environments, are centered at topographic imaging [e.g., it can resolve DNA double helix (Mou et al., 1995) or probe structure and dynamics of nucleosomes (Stumme-Diers et al., 2019), or visualize and provide topological information about amyloid fibrils (Adamcik and Mezzenga, 2018; Aubrey et al., 2020; Lutter et al., 2020; Lutter et al., 2022), or show the surface structure of purple membranes (Worcester et al., 1988) and the extracellular surface of the gap junction (Hoh et al., 1991; Hoh et al., 1993), or generate molecular-resolution images of individual proteins (Hansma et al., 1991; Arakawa et al., 1992)], force measurement [e.g., it can detect interaction between histones and nucleosomes (Stormberg et al., 2021; Rafa et al., 2024)], and manipulation [e.g., can be used to orient protein aggregates (Lea et al., 1992)] (Xia and Youcef-Toumi, 2022). Introduction of the amplitude modulation (AM) mode (also known as tapping mode) in 1993, where the cantilever is oscillated in the Z-direction at (or near) resonant frequency, and this oscillation amplitude is measured to detect the tip-sample interaction, facilitated the observation of biomolecular processes allowing analysis of molecules weakly attached to a substrate surface (Zhong et al., 1993).
Current literature on the utilization of AFM in protein-related studies is vast (with almost 18,000 publications in PubMed mentioning atomic force microscopy and protein) and coverage of even a small fraction of this set of papers is outside the scope of this review. Although almost from the time of its inception, AFM was successfully used in structural analysis of ordered proteins, utilization of this tool for structural and dynamics characterization of IDPs was originally limited due to the fact that IDPs do not have stable 3D structure but dynamically sample a multitude of conformational states. Since it takes at least 30 s to capture an image using the AM mode, the AFM performance of was obviously too slow to capture dynamic biomolecular processes or provide reliable images of moving objects.
The situation changed due to the invention of small cantilevers with high resonant frequencies and small spring constants, as well as an optical beam deflection (OBD) detector for small cantilevers independently by the groups of (Viani et al., 1999) and Toshio Ando (Ando et al., 2001). The resulting AFM “can capture a 100 × 100 pixel2 image within 80 ms and can therefore generate a movie consisting of many successive images (80-ms intervals) of a sample in aqueous solution”, a dramatic acceleration in comparison with the original AFM (Ando et al., 2001). It took a few more years and several additional inventions to establish high-speed AFM (HS-AFM) suitable for nano-visualization of dynamic biomolecular processes (Ando et al., 2008). Modern HS-AFM can image protein molecules at 10–20 frames per second. Among impressive illustrations of the capability of HS-AFM “to visualize the dynamic behavior of structured proteins during their functional activity at 2–3 nm lateral and ∼0.1 nm vertical spatial resolution and at ∼100 ms temporal resolution under near-physiological conditions” (Ando, 2022) are a video of myosin V walking along actin filaments (Kodera et al., 2010), representation of the rotary catalysis of a rotorless adenosine triphosphate (ATP)–driven motor F1 (Uchihashi et al., 2011), and visualization of the dynamic structural states of ClpB involved in its disaggregation function (Uchihashi et al., 2018). More examples of HS-AFM imaging studies on proteins and cells can be found in a comprehensive review by Toshio Ando, Takayuki Uchihashi, and Simon Scheuring (Ando et al., 2014).
Although HS-AFM was invented after the IDP field was established, this technique provides unique structural and dynamic information at the single molecule level, generating actual movies showing how IDP moves and directly observing individual protein molecules in action at high spatiotemporal resolution (Ando et al., 2013). Some of the illustrative examples of information generated by HS-AFM for IDPs are outlined below. HS-AFM captured images of heterodimeric FACT (facilitates chromatin transcription) protein at rates of 5–17 frames per second and clearly revealed two distinct wiggling tail-like segments that protrude from the main body of FACT, have different contour lengths (17.5 and 27.5 nm on average), fluctuate in position, and have similar macroscopic flexibility, being more structurally relaxed than random coils (Miyagi et al., 2008).
A subsequent study revealed that a small globule temporally appears but quickly vanishes within each mobile tail-like image of FACT, corresponding to the IDR containing high-mobility-group domain, with the lifespan of the globule increasing upon phosphorylation (Hashimoto et al., 2013). The intrinsically disordered interdomain region between the helicase and nuclease domains of an archaeal Hef protein from Thermococcus kodakarensis was shown to be involved in interactions with multiple proteins including PCNA1 and a RecJ-like protein, suggesting that Hef acts as a scaffold and uses this IDR for sequential interaction with several proteins to control the repair pathway at the stalled fork (Ishino et al., 2014).
The flagellar hook-length control protein FliK from Salmonella enterica serovar Typhimurium was shown by HS-AFM to adopt a shape of two balls linked by a flexible string (Kodera et al., 2015). In 2016, Sakiyama et al. analyzed by HS-AFM structural dynamics of intrinsically disordered, barrier-forming phenylalanine-glycine nucleoporins (FG Nups) within the nuclear pore complexes (NPCs) from the Xenopus laevis oocyte and showed that FG Nups are highly flexible and dynamically fluctuating chains that rapidly elongate and retract, consistent with the diffusive motion of tethered polypeptide chains (Sakiyama et al., 2016). Finally, it was emphasized that “successive HS-AFM images of an IDP molecule can not only identify constantly folded and constantly disordered regions in the molecule, but can also document disorder-to-order transitions. Moreover, the number of amino acids contained in these disordered regions can be roughly estimated, enabling a semiquantitative, realistic description of the dynamic structure of IDPs” (Kodera et al., 2021)
Finally, an example of successful application of AFM for the characterization of IDP in the “pre-IDP” period is given by the 1997 report of H G. Brown and Jan H. Hoh, who showed that the neurofilament sidearms form an entropic brush required for maintaining the interfilament spacing (Brown and Hoh, 1997). In 2001, Li et al. conducted conformational analysis of the human cardiac titin PEVK region (186-residue-long) and showed that conformational ensemble populated by this protein is characterized by a wide range of elastic conformations with end-to-end distances ranging from 9 to 24 nm and persistence lengths from 0.4 to 2.5 nm (Li H. et al., 2001).
3 A multiparametric approach in structural biology: the power of integration
Due to their conformational flexibility and lack of stable 3D structures, IDPs/IDRs present a unique challenge for detailed structural analysis. They are characterized by extreme spatiotemporal heterogeneity, as instead of possessing a single unique structure, they exist as dynamic, interconverting ensembles of multiple conformations. This presents an interesting conundrum: individual ordered proteins possess unique, specific 3D-structures, yet their folding and final shapes are governed by a limited set of universal physicochemical principles, allowing for a seemingly infinite variety of protein structures to be classified and systematically studied. On the contrary, individual IDPs/IDRs are disordered differently, and their different degrees of disorder make each IDP/IDR unique. In other words, one can rephrase the famous opening line of the “Anna Karenina” novel by Leo Tolstoy to read: “All ordered proteins are alike; each intrinsically disordered protein is disordered in its own way”. In other words, this defines the “Anna Karenina” principle for ordered proteins, which must satisfy a uniform set of conditions to be “successful” and functional, whereas IDPs, being “disordered in their own way,” use their unique dynamic ensembles for function.
Furthermore, structural analysis of IDPs/IDRs that rapidly fluctuate between a wide range of conformations in a dynamic ensemble, rather than settling into a single, rigid structure cannot be conducted by X-ray crystallography, which, for an ordered protein, produces a single time- and space-averaged model. This task requires a combination of specialized techniques developed for analysis of specific structural characteristics. In other words, integrative structural analysis, which combines multiple experimental and computational approaches, is the most powerful strategy for accurately characterizing the dynamic and fluctuating landscape of IDPs/IDRs. Since each method typically provides unique information about a specific properties of a protein over different timescales and length scales, the use of such multiparametric approach allows avoiding “five blind men and elephant” situation (this analogy is based on the ancient parable of the blind men and an elephant, where each person feels a different part of the animal and comes to a completely different conclusion about what an elephant is) (Uversky, 2015a).
Typically, a single technique provides specific and limited information about a particular “piece of the elephant” (e.g., one technique might describe the average overall shape, while another gives data on the local motion of a specific segment). Therefore, the use of a multiparametric approach, known as integrative structural biology, is essential for piecing together a more complete picture of an IDP. Figure 3 illustrates this idea by showing how a combination of various tools creates a possibility to see the “whole elephant” by integrating the different structural details of IDPs, such as shape, packing, secondary structure, flexibility, hydrodynamic properties, solvent accessibility, conformational heterogeneity, and self-assembly.
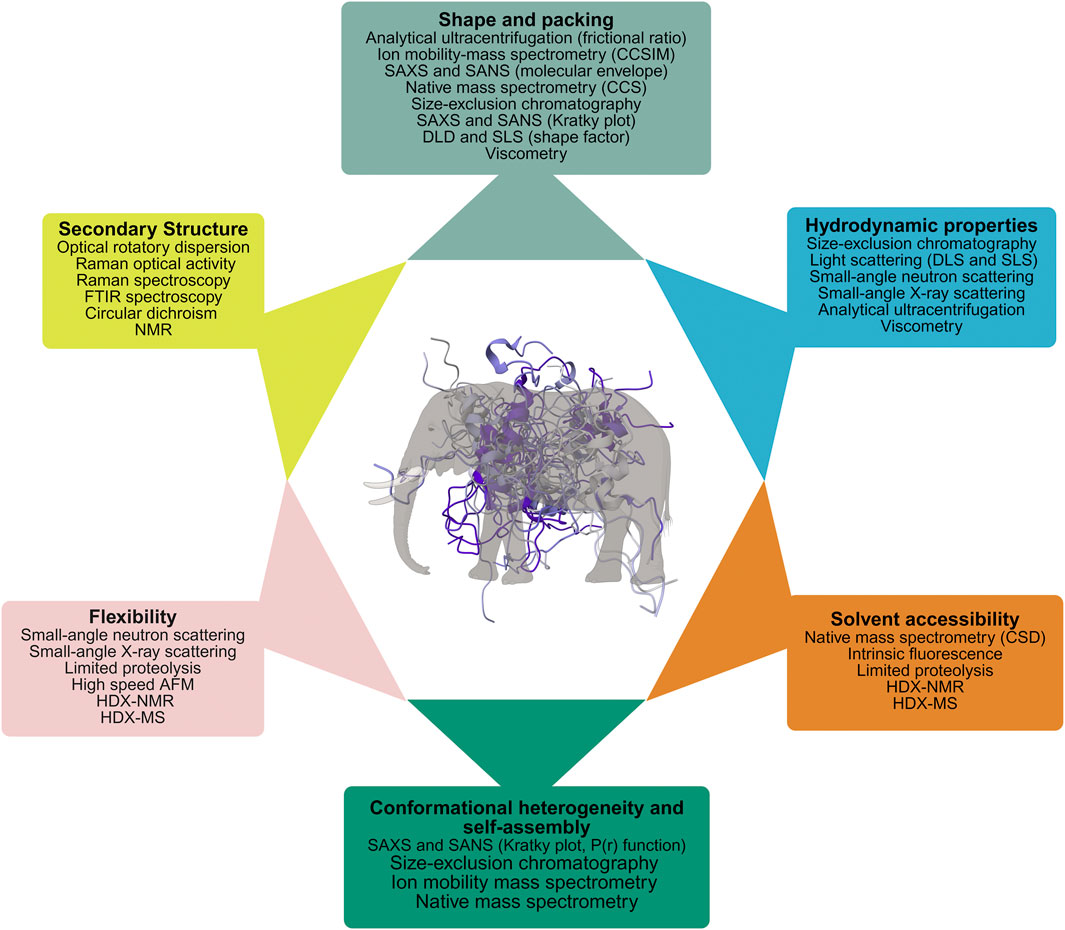
Figure 3. Multiparametric approach as a tool to see the “whole elephant”. A fuzzy structure of an IDP (shown in the middle) can be evaluated by different biophysical techniques sensitive to different structural features of the protein.
One should also keep in mind that the use of various tools for the analysis of each of the individual structural features of an IDP opens additional ways of getting more reliable information about this “fuzzy elephant”. This is because different tools are not only sensitive to different structural characteristics of the protein but also have different averaging properties. For example, some techniques (which besides NMR and MD simulations include such powerful time-averaging techniques as HDX-MS, DLS, SLS, viscometry, SAXS, SANS, FRET, and FCS), capture structural information that is averaged over time. Other methods capture a snapshot of the entire population of molecules at a single point in time, revealing the distribution of different conformations. These ensemble-averaging techniques include NMR, CD, FTIR, Raman spectroscopy, ROA, AUC, smFRET, fluorescence anisotropy, REES, SAXS, SANS, HDX-MS, native-MS, and ion mobility-MS. Note that although HDX-MS is included among the time-averaging techniques, it can also be implemented by pulse labeling in a time-resolved fashion. Also, while HDX-MS, native-MS, and ion mobility-MS are listed as ensemble-averaging techniques, their actual strength is to sort ions and measure properties of each singly detected ion.
It is important to remember that the image generated for an IDP by integration of data generated by multiple complementary experimental techniques is admittedly fuzzy. This is not surprising taking into account the highly flexible nature of IDPs/IDRs, which are best described as a “protein clouds”, and the fact that the utilized ensemble low-resolution techniques measure signals representing an average of all the states present in the conformational ensemble, and thereby conceal information about individual structures and their specific features. However, this fuzziness is not an experimental error but is instead a true reflection of the dynamic, ensemble-based structure of the protein. The information concealed by the averaging technique(s) are the specific snapshots of single transient conformations, which would exist for only a fraction of a second. Furthermore, there are far more possible conformations for an IDP than there are experimentally determined restraints, making the problem of building a complete ensemble mathematically “underdetermined”.
4 Looking at the “fuzzy herd of fuzzy elephants”: low-resolution techniques for analysis of membraneless organelles
The modern field of IDPs is dominated by the analysis of their roles in liquid-liquid phase separation (LLPS) and biogenesis of biomolecular condensates or membraneless organelles (MLOs) (Uversky et al., 2015; Mompean and Laurents, 2017; Uversky, 2017a; Uversky, 2017c; Cuevas-Velazquez and Dinneny, 2018; Darling et al., 2018; Drino and Schaefer, 2018; Owen and Shewmaker, 2019; Pancsa et al., 2019; Turoverov et al., 2019; Uversky, 2019;Martin and Holehouse, 2020; Murthy and Fawzi, 2020; Borcherds et al., 2021; Uversky, 2021; Antifeeva et al., 2022; Darling and Uversky, 2023). This obviously raises a question on the applicability of low-resolution techniques for the analysis of these phenomena. Since the study of LLPS and MLOs/BCs began after the IDP concept was generally accepted, a thorough consideration of this very important point is outside the scopes of this historical perspective. However, a very brief discussion of some of the low-resolution techniques used in LLPS/MLO analyses is provided below.
Being typically in the micrometer to sub-micrometer size range, MLOs are definitely microscopic objects. However, they are larger than a single protein by several orders of magnitude. MLOs/BCs are stabilized by weak, transient, multivalent, “touch-and-go” interactions (of palpation type) between IDPs and other biomolecules. In other words, instead of forming a single rigid complex, MLO formation involves multiple, individually weak interaction sites that are constantly associating and dissociating. This creates a highly adaptable and context-dependent molecular assembly, which is formed, dissolved, and reorganized through LLPS, is characterized by a fluid-like nature with specific solvent properties, and has the collective behavior, such as response to cellular stimuli. Therefore, MLOs represent a kind of enormous, “fuzzy herd of fuzzy elephants running within a colossal dust cloud”. Such metaphorical view of MLOs clearly emphasizes the complexity of their analysis, where one needs to look at the shape and behavior of the whole herd and study its response to various stimuli, and on another side should have a possibility to identify individual elephants, follow their behavior, interactions, and responses, and also look at all this within the cloud of dust. Therefore, study such systems requires principally different techniques to be able to observe both the “forest” (the entire MLO or herd of elephants) and the “trees” (the individual elephants/molecules) at the same time.
Clearly, not all the low-resolution techniques considered in this study are suitable for such analyses. However, some ensemble techniques, such as CD (Cinar et al., 2018; Chen and Huang, 2020; Amiri et al., 2025), FTIR (Cinar et al., 2018; Edun et al., 2020; Amiri et al., 2025), and Raman spectroscopy (Murthy et al., 2019; Agarwal et al., 2021; Avni et al., 2022), as well as analytical ultracentrifugation (AUC) (Mitrea et al., 2018), SAXS (Mitrea et al., 2018; Martin et al., 2021; Koning et al., 2025), SANS (Koning et al., 2025), and dynamic light scattering (DLS) (Hochmair et al., 2023; Amiri et al., 2025) were successfully used to study various structural features of IDPs undergoing LLPS.
Single-molecule fluorescence-based techniques are well suited for conducting such kind of studies (Nasir et al., 2019). For example, using single molecule fluorescence resonance energy transfer (smFRET) Joshi et al. dissected critical molecular events associated with phase separation of an intrinsically disordered prion-like low-complexity domain of Fused in Sarcoma (FUS), revealed the coexistence of two conformationally distinct subpopulations in the monomeric forms, and described conformational shapeshifting events associated with phase separation of this protein (Joshi et al., 2023). (Joshi et al., 2023)Wen et al. used smFRET in combination with molecular dynamics simulations to demonstrate that the microtubule-associated protein tau undergoes conformational transitions from compact to extended states during LLPS (Wen et al., 2025).
It was pointed out that FCS, being a single-molecule fluorescence technique, can be used in the analysis of physical (e.g., diffusional coefficient, hydrodynamic radius) and chemical (e.g., concentration, binding affinity) properties of fluorescent or fluorescently labeled molecules (Wang et al., 2022). Currently, FCS is increasingly adopted to study LLPS and MLOs. For example, in 2020, Peng et al. showed that dual-color fluorescence cross-correlation spectroscopy (dcFCCS) can capture formation of nanoscale condensates beyond the detection limit of conventional fluorescence microscopy (Peng et al., 2020), whereas Yamamoto et al. revealed that polarization-dependent fluorescence correlation spectroscopy (Pol-FCS) can be used for evaluation of macromolecular crowding and simultaneously measure the relaxation times of rotational and translational diffusion of fluorescent molecules at the same position, even in living cells (Yamamoto et al., 2021). Recently, Wang et al. provided a comprehensive review summarizing FCS applications in the LLPS studies in live cells and in aqueous solutions (Wang et al., 2022). These authors also emphasized that the FCS-based techniques, such as fluorescence auto-correlation spectroscopy (FACS) and fluorescence cross-correlation spectroscopy (FCCS), being combined, can be used in quantitative analysis of molar concentration, diffusion coefficient and hydrodynamic radius, homo- or hetero-interaction, dissociation constant, and fluorescence brightness (Wang et al., 2022).
In conclusion, it is important to emphasize that almost none of the aforementioned techniques can be used for studying IDPs in crowded, condensed phases without at least some adaptations. Furthermore, methods to study MLOs must be carefully selected and amended based on the stage of the MLO life. This highlights the need for specialized and integrative approaches in biophysical research to address the complexities of these dynamic biological structures. Obviously, all these and related subjects deserve more focused analysis and should be considered in a dedicated review.
5 Concluding remarks: a blurry view of fuzzy objects
To sum up, the observations presented here clearly show that low-resolution techniques were crucial for assembly of information leading to the establishment of the field of protein intrinsic disorder. In fact, these tools helped with the accumulation of the “critical mass” of data to convincingly show that structure-less biologically active proteins are rather common, emphasizing that they are not the mere flukes or mistakes of nature, but are crucial constituents of the protein universe. They also gave researchers a possibility to see these fuzzy objects. Note that the IDPs/IDRs are fuzzy by default, as they exist as highly dynamic conformational ensembles; i.e., highly dynamic sets of many rapidly interconverting, structurally distinct conformations, and this structural fuzziness (inherent structural heterogeneity), is often not a limitation but a fundamental aspect of their functions. Admittedly, the view created by these low-resolution techniques is blurry and does not come even close to the sharp static images generated for structures of ordered proteins by high-resolution techniques. However, even a blurry view of an IDP/IDR provides an undeniably real depiction of these important proteins/regions. This ability to visualize a physical entity, even imperfectly, is a significant advance over the previous “invisibility” of unresolved structures in electron density maps: a fuzzy image of an IDP/IDR is still more informative than having no structural data at all.
Author contributions
VU: Conceptualization, Investigation, Validation, Writing – original draft, Writing – review and editing.
Funding
The authors declare that no financial support was received for the research and/or publication of this article.
Conflict of interest
The author declares that the research was conducted in the absence of any commercial or financial relationships that could be construed as a potential conflict of interest.
Generative AI statement
The authors declare that no Generative AI was used in the creation of this manuscript.
Any alternative text (alt text) provided alongside figures in this article has been generated by Frontiers with the support of artificial intelligence and reasonable efforts have been made to ensure accuracy, including review by the authors wherever possible. If you identify any issues, please contact us.
Publisher’s note
All claims expressed in this article are solely those of the authors and do not necessarily represent those of their affiliated organizations, or those of the publisher, the editors and the reviewers. Any product that may be evaluated in this article, or claim that may be made by its manufacturer, is not guaranteed or endorsed by the publisher.
References
Abercrombie, B. D., Kneale, G. G., Crane-Robinson, C., Bradbury, E. M., Goodwin, G. H., Walker, J. M., et al. (1978). Studies on the conformational properties of the high-mobility-group chromosomal protein HMG 17 and its interaction with DNA. Eur. J. Biochem. 84, 173–177. doi:10.1111/j.1432-1033.1978.tb12154.x
Abzalimov, R. R., Dubin, P. L., and Kaltashov, I. A. (2007). Glycosaminoglycans as naturally occurring combinatorial libraries: developing a mass spectrometry-based strategy for characterization of anti-thrombin interaction with low molecular weight heparin and heparin oligomers. Anal. Chem. 79, 6055–6063. doi:10.1021/ac0710432
Ackers, G. K. (1967). Molecular Sieve Studies of Interacting Protein Systems. J. Biol. Chem. 242, 3026–3034. doi:10.1016/s0021-9258(18)95928-4
Ackers, G. K. (1970). Analytical gel chromatography of proteins. Adv. Protein Chem. 24, 343–446. doi:10.1016/s0065-3233(08)60245-4
Adamcik, J., and Mezzenga, R. (2018). Amyloid Polymorphism in the Protein Folding and Aggregation Energy Landscape. Angew. Chem. Int. Ed. 57, 8370–8382. doi:10.1002/anie.201713416
Adler, A. J., Greenfield, N. J., and Fasman, G. D. (1973). “Circular dichroism and optical rotatory dispersion of proteins and polypeptides,” in Methods in enzymology (Elsevier), 675–735.
Aebersold, R., and Mann, M. (2003). Mass spectrometry-based proteomics. Nature 422, 198–207. doi:10.1038/nature01511
Agarwal, A., Rai, S. K., Avni, A., and Mukhopadhyay, S. (2021). An intrinsically disordered pathological prion variant Y145Stop converts into self-seeding amyloids via liquid-liquid phase separation. Proc. Natl. Acad. Sci. U. S. A. 118, e2100968118. doi:10.1073/pnas.2100968118
Allan, J., Hartman, P. G., Crane-Robinson, C., and Aviles, F. X. (1980). The structure of histone H1 and its location in chromatin. Nature 288, 675–679. doi:10.1038/288675a0
Amiri, M., Masroor, M. J., Shahangian, S. S., Sajedi, R. H., and Ranjbar, B. (2026). Mapping the structural changes of LCD-TDP43 during the liquid-liquid phase separation by different spectroscopic platforms. Biophys. Chem. 328, 107525. doi:10.1016/j.bpc.2025.107525
Ando, T. (2022). Functional Implications of Dynamic Structures of Intrinsically Disordered Proteins Revealed by High-Speed AFM Imaging. Biomolecules 12, 1876. doi:10.3390/biom12121876
Ando, T., Kodera, N., Takai, E., Maruyama, D., Saito, K., and Toda, A. (2001). A high-speed atomic force microscope for studying biological macromolecules. Proc. Natl. Acad. Sci. 98, 12468–12472. doi:10.1073/pnas.211400898
Ando, T., Uchihashi, T., and Fukuma, T. (2008). High-speed atomic force microscopy for nano-visualization of dynamic biomolecular processes. Prog. Surf. Sci. 83, 337–437. doi:10.1016/j.progsurf.2008.09.001
Ando, T., Uchihashi, T., and Kodera, N. (2013). High-speed AFM and applications to biomolecular systems. Annu. Rev. Biophys. 42, 393–414. doi:10.1146/annurev-biophys-083012-130324
Ando, T., Uchihashi, T., and Scheuring, S. (2014). Filming biomolecular processes by high-speed atomic force microscopy. Chem. Rev. 114, 3120–3188. doi:10.1021/cr4003837
Andrews, P. (1965). The gel-filtration behaviour of proteins related to their molecular weights over a wide range. Biochem. J. 96, 595–606. doi:10.1042/bj0960595
Anson, M., and Mirsky, A. (1934). The equilibria between native and denatured hemoglobin in salicylate solutions and the theoretical consequences of the equilibrium between native and denatured protein. J. General Physiology 17, 399–408. doi:10.1085/jgp.17.3.399
Antifeeva, I. A., Fonin, A. V., Fefilova, A. S., Stepanenko, O. V., Povarova, O. I., Silonov, S. A., et al. (2022). Liquid-liquid phase separation as an organizing principle of intracellular space: overview of the evolution of the cell compartmentalization concept. Cell Mol. Life Sci. 79, 251. doi:10.1007/s00018-022-04276-4
Arago, D. (1811). Mémoire sur une modification remarquable qu’éprouvent les rayons lumineux dans leur passage à travers certains corps diaphanes et sur quelques autres nouveaux phénomènes d’optique. Mémoires de la Cl. des Sci. Mathématiques Physiques de l’Institut Impérial de France 12, 93.
Arakawa, H., Umemura, K., and Ikai, A. (1992). Protein images obtained by STM, AFM and TEM. Nature 358, 171–173. doi:10.1038/358171a0
Arnone, A., Bier, C. J., Cotton, F. A., Day, V. W., Hazen, E. E., Richardson, D. C., et al. (1971). A High Resolution Structure of an Inhibitor Complex of the Extracellular Nuclease of Staphylococcus aureus. J. Biol. Chem. 246, 2302–2316. doi:10.1016/s0021-9258(19)77221-4
Arya, S., and Mukhopadhyay, S. (2014). Ordered water within the collapsed globules of an amyloidogenic intrinsically disordered protein. J. Phys. Chem. B 118, 9191–9198. doi:10.1021/jp504076a
Aston, F. W. (1919). LXXIV. A positive ray spectrograph. Lond. Edinb. Dublin Philosophical Mag. J. Sci. 38, 707–714. doi:10.1080/14786441208636004
Aswad, D. W., and Greengard, P. (1981). A specific substrate from rabbit cerebellum for guanosine 3 ‘: 5 ‘-monophosphate-dependent protein kinase. I. Purification and characterization. J. Biol. Chem. 256, 3487–3493. doi:10.1016/s0021-9258(19)69635-3
Aubrey, L. D., Blakeman, B. J. F., Lutter, L., Serpell, C. J., Tuite, M. F., Serpell, L. C., et al. (2020). Quantification of amyloid fibril polymorphism by nano-morphometry reveals the individuality of filament assembly. Commun. Chem. 3, 125. doi:10.1038/s42004-020-00372-3
Aue, W., Bartholdi, E., and Ernst, R. R. (1976). Two-dimensional spectroscopy. Application to nuclear magnetic resonance. J. Chem. Phys. 64, 2229–2246. doi:10.1063/1.432450
Avni, A., Joshi, A., Walimbe, A., Pattanashetty, S. G., and Mukhopadhyay, S. (2022). Single-droplet surface-enhanced Raman scattering decodes the molecular determinants of liquid-liquid phase separation. Nat. Commun. 13, 4378. doi:10.1038/s41467-022-32143-0
Babić, D., Kazazić, S., and Smith, D. M. (2019). Resolution of protein hydrogen/deuterium exchange by fitting amide exchange probabilities to the peptide isotopic envelopes. Rapid Commun. Mass Spectrom. 33, 1248–1257. doi:10.1002/rcm.8460
Balasubramaniam, D., and Komives, E. A. (2013). Hydrogen-exchange mass spectrometry for the study of intrinsic disorder in proteins. Biochimica Biophysica Acta (BBA) - Proteins Proteomics 1834, 1202–1209. doi:10.1016/j.bbapap.2012.10.009
Balu, R., Mata, J. P., Knott, R., Elvin, C. M., Hill, A. J., Choudhury, N. R., et al. (2016). Effects of Crowding and Environment on the Evolution of Conformational Ensembles of the Multi-Stimuli-Responsive Intrinsically Disordered Protein, Rec1-Resilin: A Small-Angle Scattering Investigation. J. Phys. Chem. B 120, 6490–6503. doi:10.1021/acs.jpcb.6b02475
Barbar, E., and Nyarko, A. (2015). Polybivalency and disordered proteins in ordering macromolecular assemblies. Seminars Cell and Dev. Biol. 37, 20–25. doi:10.1016/j.semcdb.2014.09.016
Barron, L., and Buckingham, A. (1971). Rayleigh and Raman scattering from optically active molecules. Mol. Phys. 20, 1111–1119. doi:10.1080/00268977100101091
Barron, L., Bogaard, M., and Buckingham, A. (1973). Raman scattering of circularly polarized light by optically active molecules. J. Am. Chem. Soc. 95, 603–605. doi:10.1021/ja00783a058
Barron, L. D., Hecht, L., Blanch, E. W., and Bell, A. F. (2000). Solution structure and dynamics of biomolecules from Raman optical activity. Prog. Biophysics Mol. Biol. 73, 1–49. doi:10.1016/s0079-6107(99)00017-6
Barron, L. D., Hecht, L., Mccoll, I. H., and Blanch, E. W. (2004). Raman optical activity comes of age. Mol. Phys. 102, 731–744. doi:10.1080/00268970410001704399
Barth, A. (2007). Infrared spectroscopy of proteins. Biochimica Biophysica Acta (BBA)-Bioenergetics 1767, 1073–1101. doi:10.1016/j.bbabio.2007.06.004
Bartley, J., and Chalkley, R. (1970). Further studies of a thymus nucleohistone-associated protease. J. Biol. Chem. 245, 4286–4292. doi:10.1016/s0021-9258(19)63792-0
Baskakov, I. V., Kumar, R., Srinivasan, G., Ji, Y.-S., Bolen, D. W., and Thompson, E. B. (1999). Trimethylamine N-oxide-induced cooperative folding of an intrinsically unfolded transcription-activating fragment of human glucocorticoid receptor. J. Biol. Chem. 274, 10693–10696. doi:10.1074/jbc.274.16.10693
Baumann, C., Beil, A., Jurt, S., Niederwanger, M., Palacios, O., Capdevila, M., et al. (2017). Structural Adaptation of a Protein to Increased Metal Stress: NMR Structure of a Marine Snail Metallothionein with an Additional Domain. Angew. Chem. Int. Ed. 56, 4617–4622. doi:10.1002/anie.201611873
Becquerel, E. (1843). Des effets produits sur les corps par les rayons solaires Ann. de Chimie de Physique, Ser. 3 (9), 257–322.
Becquerel, E. (1859). Recherches sur divers effets lumineux qui résultent de l'action de la lumière sur les corps. Ann. de Chimie de Physique, Ser. 3 (55), 5–100.
Belmont, L. D., and Mitchison, T. J. (1996). Identification of a protein that interacts with tubulin dimers and increases the catastrophe rate of microtubules. Cell 84, 623–631. doi:10.1016/s0092-8674(00)81037-5
Benesch, J. L., Ruotolo, B. T., Simmons, D. A., and Robinson, C. V. (2007). Protein complexes in the gas phase: technology for structural genomics and proteomics. Chem. Rev. 107, 3544–3567. doi:10.1021/cr068289b
Bennett, W. S., Huber, R., and Engel, J. (1984). Structural and functional aspects of domain motions in proteins. Crit. Rev. Biochem. 15, 291–384. doi:10.3109/10409238409117796
Bensimon, A., Heck, A. J., and Aebersold, R. (2012). Mass spectrometry-based proteomics and network biology. Annu. Rev. Biochem. 81, 379–405. doi:10.1146/annurev-biochem-072909-100424
Benson, E., and Linderstrøm-Lang, K. (1959). Deuterium exchange between myoglobin and water. Biochimica Biophysica Acta 32, 579–581. doi:10.1016/0006-3002(59)90649-3
Berger, A., and Linderstrøm-Lang, K. (1957). Deuterium exchange of poly-DL-alanine in aqueous solution. Archives Biochem. Biophysics 69, 106–118. doi:10.1016/0003-9861(57)90478-2
Berjot, M., Marx, J., and Alix, A. (1987). Determination of the secondary structure of proteins from the Raman amide I band: the reference intensity profiles method. J. Raman Spectrosc. 18, 289–300. doi:10.1002/jrs.1250180411
Berland, K. M. (2004). Fluorescence correlation spectroscopy: a new tool for quantification of molecular interactions. Methods Mol. Biol. Clift. N.J. 261, 383–398. doi:10.1385/1-59259-762-9:383
Bernado, P., and Svergun, D. I. (2012). Structural analysis of intrinsically disordered proteins by small-angle X-ray scattering. Mol. Biosyst. 8, 151–167. doi:10.1039/c1mb05275f
Bernado, P., Mylonas, E., Petoukhov, M. V., Blackledge, M., and Svergun, D. I. (2007). Structural characterization of flexible proteins using small-angle X-ray scattering. J. Am. Chem. Soc. 129, 5656–5664. doi:10.1021/ja069124n
Bernal, J. D., and Crowfoot, D. (1934). X-ray photographs of crystalline pepsin. Nature 133, 794–795. doi:10.1038/133794b0
Bernstein, S. L., Liu, D., Wyttenbach, T., Bowers, M. T., Lee, J. C., Gray, H. B., et al. (2004). α-Synuclein: Stable compact and extended monomeric structures and pH dependence of dimer formation. J. Am. Soc. Mass Spectrom. 15, 1435–1443. doi:10.1016/j.jasms.2004.08.003
Beveridge, R., Chappuis, Q., Macphee, C., and Barran, P. (2013). Mass spectrometry methods for intrinsically disordered proteins. Analyst 138, 32–42. doi:10.1039/c2an35665a
Beveridge, R., Covill, S., Pacholarz, K. J., Kalapothakis, J. M., Macphee, C. E., and Barran, P. E. (2014). A mass-spectrometry-based framework to define the extent of disorder in proteins. Anal. Chem. 86, 10979–10991. doi:10.1021/ac5027435
Beveridge, R., Phillips, A. S., Denbigh, L., Saleem, H. M., Macphee, C. E., and Barran, P. E. (2015). Relating gas phase to solution conformations: Lessons from disordered proteins. Proteomics 15, 2872–2883. doi:10.1002/pmic.201400605
Bhattacharyya, J., and Das, K. P. (1999). Molecular chaperone-like properties of an unfolded protein, αs-casein. J. Biol. Chem. 274, 15505–15509. doi:10.1074/jbc.274.22.15505
Billardon, M., and Badoz, J. (1966). Modulateur de birefringence. Compt. Rend. Acad. Sci. Paris 262, 1672–1675.
Binnig, G., Rohrer, H., Gerber, C., and Weibel, E. (1982). Surface studies by scanning tunneling microscopy. Phys. Rev. Lett. 49, 57–61. doi:10.1103/physrevlett.49.57
Binnig, G., Quate, C. F., and Gerber, C. (1986). Atomic force microscope. Phys. Rev. Lett. 56, 930–933. doi:10.1103/physrevlett.56.930
Biot, J.-B. (1812). Mémoire sur un nouveau genre d’oscillation que les molécules de la lumière éprouvent en traversant certains cristaux. Mémoires de la Cl. des Sci. Mathématiques Physiques de l’Institut Impérial de France, 1–371.
Bloomer, A. C., Champness, J. N., Bricogne, G., Staden, R., and Klug, A. (1978). Protein disk of tobacco mosaic virus at 2.8 A resolution showing the interactions within and between subunits. Nature 276, 362–368. doi:10.1038/276362a0
Bluhm, B. K., Gillig, K. J., and Russell, D. H. (2000). Development of a Fourier-transform ion cyclotron resonance mass spectrometer-ion mobility spectrometer. Rev. Sci. Instrum. 71, 4078–4086. doi:10.1063/1.1288235
Bode, W., Schwager, P., and Huber, R. (1978). The transition of bovine trypsinogen to a trypsin-like state upon strong ligand binding. J. Mol. Biol. 118, 99–112. doi:10.1016/0022-2836(78)90246-2
Bodenmiller, B., and Aebersold, R. (2010). Quantitative analysis of protein phosphorylation on a system-wide scale by mass spectrometry-based proteomics. Methods Enzym. 470, 317–334. doi:10.1016/s0076-6879(10)70013-6
Bogdarina, I., Fox, D. G., and Kneale, G. G. (1998). Equilibrium and kinetic binding analysis of the N-terminal domain of the Pf1 gene 5 protein and its interaction with single-stranded DNA. J. Mol. Biol. 275, 443–452. doi:10.1006/jmbi.1997.1485
Bolik-Coulon, N., Bouvignies, G., Carlier, L., and Ferrage, F. (2019). “Experimental characterization of the dynamics of IDPs and IDRs by NMR,” in Intrinsically Disordered Proteins (Elsevier), 65–92.
Bondos, S. E., Dunker, A. K., and Uversky, V. N. (2022). Intrinsically disordered proteins play diverse roles in cell signaling. Cell Commun. Signal 20, 20. doi:10.1186/s12964-022-00821-7
Bonora, G., Bertanzon, F., Moretto, V., and Toniolo, C. (1981). Protamines. VII. Circular dichroism study of salmine AI. Z. Für Naturforsch. C 36, 305–309. doi:10.1515/znc-1981-3-418
Borcherds, W., Bremer, A., Borgia, M. B., and Mittag, T. (2021). How do intrinsically disordered protein regions encode a driving force for liquid-liquid phase separation? Curr. Opin. Struct. Biol. 67, 41–50. doi:10.1016/j.sbi.2020.09.004
Borysik, A. J., Radford, S. E., and Ashcroft, A. E. (2004). Co-populated conformational ensembles of β2-microglobulin uncovered quantitatively by electrospray ionization mass spectrometry. J. Biol. Chem. 279, 27069–27077. doi:10.1074/jbc.m401472200
Bowman, R. L., Caulfield, P. A., and Udenfriend, S. (1955). Spectrophotofluorometric assay in the visible and ultraviolet. Science 122, 32–33. doi:10.1126/science.122.3157.32
Brahma, R., and Raghuraman, H. (2021). Novel insights in linking solvent relaxation dynamics and protein conformations utilizing red edge excitation shift approach. Emerg. Top. Life Sci. 5, 89–101. doi:10.1042/etls20200256
Brems, D. N., Plaisted, S. M., Havel, H. A., Kauffman, E. W., Stodola, J. D., Eaton, L. C., et al. (1985). Equilibrium denaturation of pituitary- and recombinant-derived bovine growth hormone. Biochemistry 24, 7662–7668. doi:10.1021/bi00347a025
Brewster, D. (1834). XIX. On the colours of natural bodies. Trans. R. Soc. Edinb. 12, 538–545. doi:10.1017/s0080456800031203
Brocca, S., Testa, L., Sobott, F., Šamalikova, M., Natalello, A., Papaleo, E., et al. (2011). Compaction properties of an intrinsically disordered protein: Sic1 and its kinase-inhibitor domain. Biophysical J. 100, 2243–2252. doi:10.1016/j.bpj.2011.02.055
Brown, H. G., and Hoh, J. H. (1997). Entropic exclusion by neurofilament sidearms: a mechanism for maintaining interfilament spacing. Biochemistry 36, 15035–15040. doi:10.1021/bi9721748
Brutscher, B., Felli, I. C., Gil-Caballero, S., Hošek, T., Kummerle, R., Piai, A., et al. (2015). NMR Methods for the Study of Instrinsically Disordered Proteins Structure, Dynamics, and Interactions: General Overview and Practical Guidelines. Adv. Exp. Med. Biol. 870, 49–122. doi:10.1007/978-3-319-20164-1_3
Buday, L., and Tompa, P. (2010). Functional classification of scaffold proteins and related molecules. FEBS J. 277, 4348–4355. doi:10.1111/j.1742-4658.2010.07864.x
Burnett, P. R., and Eylar, E. (1971). Allergic encephalomyelitis: Oxidation and cleavage of the single tryptophan residue of the A1 protein from bovine and human myelin. J. Biol. Chem. 246, 3425–3430. doi:10.1016/s0021-9258(18)62241-0
Burstein, E. A., Vedenkina, N. S., and Ivkova, M. N. (1973). Fluorescence and the location of tryptophan residues in protein molecules. Photochem. Photobiol. 18, 263–279. doi:10.1111/j.1751-1097.1973.tb06422.x
Burstein, E. A., Permyakov, E. A., Yashin, V. A., Burkhanov, S. A., and Finazzi Agro, A. (1977). The fine structure of luminescence spectra of azurin. Biochimica Biophysica Acta (BBA) - Protein Struct. 491, 155–159. doi:10.1016/0005-2795(77)90051-4
Burzlaff, N. I., Rutledge, P. J., Clifton, I. J., Hensgens, C. M., Pickford, M., Adlington, R. M., et al. (1999). The reaction cycle of isopenicillin N synthase observed by X-ray diffraction. Nature 401, 721–724. doi:10.1038/44400
Buswell, A., Krebs, K. F., and Rodebush, W. (1940). The Infrared Absorption of Proteins in the 3μ Region. XII. J. Phys. Chem. 44, 1126–1137. doi:10.1021/j150405a011
Bycroft, M., Ludvigsen, S., Fersht, A. R., and Poulsen, F. M. (1991). Determination of the three-dimensional solution structure of barnase using nuclear magnetic resonance spectroscopy. Biochemistry 30, 8697–8701. doi:10.1021/bi00099a030
Byer, A. S., Pei, X., Patterson, M. G., and Ando, N. (2023). Small-angle X-ray scattering studies of enzymes. Curr. Opin. Chem. Biol. 72, 102232. doi:10.1016/j.cbpa.2022.102232
Byler, D. M., and Susi, H. (1986). Examination of the secondary structure of proteins by deconvolved FTIR spectra. Biopolymers 25, 469–487. doi:10.1002/bip.360250307
Camacho-Zarco, A. R., Schnapka, V., Guseva, S., Abyzov, A., Adamski, W., Milles, S., et al. (2022). NMR Provides Unique Insight into the Functional Dynamics and Interactions of Intrinsically Disordered Proteins. Chem. Rev. 122, 9331–9356. doi:10.1021/acs.chemrev.1c01023
Canon, F., Ballivian, R., Chirot, F., Antoine, R., Sarni-Manchado, P., Lemoine, J., et al. (2011). Folding of a salivary intrinsically disordered protein upon binding to tannins. J. Am. Chem. Soc. 133, 7847–7852. doi:10.1021/ja200534f
Cario, G., and Franck, J. (1922). Über zerlegung von wasserstoffmolekülen durch angeregte quecksilberatome. Z. Für Phys. 11, 161–166. doi:10.1007/bf01328410
Causon, T. (2021). Ion Mobility–Mass Spectrometry (IM–MS): Enhancing Performance of Analytical Methods.
Cavatorta, P., Giovanelli, S., Bobba, A., Riccio, P., and Quagliariello, E. (1991). Interaction of cations with lipid-free myelin basic protein. A spectroscopy study. Acta Neurol. (Napoli) 13, 162–169.
Chakrabarti, P., and Chakravarty, D. (2022). Intrinsically disordered proteins/regions and insight into their biomolecular interactions. Biophys. Chem. 283, 106769. doi:10.1016/j.bpc.2022.106769
Chang, T. S., and Zirkin, B. R. (1978). Proteolytic degradation of protamine during thiol-induced nuclear decondensation in rabbit spermatozoa. J. Exp. Zool. 204, 283–289. doi:10.1002/jez.1402040216
Chen, Y., and Barkley, M. D. (1998). Toward understanding tryptophan fluorescence in proteins. Biochemistry 37, 9976–9982. doi:10.1021/bi980274n
Chen, T. C., and Huang, J. R. (2020). Musashi-1: An Example of How Polyalanine Tracts Contribute to Self-Association in the Intrinsically Disordered Regions of RNA-Binding Proteins. Int. J. Mol. Sci. 21, 2289. doi:10.3390/ijms21072289
Chen, S., Wu, D., Robinson, C. V., and Struwe, W. B. (2021). Native Mass Spectrometry Meets Glycomics: Resolving Structural Detail and Occupancy of Glycans on Intact Glycoproteins. Anal. Chem. 93, 10435–10443. doi:10.1021/acs.analchem.1c01460
Chen, S. H., Weiss, K. L., Stanley, C., and Bhowmik, D. (2023). Structural characterization of an intrinsically disordered protein complex using integrated small-angle neutron scattering and computing. Protein Sci. 32, e4772. doi:10.1002/pro.4772
Chen, J. C. H., Gilski, M., Chang, C., Borek, D., Rosenbaum, G., Lavens, A., et al. (2024). Solvent organization in the ultrahigh-resolution crystal structure of crambin at room temperature. IUCrJ 11, 649–663. doi:10.1107/s2052252524007784
Chi, Z., Chen, X., Holtz, J. S., and Asher, S. A. (1998). UV resonance Raman-selective amide vibrational enhancement: quantitative methodology for determining protein secondary structure. Biochemistry 37, 2854–2864. doi:10.1021/bi971160z
Chick, H. (1914). The viscosity of protein solutions. II. Pseudoglobulin and euglobulin (horse). Biochem. J. 8, 261–280. doi:10.1042/bj0080261
Chick, H., and Lubrzynska, E. (1914). The viscosity of some protein solutions. Biochem. J. 8, 59–69. doi:10.1042/bj0080059
Chowdhury, S. K., Katta, V., and Chait, B. T. (1990a). An electrospray-ionization mass spectrometer with new features. Rapid Commun. Mass Spectrom. 4, 81–87. doi:10.1002/rcm.1290040305
Chowdhury, S. K., Katta, V., and Chait, B. T. (1990b). Probing conformational changes in proteins by mass spectrometry. J. Am. Chem. Soc. 112, 9012–9013. doi:10.1021/ja00180a074
Choy, W. Y., and Forman-Kay, J. D. (2001). Calculation of ensembles of structures representing the unfolded state of an SH3 domain. J. Mol. Biol. 308, 1011–1032. doi:10.1006/jmbi.2001.4750
Christofi, E., and Barran, P. (2023). Ion Mobility Mass Spectrometry (IM-MS) for Structural Biology: Insights Gained by Measuring Mass, Charge, and Collision Cross Section. Chem. Rev. 123, 2902–2949. doi:10.1021/acs.chemrev.2c00600
Chu, Y. G., and Cantor, C. R. (1979). Segmental flexibility in Escherichia coli ribosomal protein S1 as studied by fluorescence polarization. Nucleic Acids Res. 6, 2363–2379. doi:10.1093/nar/6.6.2363
Cinar, H., Cinar, S., Chan, H. S., and Winter, R. (2018). Pressure-Induced Dissolution and Reentrant Formation of Condensed, Liquid-Liquid Phase-Separated Elastomeric alpha-Elastin. Chem. – A Eur. J. 24, 8286–8291. doi:10.1002/chem.201801643
Clark, S. A., Jespersen, N., Woodward, C., and Barbar, E. (2015). Multivalent IDP assemblies: Unique properties of LC8-associated, IDP duplex scaffolds. FEBS Lett. 589, 2543–2551. doi:10.1016/j.febslet.2015.07.032
Clarke, E. D. (1819). Account of a newly discovered variety of green fluor spar, of very uncommon beauty, and with remarkable properties of colour and phosphorescence. Ann. Philosophy 14, 34–36.
Clarke, D. J. (2019). Protein mass spectrometry: structural characterization and clinical diagnosis. Chem 5, 1019–1022. doi:10.1016/j.chempr.2019.04.019
Clemmer, D. E., and Jarrold, M. F. (1997). Ion mobility measurements and their applications to clusters and biomolecules. J. Mass Spectrom. 32, 577–592. doi:10.1002/(sici)1096-9888(199706)32:6<577::aid-jms530>3.0.co;2-4
Clemmer, D. E., Hudgins, R. R., and Jarrold, M. F. (1995). Naked protein conformations: cytochrome c in the gas phase. J. Am. Chem. Soc. 117, 10141–10142. doi:10.1021/ja00145a037
Cohen, S. L., Ferre-D'amare, A. R., Burley, S. K., and Chait, B. T. (1995). Probing the solution structure of the DNA-binding protein Max by a combination of proteolysis and mass spectrometry. Protein Sci. 4, 1088–1099. doi:10.1002/pro.5560040607
Cölfen, H. (2023). Analytical ultracentrifugation in colloid and polymer science: new possibilities and perspectives after 100 years. Colloid Polym. Sci. 301, 821–849. doi:10.1007/s00396-023-05130-0
Cooper, E. A., and Knutson, K. (1995). Fourier transform infrared spectroscopy investigations of protein structure. Pharm. Biotechnol. 7, 101–143. doi:10.1007/978-1-4899-1079-0_3
Corbett, R. J., and Roche, R. S. (1983). The unfolding mechanism of thermolysin. Biopolymers 22, 101–105. doi:10.1002/bip.360220116
Corbett, R. J., and Roche, R. S. (1984). Use of high-speed size-exclusion chromatography for the study of protein folding and stability. Biochemistry 23, 1888–1894. doi:10.1021/bi00303a047
Cortese, M. S., Uversky, V. N., and Dunker, A. K. (2008). Intrinsic disorder in scaffold proteins: getting more from less. Prog. Biophys. Mol. Biol. 98, 85–106. doi:10.1016/j.pbiomolbio.2008.05.007
Cotton, A. (1895). Absorption inégale des rayons circulaires droit et gauche dans certains corps actifs. Compt. Rend. 120, 989–991.
Crane-Robinson, C., and Privalov, P. (1983). Conformation and folding in histones H1 and H5. Biopolymers 22, 113–118. doi:10.1002/bip.360220118
Crane-Robinson, C., Dancy, S. E., Bradbury, E. M., Garel, A., Kovacs, A. M., Champagne, M., et al. (1976). Structural studies of chicken erythrocyte histone H5. Eur. J. Biochem. 67, 379–388. doi:10.1111/j.1432-1033.1976.tb10702.x
Crichton, R. R., Engleman, D. M., Haas, J., Koch, M. H., Moore, P. B., Parfait, R., et al. (1977). Contrast variation study of specifically deuterated Escherichia coli ribosomal subunits. Proc. Natl. Acad. Sci. U. S. A. 74, 5547–5550. doi:10.1073/pnas.74.12.5547
Crick, S. L., Jayaraman, M., Frieden, C., Wetzel, R., and Pappu, R. V. (2006). Fluorescence correlation spectroscopy shows that monomeric polyglutamine molecules form collapsed structures in aqueous solutions, Proc. Natl. Acad. Sci. U. S. A., 103, 16764–16769. doi:10.1073/pnas.0608175103
Cuevas-Velazquez, C. L., and Dinneny, J. R. (2018). Organization out of disorder: liquid-liquid phase separation in plants. Curr. Opin. Plant Biol. 45, 68–74. doi:10.1016/j.pbi.2018.05.005
Cummins, H., Knable, N., and Yeh, Y. (1964). Observation of diffusion broadening of Rayleigh scattered light. Phys. Rev. Lett. 12, 150–153. doi:10.1103/physrevlett.12.150
Damaschun, G., Damaschun, H., Gast, K., Gernat, C., and Zirwer, D. (1991a). Acid denatured apo-cytochrome c is a random coil: evidence from small-angle X-ray scattering and dynamic light scattering. Biochimica Biophysica Acta (BBA)-Protein Struct. Mol. Enzym. 1078, 289–295. doi:10.1016/0167-4838(91)90571-g
Damschun, G., Damaschun, H., Gast, K., Zirwer, D., and Bychkova, V. E. (1991b). Solvent dependence of dimensions of unfolded protein chains. Int. J. Biol. Macromol. 13, 217–221. doi:10.1016/0141-8130(91)90075-6
Daniels, A., Korda, A., Tanswell, P., Williams, A., and Williams, R. J. (1974). The internal structure of the chromaffin granule. Proc. R. Soc. Lond B Biol. Sci. 187, 353–361. doi:10.1098/rspb.1974.0080
Darling, A. L., and Uversky, V. N. (2023). “Known types of membrane-less organelles and biomolecular condensates,” in Droplets of Life: Membrane-Less Organelles, Biomolecular Condensates, and Biological Liquid-Liquid Phase Separation. Editor V. N. Uversky 1st ed (Amsterdam, Netherlands: Elsevier), 271–335.
Darling, A. L., Liu, Y., Oldfield, C. J., and Uversky, V. N. (2018). Intrinsically Disordered Proteome of Human Membrane-Less Organelles. Proteomics 18, e1700193. doi:10.1002/pmic.201700193
Darmon, S., and Sutherland, G. (1947). Infrared spectra and structure of natural and synthetic polypeptides. J. Am. Chem. Soc. 69, 2074. doi:10.1021/ja01200a520
Daughdrill, G. W., Pielak, G. J., Uversky, V. N., Cortese, M. S., and Dunker, A. K. (2005). “Natively disordered proteins,” in Handbook of Protein Folding. Editors J. Buchner, and T. Kiefhaber (Weinheim, Germany: Wiley-VCH, Verlag GmbH and Co. KGaA), 271–353.
Deforte, S., and Uversky, V. N. (2016). Resolving the ambiguity: Making sense of intrinsic disorder when PDB structures disagree. Protein Sci. 25, 676–688. doi:10.1002/pro.2864
Demchenko, A. (1988). Red-edge-excitation fluorescence spectroscopy of single-tryptophan proteins. Eur. Biophysics J. EBJ 16, 121–129. doi:10.1007/bf00255522
Demchenko, A. P. (2002). The red-edge effects: 30 years of exploration. Luminescence 17, 19–42. doi:10.1002/bio.671
Dempsey, C. E. (2001). Hydrogen exchange in peptides and proteins using NMR spectroscopy. Prog. Nucl. Magnetic Reson. Spectrosc. 39, 135–170. doi:10.1016/s0079-6565(01)00032-2
Deng, B., Lento, C., and Wilson, D. J. (2016). Hydrogen deuterium exchange mass spectrometry in biopharmaceutical discovery and development - A review. Anal. Chim. Acta 940, 8–20. doi:10.1016/j.aca.2016.08.006
Denning, D. P., Patel, S. S., Uversky, V., Fink, A. L., and Rexach, M. (2003). Disorder in the nuclear pore complex: the FG repeat regions of nucleoporins are natively unfolded. Proc. Natl. Acad. Sci. U. S. A. 100, 2450–2455. doi:10.1073/pnas.0437902100
Djinovic-Carugo, K., and Carugo, O. (2015). Missing strings of residues in protein crystal structures. Intrinsically Disord. Proteins 3, e1095697. doi:10.1080/21690707.2015.1095697
Dobo, A., and Kaltashov, I. A. (2001). Detection of multiple protein conformational ensembles in solution via deconvolution of charge-state distributions in ESI MS. Anal. Chem. 73, 4763–4773. doi:10.1021/ac010713f
Dodds, J. N., and Baker, E. S. (2019). Ion Mobility Spectrometry: Fundamental Concepts, Instrumentation, Applications, and the Road Ahead. J. Am. Soc. Mass Spectrom. 30, 2185–2195. doi:10.1007/s13361-019-02288-2
Donaldson, L., and Capone, J. P. (1992). Purification and characterization of the carboxyl-terminal transactivation domain of Vmw65 from herpes simplex virus type 1. J. Biol. Chem. 267, 1411–1414. doi:10.1016/s0021-9258(18)45957-1
Doniach, S. (2001). Changes in biomolecular conformation seen by small angle X-ray scattering. Chem. Rev. 101, 1763–1778. doi:10.1021/cr990071k
Doolittle, R. F. (1973). Structural aspects of the fibrinogen to fibrin conversion. Adv. Protein Chem. 27, 1–109. doi:10.1016/s0065-3233(08)60446-5
Doty, P., and Edsall, J. T. (1951). “Light scattering in protein solutions,” in Advances in Protein Chemistry (Elsevier), 35–121.
Drino, A., and Schaefer, M. R. (2018). RNAs, Phase Separation, and Membrane-Less Organelles: Are Post-Transcriptional Modifications Modulating Organelle Dynamics? Bioessays 40, e1800085. doi:10.1002/bies.201800085
Duggan, D. E., and Udenfriend, S. (1956). The spectrophotofluorometric determination of tryptophan in plasma and of tryptophan and tyrosine in protein hydrolysates. J. Biol. Chem. 223, 313–319. doi:10.1016/s0021-9258(18)65140-3
Dunker, A. K., and Obradovic, Z. (2001). The protein trinity--linking function and disorder. Nat. Biotechnol. 19, 805–806. doi:10.1038/nbt0901-805
Dunker, A. K., and Oldfield, C. J. (2015). Back to the Future: Nuclear Magnetic Resonance and Bioinformatics Studies on Intrinsically Disordered Proteins. Adv. Exp. Med. Biol. 870, 1–34. doi:10.1007/978-3-319-20164-1_1
Dunker, A. K., and Uversky, V. N. (2010). Drugs for 'protein clouds': targeting intrinsically disordered transcription factors. Curr. Opin. Pharmacol. 10, 782–788. doi:10.1016/j.coph.2010.09.005
Dunker, A. K., Garner, E., Guilliot, S., Romero, P., Albrecht, K., Hart, J., et al. (1998). Protein disorder and the evolution of molecular recognition: theory, predictions and observations. Pac Symp. Biocomput, 473–484.
Dunker, A. K., Obradovic, Z., Romero, P., Garner, E. C., and Brown, C. J. (2000). Intrinsic protein disorder in complete genomes. Genome Inf. Ser. Workshop Genome Inf. 11, 161–171.
Dunker, A. K., Lawson, J. D., Brown, C. J., Williams, R. M., Romero, P., Oh, J. S., et al. (2001). Intrinsically disordered protein. J. Mol. Graph. Model. 19, 26–59. doi:10.1016/s1093-3263(00)00138-8
Dunker, A. K., Brown, C. J., Lawson, J. D., Iakoucheva, L. M., and Obradović, Z. (2002). Intrinsic disorder and protein function. Biochemistry 41, 6573–6582. doi:10.1021/bi012159+
Dunker, A. K., Cortese, M. S., Romero, P., Iakoucheva, L. M., and Uversky, V. N. (2005). Flexible nets: The roles of intrinsic disorder in protein interaction networks. FEBS J. 272, 5129–5148. doi:10.1111/j.1742-4658.2005.04948.x
Dyson, H. J., and Wright, P. E. (2002). Coupling of folding and binding for unstructured proteins. Curr. Opin. Struct. Biol. 12, 54–60. doi:10.1016/s0959-440x(02)00289-0
Dyson, H. J., and Wright, P. E. (2019). Perspective: the essential role of NMR in the discovery and characterization of intrinsically disordered proteins. J. Biomol. NMR 73, 651–659. doi:10.1007/s10858-019-00280-2
Dyson, H. J., and Wright, P. E. (2021). NMR illuminates intrinsic disorder. Curr. Opin. Struct. Biol. 70, 44–52. doi:10.1016/j.sbi.2021.03.015
Edun, D. N., Flanagan, M. R., and Serrano, A. L. (2021). Does liquid-liquid phase separation drive peptide folding? Chem. Sci. 12, 2474–2479. doi:10.1039/d0sc04993j
Eftink, M. R. (1991). Fluorescence techniques for studying protein structure. Methods Biochem. Analysis 35, 127–205. doi:10.1002/9780470110560.ch3
Eftink, M., and Ghiron, C. (1976). Exposure of tryptophanyl residues in proteins. Quantitative determination by fluorescence quenching studies. Biochemistry 15, 672–680. doi:10.1021/bi00648a035
Eigen, M., and Rigler, R. (1994). Sorting single molecules: application to diagnostics and evolutionary biotechnology. Proc. Natl. Acad. Sci. 91, 5740–5747. doi:10.1073/pnas.91.13.5740
Einstein, A. (1905). Über die von der molekularkinetischen Theorie der Wärme geforderte Bewegung von in ruhenden Flüssigkeiten suspendierten Teilchen. Ann. Phys. 4.
Elgin, S. C., and Weintraub, H. (1975). Chromosomal proteins and chromatin structure. Annu. Rev. Biochem. 44, 725–774. doi:10.1146/annurev.bi.44.070175.003453
Eliezer, D. (2009). Biophysical characterization of intrinsically disordered proteins. Curr. Opin. Struct. Biol. 19, 23–30. doi:10.1016/j.sbi.2008.12.004
Eliezer, D., Chiba, K., Tsuruta, H., Doniach, S., Hodgson, K., and Kihara, H. (1993). Evidence of an associative intermediate on the myoglobin refolding pathway. Biophysical J. 65, 912–917. doi:10.1016/s0006-3495(93)81124-x
Eliezer, D., Jennings, P. A., Wright, P. E., Doniach, S., Hodgson, K. O., and Tsuruta, H. (1995). The radius of gyration of an apomyoglobin folding intermediate. Science 270, 487. doi:10.1126/science.270.5235.487
Elkana, Y., Feitelson, J., and Katchalski, E. (1968). Effect of diffusion on transfer of electronic excitation energy. J. Chem. Phys. 48, 2399–2404. doi:10.1063/1.1669458
Elliott, A. (1954). “Infra-Red Spectra and Molecular Configurations,” in Progress in Stereochemistry. Editor W. Klyne (London: Butterworths Scientific Publications), 114–140.
Elliott, A., and Ambrose, E. (1950). Structure of synthetic polypeptides. Nature 165, 921–922. doi:10.1038/165921a0
Elliott, A., Ambrose, E., and Robinson, C. (1950). Chain configurations in natured and denatured insulin: Evidence from infra-red spectra. Nature 166, 194. doi:10.1038/166194a0
Endo, S., Saito, Y., and Wada, A. (1983). Denaturant-gradient chromatography for the study of protein denaturation: principle and procedure. Anal. Biochem. 131, 108–120. doi:10.1016/0003-2697(83)90141-0
Engelborghs, Y. (2003). Correlating protein structure and protein fluorescence. J. Fluoresc. 13, 9–16. doi:10.1023/a:1022398329107
Engelman, D. M., Moore, P. B., and Schoenborn, B. P. (1975). Neutron scattering measurements of separation and shape of proteins in 30S ribosomal subunit of Escherichia coli: S2-S5, S5-S8, S3-S7. Proc. Natl. Acad. Sci. U. S. A. 72, 3888–3892. doi:10.1073/pnas.72.10.3888
Englander, S. W., Mayne, L., Bai, Y., and Sosnick, T. R. (1997). Hydrogen exchange: the modern legacy of Linderstrom-Lang. Protein Sci. 6, 1101–1109. doi:10.1002/pro.5560060517
Englander, S. W., Mayne, L., Kan, Z. Y., and Hu, W. (2016). Protein Folding-How and Why: By Hydrogen Exchange, Fragment Separation, and Mass Spectrometry. Annu. Rev. Biophys. 45, 135–152. doi:10.1146/annurev-biophys-062215-011121
Evans, R., Ramisetty, S., Kulkarni, P., and Weninger, K. (2023). Illuminating Intrinsically Disordered Proteins with Integrative Structural Biology. Biomolecules 13, 124. doi:10.3390/biom13010124
Eyles, S. J., Dresch, T., Gierasch, L. M., and Kaltashov, I. A. (1999). Unfolding dynamics of a beta-sheet protein studied by mass spectrometry. J. Mass Spectrom. 34, 1289–1295. doi:10.1002/(sici)1096-9888(199912)34:12<1289::aid-jms882>3.0.co;2-u
Fagerberg, E., Mansson, L. K., Lenton, S., and Skepo, M. (2020). The Effects of Chain Length on the Structural Properties of Intrinsically Disordered Proteins in Concentrated Solutions. J. Phys. Chem. B 124, 11843–11853. doi:10.1021/acs.jpcb.0c09635
Farrah, T., Deutsch, E. W., Hoopmann, M. R., Hallows, J. L., Sun, Z., Huang, C. Y., et al. (2013). The State of the Human Proteome in 2012 as Viewed through PeptideAtlas. J. Proteome Res. 12, 162–171. doi:10.1021/pr301012j
Farrah, T., Deutsch, E. W., Omenn, G. S., Sun, Z., Watts, J. D., Yamamoto, T., et al. (2014). State of the Human Proteome in 2013 as Viewed through PeptideAtlas: Comparing the Kidney, Urine, and Plasma Proteomes for the Biology- and Disease-Driven Human Proteome Project. J. Proteome Res. 13, 60–75. doi:10.1021/pr4010037
Felli, I. C., and Pierattelli, R. (2014). Novel methods based on (13)C detection to study intrinsically disordered proteins. J. Magnetic Reson. 241, 115–125. doi:10.1016/j.jmr.2013.10.020
Fenn, J. B., Mann, M., Meng, C. K., Wong, S. F., and Whitehouse, C. M. (1989). Electrospray ionization for mass spectrometry of large biomolecules. Science 246, 64–71. doi:10.1126/science.2675315
Ferreon, A. C., Moran, C. R., Gambin, Y., and Deniz, A. A. (2010). Single-molecule fluorescence studies of intrinsically disordered proteins. Methods Enzym. 472, 179–204. doi:10.1016/s0076-6879(10)72010-3
Ferrieres, G., Calzolari, C., Mani, J. C., Laune, D., Trinquier, S., Laprade, M., et al. (1998). Human cardiac troponin I: precise identification of antigenic epitopes and prediction of secondary structure. Clin. Chem. 44, 487–493. doi:10.1093/clinchem/44.3.487
Fish, W. W., Reynolds, J. A., and Tanford, C. (1970). Gel Chromatography of Proteins in Denaturing Solvents. J. Biol. Chem. 245, 5166–5168. doi:10.1016/s0021-9258(18)62832-7
Fontana, A., Fassina, G., Vita, C., Dalzoppo, D., Zamai, M., and Zambonin, M. (1986). Correlation between sites of limited proteolysis and segmental mobility in thermolysin. Biochemistry 25, 1847–1851. doi:10.1021/bi00356a001
Fontana, A., De Laureto, P. P., and De Filippis, V. (1993). “Molecular aspects of proteolysis of globular proteins,” in Studies in organic chemistry (Elsevier), 101–110.
Fontana, A., Polverino De Laureto, P., De Filippis, V., Scaramella, E., and Zambonin, M. (1997a). Probing the partly folded states of proteins by limited proteolysis. Fold. Des. 2, R17–26. doi:10.1016/s1359-0278(97)00010-2
Fontana, A., Zambonin, M., Polverino De Laureto, P., De Filippis, V., Clementi, A., and Scaramella, E. (1997b). Probing the conformational state of apomyoglobin by limited proteolysis 1 1Edited by P. E. Wright. J. Mol. Biol. 266, 223–230. doi:10.1006/jmbi.1996.0787
Fontana, A., De Laureto, P. P., De Filippis, V., Scaramella, E., and Zambonin, M. (1999). “Limited proteolysis in the study of protein conformation,” in Proteolytic enzymes: Tools and targets (Springer), 253–280.
Fontana, A., De Laureto, P. P., Spolaore, B., Frare, E., Picotti, P., and Zambonin, M. (2004). Probing protein structure by limited proteolysis. Acta Biochim. Pol. 51, 299–321. doi:10.18388/abp.2004_3573
Foord, R., Jakeman, E., Oliver, C., Pike, E., Blagrove, R., Wood, E., et al. (1970). Determination of diffusion coefficients of haemocyanin at low concentration by intensity fluctuation spectroscopy of scattered laser light. Nature 227, 242–245. doi:10.1038/227242a0
Forster, T. (1946). Energiewanderung und fluoreszenz. Naturwissenschaften 33, 166–175. doi:10.1007/bf00585226
Friedrich, W., Knipping, P., and Laue, M. (1912). Interferenz-Erscheinungen bei Röntgenstrahlen. Sitzungsberichte der Königlich Bayerischen Akademie der Wissenschaften zu München, 303–322.
Frimpong, A. K., Abzalimov, R. R., Uversky, V. N., and Kaltashov, I. A. (2010). Characterization of intrinsically disordered proteins with electrospray ionization mass spectrometry: conformational heterogeneity of α-synuclein. Proteins Struct. Funct. Bioinforma. 78, 714–722. doi:10.1002/prot.22604
Gabel, F. (2012). Small angle neutron scattering for the structural study of intrinsically disordered proteins in solution: a practical guide. Methods Mol. Biol. 896, 123–135. doi:10.1007/978-1-4614-3704-8_8
Gall, T. L., Romero, P. R., Cortese, M. S., Uversky, V. N., and Dunker, A. K. (2007). Intrinsic disorder in the Protein Data Bank. J. Biomol. Struct. Dyn. 24, 325–341. doi:10.1080/07391102.2007.10507123
Galley, W. C., and Purkey, R. M. (1970). Role of heterogeneity of the solvation site in electronic spectra in solution. Proc. Natl. Acad. Sci. 67, 1116–1121. doi:10.1073/pnas.67.3.1116
Garner, E., Cannon, P., Romero, P., Obradovic, Z., and Dunker, A. K. (1998). Predicting Disordered Regions from Amino Acid Sequence: Common Themes Despite Differing Structural Characterization. Genome Inf. Ser. Workshop Genome Inf. 9, 201–213.
Gast, K., Zirwer, D., Welfle, H., Bychkova, V., and Ptitsyn, O. (1986). Quasielastic light scattering from human α-lactalbumin: comparison of molecular dimensions in native and ‘molten globule’states. Int. J. Biol. Macromol. 8, 231–236. doi:10.1016/0141-8130(86)90032-2
Gast, K., Damaschun, G., Misselwitz, R., and Zirwer, D. (1992). Application of dynamic light scattering to studies of protein folding kinetics. Eur. Biophys. J. 21, 357–362. doi:10.1007/bf00188349
Gast, K., Damaschun, H., Eckert, K., Schulze-Forster, K., Maurer, H. R., Mueller-Frohne, M., et al. (1995). Prothymosin alpha: a biologically active protein with random coil conformation. Biochemistry 34, 13211–13218. doi:10.1021/bi00040a037
Gast, K., Nöppert, A., Müller-Frohne, M., Zirwer, D., and Damaschun, G. (1997). Stopped-flow dynamic light scattering as a method to monitor compaction during protein folding. Eur. Biophysics J. 25, 211–219. doi:10.1007/s002490050033
Gaviola, E. (1926). The time decay of the fluorescence of dye solutions. Ann. Phys. Leipz. 81, 681–710.
Gessner, C., Steinchen, W., Bedard, S., J Skinner, J., Woods, V. L., Walsh, T. J., et al. (2017). Computational method allowing Hydrogen-Deuterium Exchange Mass Spectrometry at single amide Resolution. Sci. Rep. 7, 3789. doi:10.1038/s41598-017-03922-3
Gibbs, E. B., and Showalter, S. A. (2015). Quantitative biophysical characterization of intrinsically disordered proteins. Biochemistry 54, 1314–1326. doi:10.1021/bi501460a
Gillig, K. J., Ruotolo, B., Stone, E. G., Russell, D. H., Fuhrer, K., Gonin, M., et al. (2000). Coupling high-pressure MALDI with ion mobility/orthogonal time-of-flight mass spectrometry. Anal. Chem. 72, 3965–3971. doi:10.1021/ac0005619
Glassford, S. E., Byrne, B., and Kazarian, S. G. (2013). Recent applications of ATR FTIR spectroscopy and imaging to proteins. Biochimica Biophysica Acta (BBA)-Proteins Proteomics 1834, 2849–2858. doi:10.1016/j.bbapap.2013.07.015
Goldenberg, D. P., and Argyle, B. (2014). Minimal effects of macromolecular crowding on an intrinsically disordered protein: a small-angle neutron scattering study. Biophysical J. 106, 905–914. doi:10.1016/j.bpj.2013.12.003
Gomes, G. N., and Gradinaru, C. C. (2017). Insights into the conformations and dynamics of intrinsically disordered proteins using single-molecule fluorescence. Biochimica Biophysica Acta (BBA) - Proteins Proteomics 1865, 1696–1706. doi:10.1016/j.bbapap.2017.06.008
Greenfield, N. J. (2006). Using circular dichroism spectra to estimate protein secondary structure. Nat. Protoc. 1, 2876–2890. doi:10.1038/nprot.2006.202
Greenfield, N., and Fasman, G. D. (1969). Computed circular dichroism spectra for the evaluation of protein conformation. Biochemistry 8, 4108–4116. doi:10.1021/bi00838a031
Griffiths, J. (2008). A brief history of mass spectrometry. Anal. Chem. 80, 5678–5683. doi:10.1021/ac8013065
Grinvald, A., and Steinberg, I. (1976). The fluorescence decay of tryptophan residues in native and denatured proteins. Biochimica Biophysica Acta (BBA)-Protein Struct. 427, 663–678. doi:10.1016/0005-2795(76)90210-5
Grosjean, M., and Legrand, M. (1960). Appareil de mesure du dichroïsme circulaire dans le visible et l’ultraviolet. Compt. Rend. 251, 2150–2152.
Grzelczak, Z. F., Sattolo, M. H., Hanley-Bowdoin, L. K., Kennedy, T. D., and Lane, B. G. (1982). Synthesis and turnover of proteins and mRNA in germinating wheat embryos. Can. J. Biochem. 60, 389–397. doi:10.1139/o82-046
Gstaiger, M., and Aebersold, R. (2009). Applying mass spectrometry-based proteomics to genetics, genomics and network biology. Nat. Rev. Genet. 10, 617–627. doi:10.1038/nrg2633
Gualfetti, P. J., Iwakura, M., Lee, J. C., Kihara, H., Bilsel, O., Zitzewitz, J. A., et al. (1999). Apparent radii of the native, stable intermediates and unfolded conformers of the alpha-subunit of tryptophan synthase from E. coli, a TIM barrel protein. Biochemistry 38, 13367–13378. doi:10.1021/bi991296s
Guinier, A. (1938). La diffusion des rayons X sous faibles angles, appliquée à l’étude de fines particules et de suspensions colloïdales. CR Hebd. Seances Acad. Sci. 206, 1374.
Guinier, A., Fournet, G., Walker, C. B., and Yudowitch, K. L. (1955). Small-angle Scattering of X-rays. New York: Wiley.
Guo, T., and Aebersold, R. (2023). Recent advances of data-independent acquisition mass spectrometry-based proteomics. Proteomics 23, e2200011. doi:10.1002/pmic.202200011
Gupta, B. B. (1983). Determination of native and denatured milk proteins by high-performance size exclusion chromatography. J. Chromatogr. A 282, 463–475. doi:10.1016/s0021-9673(00)91623-6
Ha, T., Enderle, T., Ogletree, D., Chemla, D. S., Selvin, P. R., and Weiss, S. (1996). Probing the interaction between two single molecules: fluorescence resonance energy transfer between a single donor and a single acceptor. Proc. Natl. Acad. Sci. 93, 6264–6268. doi:10.1073/pnas.93.13.6264
Haas, E., Katchalski-Katzir, E., and Steinberg, I. Z. (1978). Brownian motion of the ends of oligopeptide chains in solution as estimated by energy transfer between the chain ends. Biopolymers 17, 11–31. doi:10.1002/bip.1978.360170103
Hagen, G. (1839). Ueber die Bewegung des Wassers in engen cylindrischen Röhren. Ann. Phys. 122, 423–442. doi:10.1002/andp.18391220304
Hall, Z., Politis, A., and Robinson, C. V. (2012). Structural modeling of heteromeric protein complexes from disassembly pathways and ion mobility-mass spectrometry. Structure 20, 1596–1609. doi:10.1016/j.str.2012.07.001
Hammermann, M., Toth, K., Rodemer, C., Waldeck, W., May, R. P., and Langowski, J. (2000). Salt-dependent compaction of di- and trinucleosomes studied by small-angle neutron scattering. Biophysical J. 79, 584–594. doi:10.1016/s0006-3495(00)76318-1
Hamuro, Y., Coales, S. J., Morrow, J. A., Molnar, K. S., Tuske, S. J., Southern, M. R., et al. (2006). Hydrogen/deuterium-exchange (H/D-Ex) of PPARγ LBD in the presence of various modulators. Protein Sci. 15, 1883–1892. doi:10.1110/ps.062103006
Hansma, H. G., Weisenhorn, A. L., Edmundson, A. B., Gaub, H. E., and Hansma, P. K. (1991). Atomic force microscopy: seeing molecules of lipid and immunoglobulin. Clin. Chem. 37, 1497–1501. doi:10.1093/clinchem/37.9.1497
Haritos, A. A., Yialouris, P. P., Heimer, E. P., Felix, A. M., Hannappel, E., and Rosemeyer, M. A. (1989). Evidence for the monomeric nature of thymosins. FEBS Lett. 244, 287–290. doi:10.1016/0014-5793(89)80547-2
Harvey, S. R., Macphee, C. E., and Barran, P. E. (2011). Ion mobility mass spectrometry for peptide analysis. Methods 54, 454–461. doi:10.1016/j.ymeth.2011.05.004
Hashimoto, M., Kodera, N., Tsunaka, Y., Oda, M., Tanimoto, M., Ando, T., et al. (2013). Phosphorylation-coupled intramolecular dynamics of unstructured regions in chromatin remodeler FACT. Biophysical J. 104, 2222–2234. doi:10.1016/j.bpj.2013.04.007
Hatschek, E. (1916). The Viscosity and Hydratation of Colloidal Solutions. Biochem. J. 10, 325–330. doi:10.1042/bj0100325
Hauer, J. A., Taylor, S. S., and Johnson, D. A. (1999). Binding-Dependent Disorder−Order Transition in PKIα: A Fluorescence Anisotropy Study. Biochemistry 38, 6774–6780. doi:10.1021/bi983074k
Haüy, R. J. (1822). Traité de Minéralogie [Treatise on Mineralogy] (in French). Paris, France: Bachelier and Huzard.
Havukainen, H., Underhaug, J., Wolschin, F., Amdam, G., and Halskau, O. (2012). A vitellogenin polyserine cleavage site: highly disordered conformation protected from proteolysis by phosphorylation. J. Exp. Biol. 215, 1837–1846. doi:10.1242/jeb.065623
Haydon, A. J., and Peacocke, A. R. (1968). Sedimentation equilibrium and other physicochemical studies on the lysine-rich fraction of calf thymus histones. Biochem. J. 110, 243–250. doi:10.1042/bj1100243
He, B., Wang, K., Liu, Y., Xue, B., Uversky, V. N., and Dunker, A. K. (2009). Predicting intrinsic disorder in proteins: an overview. Cell Res. 19, 929–949. doi:10.1038/cr.2009.87
Hecht, L., Barron, L. D., Blanch, E. W., Bell, A. F., and Day, L. A. (1999). Raman optical activity instrument for studies of biopolymer structure and dynamics. J. Raman Spectrosc. 30, 815–825. doi:10.1002/(sici)1097-4555(199909)30:9<815::aid-jrs453>3.0.co;2-1
Heck, A. J. (2008). Native mass spectrometry: a bridge between interactomics and structural biology. Nat. Methods 5, 927–933. doi:10.1038/nmeth.1265
Heine, V. S., Kratky, O., and Roppert, J. (1962). Lichtstreuung und röntgenkleinwinkelstreuung von statistisch verknäuelten fadenmolekülen, berechnet nach der „Monte Carlo methode. Die Makromol. Chem. 56, 150–168. doi:10.1002/macp.1962.020560111
Heintz, E. (1935). The infrared spectrum of amino acids and polypeptides. Comptes Rendus Hebd. Des. Seances De. L Acad. Des. Sci. 201, 1478–1480.
Hekstra, D. R. (2023). Emerging Time-Resolved X-Ray Diffraction Approaches for Protein Dynamics. Annu. Rev. Biophys. 52, 255–274. doi:10.1146/annurev-biophys-111622-091155
Hemmings, H. C., Nairn, A. C., Aswad, D. W., and Greengard, P. (1984). DARPP-32, a dopamine- and adenosine 3':5'-monophosphate-regulated phosphoprotein enriched in dopamine-innervated brain regions. II. Purification and characterization of the phosphoprotein from bovine caudate nucleus. J. Neurosci. 4, 99–110. doi:10.1523/jneurosci.04-01-00099.1984
Henderson, S. C., Valentine, S. J., Counterman, A. E., and Clemmer, D. E. (1999). ESI/ion trap/ion mobility/time-of-flight mass spectrometry for rapid and sensitive analysis of biomolecular mixtures. Anal. Chem. 71, 291–301. doi:10.1021/ac9809175
Hernandez, M. A., Avila, J., and Andreu, J. M. (1986). Physicochemical characterization of the heat-stable microtubule-associated protein MAP2. Eur. J. Biochem. 154, 41–48. doi:10.1111/j.1432-1033.1986.tb09356.x
Herschel, J. F. W. (1845a). IV.’Aμóρϕωτa, no. I.—on a case of superficial colour presented by a homogeneous liquid internally colourless. Philosophical Trans. R. Soc. Lond., 143–145.
Herschel, J. F. W. (1845b). V.’Aμóρϕωτa, no. II.—on the epipŏlic dispersion of light, being a supplement to a paper entitled, On a case of superficial colour presented by a homogeneous liquid internally colourless. Philosophical Trans. R. Soc. Lond., 147–153.
Hershey, P. E., Mcwhirter, S. M., Gross, J. D., Wagner, G., Alber, T., and Sachs, A. B. (1999). The Cap-binding protein eIF4E promotes folding of a functional domain of yeast translation initiation factor eIF4G1. J. Biol. Chem. 274, 21297–21304. doi:10.1074/jbc.274.30.21297
Hess, E. L., and Cobure, A. (1950). The intrinsic viscosity of mixed protein systems, including studies of plasma and serum. J. General Physiology 33, 511–523. doi:10.1085/jgp.33.5.511
Heuvel, R. H. v. d., and Heck, A. J. (2004). Native protein mass spectrometry: from intact oligomers to functional machineries. Curr. Opin. Chem. Biol. 8, 519–526. doi:10.1016/j.cbpa.2004.08.006
Hink, M. A., Bisseling, T., and Visser, A. J. (2002). Imaging protein-protein interactions in living cells. Plant Mol. Biol. 50, 871–883. doi:10.1023/a:1021282619035
Hjelm, R. P., Kneale, G. G., Suau, P., Baldwin, J. P., Bradbury, E. M., and Ibel, K. (1977). Small angle neutron scattering studies of chromatin subunits in solution. Cell 10, 139–151. doi:10.1016/0092-8674(77)90148-9
Hoaglund, C. S., Valentine, S. J., Sporleder, C. R., Reilly, J. P., and Clemmer, D. E. (1998). Three-dimensional ion mobility/TOFMS analysis of electrosprayed biomolecules. Anal. Chem. 70, 2236–2242. doi:10.1021/ac980059c
Hoaglund-Hyzer, C. S., Counterman, A. E., and Clemmer, D. E. (1999). Anhydrous protein ions. Chem. Rev. 99, 3037–3080. doi:10.1021/cr980139g
Hochmair, J., Exner, C., Betzel, C., Mandelkow, E., and Wegmann, S. (2023). Light Microscopy and Dynamic Light Scattering to Study Liquid-Liquid Phase Separation of Tau Proteins In Vitro. Methods Mol. Biol. 2551, 225–243. doi:10.1007/978-1-0716-2597-2_15
Hogg, A., and Kebarle, P. (1965). Mass-spectrometric study of ions at near-atmospheric pressure. II. Ammonium ions produced by the alpha radiolysis of ammonia and their solvation in the gas phase by ammonia and water molecules. J. Chem. Phys. 43, 449–456. doi:10.1063/1.1696762
Hoh, J. H., Lal, R., John, S. A., Revel, J. P., and Arnsdorf, M. F. (1991). Atomic force microscopy and dissection of gap junctions. Science 253, 1405–1408. doi:10.1126/science.1910206
Hoh, J. H., Sosinsky, G. E., Revel, J. P., and Hansma, P. K. (1993). Structure of the extracellular surface of the gap junction by atomic force microscopy. Biophysical J. 65, 149–163. doi:10.1016/s0006-3495(93)81074-9
Holzwarth, G., and Doty, P. (1965). The ultraviolet circular dichroism of polypeptides. J. Am. Chem. Soc. 87, 218–228. doi:10.1021/ja01080a015
Holzwarth, G., Gratzer, W., and Doty, P. (1962). The Optical Activity of Polypeptides in far Ultraviolet. J. Am. Chem. Soc. 84, 3194–3196. doi:10.1021/ja00875a039
Horiuchi, M., Kurihara, Y., Katahira, M., Maeda, T., Saito, T., and Uesugi, S. (1997). Dimerization and DNA Binding Facilitate aaa-Helix Formation of Max in Solution. J. Biochem. 122, 711–716. doi:10.1093/oxfordjournals.jbchem.a021813
Horvath, H. (2009). Gustav Mie and the scattering and absorption of light by particles: Historic developments and basics. J. Quantitative Spectrosc. Radiat. Transf. 110, 787–799. doi:10.1016/j.jqsrt.2009.02.022
Hsiao, A. S. (2024). Protein Disorder in Plant Stress Adaptation: From Late Embryogenesis Abundant to Other Intrinsically Disordered Proteins. Int. J. Mol. Sci. 25, 1178. doi:10.3390/ijms25021178
Huang, A., and Stultz, C. M. (2008). The Effect of a ΔK280 Mutation on the Unfolded State of a Microtubule-Binding Repeat in Tau. PLoS Comput. Biol. 4, e1000155. doi:10.1371/journal.pcbi.1000155
Hubbard, S. J. (1998). The structural aspects of limited proteolysis of native proteins. Biochimica Biophysica Acta (BBA) - Protein Struct. Mol. Enzym. 1382, 191–206. doi:10.1016/s0167-4838(97)00175-1
Hudgins, R. R., Mao, Y., Ratner, M. A., and Jarrold, M. F. (1999). Conformations of Gly(n)H+ and Ala(n)H+ peptides in the gas phase. Biophysical J. 76, 1591–1597. doi:10.1016/s0006-3495(99)77318-2
Huguet, F., Melet, A., Alves de Sousa, R., Lieutaud, A., Chevalier, J., Maigre, L., et al. (2012). Hydroxamic acids as potent inhibitors of Fe(II) and Mn(II) E. coli methionine aminopeptidase: biological activities and X-ray structures of oxazole hydroxamate-EcMetAP-Mn complexes. ChemMedChem 7, 1020–1030. doi:10.1002/cmdc.201200076
Hvidt, A., and Linderstrom-Lang, K. (1954). Exchange of hydrogen atoms in insulin with deuterium atoms in aqueous solutions. Biochimica Biophysica Acta 14, 574–575. doi:10.1016/0006-3002(54)90241-3
Hvidt, A., and Linderstrom-Lang, K. (1955). The kinetics of the deuterium exchange of insulin with D2O; an amendment. Biochimica Biophysica Acta 16, 168–169. doi:10.1016/0006-3002(55)90200-6
Iakoucheva, L. M., Brown, C. J., Lawson, J. D., Obradović, Z., and Dunker, A. K. (2002). Intrinsic disorder in cell-signaling and cancer-associated proteins. J. Mol. Biol. 323, 573–584. doi:10.1016/s0022-2836(02)00969-5
Iakoucheva, L. M., Radivojac, P., Brown, C. J., O'connor, T. R., Sikes, J. G., Obradovic, Z., et al. (2004). The importance of intrinsic disorder for protein phosphorylation. Nucleic Acids Res. 32, 1037–1049. doi:10.1093/nar/gkh253
Imbert, M., Laine, B., Helbecque, N., Mornon, J. P., Henichart, J. P., and Sautiere, P. (1990). Conformational study of the chromosomal protein MC1 from the archaebacterium Methanosarcina barkeri. Biochimica Biophysica Acta (BBA) - Protein Struct. Mol. Enzym. 1038, 346–354. doi:10.1016/0167-4838(90)90247-d
Ishino, S., Yamagami, T., Kitamura, M., Kodera, N., Mori, T., Sugiyama, S., et al. (2014). Multiple interactions of the intrinsically disordered region between the helicase and nuclease domains of the archaeal Hef protein. J. Biol. Chem. 289, 21627–21639. doi:10.1074/jbc.m114.554998
Jablonski, A. (1933). Efficiency of anti-Stokes fluorescence in dyes. Nature 131, 839–840. doi:10.1038/131839b0
Jabłoński, A. (1935). Über den mechanismus der photolumineszenz von farbstoffphosphoren. Z. Für Phys. 94, 38–46. doi:10.1007/bf01330795
Jackson, M., and Mantsch, H. H. (1995). The use and misuse of FTIR spectroscopy in the determination of protein structure. Crit. Rev. Biochem. Mol. Biol. 30, 95–120. doi:10.3109/10409239509085140
Jacrot, B. (1976). The study of biological structures by neutron scattering from solution. Rep. Prog. Phys. 39, 911–953. doi:10.1088/0034-4885/39/10/001
Jain, N., Bhasne, K., Hemaswasthi, M., and Mukhopadhyay, S. (2013). Structural and dynamical insights into the membrane-bound alpha-synuclein. PLoS One 8, e83752. doi:10.1371/journal.pone.0083752
Jakeman, E., and Pike, E. (1969). Spectrum of clipped photon-counting fluctuations of Gaussian light. J. Phys. A General Phys. 2, 411–412. doi:10.1088/0305-4470/2/3/021
Jakob, U., Kriwacki, R., and Uversky, V. N. (2014). Conditionally and transiently disordered proteins: awakening cryptic disorder to regulate protein function. Chem. Rev. 114, 6779–6805. doi:10.1021/cr400459c
Jakubek, R. S., Handen, J., White, S. E., Asher, S. A., and Lednev, I. K. (2018). Ultraviolet Resonance Raman Spectroscopic Markers for Protein Structure and Dynamics. TrAC Trends Anal. Chem. 103, 223–229. doi:10.1016/j.trac.2017.12.002
James, E. I., Murphree, T. A., Vorauer, C., Engen, J. R., and Guttman, M. (2022). Advances in Hydrogen/Deuterium Exchange Mass Spectrometry and the Pursuit of Challenging Biological Systems. Chem. Rev. 122, 7562–7623. doi:10.1021/acs.chemrev.1c00279
Jarrold, M. F. (2000). Peptides and proteins in the vapor phase. Annu. Rev. Phys. Chem. 51, 179–207. doi:10.1146/annurev.physchem.51.1.179
Jelsch, C., Teeter, M. M., Lamzin, V., Pichon-Pesme, V., Blessing, R. H., and Lecomte, C. (2000). Accurate protein crystallography at ultra-high resolution: valence electron distribution in crambin. Proc. Natl. Acad. Sci. U. S. A. 97, 3171–3176. doi:10.1073/pnas.97.7.3171
Jensen, M. R., Salmon, L., Nodet, G., and Blackledge, M. (2010). Defining conformational ensembles of intrinsically disordered and partially folded proteins directly from chemical shifts. J. Am. Chem. Soc. 132, 1270–1272. doi:10.1021/ja909973n
Jirgensons, B. (1958). Optical rotation and viscosity of native and denatured proteins. XI. Relationships between rotatory dispersion, ionization and configuration. Archives Biochem. Biophysics 74, 70–83. doi:10.1016/0003-9861(58)90200-5
Jirgensons, B. (1964). Study of the optical rotatory dispersion of proteins with improved spectropolarimetric techniques. Die Makromol. Chem. 72, 119–130. doi:10.1002/macp.1964.020720110
Jirgensons, B. (1966). Classification of proteins according to conformation. Die Makromol. Chem. 91, 74–86. doi:10.1002/macp.1966.020910105
Jirgensons, B. (2012). Optical activity of proteins and other macromolecules. Springer Science and Business Media.
Jirgensons, B., and Hnilica, L. S. (1965). The conformational changes of calf-thymus histone fractions as determined by the optical rotary dispersion. Biochimica Biophysica Acta (BBA) - Biophysics Incl. Photosynth. 109, 241–249. doi:10.1016/0926-6585(65)90108-1
Johansen, D., Jeffries, C. M., Hammouda, B., Trewhella, J., and Goldenberg, D. P. (2011). Effects of macromolecular crowding on an intrinsically disordered protein characterized by small-angle neutron scattering with contrast matching. Biophysical J. 100, 1120–1128. doi:10.1016/j.bpj.2011.01.020
Jones, A. J., and Rumsby, M. G. (1975). The intrinsic fluorescence characteristics of the myelin basic protein. J. Neurochem. 25, 565–572. doi:10.1111/j.1471-4159.1975.tb04369.x
Josefsson, E., O'connell, D., Foster, T. J., Durussel, I., and Cox, J. A. (1998). The binding of calcium to the B-repeat segment of SdrD, a cell surface protein of Staphylococcus aureus. J. Biol. Chem. 273, 31145–31152. doi:10.1074/jbc.273.47.31145
Joshi, A., Walimbe, A., Avni, A., Rai, S. K., Arora, L., Sarkar, S., et al. (2023). Single-molecule FRET unmasks structural subpopulations and crucial molecular events during FUS low-complexity domain phase separation. Nat. Commun. 14, 7331. doi:10.1038/s41467-023-43225-y
Jurneczko, E., Cruickshank, F., Porrini, M., Nikolova, P., Campuzano, I. D., Morris, M., et al. (2012). Intrinsic disorder in proteins: a challenge for (un)structural biology met by ion mobility-mass spectrometry. Biochem. Soc. Trans. 40, 1021–1026. doi:10.1042/bst20120125
Kaltashov, I. A., and Mohimen, A. (2005). Estimates of protein surface areas in solution by electrospray ionization mass spectrometry. Anal. Chem. 77, 5370–5379. doi:10.1021/ac050511+
Kaltashov, I. A., Zhang, M., Eyles, S. J., and Abzalimov, R. R. (2006). Investigation of structure, dynamics and function of metalloproteins with electrospray ionization mass spectrometry. Anal. Bioanal. Chem. 386, 472–481. doi:10.1007/s00216-006-0636-6
Kan, Z. Y., Walters, B. T., Mayne, L., and Englander, S. W. (2013). Protein hydrogen exchange at residue resolution by proteolytic fragmentation mass spectrometry analysis. Proc. Natl. Acad. Sci. U. S. A. 110, 16438–16443. doi:10.1073/pnas.1315532110
Kasha, M. (1950). Characterization of electronic transitions in complex molecules. Discuss. Faraday Soc. 9, 14–19. doi:10.1039/df9500900014
Kashima, M., Fukuyama, K., Kikuchi, M., and Epstein, W. L. (1988). Limited proteolysis of high molecular weight histidine-rich protein of rat epidermis by epidermal proteinases. J. Investigative Dermatology 90, 829–833. doi:10.1111/1523-1747.ep12462067
Kask, P., Piksarv, P., Mets, Ü., Pooga, M., and Lippmaa, E. (1987). Fluorescence correlation spectroscopy in the nanosecond time range: rotational diffusion of bovine carbonic anhydrase B. Eur. Biophysics J. EBJ 14, 257–261. doi:10.1007/bf00256359
Kataoka, M., Hagihara, Y., Mihara, K. I., and Goto, Y. (1993). Molten globule of cytochrome c studied by small angle X-ray scattering. Elsevier.
Katta, V., Chait, B. T., and Carr, S. (1991). Conformational changes in proteins probed by hydrogen-exchange electrospray-ionization mass spectrometry. Rapid Commun. Mass Spectrom. 5, 214–217. doi:10.1002/rcm.1290050415
Kauppi, T. A., and Bass, S. L. (1937). Viscosity-Concentration Relations in Ethylcellulose Solutions. Industrial and Eng. Chem. 29, 800–803. doi:10.1021/ie50331a015
Kebarle, P., and Hogg, A. (1965). Mass-spectrometric study of ions at near atmospheric pressures. I. The ionic polymerization of ethylene. J. Chem. Phys. 42, 668–674. doi:10.1063/1.1695987
Keener, J. E., Zhang, G., and Marty, M. T. (2021). Native Mass Spectrometry of Membrane Proteins. Anal. Chem. 93, 583–597. doi:10.1021/acs.analchem.0c04342
Kelly, S. M., Jess, T. J., and Price, N. C. (2005). How to study proteins by circular dichroism. Biochimica Biophysica Acta (BBA)-Proteins Proteomics 1751, 119–139. doi:10.1016/j.bbapap.2005.06.005
Kemper, P. R., and Bowers, M. T. (1990). A hybrid double-focusing mass spectrometer—high-pressure drift reaction cell to study thermal energy reactions of mass-selected ions. J. Am. Soc. Mass Spectrom. 1, 197–207. doi:10.1016/1044-0305(90)85036-l
Kendrew, J. C., Bodo, G., Dintzis, H. M., Parrish, R. G., Wyckoff, H., and Phillips, D. C. (1958). A three-dimensional model of the myoglobin molecule obtained by x-ray analysis. Nature 181, 662–666. doi:10.1038/181662a0
Khechinashvili, N. N., Koteliansky, V. E., Gogia, Z. V., Littlechild, J., and Dijk, J. (1978). A heat denaturation study of several ribosomal proteins from Escherichia coli by scanning microcalorimetry. FEBS Lett. 95, 270–272. doi:10.1016/0014-5793(78)81008-4
Kikhney, A. G., and Svergun, D. I. (2015). A practical guide to small angle X-ray scattering (SAXS) of flexible and intrinsically disordered proteins. FEBS Lett. 589, 2570–2577. doi:10.1016/j.febslet.2015.08.027
Kim, M. S., Pinto, S. M., Getnet, D., Nirujogi, R. S., Manda, S. S., Chaerkady, R., et al. (2014). A draft map of the human proteome. Nature 509, 575–581. doi:10.1038/nature13302
Kinjo, M. (1998). Detection of asymmetric PCR products in homogeneous solution by fluorescence correlation spectroscopy. Biotechniques 25. 706–715. doi:10.2144/98254rr01
Kodera, N., Yamamoto, D., Ishikawa, R., and Ando, T. (2010). Video imaging of walking myosin V by high-speed atomic force microscopy. Nature 468, 72–76. doi:10.1038/nature09450
Kodera, N., Uchida, K., Ando, T., and Aizawa, S.-I. (2015). Two-ball structure of the flagellar hook-length control protein FliK as revealed by high-speed atomic force microscopy. J. Mol. Biol. 427, 406–414. doi:10.1016/j.jmb.2014.11.007
Kodera, N., Noshiro, D., Dora, S. K., Mori, T., Habchi, J., Blocquel, D., et al. (2021). Structural and dynamics analysis of intrinsically disordered proteins by high-speed atomic force microscopy. Nat. Nanotechnol. 16, 181–189. doi:10.1038/s41565-020-00798-9
Koenig, J., and Sutton, P. (1970). Raman spectra of poly-L-lysines. Biopolymers 9, 1229–1237. doi:10.1002/bip.1970.360091003
Koide, S., Bu, Z., Risal, D., Pham, T. N., Nakagawa, T., Tamura, A., et al. (1999). Multistep denaturation of Borrelia burgdorferi OspA, a protein containing a single-layer beta-sheet. Biochemistry 38, 4757–4767. doi:10.1021/bi982443+
Koizumi, T., Kobayashi, N., and Kaneko, Y. (1980). Mobilities of Ne+ and Ar+ ions in He gas at 82 K. J. Phys. Soc. Jpn. 48, 1678–1682. doi:10.1143/jpsj.48.1678
Kojima, M., Tanokura, M., Maeda, M., Kimura, K., Amemiya, Y., Kihara, H., et al. (2000). pH-dependent unfolding of aspergillopepsin II studied by small-angle X-ray scattering. Biochemistry 39, 1364–1372. doi:10.1021/bi991584o
Konev, S. (1957). Fluorescence spectra and fluorescence action spectra of some proteins. Dokl. Akad. Nauk. SSSR 116, 594–597.
Konev, S. V. (1967). Fluorescence and phosphorescence of proteins and nucleic acids. New York: Plenum Press.
Konijnenberg, A., Van Dyck, J. F., Kailing, L. L., and Sobott, F. (2015). Extending native mass spectrometry approaches to integral membrane proteins. Biol. Chem. 396, 991–1002. doi:10.1515/hsz-2015-0136
Koning, H. J., Lai, V., Sethi, A., Chakraborty, S., Ang, C. S., Fox, A. H., et al. (2025). Structural dynamics of IDR interactions in human SFPQ and implications for liquid-liquid phase separation. Acta Crystallogr. D. Struct. Biol. 81, 357–379. doi:10.1107/s2059798325005303
Konno, T., Kataoka, M., Kamatari, Y., Kanaori, K., Nosaka, A., and Akasaka, K. (1995). Solution X-ray scattering analysis of cold-heat-and urea-denatured states in a protein, Streptomyces subtilisin inhibitor. J. Mol. Biol. 251, 95–103. doi:10.1006/jmbi.1995.0418
Konrat, R. (2014). NMR contributions to structural dynamics studies of intrinsically disordered proteins. J. Magnetic Reson. 241, 74–85. doi:10.1016/j.jmr.2013.11.011
Kornberg, R. D. (1974). Chromatin Structure: A Repeating Unit of Histones and DNA: Chromatin structure is based on a repeating unit of eight histone molecules and about 200 DNA base pairs. Science 184, 868–871. doi:10.1126/science.184.4139.868
Kosol, S., Contreras-Martos, S., Cedeno, C., and Tompa, P. (2013). Structural characterization of intrinsically disordered proteins by NMR spectroscopy. Molecules 18, 10802–10828. doi:10.3390/molecules180910802
Kowalsky, A. (1962). Nuclear magnetic resonance studies of proteins. J. Biol. Chem. 237, 1807–1819. doi:10.1016/s0021-9258(19)73941-6
Kraemer, E. O., and Lansing, W. D. (1935). The molecular weight of cellulose and its derivatives. J. Phys. Chem. 39, 153–168.
Krichevsky, O., and Bonnet, G. (2002). Fluorescence correlation spectroscopy: thetechnique and its applications. Rep. Prog. Phys. 65, 251–297. doi:10.1088/0034-4885/65/2/203
Kriwacki, R. W., Hengst, L., Tennant, L., Reed, S. I., and Wright, P. E. (1996). Structural studies of p21Waf1/Cip1/Sdi1 in the free and Cdk2-bound state: conformational disorder mediates binding diversity. Proc. Natl. Acad. Sci. U. S. A. 93, 11504–11509. doi:10.1073/pnas.93.21.11504
Kuhn, W. (1929). Quantitative Verhältnisse und Beziehungen bei der natürlichen optischen Aktivität. Z. Für Phys. Chem. 4, 14–36. doi:10.1515/zpch-1929-0403
Kumar, R., Moure, C. M., Khan, S. H., Callaway, C., Grimm, S. L., Goswami, D., et al. (2013). Regulation of the structurally dynamic N-terminal domain of progesterone receptor by protein-induced folding. J. Biol. Chem. 288, 30285–30299. doi:10.1074/jbc.m113.491787
Kunitz, M. (1926). An empirical formula for the relation between viscosity of solution and volume of solute. J. General Physiology 9, 715–725. doi:10.1085/jgp.9.6.715
Kurzbach, D., Kontaxis, G., Coudevylle, N., and Konrat, R. (2015). NMR Spectroscopic Studies of the Conformational Ensembles of Intrinsically Disordered Proteins. Adv. Exp. Med. Biol. 870, 149–185. doi:10.1007/978-3-319-20164-1_5
Lakowicz, J. R. (1983). “Protein fluorescence,” in Principles of fluorescence spectroscopy (Springer), 445–486.
Lakowicz, J. R., and Weber, G. (1973). Quenching of protein fluorescence by oxygen. Detection of structural fluctuations in proteins on the nanosecond time scale. Biochemistry 12, 4171–4179. doi:10.1021/bi00745a021
Lakowicz, J. R., Freshwater, G., and Weber, G. (1980). Nanosecond segmental mobilities of tryptophan residues in proteins observed by lifetime-resolved fluorescence anisotropies. Biophysical J. 32, 591–601. doi:10.1016/s0006-3495(80)84992-7
Landsberg, G. S., and Mandelstam, L. I. (1928). New phenomenon in the scattering of light (preliminary report). J. Russ. Physico-Chemical Soc. Phys. Sect. 60, 335.
Lathe, G. H., and Ruthven, C. R. (1955). The separation of substances on the basis of their molecular weights, using columns of starch and water. Biochem. J. 60, xxxiv.
Lathe, G. H., and Ruthven, C. R. (1956). The separation of substances and estimation of their relative molecular sizes by the use of columns of starch in water. Biochem. J. 62, 665–674. doi:10.1042/bj0620665
Lau, S. Y., Taneja, A. K., and Hodges, R. S. (1984). Synthesis of a model protein of defined secondary and quaternary structure. Effect of chain length on the stabilization and formation of two-stranded alpha-helical coiled-coils. J. Biol. Chem. 259, 13253–13261. doi:10.1016/s0021-9258(18)90686-1
Laughrea, M., Engelman, D. M., and Moore, P. B. (1978). X-ray and neutron small-angle scattering studies of the complex between protein S1 and the 30-S ribosomal subunit. Eur. J. Biochem. 85, 529–534. doi:10.1111/j.1432-1033.1978.tb12268.x
Laurents, D., and Mompean, M. (2017). Intrinsically Disordered Domains, Amyloids and Protein Liquid Phases: Evolving Concepts and Open Questions. Protein and Peptide Lett. 24, 281–293. doi:10.2174/0929866524666170206122106
Lawrence, A., Barbour, R. J., and Sutcliffe, R. (1991). Identification of wood species by ion mobility spectrometry. Anal. Chem. 63, 1217–1221. doi:10.1021/ac00013a007
Le Maire, M., Aggerbeck, L. P., Monteilhet, C., Andersen, J. P., and Moller, J. V. (1986). The use of high-performance liquid chromatography for the determination of size and molecular weight of proteins: a caution and a list of membrane proteins suitable as standards. Anal. Biochem. 154, 525–535. doi:10.1016/0003-2697(86)90025-4
Le Maire, M., Ghazi, A., Moller, J. V., and Aggerbeck, L. P. (1987). The use of gel chromatography for the determination of sizes and relative molecular masses of proteins. Interpretation of calibration curves in terms of gel-pore-size distribution. Biochem. J. 243, 399–404. doi:10.1042/bj2430399
Lea, A. S., Pungor, A., Hlady, V., Andrade, J. D., Herron, J. N., and Voss, E. W. (1992). Manipulation of Proteins on Mica by Atomic Force Microscopy. Langmuir 8, 68–73. doi:10.1021/la00037a015
Leblanc, S. J., Kulkarni, P., and Weninger, K. R. (2018). Single Molecule FRET: A Powerful Tool to Study Intrinsically Disordered Proteins. Biomolecules 8, 140. doi:10.3390/biom8040140
Lee, T., Moran-Gutierrez, C. R., and Deniz, A. A. (2015). Probing protein disorder and complexity at single-molecule resolution. Seminars Cell and Dev. Biol. 37, 26–34. doi:10.1016/j.semcdb.2014.09.027
Lehrer, S. (1971). Solute perturbation of protein fluorescence. Quenching of the tryptophyl fluorescence of model compounds and of lysozyme by iodide ion. Biochemistry 10, 3254–3263. doi:10.1021/bi00793a015
Lehrer, S. S., and Leavis, P. C. (1978). “Solute quenching of protein fluorescence,” in Methods in enzymology (Elsevier), 222–236.
Leney, A. C., and Heck, A. J. (2017). Native Mass Spectrometry: What is in the Name? J. Am. Soc. Mass Spectrom. 28, 5–13. doi:10.1007/s13361-016-1545-3
Leontiev, V. V., Uversky, V. N., and Gudkov, A. T. (1993). Comparative stability of dihydrofolate reductase mutants in vitro and in vivo. Protein Eng. Des. Sel. 6, 81–84. doi:10.1093/protein/6.1.81
Levin, M. K., and Carson, J. H. (2004). Fluorescence correlation spectroscopy and quantitative cell biology. Differentiation 72, 1–10. doi:10.1111/j.1432-0436.2004.07201002.x
Li, H., Oberhauser, A. F., Redick, S. D., Carrion-Vazquez, M., Erickson, H. P., and Fernandez, J. M. (2001a). Multiple conformations of PEVK proteins detected by single-molecule techniques. Proc. Natl. Acad. Sci. 98, 10682–10686. doi:10.1073/pnas.191189098
Li, J., Uversky, V. N., and Fink, A. L. (2001b). Effect of familial Parkinson's disease point mutations A30P and A53T on the structural properties, aggregation, and fibrillation of human alpha-synuclein. Biochemistry 40, 11604–11613. doi:10.1021/bi010616g
Li, J., Lyu, W., Rossetti, G., Konijnenberg, A., Natalello, A., Ippoliti, E., et al. (2017). Proton Dynamics in Protein Mass Spectrometry. J. Phys. Chem. Lett. 8, 1105–1112. doi:10.1021/acs.jpclett.7b00127
Linderstrøm-Lang, K. U. (1952). Lane medical lectures: proteins and enzymes. Stanford University Press.
Linderstrom-Lang, K. (1955). The pH-dependence of the deuterium exchange of insulin. Biochimica Biophysica Acta 18, 308. doi:10.1016/0006-3002(55)90084-6
Linderstrøm-Lang, K., and Ottesen, M. (1949). Formation of plakalbumin from ovalbumin. Comp. Rend. Trav. Lab. Carlsb. 26, 403–412.
Lineweaver, H., and Hoover, S. R. (1941). A comparison of the action of crystalline papain on native and urea-denatured proteins. J. Biol. Chem. 137, 325–335. doi:10.1016/s0021-9258(18)73003-2
Lippincott-Schwartz, J., Snapp, E., and Kenworthy, A. (2001). Studying protein dynamics in living cells. Nat. Rev. Mol. Cell Biol. 2, 444–456. doi:10.1038/35073068
Lisse, T., Bartels, D., Kalbitzer, H. R., and Jaenicke, R. (1996). The recombinant dehydrin-like desiccation stress protein from the resurrection plant Craterostigma plantagineum displays no defined three-dimensional structure in its native state. Biol. Chem. Hoppe-Seyler 377, 555–562. doi:10.1515/bchm3.1996.377.9.555
S. Longhi, and V. N. Uversky (2010). Instrumental Analysis of Intrinsically Disordered Proteins: Assessing Structure and Conformation (Hoboken, New Jersey, USA: John Wiley and Sons, Inc).
Loo, J. A., Loo, R. R., Udseth, H. R., Edmonds, C. G., and Smith, R. D. (1991). Solvent-induced conformational changes of polypeptides probed by electrospray-ionization mass spectrometry. Rapid Commun. Mass Spectrom. 5, 101–105. doi:10.1002/rcm.1290050303
Lorenz-Fonfria, V. A. (2020). Infrared difference spectroscopy of proteins: from bands to bonds. Chem. Rev. 120, 3466–3576. doi:10.1021/acs.chemrev.9b00449
Loughlin, W. J. (1932). The denaturation of proteins: The effect of the addition of electrolytes on the viscosity of solutions of crystalline egg-albumin. Biochem. J. 26, 1557–1565. doi:10.1042/bj0261557
Loughlin, W. J., and Lewis, W. C. (1932). The denaturation of proteins: The effect of denaturation on the viscosity of the solutions of certain proteins. Biochem. J. 26, 476–487. doi:10.1042/bj0260476
Lutter, L., Serpell, C. J., Tuite, M. F., Serpell, L. C., and Xue, W. F. (2020). Three-dimensional reconstruction of individual helical nano-filament structures from atomic force microscopy topographs. Biomol. Concepts 11, 102–115. doi:10.1515/bmc-2020-0009
Lutter, L., Al-Hilaly, Y. K., Serpell, C. J., Tuite, M. F., Wischik, C. M., Serpell, L. C., et al. (2022). Structural Identification of Individual Helical Amyloid Filaments by Integration of Cryo-Electron Microscopy-Derived Maps in Comparative Morphometric Atomic Force Microscopy Image Analysis. J. Mol. Biol. 434, 167466. doi:10.1016/j.jmb.2022.167466
Lynch, W. P., Riseman, V. M., and Bretscher, A. (1987). Smooth muscle caldesmon is an extended flexible monomeric protein in solution that can readily undergo reversible intra- and intermolecular sulfhydryl cross-linking. A mechanism for caldesmon's F-actin bundling activity. J. Biol. Chem. 262, 7429–7437. doi:10.1016/s0021-9258(18)48255-5
Macdonald, J. A., Ishida, H., Butler, E. I., Ulke-Lemee, A., Chappellaz, M., Tulk, S. E., et al. (2012). Intrinsically disordered N-terminus of calponin homology-associated smooth muscle protein (CHASM) interacts with the calponin homology domain to enable tropomyosin binding. Biochemistry 51, 2694–2705. doi:10.1021/bi2019018
Magde, D., Elson, E., and Webb, W. W. (1972). Thermodynamic fluctuations in a reacting system—measurement by fluorescence correlation spectroscopy. Phys. Rev. Lett. 29, 705–708. doi:10.1103/physrevlett.29.705
Maiti, S., Haupts, U., and Webb, W. W. (1997). Fluorescence correlation spectroscopy: diagnostics for sparse molecules. Proc. Natl. Acad. Sci. 94, 11753–11757. doi:10.1073/pnas.94.22.11753
Maiti, N. C., Apetri, M. M., Zagorski, M. G., Carey, P. R., and Anderson, V. E. (2004). Raman spectroscopic characterization of secondary structure in natively unfolded proteins: α-synuclein. J. Am. Chem. Soc. 126, 2399–2408. doi:10.1021/ja0356176
Maiti, S., Singh, A., Maji, T., Saibo, N. V., and De, S. (2024). Experimental methods to study the structure and dynamics of intrinsically disordered regions in proteins. Curr. Res. Struct. Biol. 7, 100138. doi:10.1016/j.crstbi.2024.100138
Makinen, M. A., Anttalainen, O. A., and Sillanpaa, M. E. (2010). Ion mobility spectrometry and its applications in detection of chemical warfare agents. Anal. Chem. 82, 9594–9600. doi:10.1021/ac100931n
Malhotra, A., and Harvey, S. C. (1994). A quantitative model of the Escherichia coli 16 S RNA in the 30 S ribosomal subunit. J. Mol. Biol. 240, 308–340. doi:10.1006/jmbi.1994.1448
Malmstrom, J., Lee, H., Nesvizhskii, A. I., Shteynberg, D., Mohanty, S., Brunner, E., et al. (2006). Optimized peptide separation and identification for mass spectrometry based proteomics via free-flow electrophoresis. J. Proteome Res. 5, 2241–2249. doi:10.1021/pr0600632
Mammi, M., Gotte, L., and Pezzin, G. (1968). Evidence for order in the structure of α-elastin. Nature 220, 371–373. doi:10.1038/220371b0
Mao, Y., Woenckhaus, J., Kolafa, J., Ratner, M. A., and Jarrold, M. F. (1999). Thermal unfolding of unsolvated cytochrome c: experiment and molecular dynamics simulations. J. Am. Chem. Soc. 121, 2712–2721. doi:10.1021/ja980324b
Marion, D. (2013). An introduction to biological NMR spectroscopy. Mol. and Cell. Proteomics 12, 3006–3025. doi:10.1074/mcp.o113.030239
Marsh, J. A., and Forman-Kay, J. D. (2009). Structure and disorder in an unfolded state under nondenaturing conditions from ensemble models consistent with a large number of experimental restraints. J. Mol. Biol. 391, 359–374. doi:10.1016/j.jmb.2009.06.001
Marsh, J. A., Neale, C., Jack, F. E., Choy, W. Y., Lee, A. Y., Crowhurst, K. A., et al. (2007). Improved structural characterizations of the drkN SH3 domain unfolded state suggest a compact ensemble with native-like and non-native structure. J. Mol. Biol. 367, 1494–1510. doi:10.1016/j.jmb.2007.01.038
Marsh, J. A., Teichmann, S. A., and Forman-Kay, J. D. (2012). Probing the diverse landscape of protein flexibility and binding. Curr. Opin. Struct. Biol. 22, 643–650. doi:10.1016/j.sbi.2012.08.008
Martin, E. W., and Holehouse, A. S. (2020). Intrinsically disordered protein regions and phase separation: sequence determinants of assembly or lack thereof. Emerg. Top. Life Sci. 4, 307–329. doi:10.1042/etls20190164
Martin, E. W., Hopkins, J. B., and Mittag, T. (2021). Small-angle X-ray scattering experiments of monodisperse intrinsically disordered protein samples close to the solubility limit. Methods Enzymol. 646, 185–222. doi:10.1016/bs.mie.2020.07.002
Masson, G. R., Burke, J. E., Ahn, N. G., Anand, G. S., Borchers, C., Brier, S., et al. (2019). Recommendations for performing, interpreting and reporting hydrogen deuterium exchange mass spectrometry (HDX-MS) experiments. Nat. Methods 16, 595–602. doi:10.1038/s41592-019-0459-y
Mattheyses, A. L., Kampmann, M., Atkinson, C. E., and Simon, S. M. (2010). Fluorescence anisotropy reveals order and disorder of protein domains in the nuclear pore complex. Biophysical J. 99, 1706–1717. doi:10.1016/j.bpj.2010.06.075
Maurizio, E., Cravello, L., Brady, L., Spolaore, B., Arnoldo, L., Giancotti, V., et al. (2011). Conformational role for the C-terminal tail of the intrinsically disordered high mobility group A (HMGA) chromatin factors. J. Proteome Res. 10, 3283–3291. doi:10.1021/pr200116w
McAfee, K. B., and Edelson, D. (1963). Identification and mobility of ions in a Townsend discharge by time-resolved mass spectrometry. Proc. Phys. Soc. 81, 382–384. doi:10.1088/0370-1328/81/2/125
Mccubbin, W. D., and Kay, C. M. (1985). Trypsin digestion of bovine cardiac troponin C in the presence and absence of calcium. Can. J. Biochem. Cell Biol. 63, 812–823. doi:10.1139/o85-103
Mcdaniel, E., Martin, D., and Barnes, W. (1962). Drift tube-mass spectrometer for studies of low-energy ion-molecule reactions. Rev. Sci. Instrum. 33, 2–7. doi:10.1063/1.1717656
Mcdonald, C. C., and Phillips, W. D. (1969). Proton magnetic resonance spectra of proteins in random-coil configurations. J. Am. Chem. Soc. 91, 1513–1521. doi:10.1021/ja01034a039
Metskas, L. A., and Rhoades, E. (2020). Single-Molecule FRET of Intrinsically Disordered Proteins. Annu. Rev. Phys. Chem. 71, 391–414. doi:10.1146/annurev-physchem-012420-104917
Mie, G. (1908). Beiträge zur Optik trüber Medien, speziell kolloidaler Metallösungen. Ann. Phys. 330, 377–445. doi:10.1002/andp.19083300302
Miles, A. J., Drew, E. D., and Wallace, B. A. (2023). DichroIDP: a method for analyses of intrinsically disordered proteins using circular dichroism spectroscopy. Commun. Biol. 6, 823. doi:10.1038/s42003-023-05178-2
Minor, W., Dauter, Z., and Jaskolski, M. (2016). The young person's guide to the PDB. Postepy Biochem. 62, 242–249. doi:10.18388/pb.2016_1
Minton, A. P. (2016). Recent applications of light scattering measurement in the biological and biopharmaceutical sciences. Anal. Biochem. 501, 4–22. doi:10.1016/j.ab.2016.02.007
Miranker, A., Robinson, C. V., Radford, S. E., Aplin, R. T., and Dobson, C. M. (1993). Detection of transient protein folding populations by mass spectrometry. Science 262, 896–900. doi:10.1126/science.8235611
Mitra, G. (2019). Application of native mass spectrometry in studying intrinsically disordered proteins: A special focus on neurodegenerative diseases. Biochimica Biophysica Acta (BBA) - Proteins Proteomics 1867, 140260. doi:10.1016/j.bbapap.2019.07.013
Mitrea, D. M., Cika, J. A., Stanley, C. B., Nourse, A., Onuchic, P. L., Banerjee, P. R., et al. (2018). Self-interaction of NPM1 modulates multiple mechanisms of liquid-liquid phase separation. Nat. Commun. 9, 842. doi:10.1038/s41467-018-03255-3
Mittag, T., and Forman-Kay, J. D. (2007). Atomic-level characterization of disordered protein ensembles. Curr. Opin. Struct. Biol. 17, 3–14. doi:10.1016/j.sbi.2007.01.009
Mittag, T., Orlicky, S., Choy, W. Y., Tang, X., Lin, H., Sicheri, F., et al. (2008). Dynamic equilibrium engagement of a polyvalent ligand with a single-site receptor. Proc. Natl. Acad. Sci. U. S. A. 105, 17772–17777. doi:10.1073/pnas.0809222105
Mittag, T., Marsh, J., Grishaev, A., Orlicky, S., Lin, H., Sicheri, F., et al. (2010). Structure/function implications in a dynamic complex of the intrinsically disordered Sic1 with the Cdc4 subunit of an SCF ubiquitin ligase. Structure 18, 494–506. doi:10.1016/j.str.2010.01.020
Miura, T., and Thomas, G. J. (1995). Raman spectroscopy of proteins and their assemblies. Subcell. Biochem. 24, 55–99. doi:10.1007/978-1-4899-1727-0_3
Miyagi, A., Tsunaka, Y., Uchihashi, T., Mayanagi, K., Hirose, S., Morikawa, K., et al. (2008). Visualization of intrinsically disordered regions of proteins by high-speed atomic force microscopy. Chemphyschem 9, 1859–1866. doi:10.1002/cphc.200800210
Mohanram, H., Kumar, A., Verma, C. S., Pervushin, K., and Miserez, A. (2019). Three-dimensional structure of Megabalanus rosa Cement Protein 20 revealed by multi-dimensional NMR and molecular dynamics simulations. Philosophical Trans. R. Soc. B Biol. Sci. 374, 20190198. doi:10.1098/rstb.2019.0198
Monferran, C. G., Maggio, B., and Cumar, F. A. (1986). Effect of chemical modifications of myelin basic protein on its interaction with lipid interfaces and cell fusion ability. Mol. Cell Biochem. 70, 131–139. doi:10.1007/bf00229428
Moreno, A. J., Lo Verso, F., Arbe, A., Pomposo, J. A., and Colmenero, J. (2016). Concentrated Solutions of Single-Chain Nanoparticles: A Simple Model for Intrinsically Disordered Proteins under Crowding Conditions. J. Phys. Chem. Lett. 7, 838–844. doi:10.1021/acs.jpclett.6b00144
Mou, J., Czajkowsky, D. M., Zhang, Y., and Shao, Z. (1995). High-resolution atomic-force microscopy of DNA: the pitch of the double helix. FEBS Lett. 371, 279–282. doi:10.1016/0014-5793(95)00906-p
Mueller, G. A., Benjamin, D. C., and Rule, G. S. (1998). Tertiary structure of the major house dust mite allergen Der p 2: sequential and structural homologies. Biochemistry 37, 12707–12714. doi:10.1021/bi980578+
Mukhopadhyay, S., Krishnan, R., Lemke, E. A., Lindquist, S., and Deniz, A. A. (2007). A natively unfolded yeast prion monomer adopts an ensemble of collapsed and rapidly fluctuating structures. Proc. Natl. Acad. Sci. U. S. A. 104, 2649–2654. doi:10.1073/pnas.0611503104
Munro, I., Pecht, I., and Stryer, L. (1979). Subnanosecond motions of tryptophan residues in proteins. Proc. Natl. Acad. Sci. U. S. A. 76, 56–60. doi:10.1073/pnas.76.1.56
Muroga, Y., Tagawa, H., Hiragi, Y., Ueki, T., Kataoka, M., Izumi, Y., et al. (1988). Conformational analysis of broken rodlike chains. 2. Conformational analysis of poly (D-glutamic acid) in aqueous solution by small-angle x-ray scattering. Macromolecules 21, 2756–2760. doi:10.1021/ma00187a020
Murthy, A. C., and Fawzi, N. L. (2020). The (un)structural biology of biomolecular liquid-liquid phase separation using NMR spectroscopy. J. Biol. Chem. 295, 2375–2384. doi:10.1074/jbc.rev119.009847
Murthy, A. C., Dignon, G. L., Kan, Y., Zerze, G. H., Parekh, S. H., Mittal, J., et al. (2019). Molecular interactions underlying liquid-liquid phase separation of the FUS low-complexity domain. Nat. Struct. Mol. Biol. 26, 637–648. doi:10.1038/s41594-019-0250-x
Nagy, G., Hoffmann, S. V., Jones, N. C., and Grubmuller, H. (2024). Reference Data Set for Circular Dichroism Spectroscopy Comprised of Validated Intrinsically Disordered Protein Models. Appl. Spectrosc. 78, 897–911. doi:10.1177/00037028241239977
Nakajo, S., Omata, K., Aiuchi, T., Shibayama, T., Okahashi, I., Ochiai, H., et al. (1990). Purification and characterization of a novel brain-specific 14-kDa protein. J. Neurochem. 55, 2031–2038. doi:10.1111/j.1471-4159.1990.tb05792.x
Nakano, M., Kasai, K., Yoshida, K., Tanimoto, T., Tamaki, Y., and Tobita, T. (1989). Conformation of the fowl protamine, galline, and its binding properties to DNA. J. Biochem. 105, 133–137. doi:10.1093/oxfordjournals.jbchem.a122607
Nash, P., Tang, X., Orlicky, S., Chen, Q., Gertler, F. B., Mendenhall, M. D., et al. (2001). Multisite phosphorylation of a CDK inhibitor sets a threshold for the onset of DNA replication. Nature 414, 514–521. doi:10.1038/35107009
Nasir, I., Onuchic, P. L., Labra, S. R., and Deniz, A. A. (2019). Single-molecule fluorescence studies of intrinsically disordered proteins and liquid phase separation. Biochimica Biophysica Acta (BBA) - Proteins Proteomics 1867, 980–987. doi:10.1016/j.bbapap.2019.04.007
Natalello, A., Santambrogio, C., and Grandori, R. (2017). Are Charge-State Distributions a Reliable Tool Describing Molecular Ensembles of Intrinsically Disordered Proteins by Native MS? J. Am. Soc. Mass Spectrom. 28, 21–28. doi:10.1007/s13361-016-1490-1
Neurath, H. (1979). “Limited proteolysis, protein folding and physiological regulation,” in Protein Folding. Editor R. Jaenicke (Amsterdam-New York: Elsevier/North-Holland Biomedical Press), 501–504.
Neurath, H. (1986). The versatility of proteolytic enzymes. J. Cell. Biochem. 32, 35–49. doi:10.1002/jcb.240320105
Neurath, H. (1999). Proteolytic enzymes, past and future. Proc. Natl. Acad. Sci. U. S. A. 96, 10962–10963. doi:10.1073/pnas.96.20.10962
Neurath, H., and Walsh, K. A. (1976). Role of proteolytic enzymes in biological regulation (a review). Proc. Natl. Acad. Sci. U. S. A. 73, 3825–3832. doi:10.1073/pnas.73.11.3825
Newton, I. (1687). Philosophiæ Naturalis Principia Mathematica [The Mathematical Principles of Natural Philosophy]. Lond. Jussu Soc. Regiae ac Typis Josephi Streater. Prostat Apud Plures Bibliopolas.
Neyroz, P., Desdouits, F., Benfenati, F., Knutson, J. R., Greengard, P., and Girault, J. A. (1993). Study of the conformation of DARPP-32, a dopamine- and cAMP-regulated phosphoprotein, by fluorescence spectroscopy. J. Biol. Chem. 268, 24022–24031. doi:10.1016/s0021-9258(20)80487-6
Nicoli, D., and Benedek, G. (1976). Study of thermal denaturation of lysozyme and other globular proteins by light-scattering spectroscopy. Biopolymers 15, 2421–2437. doi:10.1002/bip.1976.360151209
Nimmo, G. A., and Cohen, P. (1978). The Regulation of Glycogen Metaabolism: Purification and Characterisation of Protein Phosphatase Inhibitor-1 from Rabbit Skeletal Muscle. Eur. J. Biochem. 87, 341–351. doi:10.1111/j.1432-1033.1978.tb12383.x
Nováček, J., Žídek, L., and Sklenář, V. (2014). Toward optimal-resolution NMR of intrinsically disordered proteins. J. Magnetic Reson. 241, 41–52. doi:10.1016/j.jmr.2013.12.008
Ohnishi, M., and Reithmeier, R. A. (1987). Fragmentation of rabbit skeletal muscle calsequestrin: spectral and ion binding properties of the carboxyl-terminal region. Biochemistry 26, 7458–7465. doi:10.1021/bi00397a039
Okunuki, K., Hagihara, B., Matsubara, H., and Nakayama, T. (1956). Denaturation and inactivation of enzyme proteins. I. Bacterial proteinase method for the determination of the ratio of denaturation of globular proteins. J. Biochem. 43, 453–467. doi:10.1093/oxfordjournals.jbchem.a126647
Oldfield, C. J., Cheng, Y., Cortese, M. S., Romero, P., Uversky, V. N., and Dunker, A. K. (2005). Coupled folding and binding with alpha-helix-forming molecular recognition elements. Biochemistry 44, 12454–12470. doi:10.1021/bi050736e
Oldfield, C. J., Meng, J., Yang, J. Y., Yang, M. Q., Uversky, V. N., and Dunker, A. K. (2008). Flexible nets: disorder and induced fit in the associations of p53 and 14-3-3 with their partners. BMC Genomics 9 (Suppl. 1), S1. doi:10.1186/1471-2164-9-s1-s1
Osterberg, R., Sjoberg, B., Garrett, R. A., and Muller, R. (1980). The conformation of a large RNA fragment from the E.coli ribosomal 16S-RNA. An X-ray and neutron small-angle scattering study. Nucleic Acids Res. 8, 6221–6231. doi:10.1093/nar/8.24.6221
Osterholz, H., Stevens, A., Abramsson, M. L., Lama, D., Brackmann, K., Rising, A., et al. (2025). Native Mass Spectrometry Captures the Conformational Plasticity of Proteins with Low-Complexity Domains. JACS Au 5, 281–290. doi:10.1021/jacsau.4c00961
Owen, I., and Shewmaker, F. (2019). The Role of Post-Translational Modifications in the Phase Transitions of Intrinsically Disordered Proteins. Int. J. Mol. Sci. 20, 5501. doi:10.3390/ijms20215501
Pack, C.-G., Aoki, K., Taguchi, H., Yoshida, M., Kinjo, M., and Tamura, M. (2000). Effect of electrostatic interactions on the binding of charged substrate to GroEL studied by highly sensitive fluorescence correlation spectroscopy. Biochem. Biophysical Res. Commun. 267, 300–304. doi:10.1006/bbrc.1999.1864
Pan, S., Chen, R., Aebersold, R., and Brentnall, T. A. (2011). Mass spectrometry based glycoproteomics--from a proteomics perspective. Mol. and Cell. Proteomics 10, R110 003251. doi:10.1074/mcp.r110.003251
Pancsa, R., Schad, E., Tantos, A., and Tompa, P. (2019). Emergent functions of proteins in non-stoichiometric supramolecular assemblies. Biochimica Biophysica Acta (BBA) - Proteins Proteomics 1867, 970–979. doi:10.1016/j.bbapap.2019.02.007
Parsons, D. F., and Akers, C. K. (1969). Neutron diffraction of cell membranes (myelin). Science 165, 1016–1018. doi:10.1126/science.165.3897.1016
Parupudi, A., Chaturvedi, S. K., Adão, R., Harkness, R. W., Dragulin-Otto, S., Kay, L. E., et al. (2021). Global multi-method analysis of interaction parameters for reversibly self-associating macromolecules at high concentrations. Sci. Rep. 11, 5741. doi:10.1038/s41598-021-84946-8
Pauling, L., and Corey, R. B. (1951). Configurations of Polypeptide Chains With Favored Orientations Around Single Bonds: Two New Pleated Sheets. Proc. Natl. Acad. Sci. U. S. A. 37, 729–740. doi:10.1073/pnas.37.11.729
Paulsson, M., and Dejmek, P. (1990). Thermal denaturation of whey proteins in mixtures with caseins studied by differential scanning calorimetry. J. Dairy Sci. 73, 590–600. doi:10.3168/jds.s0022-0302(90)78707-3
Paz, A., Zeev-Ben-Mordehai, T., Lundqvist, M., Sherman, E., Mylonas, E., Weiner, L., et al. (2008). Biophysical characterization of the unstructured cytoplasmic domain of the human neuronal adhesion protein neuroligin 3. Biophysical J. 95, 1928–1944. doi:10.1529/biophysj.107.126995
Pearce, K. N. (1975). A fluorescence study of the temperature-dependent polymerization of bovine beta-casein A1. Eur. J. Biochem. 58, 23–29. doi:10.1111/j.1432-1033.1975.tb02344.x
Pecora, R. D. (1964). Doppler shifts in light scattering from pure liquids and polymer solutions. J. Chem. Phys. 40, 1604–1614. doi:10.1063/1.1725368
Pelikan, M., Hura, G. L., and Hammel, M. (2009). Structure and flexibility within proteins as identified through small angle X-ray scattering. General Physiology Biophysics 28, 174–189. doi:10.4149/gpb_2009_02_174
Peng, S., Li, W., Yao, Y., Xing, W., Li, P., and Chen, C. (2020). Phase separation at the nanoscale quantified by dcFCCS. Proc. Natl. Acad. Sci. U. S. A. 117, 27124–27131. doi:10.1073/pnas.2008447117
Permyakov, S. E. (2012). Differential scanning microcalorimetry of intrinsically disordered proteins. Methods Mol. Biol. 896, 283–296. doi:10.1007/978-1-4614-3704-8_19
Permyakov, E. A., and Uversky, V. N. (2010). “Fluorescence spectroscopy of intrinsically disordered proteins,” in Instrumental analysis of intrinsically disordered proteins: Assessing structure and conformation (Hoboken, NJ, USA: John Wiley and Sons, Inc.), 323–344.
Permyakov, S. E., Millett, I. S., Doniach, S., Permyakov, E. A., and Uversky, V. N. (2003). Natively unfolded C-terminal domain of caldesmon remains substantially unstructured after the effective binding to calmodulin. Proteins Struct. Funct. Bioinforma. 53, 855. doi:10.1002/prot.10481
Permyakov, S. E., Permyakov, E. A., and Uversky, V. N. (2015). Intrinsically disordered caldesmon binds calmodulin via the “buttons on a string” mechanism. PeerJ 3, e1265. doi:10.7717/peerj.1265
Perrin, F. (1926). Polarisation de la lumière de fluorescence. Vie moyenne des molécules dans l'etat excité. J. Phys. Radium 7, 390–401. doi:10.1051/jphysrad:01926007012039000
Perrin, F. (1932). Théorie quantique des transferts d’activation entre molccules de même espèce. Cas des solutions fluorescentes. Annales de Physique 10, 283–314. doi:10.1051/ANPHYS/193210170283
Perutz, M. F., Miurhead, H., Cox, J. M., Goaman, L. C., Mathews, F. S., Mcgandy, E. L., et al. (1968). Three-dimensional Fourier synthesis of horse oxyhaemoglobin at 2.8 A resolution: (1) x-ray analysis. Nature 219, 29–32. doi:10.1038/219029a0
Pervushin, K., Vamvaca, K., Vogeli, B., and Hilvert, D. (2007). Structure and dynamics of a molten globular enzyme. Nat. Struct. Mol. Biol. 14, 1202–1206. doi:10.1038/nsmb1325
Phillips, J., Legrand, A., and Lehnert, W. (1988). Protein folding observed by time-resolved synchrotron x-ray scattering. A feasibility study. Biophysical J. 53, 461–464. doi:10.1016/s0006-3495(88)83123-0
Poiseuille, J. (1838). Ecoulement des Liquides: Societe Philomatique de Paris. Extr. Des. Proces-Verbaux Des. Seances Pendant I’Annee 3, 77–81.
Polverino De Laureto, P., Frare, E., Gottardo, R., Van Dael, H., and Fontana, A. (2002). Partly folded states of members of the lysozyme/lactalbumin superfamily: a comparative study by circular dichroism spectroscopy and limited proteolysis. Protein Sci. 11, 2932–2946. doi:10.1110/ps.0205802
Porath, J. (1968). Sweden: Molecular Sieving and Adsorption. Nature 218, 834–838. doi:10.1038/218834a0
Porath, J., and Flodin, P. (1959). Gel filtration: a method for desalting and group separation. Nature 183, 1657–1659. doi:10.1038/1831657a0
Potschka, M. (1987). Universal calibration of gel permeation chromatography and determination of molecular shape in solution. Anal. Biochem. 162, 47–64. doi:10.1016/0003-2697(87)90009-1
Prakash, A., Mallick, P., Whiteaker, J., Zhang, H., Paulovich, A., Flory, M., et al. (2006). Signal maps for mass spectrometry-based comparative proteomics. Mol. and Cell. Proteomics 5, 423–432. doi:10.1074/mcp.m500133-mcp200
Prakash, A., Piening, B., Whiteaker, J., Zhang, H., Shaffer, S. A., Martin, D., et al. (2007). Assessing bias in experiment design for large scale mass spectrometry-based quantitative proteomics. Mol. and Cell. Proteomics 6, 1741–1748. doi:10.1074/mcp.m600470-mcp200
Pramanik, A. (2004). Ligand-receptor interactions in live cells by fluorescence correlation spectroscopy. Curr. Pharm. Biotechnol. 5, 205–212. doi:10.2174/1389201043377002
Pretorius, H. T., Nandi, P. K., Lippoldt, R. E., Johnson, M. L., Keen, J. H., Pastan, I., et al. (1981). Molecular characterization of human clathrin. Biochemistry 20, 2777–2782. doi:10.1021/bi00513a011
Privalov, P. L. (1979). Stability of proteins: small globular proteins. Adv. Protein Chem. 33, 167–241. doi:10.1016/s0065-3233(08)60460-x
Privalov, P. L. (2009). Microcalorimetry of proteins and their complexes. Methods Mol. Biol. 490, 1–39. doi:10.1007/978-1-59745-367-7_1
Privalov, P. L., and Makhatadze, G. I. (1990). Heat capacity of proteins. II. Partial molar heat capacity of the unfolded polypeptide chain of proteins: protein unfolding effects. J. Mol. Biol. 213, 385–391. doi:10.1016/s0022-2836(05)80198-6
Privalov, P. L., Kafiani, K. A., and Monaselidze, D. R. (1964). Study of heat denaturation of DNA by use of the adiabatic scanning microcalorimeter. Dokl. Akad. Nauk. SSSR 156, 951–953.
Ptitsyn, O. B. (1995). Molten globule and protein folding. Adv. Protein Chem. 47, 83–229. doi:10.1016/s0065-3233(08)60546-x
Putzeys, P., and Brosteaux, J. (1935). The scattering of light in protein solutions. Trans. Faraday Soc. 31, 1314–1325. doi:10.1039/tf9353101314
Putzeys, P., and Brosteaux, J. (1941). Light scattering and the molecular weight of the proteins. Mededeel Koninkl. Vlaam. Acad. Wet. Belg. Kl. Wet. 3, 3–23.
Radivojac, P., Iakoucheva, L. M., Oldfield, C. J., Obradovic, Z., Uversky, V. N., and Dunker, A. K. (2007). Intrinsic disorder and functional proteomics. Biophysical J. 92, 1439–1456. doi:10.1529/biophysj.106.094045
Rafa, A. Y., Filliaux, S., and Lyubchenko, Y. L. (2024). Nanoscale Characterization of Interaction of Nucleosomes with H1 Linker Histone. Int. J. Mol. Sci. 26, 303. doi:10.3390/ijms26010303
Rajasekar, K., Muntaha, S. T., Tame, J. R. H., Kommareddy, S., Morris, G., Wharton, C. W., et al. (2010). Order and disorder in the domain organization of the plasmid partition protein KorB. J. Biol. Chem. 285, 15440–15449. doi:10.1074/jbc.m109.096099
Ramachandran, J., Berger, A., and Katchalski, E. (1971). Synthesis and physicochemical properties in aqueous solution of the sequential polypeptide poly (Tyr-Ala-Glu). Biopolymers 10, 1829–1851. doi:10.1002/bip.360101007
Raman, C. V., and Krishnan, K. S. (1928). A new type of secondary radiation. Nature 121, 501–502. doi:10.1038/121501c0
Randall, C. S., and Zand, R. (1985). Spectroscopic assessment of secondary and tertiary structure in myelin basic protein. Biochemistry 24, 1998–2004. doi:10.1021/bi00329a030
Receveur-Bréchot, V., Bourhis, J. M., Uversky, V. N., Canard, B., and Longhi, S. (2006). Assessing protein disorder and induced folding. Proteins 62, 24–45. doi:10.1002/prot.20750
Reddy, P.J., Ray, S., and Srivastava, S. (2015). The Quest of the Human Proteome and the Missing Proteins: Digging Deeper. Omics-a J. Integr. Biol. 19, 276–282. doi:10.1089/omi.2015.0035
Reid, D. J., Thibert, S., and Zhou, M. (2023). Dissecting the structural heterogeneity of proteins by native mass spectrometry. Protein Sci. 32, e4612. doi:10.1002/pro.4612
Resetca, D., and Wilson, D. J. (2013). Characterizing rapid, activity-linked conformational transitions in proteins via sub-second hydrogen deuterium exchange mass spectrometry. FEBS J. 280, 5616–5625. doi:10.1111/febs.12332
Rigler, R., Grasselli, P., and Ehrenberg, M. (1979). Fluorescence correlation spectroscopy and application to the study of Brownian motion of biopolymers. Phys. Scr. 19, 486–490. doi:10.1088/0031-8949/19/4/030
Rimai, L., Kilponen, R., and Gill, D. (1970). Resonance-enhanced Raman spectra of visual pigments in intact bovine retinas at low temperatures. Biochem. Biophysical Res. Commun. 41, 492–497. doi:10.1016/0006-291x(70)90533-4
Rogers, D. M., Jasim, S. B., Dyer, N. T., Auvray, F., Réfrégiers, M., and Hirst, J. D. (2019). Electronic circular dichroism spectroscopy of proteins. Chem 5, 2751–2774. doi:10.1016/j.chempr.2019.07.008
Romero, P., Obradovic, Z., Li, X., Garner, E. C., Brown, C. J., and Dunker, A. K. (2001). Sequence complexity of disordered protein. Proteins 42, 38–48. doi:10.1002/1097-0134(20010101)42:1<38::aid-prot50>3.0.co;2-3
Różycki, B., Kim, Y. C., and Hummer, G. (2011). SAXS ensemble refinement of ESCRT-III CHMP3 conformational transitions. Structure 19, 109–116. doi:10.1016/j.str.2010.10.006
Rubinov, A., and Tomin, V. (1970). Bathochromic luminescence insolutions of organic dyes at low temperatures. Opt. SPECTROSCOPY-USSR 29, 578.
Rygula, A., Majzner, K., Marzec, K. M., Kaczor, A., Pilarczyk, M., and Baranska, M. (2013). Raman spectroscopy of proteins: a review. J. Raman Spectrosc. 44, 1061–1076. doi:10.1002/jrs.4335
Sabido, E., Selevsek, N., and Aebersold, R. (2012). Mass spectrometry-based proteomics for systems biology. Curr. Opin. Biotechnol. 23, 591–597. doi:10.1016/j.copbio.2011.11.014
Sakiyama, Y., Mazur, A., Kapinos, L. E., and Lim, R. Y. (2016). Spatiotemporal dynamics of the nuclear pore complex transport barrier resolved by high-speed atomic force microscopy. Nat. Nanotechnol. 11, 719–723. doi:10.1038/nnano.2016.62
Salmas, R. E., and Borysik, A. J. (2021). HDXmodeller: an online webserver for high-resolution HDX-MS with auto-validation. Commun. Biol. 4, 199. doi:10.1038/s42003-021-01709-x
Saltzberg, D. J., Broughton, H. B., Pellarin, R., Chalmers, M. J., Espada, A., Dodge, J. A., et al. (2017). A Residue-Resolved Bayesian Approach to Quantitative Interpretation of Hydrogen-Deuterium Exchange from Mass Spectrometry: Application to Characterizing Protein-Ligand Interactions. J. Phys. Chem. B 121, 3493–3501. doi:10.1021/acs.jpcb.6b09358
Salvay, A. G., Communie, G., and Ebel, C. (2012). Sedimentation velocity analytical ultracentrifugation for intrinsically disordered proteins. Methods Mol. Biol. 896, 91–105. doi:10.1007/978-1-4614-3704-8_6
Sánchez-Puig, N., Veprintsev, D. B., and Fersht, A. R. (2005). Human full-length Securin is a natively unfolded protein. Protein Sci. 14, 1410–1418. doi:10.1110/ps.051368005
Sandoval, I. V., and Weber, K. (1978). Calcium-induced inactivation of microtubule formation in brain extracts. Presence of a calcium-dependent protease acting on polymerization-stimulating microtubule-associated proteins. Eur. J. Biochem. 92, 463–470. doi:10.1111/j.1432-1033.1978.tb12768.x
Sane, S. U., Cramer, S. M., and Przybycien, T. M. (1999). A holistic approach to protein secondary structure characterization using amide I band Raman spectroscopy. Anal. Biochem. 269, 255–272. doi:10.1006/abio.1999.4034
Santambrogio, C., Natalello, A., Brocca, S., Ponzini, E., and Grandori, R. (2019). Conformational Characterization and Classification of Intrinsically Disordered Proteins by Native Mass Spectrometry and Charge-State Distribution Analysis. Proteomics 19, e1800060. doi:10.1002/pmic.201800060
Santambrogio, C., Ponzini, E., and Grandori, R. (2022). Native mass spectrometry for the investigation of protein structural (dis)order. Biochimica Biophysica Acta (BBA) - Proteins Proteomics 1870, 140828. doi:10.1016/j.bbapap.2022.140828
Saunders, M., Wishnia, A., and Kirkwood, J. G. (1957). The nuclear magnetic resonance spectrum of ribonuclease. J. Am. Chem. Soc. 79, 3289–3290. doi:10.1021/ja01569a083
Schluter, H., Apweiler, R., Holzhutter, H. G., and Jungblut, P. R. (2009). Finding one's way in proteomics: a protein species nomenclature. Chem. Central J. 3, 11. doi:10.1186/1752-153x-3-11
Schneider, R., Mayer, A., Schmatz, W., Kaiser, B., and Scherm, R. (1969). Neutron small-angle scattering from aqueous solutions of oxy-and deoxyhaemoglobin. J. Mol. Biol. 41, 231–235. doi:10.1016/0022-2836(69)90388-x
Schoenborn, B. P. (1969). Neutron diffraction analysis of myoglobin. Nature 224, 143–146. doi:10.1038/224143a0
Schramm, A., Bignon, C., Brocca, S., Grandori, R., Santambrogio, C., and Longhi, S. (2019). An arsenal of methods for the experimental characterization of intrinsically disordered proteins - How to choose and combine them? Archives Biochem. Biophysics 676, 108055. doi:10.1016/j.abb.2019.07.020
Schubart, U. K., Alago, W., and Danoff, A. (1987). Properties of p19, a novel cAMP-dependent protein kinase substrate protein purified from bovine brain. J. Biol. Chem. 262, 11871–11877. doi:10.1016/s0021-9258(18)60895-6
Schuck, P. (2013). Analytical Ultracentrifugation as a Tool for Studying Protein Interactions. Biophys. Rev. 5, 159–171. doi:10.1007/s12551-013-0106-2
Schuler, B., Soranno, A., Hofmann, H., and Nettels, D. (2016). Single-Molecule FRET Spectroscopy and the Polymer Physics of Unfolded and Intrinsically Disordered Proteins. Annu. Rev. Biophys. 45, 207–231. doi:10.1146/annurev-biophys-062215-010915
Schwaighofer, A., and Lendl, B. (2023). “Infrared spectroscopy for structure analysis of protein inclusion bodies,” in Inclusion Bodies: Methods and Protocols (Springer), 209–223.
Schweers, O., Schonbrunn-Hanebeck, E., Marx, A., and Mandelkow, E. (1994). Structural studies of tau protein and Alzheimer paired helical filaments show no evidence for beta-structure. J. Biol. Chem. 269, 24290–24297. doi:10.1016/s0021-9258(19)51080-8
Scott, D. J., and Winzor, D. J. (2015). Characterization of Intrinsically Disordered Proteins by Analytical Ultracentrifugation. Methods Enzym. 562, 225–239. doi:10.1016/bs.mie.2015.06.034
Segel, D. J., Eliezer, D., Uversky, V., Fink, A. L., Hodgson, K. O., and Doniach, S. (1999). Transient dimer in the refolding kinetics of cytochrome c characterized by small-angle X-ray scattering. Biochemistry 38, 15352–15359. doi:10.1021/bi991337k
Semisotnov, G. V., Kihara, H., Kotova, N. V., Kimura, K., Amemiya, Y., Wakabayashi, K., et al. (1996). Protein globularization during folding. A study by synchrotron small-angle X-ray scattering. J. Mol. Biol. 262, 559–574. doi:10.1006/jmbi.1996.0535
Shahrajabian, M. H., and Sun, W. (2024). Characterization of Intrinsically Disordered Proteins in Healthy and Diseased States by Nuclear Magnetic Resonance. Rev. Recent Clin. Trials 19, 176–188. doi:10.2174/0115748871271420240213064251
Shi, L., Kataoka, M., and Fink, A. L. (1996). Conformational characterization of DnaK and its complexes by small-angle X-ray scattering. Biochemistry 35, 3297–3308. doi:10.1021/bi951984l
Shi, Z., Woody, R. W., and Kallenbach, N. R. (2002). Is polyproline II a major backbone conformation in unfolded proteins? Adv. protein Chem. 62, 163–240. doi:10.1016/s0065-3233(02)62008-x
Shore, V., and Pardee, A. B. (1956). Fluorescence of some proteins, nucleic acids and related compounds. Archives Biochem. Biophysics 60, 100–107. doi:10.1016/0003-9861(56)90401-5
Sjögren, B., and Svedberg, T. (1930). The molecular weight of legumin. J. Am. Chem. Soc. 52, 3279–3283. doi:10.1021/ja01371a038
Skinner, S. P., Radou, G., Tuma, R., Houwing-Duistermaat, J. J., and Paci, E. (2019). Estimating Constraints for Protection Factors from HDX-MS Data. Biophysical J. 116, 1194–1203. doi:10.1016/j.bpj.2019.02.024
Smekal, A. (1923). Zur quantentheorie der dispersion. Naturwissenschaften 11, 873–875. doi:10.1007/bf01576902
Smit, J. H., Krishnamurthy, S., Srinivasu, B. Y., Parakra, R., Karamanou, S., and Economou, A. (2021). Probing Universal Protein Dynamics Using Hydrogen-Deuterium Exchange Mass Spectrometry-Derived Residue-Level Gibbs Free Energy. Anal. Chem. 93, 12840–12847. doi:10.1021/acs.analchem.1c02155
Smith, T. (1999). Prelude to NMR studies of protein folding. Nat. Struct. Biol. 6, 608. doi:10.1038/10647
Smith, A., and Winkler, H. (1967). Purification and properties of an acidic protein from chromaffin granules of bovine adrenal medulla. Biochem. J. 103, 483–492. doi:10.1042/bj1030483
Smith, L. M., Kelleher, N. L., and Consortium for Top Down, P. (2013). Proteoform: a single term describing protein complexity. Nat. Methods 10, 186–187. doi:10.1038/nmeth.2369
Smoluch, M., and Silberring, J. (2019). “A brief history of mass spectrometry,” in Mass Spectrometry: An Applied Approach. Editors M. Smoluch, G. Grasso, P. Suder, and J. Silberring (Hoboken, USA: John Wiley and Sons, Inc.), 5–8.
Smyth, E., Syme, C. D., Blanch, E. W., Hecht, L., Vašák, M., and Barron, L. D. (2001). Solution structure of native proteins with irregular folds from Raman optical activity. Biopolymers 58, 138–151. doi:10.1002/1097-0282(200102)58:2<138::aid-bip30>3.0.co;2-w
Sohar, I., Bird, J. W., and Moore, P. B. (1986). Calcium-dependent proteolysis of calcium-binding proteins. Biochem. Biophysical Res. Commun. 134, 1269–1275. doi:10.1016/0006-291x(86)90387-6
Solouki, T., Gillig, K. J., and Russell, D. H. (1994a). Detection of high-mass biomolecules in Fourier transform ion cyclotron resonance mass spectrometry: theoretical and experimental investigations. Anal. Chem. 66, 1583–1587. doi:10.1021/ac00081a037
Solouki, T., Gillig, K. J., and Russell, D. H. (1994b). Mass measurement accuracy of matrix-assisted laser desorbed biomolecules: a Fourier-transform ion cyclotron resonance mass spectrometry study. Rapid Commun. Mass Spectrom. 8, 26–31. doi:10.1002/rcm.1290080106
Sonoyama, M., Motoki, A., Okamoto, G., Hirano, M., Ishida, H., and Katoh, S. (1996). Secondary structure and thermostability of the photosystem II manganese-stabilizing protein of the thermophilic cyanobacterium Synechococcus elongatus. Biochimica Biophysica Acta (BBA) - Protein Struct. Mol. Enzym. 1297, 167–170. doi:10.1016/s0167-4838(96)00099-4
Sorscher, S. M., Bartholomew, J. C., and Klein, M. P. (1980). The use of fluorescence correlation spectroscopy to probe chromatin in the cell nucleus. Biochimica Biophysica Acta (BBA)-Nucleic Acids Protein Synthesis 610, 28–46. doi:10.1016/0005-2787(80)90053-2
Soulages, J. L., Kim, K., Arrese, E. L., Walters, C., and Cushman, J. C. (2003). Conformation of a group 2 late embryogenesis abundant protein from soybean. Evidence of poly (L-proline)-type II structure. Plant Physiol. 131, 963–975. doi:10.1104/pp.015891
Stair, R., and Coblentz, W. (1935). Infrared absorption spectra of plant and animal tissue and of various other substances. J. Res. Natl. Bureau Stand. 15, 295. doi:10.6028/jres.015.017
Stamatoff, J. (1979). An approach for time-resolved x-ray scattering. Biophysical J. 26, 325–327. doi:10.1016/s0006-3495(79)85252-2
Steinberg, I. Z., and Katchalski, E. (1968). Theoretical analysis of the role of diffusion in chemical reactions, fluorescence quenching, and nonradiative energy transfer. J. Chem. Phys. 48, 2404–2410. doi:10.1063/1.1669460
Stellwagen, E., Rysavy, R., and Babul, G. (1972). The conformation of horse heart apocytochrome c. J. Biol. Chem. 247, 8074–8077. doi:10.1016/s0021-9258(20)81811-0
Sterrer, S., and Henco, K. (1997). Minireview: Fluorescence Correlation Spectroscopy (FCS) - A Highly Sensitive Method to Analyze Drug/Target Interactions. J. Recept. Signal Transduct. 17, 511–520. doi:10.3109/10799899709036624
Stewart, L., Ireton, G. C., Parker, L. H., Madden, K. R., and Champoux, J. J. (1996). Biochemical and biophysical analyses of recombinant forms of human topoisomerase I. J. Biol. Chem. 271, 7593–7601. doi:10.1074/jbc.271.13.7593
Stofella, M., Skinner, S. P., Sobott, F., Houwing-Duistermaat, J., and Paci, E. (2022). High-Resolution Hydrogen-Deuterium Protection Factors from Sparse Mass Spectrometry Data Validated by Nuclear Magnetic Resonance Measurements. J. Am. Soc. Mass Spectrom. 33, 813–822. doi:10.1021/jasms.2c00005
Stokes, G. G. (1851). On the effect of the internal friction of fluids on the motion of pendulums. Trans. Cambridge Philos. Soc. 9, 8–106.
Stokes, G. G. (1852). XXX. On the change of refrangibility of light. Philosophical Trans. R. Soc. Lond., 463–562.
Stokes, G. G. (1853). On the change of refrangibility of light.--no. II. Philosophical Trans. R. Soc. Lond., 385–396.
Stormberg, T., Vemulapalli, S., Filliaux, S., and Lyubchenko, Y. L. (2021). Effect of histone H4 tail on nucleosome stability and internucleosomal interactions. Sci. Rep. 11, 24086. doi:10.1038/s41598-021-03561-9
Struwe, W. B., and Robinson, C. V. (2019). Relating glycoprotein structural heterogeneity to function - insights from native mass spectrometry. Curr. Opin. Struct. Biol. 58, 241–248. doi:10.1016/j.sbi.2019.05.019
Stryer, L. (1978). Fluorescence energy transfer as a spectroscopic ruler. Annu. Rev. Biochem. 47, 819–846. doi:10.1146/annurev.bi.47.070178.004131
Stryer, L., and Haugland, R. P. (1967). Energy transfer: a spectroscopic ruler. Proc. Natl. Acad. Sci. U. S. A. 58, 719–726. doi:10.1073/pnas.58.2.719
Stuchfield, D., and Barran, P. (2018). Unique insights to intrinsically disordered proteins provided by ion mobility mass spectrometry. Curr. Opin. Chem. Biol. 42, 177–185. doi:10.1016/j.cbpa.2018.01.007
Stumme-Diers, M. P., Stormberg, T., Sun, Z., and Lyubchenko, Y. L. (2019). Probing The Structure And Dynamics Of Nucleosomes Using Atomic Force Microscopy Imaging. J. Vis. Exp. doi:10.3791/58820
Suder, D. S., and Gonen, S. (2024). Mitigating the Blurring Effect of CryoEM Averaging on a Flexible and Highly Symmetric Protein Complex through Sub-Particle Reconstruction. Int. J. Mol. Sci. 25, 5665. doi:10.3390/ijms25115665
Sugiyama, M., Horikoshi, N., Suzuki, Y., Taguchi, H., Kujirai, T., Inoue, R., et al. (2015). Solution structure of variant H2A.Z.1 nucleosome investigated by small-angle X-ray and neutron scatterings. Biochem. Biophysics Rep. 4, 28–32. doi:10.1016/j.bbrep.2015.08.019
Summers, M. F., Henderson, L. E., Chance, M. R., South, T. L., Blake, P. R., Perez-Alvarado, G., et al. (1992). Nucleocapsid zinc fingers detected in retroviruses: EXAFS studies of intact viruses and the solution-state structure of the nucleocapsid protein from HIV-1. Protein Sci. 1, 563–574. doi:10.1002/pro.5560010502
Susi, H. (1972). “[22] Infrared spectroscopy—Conformation,” in Methods in enzymology (Elsevier), 455–472.
Sutera, S. P., and Skalak, R. (1993). The history of Poiseuille's law. Annu. Rev. Fluid Mech. 25, 1–20. doi:10.1146/annurev.fl.25.010193.000245
Sutherland, G. (1952). Infrared analysis of the structure of amino acids, polypeptides and proteins. Adv. Protein Chem. 7, 291–318. doi:10.1016/s0065-3233(08)60021-2
Svedberg, T. (1931). Determination of the molecular weight of insulin. Nature 127, 438–439. doi:10.1038/127438b0
Svedberg, T., and Chirnoaga, E. (1928). The molecular weight of hemocyanin. J. Am. Chem. Soc. 50, 1399–1411. doi:10.1021/ja01392a024
Svedberg, T., and Eriksson, I.-B. (1932). Molecular weights of the blood pigments of Arenicola and of Lumbricus. Nature 130, 434–435. doi:10.1038/130434a0
Svedberg, T., and Fåhraeus, R. (1926). A new method for the determination of the molecular weight of the proteins. J. Am. Chem. Soc. 48, 430–438. doi:10.1021/ja01413a019
Svedberg, T., and Hedenius, A. (1933). Molecular weights of the blood pigments of the invertebrates. Nature 131, 325. doi:10.1038/131325a0
Svedberg, T., and Heyroth, F. F. (1929). The molecular weight of the hemocyanin of Limulus polyphemus. J. Am. Chem. Soc. 51, 539–550. doi:10.1021/ja01377a026
Svedberg, T., and Lewis, N. (1928). The molecular weights of phycoerythrin and of phycocyan. J. Am. Chem. Soc. 50, 525–536. doi:10.1021/ja01389a042
Svedberg, T., and Nichols, J. B. (1923). Determination of size and distribution of size of particle by centrifugal methods. J. Am. Chem. Soc. 45, 2910–2917. doi:10.1021/ja01665a016
Svedberg, T., and Nichols, J. (1926). The molecular weight of egg albumin i. In electrolyte-free condition. J. Am. Chem. Soc. 48, 3081–3092. doi:10.1021/ja01691a008
Svedberg, T., and Rinde, H. (1924). The ultra-centrifuge, a new instrument for the determination of size and distribution of size of particle in amicroscopic colloids. J. Am. Chem. Soc. 46, 2677–2693. doi:10.1021/ja01677a011
Svedberg, T., and Sjögren, B. (1928). The molecular weights of serum albumin and of serum globulin. J. Am. Chem. Soc. 50, 3318–3332. doi:10.1021/ja01399a025
Svedberg, T., and Sjögren, B. (1929). The molecular weight of Bence-Jones protein. J. Am. Chem. Soc. 51, 3594–3605. doi:10.1021/ja01387a013
Svedberg, T., and Sjögren, B. (1930). The molecular weights of amandin and of excelsin. J. Am. Chem. Soc. 52, 279–287. doi:10.1021/ja01364a040
Svedberg, T., and Stamm, A. J. (1929). The molecular weight of edestin. J. Am. Chem. Soc. 51, 2170–2185. doi:10.1021/ja01382a030
Svedberg, T., Carpenter, L., and Carpenter, D. (1930a). The molecular weight of casein. I1. J. Am. Chem. Soc. 52, 241–252. doi:10.1021/ja01364a036
Svedberg, T., Carpenter, L., and Carpenter, D. (1930b). The molecular weight of casein. II. J. Am. Chem. Soc. 52, 701–710. doi:10.1021/ja01365a041
Svergun, D. I., and Koch, M. H. (2003). Small-angle scattering studies of biological macromolecules in solution. Rep. Prog. Phys. 66, 1735–1782. doi:10.1088/0034-4885/66/10/r05
Svergun, D. I., Pedersen, J. S., Serdyuk, I. N., and Koch, M. H. (1994). Solution scattering from 50S ribosomal subunit resolves inconsistency between electron microscopic models. Proc. Natl. Acad. Sci. U. S. A. 91, 11826–11830. doi:10.1073/pnas.91.25.11826
Svergun, D. I., Koch, M. H., Pedersen, J. S., and Serdyuk, I. N. (1996). Structural model of the 50S subunit of E. coli ribosomes from solution scattering. Basic Life Sci. 64, 149–174. doi:10.1007/978-1-4615-5847-7_15
Szabó, Á., Szöllősi, J., and Nagy, P. (2022). Principles of Resonance Energy Transfer. Curr. Protoc. 2, e625. doi:10.1002/cpz1.625
Tamara, S., Den Boer, M. A., and Heck, A. J. R. (2022). High-Resolution Native Mass Spectrometry. Chem. Rev. 122, 7269–7326. doi:10.1021/acs.chemrev.1c00212
Tanford, C. (1968). Protein denaturation. Adv. Protein Chem. 23, 121–282. doi:10.1016/s0065-3233(08)60401-5
Tanford, C., Kawahara, K., and Lapanje, S. (1966). Proteins in 6 m guanidine hydrochloride: demonstration of random coil behavior. J. Biol. Chem. 241, 1921–1923. doi:10.1016/s0021-9258(18)96726-8
Tao, Y., Yan, J., and Cai, B. (2021). Label-Free Bio-Affinity Mass Spectrometry for Screening and Locating Bioactive Molecules. Mass Spectrom. Rev. 40, 53–71. doi:10.1002/mas.21613
Teale, F., and Weber, G. (1957). Ultraviolet fluorescence of the aromatic amino acids. Biochem. J. 65, 476–482. doi:10.1042/bj0650476
Testa, L., Brocca, S., and Grandori, R. (2011). Charge-surface correlation in electrospray ionization of folded and unfolded proteins. Anal. Chem. 83, 6459–6463. doi:10.1021/ac201740z
Testa, L., Brocca, S., Santambrogio, C., D’Urzo, A., Habchi, J., Longhi, S., et al. (2013). Extracting structural information from charge-state distributions of intrinsically disordered proteins by non-denaturing electrospray-ionization mass spectrometry. Intrinsically Disord. Proteins 1, e25068. doi:10.4161/idp.25068
Thomas, J. O., and Kornberg, R. D. (1975). An octamer of histones in chromatin and free in solution. Proc. Natl. Acad. Sci. 72, 2626–2630. doi:10.1073/pnas.72.7.2626
Thomas, J., Van Patten, S. M., Howard, P., Day, K. H., Mitchell, R. D., Sosnick, T., et al. (1991). Expression in Escherichia coli and characterization of the heat-stable inhibitor of the cAMP-dependent protein kinase. J. Biol. Chem. 266, 10906–10911. doi:10.1016/s0021-9258(18)99105-2
Thompson, J. J., and Thomson, J. (1913). Rays of positive electricity and their application to chemical analyses. Green: Longmans.
Thomson, J. J., and Rutherford, E. (1896). “XL. On the passage of electricity through gases exposed to Röntgen rays,” Lond. Edinb. Dublin Philosophical Mag. J. Sci., 42. 392–407. doi:10.1080/14786449608620932
Timasheff, S. N., Townend, R., and Perlmann, G. E. (1967). The circular dichroism of phosvitin. J. Biol. Chem. 242, 2290–2292. doi:10.1016/s0021-9258(18)96049-7
Timm, D. E., Vissavajjhala, P., Ross, A. H., and Neet, K. E. (1992). Spectroscopic and chemical studies of the interaction between nerve growth factor (NGF) and the extracellular domain of the low affinity NGF receptor. Protein Sci. 1, 1023–1031. doi:10.1002/pro.5560010808
Tompa, P. (2002). Intrinsically unstructured proteins. Trends Biochem. Sci. 27, 527–533. doi:10.1016/s0968-0004(02)02169-2
Tria, G., Mertens, H. D., Kachala, M., and Svergun, D. I. (2015). Advanced ensemble modelling of flexible macromolecules using X-ray solution scattering. IUCrJ 2, 207–217. doi:10.1107/s205225251500202x
Tripathi, T., Uversky, V. N., and Giuliani, A. (2025). Intelligent' proteins. Cell Mol. Life Sci. 82, 239. doi:10.1007/s00018-025-05770-1
Tsuruta, H., Nagamura, T., Kimura, K., Igarashi, Y., Kajita, A., Wang, Z. X., et al. (1989). Stopped-flow apparatus for x-ray scattering at subzero temperature. Rev. Sci. Instrum. 60, 2356–2358. doi:10.1063/1.1140768
Tsuruta, H., Sano, T., Vachette, P., Taue, P., Moody, M. F., Wakabayashi, K., et al. (1990). Structural kinetics of the allosteric transition of aspartate transcarbamylase produced by physiological substrates. FEBS Lett. 263, 66–68. doi:10.1016/0014-5793(90)80706-o
Turoverov, K. K., Kuznetsova, I. M., Fonin, A. V., Darling, A. L., Zaslavsky, B. Y., and Uversky, V. N. (2019). Stochasticity of Biological Soft Matter: Emerging Concepts in Intrinsically Disordered Proteins and Biological Phase Separation. Trends Biochem. Sci. 44, 716–728. doi:10.1016/j.tibs.2019.03.005
Turzo, S., Seffernick, J. T., Rolland, A. D., Donor, M. T., Heinze, S., Prell, J. S., et al. (2022). Protein shape sampled by ion mobility mass spectrometry consistently improves protein structure prediction. Nat. Commun. 13, 4377. doi:10.1038/s41467-022-32075-9
Uberbacher, E. C., Ramakrishnan, V., Olins, D. E., and Bunick, G. J. (1983). Neutron scattering studies of nucleosome structure at low ionic strength. Biochemistry 22, 4916–4923. doi:10.1021/bi00290a007
Uchihashi, T., Iino, R., Ando, T., and Noji, H. (2011). High-speed atomic force microscopy reveals rotary catalysis of rotorless F(1)-ATPase. Science 333, 755–758. doi:10.1126/science.1205510
Uchihashi, T., Watanabe, Y. H., Nakazaki, Y., Yamasaki, T., Watanabe, H., Maruno, T., et al. (2018). Dynamic structural states of ClpB involved in its disaggregation function. Nat. Commun. 9, 2147. doi:10.1038/s41467-018-04587-w
Uhlen, M., Bjorling, E., Agaton, C., Szigyarto, C. A., Amini, B., Andersen, E., et al. (2005). A human protein atlas for normal and cancer tissues based on antibody proteomics. Mol. and Cell. Proteomics 4, 1920–1932. doi:10.1074/mcp.m500279-mcp200
Uversky, V. N. (1993). Use of fast protein size-exclusion liquid chromatography to study the unfolding of proteins which denature through the molten globule. Biochemistry 32, 13288–13298. doi:10.1021/bi00211a042
Uversky, V. N. (1994). Gel-permeation chromatography as a unique instrument for quantitative and qualitative analysis of protein denaturation and unfolding. Int. J. Chromatogr. 1, 103–114.
Uversky, V. N. (2002a). Natively unfolded proteins: a point where biology waits for physics. Protein Sci. 11, 739–756. doi:10.1110/ps.4210102
Uversky, V. N. (2002b). What does it mean to be natively unfolded? Eur. J. Biochem. 269, 2–12. doi:10.1046/j.0014-2956.2001.02649.x
Uversky, V. N. (2003). Protein folding revisited. A polypeptide chain at the folding-misfolding-nonfolding cross-roads: which way to go? Cell. Mol. Life Sci. (CMLS) 60, 1852–1871. doi:10.1007/s00018-003-3096-6
Uversky, V. N. (2009). Intrinsically disordered proteins and their environment: effects of strong denaturants, temperature, pH, counter ions, membranes, binding partners, osmolytes, and macromolecular crowding. Protein J. 28, 305–325. doi:10.1007/s10930-009-9201-4
Uversky, V. N. (2010). The mysterious unfoldome: structureless, underappreciated, yet vital part of any given proteome. J. Biomed. Biotechnol. 2010, 568068. doi:10.1155/2010/568068
Uversky, V. N. (2011). Multitude of binding modes attainable by intrinsically disordered proteins: a portrait gallery of disorder-based complexes. Chem. Soc. Rev. 40, 1623–1634. doi:10.1039/c0cs00057d
Uversky, V. N. (2013a). A decade and a half of protein intrinsic disorder: biology still waits for physics. Protein Sci. 22, 693–724. doi:10.1002/pro.2261
Uversky, V. N. (2013b). Intrinsic disorder-based protein interactions and their modulators. Curr. Pharm. Des. 19, 4191–4213. doi:10.2174/1381612811319230005
Uversky, V. N. (2013c). Unusual biophysics of intrinsically disordered proteins. Biochimica Biophysica Acta (BBA) - Proteins Proteomics 1834, 932–951. doi:10.1016/j.bbapap.2012.12.008
Uversky, V. N. (2014a). The triple power of D³: Protein intrinsic disorder in degenerative diseases. Front. Biosci. Landmark Ed. 19, 181–258. doi:10.2741/4204
Uversky, V. N. (2014b). Wrecked regulation of intrinsically disordered proteins in diseases: pathogenicity of deregulated regulators. Front. Mol. Biosci. 1, 6. doi:10.3389/fmolb.2014.00006
Uversky, V. N. (2015a). Biophysical Methods to Investigate Intrinsically Disordered Proteins: Avoiding an “Elephant and Blind Men” Situation. Adv. Exp. Med. Biol. 870, 215–260. doi:10.1007/978-3-319-20164-1_7
Uversky, V. N. (2015b). Functional roles of transiently and intrinsically disordered regions within proteins. FEBS J. 282, 1182–1189. doi:10.1111/febs.13202
Uversky, V. N. (2016). p53 Proteoforms and Intrinsic Disorder: An Illustration of the Protein Structure-Function Continuum Concept. Int. J. Mol. Sci. 17, 1874. doi:10.3390/ijms17111874
Uversky, V. N. (2017a). Intrinsically disordered proteins in overcrowded milieu: Membrane-less organelles, phase separation, and intrinsic disorder. Curr. Opin. Struct. Biol. 44, 18–30. doi:10.1016/j.sbi.2016.10.015
Uversky, V. N. (2017b). Paradoxes and wonders of intrinsic disorder: Stability of instability. Intrinsically Disord. Proteins 5, e1327757. doi:10.1080/21690707.2017.1327757
Uversky, V. N. (2017c). Protein intrinsic disorder-based liquid-liquid phase transitions in biological systems: Complex coacervates and membrane-less organelles. Adv. Colloid Interface Sci. 239, 97–114. doi:10.1016/j.cis.2016.05.012
Uversky, V. N. (2019). Protein intrinsic disorder and structure-function continuum. Prog. Mol. Biol. Transl. Sci. 166, 1–17. doi:10.1016/bs.pmbts.2019.05.003
Uversky, V. N. (2021). Recent Developments in the Field of Intrinsically Disordered Proteins: Intrinsic Disorder–Based Emergence in Cellular Biology in Light of the Physiological and Pathological Liquid–Liquid Phase Transitions. Annu. Rev. Biophysics 50, 135–156. doi:10.1146/annurev-biophys-062920-063704
Uversky, V. N. (2022). Rebellion of the deregulated regulators: What is the clinical relevance of studying intrinsically disordered proteins? Expert Rev. Proteomics 19, 279–282. doi:10.1080/14789450.2023.2176755
Uversky, V. N., and Dunker, A. K. (2010). Understanding protein non-folding. Biochimica Biophysica Acta (BBA) - Proteins Proteomics 1804, 1231–1264. doi:10.1016/j.bbapap.2010.01.017
V. N. Uversky, and A. K. Dunker (2012a). Experimental Tools for the Analysis of Intrinsically Disordered Protein (Totowa, NJ, USA: Humana Press), I.
V. N. Uversky, and A. K. Dunker (2012b). Experimental Tools for the Analysis of Intrinsically Disordered Protein (Totowa, NJ, USA: Humana Press), II.
Uversky, V. N., and Dunker, A. K. (2012c). Multiparametric analysis of intrinsically disordered proteins: looking at intrinsic disorder through compound eyes. Anal. Chem. 84, 2096–2104. doi:10.1021/ac203096k
Uversky, V. N., and Dunker, A. K. (2013). The case for intrinsically disordered proteins playing contributory roles in molecular recognition without a stable 3D structure. F1000 Biol. Rep. 5, 1. doi:10.3410/B5-1
Uversky, V. N., and Ptitsyn, O. B. (1994). Partly Folded State, a New Equilibrium State of Protein Molecules: Four-State Guanidinium Chloride-Induced Unfolding of.beta.-Lactamase at Low Temperature. Biochemistry 33, 2782–2791. doi:10.1021/bi00176a006
Uversky, V. N., and Ptitsyn, O. B. (1996). Further evidence on the equilibrium “pre-molten globule state”: four-state guanidinium chloride-induced unfolding of carbonic anhydrase B at low temperature. J. Mol. Biol. 255, 215–228. doi:10.1006/jmbi.1996.0018
Uversky, V. N., Semisotnov, G. V., Pain, R. H., and Ptitsyn, O. B. (1992). 'All-or-none' mechanism of the molten globule unfolding. FEBS Lett. 314, 89–92. doi:10.1016/0014-5793(92)81468-2
Uversky, V. N., Protasova, N. Y., Rogov, V. V., Vassilenko, K. S., Gudkov, A. T., and Kutyshenko, V. P. (1996). Circularly permuted dihydrofolate reductase possesses all the properties of the molten globule state, but can resume functional tertiary structure by interaction with its ligands. Protein Sci. 5, 1844–1851. doi:10.1002/pro.5560050910
Uversky, V. N., Narizhneva, N. V., Ivanova, T. V., Kirkitadze, M. D., and Tomashevski, A. (1997). Ligand-free form of human alpha-fetoprotein: evidence for the molten globule state. FEBS Lett. 410, 280–284. doi:10.1016/s0014-5793(97)00606-6
Uversky, V. N., Karnoup, A. S., Segel, D. J., Seshadri, S., Doniach, S., and Fink, A. L. (1998). Anion-induced folding of Staphylococcal nuclease: characterization of multiple equilibrium partially folded intermediates. J. Mol. Biol. 278, 879–894. doi:10.1006/jmbi.1998.1741
Uversky, V. N., Gillespie, J. R., Millett, I. S., Khodyakova, A. V., Vasiliev, A. M., Chernovskaya, T. V., et al. (1999). Natively unfolded human prothymosin alpha adopts partially folded collapsed conformation at acidic pH. Biochemistry 38, 15009–15016. doi:10.1021/bi990752+
Uversky, V. N., Gillespie, J. R., and Fink, A. L. (2000a). Why are “natively unfolded” proteins unstructured under physiologic conditions? Proteins 41, 415–427. doi:10.1002/1097-0134(20001115)41:3<415::aid-prot130>3.3.co;2-z
Uversky, V. N., Gillespie, J. R., Millett, I. S., Khodyakova, A. V., Vasilenko, R. N., Vasiliev, A. M., et al. (2000b). Zn2+-Mediated Structure Formation and Compaction of the “Natively Unfolded” Human Prothymosin α. Biochem. Biophysical Res. Commun. 267, 663–668. doi:10.1006/bbrc.1999.2013
Uversky, V. N., Li, J., and Fink, A. L. (2001). Evidence for a partially folded intermediate in alpha-synuclein fibril formation. J. Biol. Chem. 276, 10737–10744. doi:10.1074/jbc.m010907200
Uversky, V. N., Li, J., Souillac, P., Millett, I. S., Doniach, S., Jakes, R., et al. (2002a). Biophysical properties of the synucleins and their propensities to fibrillate: inhibition of alpha-synuclein assembly by beta- and gamma-synucleins. J. Biol. Chem. 277, 11970–11978. doi:10.1074/jbc.m109541200
Uversky, V. N., Permyakov, S. E., Zagranichny, V. E., Rodionov, I. L., Fink, A. L., Cherskaya, A. M., et al. (2002b). Effect of zinc and temperature on the conformation of the gamma subunit of retinal phosphodiesterase: a natively unfolded protein. J. Proteome Res. 1, 149–159. doi:10.1021/pr0155127
Uversky, V. N., Oldfield, C. J., and Dunker, A. K. (2005). Showing your ID: intrinsic disorder as an ID for recognition, regulation and cell signaling. J. Mol. Recognit. 18, 343–384. doi:10.1002/jmr.747
Uversky, V. N., Oldfield, C. J., and Dunker, A. K. (2008). Intrinsically disordered proteins in human diseases: introducing the D2 concept. Annu. Rev. Biophys. 37, 215–246. doi:10.1146/annurev.biophys.37.032807.125924
Uversky, V. N., Dave, V., Iakoucheva, L. M., Malaney, P., Metallo, S. J., Pathak, R. R., et al. (2014). Pathological unfoldomics of uncontrolled chaos: intrinsically disordered proteins and human diseases. Chem. Rev. 114, 6844–6879. doi:10.1021/cr400713r
Uversky, V. N., Kuznetsova, I. M., Turoverov, K. K., and Zaslavsky, B. (2015). Intrinsically disordered proteins as crucial constituents of cellular aqueous two phase systems and coacervates. FEBS Lett. 589, 15–22. doi:10.1016/j.febslet.2014.11.028
Vacic, V., Uversky, V. N., Dunker, A. K., and Lonardi, S. (2007). Composition Profiler: a tool for discovery and visualization of amino acid composition differences. BMC Bioinforma. 8, 211. doi:10.1186/1471-2105-8-211
Valentine, S. J., and Clemmer, D. E. (1997). H/D exchange levels of shape-resolved cytochrome c conformers in the gas phase. J. Am. Chem. Soc. 119, 3558–3566. doi:10.1021/ja9626751
Vallee, R. B., and Borisy, G. G. (1977). Removal of the projections from cytoplasmic microtubules in vitro by digestion with trypsin. J. Biol. Chem. 252, 377–382. doi:10.1016/s0021-9258(17)32839-9
Vamvaca, K., Jelesarov, I., and Hilvert, D. (2008). Kinetics and thermodynamics of ligand binding to a molten globular enzyme and its native counterpart. J. Mol. Biol. 382, 971–977. doi:10.1016/j.jmb.2008.07.049
Van Craenenbroeck, E., and Engelborghs, Y. (2000). Fluorescence correlation spectroscopy: molecular recognition at the single molecule level. J. Mol. Recognit. 13, 93–100. doi:10.1002/(sici)1099-1352(200003/04)13:2<93::aid-jmr492>3.0.co;2-6
Van Dyck, J. F., Konijnenberg, A., and Sobott, F. (2017). Native Mass Spectrometry for the Characterization of Structure and Interactions of Membrane Proteins. Methods Mol. Biol. 1635, 205–232. doi:10.1007/978-1-4939-7151-0_11
Velluz, L., and Legrand, M. (1965). Progress in optical circular dichroism. Angewandte Chemie Int. Ed. Engl. 4, 838–845. doi:10.1002/anie.196508381
Venyaminov, S. Y., Gudkov, A., Gogia, Z., and Tumanova, L. (1981). Absorption and circular dichroism spectra of individual proteins from Escherichia coli ribosomes. Editor A. S. Spirin. Pushchino Biological Research Center, 1–128.
Viani, M. B., Schäffer, T. E., Paloczi, G. T., Pietrasanta, L. I., Smith, B. L., Thompson, J. B., et al. (1999). Fast imaging and fast force spectroscopy of single biopolymers with a new atomic force microscope designed for small cantilevers. Rev. Sci. Instrum. 70, 4300–4303. doi:10.1063/1.1150069
Vivian, J. T., and Callis, P. R. (2001). Mechanisms of tryptophan fluorescence shifts in proteins. Biophysical J. 80, 2093–2109. doi:10.1016/s0006-3495(01)76183-8
Völkel, R., Eisner, M., and Weible, K. J. (2003). Miniaturized imaging systems. Microelectron. Eng., 461–472. doi:10.1016/s0167-9317(03)00102-3
Von Helden, G., Wyttenbach, T., and Bowers, M. T. (1995). Inclusion of a MALDI ion source in the ion chromatography technique: conformational information on polymer and biomolecular ions. Int. J. Mass Spectrom. Ion Process. 146, 349–364. doi:10.1016/0168-1176(95)04211-3
Von Smoluchowski, M. (1906). Zur kinetischen theorie der brownschen molekularbewegung und der suspensionen. Ann. Phys. 326, 756–780. doi:10.1002/andp.19063261405
Warburg, E. (1920). Quantentheoretische Grundlagen der Photochemie. Z. Für Elektrochem. Angew. Phys. Chem. 26, 54–59. doi:10.1002/bbpc.19200260303
Ward, J. J., Sodhi, J. S., Mcguffin, L. J., Buxton, B. F., and Jones, D. T. (2004). Prediction and functional analysis of native disorder in proteins from the three kingdoms of life. J. Mol. Biol. 337, 635–645. doi:10.1016/j.jmb.2004.02.002
Warrant, R. W., and Kim, S.-H. (1978). α-Helix–double helix interaction shown in the structure of a protamine-transfer RNA complex and a nucleoprotamine model. Nature 271, 130–135. doi:10.1038/271130a0
Watson, E. S., and O'neill, M. J. (1962). Differential microcalorimeter. United States Patent, US3263484A.
Wawilow, S. (1924). Die fluoreszenzausbeute von farbstofflösungen. Z. Für Phys. 22, 266–272. doi:10.1007/bf01328130
Wawilow, S. (1927). Die fluoreszenzausbeute von farbstofflösungen als funktion der wellenlänge des anregenden lichtes. ii. Z. Für Phys. 42, 311–318. doi:10.1007/bf01397622
Webb, I. K. (2022). Recent technological developments for native mass spectrometry. Biochimica Biophysica Acta (BBA) - Proteins Proteomics 1870, 140732. doi:10.1016/j.bbapap.2021.140732
Weber, G. (1952). Polarization of the fluorescence of macromolecules. 1. Theory and experimental method. Biochem. J. 51, 145–155. doi:10.1042/bj0510145
Weber, G. (1953). “Rotational Brownian motion and polarization of the fluorescence of solutions,” in Advances in protein chemistry (Elsevier), 415–459.
Weber, G. (1967). “Polarization of the fluorescence of solution,” in Fluorescence and phosphorescence analysis. Editor D. M. Hercules (New York: John Wiley and Sons), 217–240.
Weber, G. (1975). “Energetics of ligand binding to proteins,” in Advances in protein chemistry (Elsevier), 1–83.
Weber, G., and Shinitzky, M. (1970). Failure of energy transfer between identical aromatic molecules on excitation at the long wave edge of the absorption spectrum. Proc. Natl. Acad. Sci. 65, 823–830. doi:10.1073/pnas.65.4.823
Weigert, F. (1920). Über die spezifische Wirkung der polarisierten Strahlung. Ann. Phys. 368, 681–725. doi:10.1002/andp.19203682402
Weinreb, P. H., Zhen, W., Poon, A. W., Conway, K. A., and Lansbury, P. T. (1996). NACP, a protein implicated in Alzheimer's disease and learning, is natively unfolded. Biochemistry 35, 13709–13715. doi:10.1021/bi961799n
Weintraub, H., Palter, K., and Van Lente, F. (1975). Histones H2a, H2b, H3, and H4 form a tetrameric complex in solutions of high salt. Cell 6, 85–110. doi:10.1016/0092-8674(75)90077-x
Wells, M., Tidow, H., Rutherford, T. J., Markwick, P., Jensen, M. R., Mylonas, E., et al. (2008). Structure of tumor suppressor p53 and its intrinsically disordered N-terminal transactivation domain. Proc. Natl. Acad. Sci. U. S. A. 105, 5762–5767. doi:10.1073/pnas.0801353105
Wen, Z. Q. (2007). Raman spectroscopy of protein pharmaceuticals. J. Pharm. Sci. 96, 2861–2878. doi:10.1002/jps.20895
Wen, J., Tang, Y., Sneideris, T., Ausserwoger, H., Hong, L., Knowles, T. P. J., et al. (2025). Direct Observation of the Conformational Transitions in Tau and Their Correlation with Phase Behavior. JACS Au 5, 4268–4280. doi:10.1021/jacsau.5c00625
Whitmore, L., and Wallace, B. A. (2008). Protein secondary structure analyses from circular dichroism spectroscopy: methods and reference databases. Biopolymers 89, 392–400. doi:10.1002/bip.20853
Widengren, J., and Rigler, R. (1998). Fluorescence correlation spectroscopy as a tool to investigate chemical reactions in solutions and on cell surfaces. Cell Mol. Biol. (Noisy-le-grand) 44, 857–879.
Williams, R. W. (1986). “Protein secondary structure analysis using Raman amide I and amide III spectra,” in Methods in enzymology (Elsevier), 311–331.
Williams, E. C., Janmey, P. A., Ferry, J. D., and Mosher, D. F. (1982). Conformational states of fibronectin. Effects of pH, ionic strength, and collagen binding. J. Biol. Chem. 257, 14973–14978. doi:10.1016/s0021-9258(18)33379-9
Williams, R. M., Obradovi, Z., Mathura, V., Braun, W., Garner, E. C., Young, J., et al. (2001). The protein non-folding problem: amino acid determinants of intrinsic order and disorder. Pac Symp. Biocomput, 89–100. doi:10.1142/9789814447362_0010
Williamson, M. P., Havel, T. F., and Wuthrich, K. (1985). Solution conformation of proteinase inhibitor IIA from bull seminal plasma by 1H nuclear magnetic resonance and distance geometry. J. Mol. Biol. 182, 295–315. doi:10.1016/0022-2836(85)90347-x
Wilson, G., Hecht, L., and Barron, L. D. (1996). Vibrational Raman optical activity of α-helical and unordered poly (L-lysine). J. Chem. Soc. Faraday Trans. 92, 1503–1509. doi:10.1039/ft9969201503
Wishard, A., and Gibb, B. C. (2019). Dynamic Light Scattering - an all-purpose guide for the supramolecular chemist. Supramol. Chem. 31, 608–615. doi:10.1080/10610278.2019.1629438
Withka, J., Moncuse, P., Baziotis, A., and Maskiewicz, R. (1987). Use of high-performance size-exclusion, ion-exchange, and hydrophobic interaction chromatography for the measurement of protein conformational change and stability. J. Chromatogr. A 398, 175–202. doi:10.1016/s0021-9673(01)96504-5
Woodward, R., and Schramm, C. (1947). Synthesis of protein analogs. J. Am. Chem. Soc. 69, 1551–1552. doi:10.1021/ja01198a526
Woody, R. W. (2010). “Circular dichroism of intrinsically disordered proteins,” in Instrumental analysis of intrinsically disordered proteins: Assessing structure and conformation, 303–321.
Worcester, D. L., Miller, R. G., and Bryant, P. J. (1988). Atomic force microscopy of purple membranes. J. Microsc. 152, 817–821. doi:10.1111/j.1365-2818.1988.tb01454.x
Woycechowsky, K. J., Choutko, A., Vamvaca, K., and Hilvert, D. (2008). Relative tolerance of an enzymatic molten globule and its thermostable counterpart to point mutation. Biochemistry 47, 13489–13496. doi:10.1021/bi801108a
Wright, P. E., and Dyson, H. J. (1999). Intrinsically unstructured proteins: re-assessing the protein structure-function paradigm. J. Mol. Biol. 293, 321–331. doi:10.1006/jmbi.1999.3110
Wüthrich, K. (1990). Protein structure determination in solution by NMR spectroscopy. J. Biol. Chem. 265, 22059–22062. doi:10.1016/s0021-9258(18)45665-7
Wuthrich, K., Wider, G., Wagner, G., and Braun, W. (1982). Sequential resonance assignments as a basis for determination of spatial protein structures by high resolution proton nuclear magnetic resonance. J. Mol. Biol. 155, 311–319. doi:10.1016/0022-2836(82)90007-9
Wyatt, P. J. (1993). Light scattering and the absolute characterization of macromolecules. Anal. Chim. Acta 272, 1–40. doi:10.1016/0003-2670(93)80373-s
Wyttenbach, T., Von Helden, G., and Bowers, M. T. (1996). Gas-phase conformation of biological molecules: bradykinin. J. Am. Chem. Soc. 118, 8355–8364. doi:10.1021/ja9535928
Xia, F., and Youcef-Toumi, K. (2022). Review: Advanced Atomic Force Microscopy Modes for Biomedical Research. Biosens. (Basel) 12, 1116. doi:10.3390/bios12121116
Yamamoto, J., Matsui, A., Gan, F., Oura, M., Ando, R., Matsuda, T., et al. (2021). Quantitative evaluation of macromolecular crowding environment based on translational and rotational diffusion using polarization dependent fluorescence correlation spectroscopy. Sci. Rep. 11, 10594. doi:10.1038/s41598-021-89987-7
Yang, S., Blachowicz, L., Makowski, L., and Roux, B. (2010). Multidomain assembled states of Hck tyrosine kinase in solution. Proc. Natl. Acad. Sci. U. S. A. 107, 15757–15762. doi:10.1073/pnas.1004569107
Yang, L., Zhang, W., and Xu, W. (2023). Efficient protein conformation dynamics characterization enabled by mobility-mass spectrometry. Anal. Chim. Acta 1243, 340800. doi:10.1016/j.aca.2023.340800
Yang, L., Zhao, Y., Fu, X., Zhang, W., and Xu, W. (2025). Characterizing Protein Solvent Accessible Surface Area in Solution by Dual Polarity Native Mass Spectrometry. J. Am. Soc. Mass Spectrom. 36, 991–998. doi:10.1021/jasms.4c00465
Yilmaz, B., and Ağagündüz, D. (2020). Bioactivities of hen's egg yolk phosvitin and its functional phosphopeptides in food industry and health. J. Food Sci. 85, 2969–2976. doi:10.1111/1750-3841.15447
Yip, K. M., Fischer, N., Paknia, E., Chari, A., and Stark, H. (2020). Atomic-resolution protein structure determination by cryo-EM. Nature 587, 157–161. doi:10.1038/s41586-020-2833-4
Yoo, S. H. (1995). pH- and Ca2+-induced Conformational Change and Aggregation of Chromogranin B. J. Biol. Chem. 270, 12578–12583. doi:10.1074/jbc.270.21.12578
Yu, N.-T., and Krimm, S. (1977). Raman spectroscopy: a conformational probe in biochemistr. CRC Crit. Rev. Biochem. 4, 229–280. doi:10.3109/10409237709102559
Yu, X., Wojciechowski, M., and Fenselau, C. (1993). Assessment of metals in reconstituted metallothioneins by electrospray mass spectrometry. Anal. Chem. 65, 1355–1359. doi:10.1021/ac00058a010
Zeleny, J. (1898). “VI. On the ratio of the velocities of the two ions produced in gases by Röntgen radiation; and on some related phenomena,” Lond. Edinb. Dublin Philosophical Mag. J. Sci., 46, 120–154. doi:10.1080/14786449808621173
Zhang, Z. (2020). Complete Extraction of Protein Dynamics Information in Hydrogen/Deuterium Exchange Mass Spectrometry Data. Anal. Chem. 92, 6486–6494. doi:10.1021/acs.analchem.9b05724
Zhang, Z., Zhang, A., and Xiao, G. (2012). Improved protein hydrogen/deuterium exchange mass spectrometry platform with fully automated data processing. Anal. Chem. 84, 4942–4949. doi:10.1021/ac300535r
Zhang, T., Faraggi, E., Li, Z., and Zhou, Y. (2013). Intrinsically semi-disordered state and its role in induced folding and protein aggregation. Cell Biochem. Biophys. 67, 1193–1205. doi:10.1007/s12013-013-9638-0
Zhong, Q., Inniss, D., Kjoller, K., and Elings, V. (1993). Fractured polymer/silica fiber surface studied by tapping mode atomic force microscopy. Surf. Sci. Lett. 290, L688–L692. doi:10.1016/0167-2584(93)90906-y
Zhou, J. M., Fan, Y. X., Kihara, H., Kimura, K., and Amemiya, Y. (1997). Unfolding of dimeric creatine kinase in urea and guanidine hydrochloride as measured using small angle X-ray scattering with synchrotron radiation. FEBS Lett. 415, 183–185. doi:10.1016/s0014-5793(97)01120-4
Zhu, F., Isaacs, N. W., Hecht, L., and Barron, L. D. (2005). Raman optical activity: a tool for protein structure analysis. Structure 13, 1409–1419. doi:10.1016/j.str.2005.07.009
Zhuang, X., Ha, T., Kim, H. D., Centner, T., Labeit, S., and Chu, S. (2000). Fluorescence quenching: A tool for single-molecule protein-folding study. Proc. Natl. Acad. Sci. U. S. A. 97, 14241–14244. doi:10.1073/pnas.97.26.14241
Zhulou, W., Huizhi, Z., Lin, J., Bo, D., Keying, H., Wolun, Z., et al. (2022). Principles of fluorescence correlation spectroscopy applied to studies of biomolecular liquid-liquid phase separation. Biophys. Rep. 8, 100–118. doi:10.52601/bpr.2022.210047
Keywords: intrinsically disordered protein, multiparametric approach, low-resolution techniques, intrinsically disordered region, integrative structural biology
Citation: Uversky VN (2025) A blurry view of fuzzy objects: on the roles of low-resolution structural techniques in discovery and early characterization of intrinsically disordered proteins. Front. Biophys. 3:1693360. doi: 10.3389/frbis.2025.1693360
Received: 27 August 2025; Accepted: 06 November 2025;
Published: 03 December 2025.
Edited by:
Zahoor Ahmad Parray, Maharishi Markandeshwar University, IndiaReviewed by:
Chun Tang, Peking University, ChinaAntonino Natalello, University of Milano-Bicocca, Italy
Mohd Bhat, University of Texas Southwestern Medical Center, United States
Copyright © 2025 Uversky. This is an open-access article distributed under the terms of the Creative Commons Attribution License (CC BY). The use, distribution or reproduction in other forums is permitted, provided the original author(s) and the copyright owner(s) are credited and that the original publication in this journal is cited, in accordance with accepted academic practice. No use, distribution or reproduction is permitted which does not comply with these terms.
*Correspondence: Vladimir N. Uversky, dnV2ZXJza3lAdXNmLmVkdQ==