 Chuloh Jung
 Nahla Alqassimi
 Gamal El Samanoudy
- 1Department of Architecture, Ajman University, Ajman, United Arab Emirates
- 2Department of Interior Design, Ajman University, Ajman, United Arab Emirates
Most of the research on indoor air pollutants in the United Arab Emirates focus on the state before moving in. There are no studies on the evaluation and characteristics of Indoor Air Quality in living conditions. This study aims to obtain primary data by measuring the concentration of indoor hazardous chemical substances in apartment housings with different area characteristics and to identify the external and internal pollutants that affect them. As a methodology, a comparative analysis was conducted between residential (Business Bay) and industrial areas (Ras Al Khor) to investigate the indoor air pollutants level with the comparison of the outdoor environment, elapsed time after construction, finished materials, temperature, relative humidity, renovation, purchase of furniture and electric appliances, built-in closets, and air cleaning methods. The result showed that Benzene (C6H6), Toluene (C7H8), Ethylbenzene (C8H10), Xylene (C8H10), and Styrene (C8H8) were at a stable level. However, in the case of formaldehyde (HCHO), points exceeding or close to the WHO IAQ standard were found, suggesting that long-term attention is required. The differences between residential and industrial areas were marginal in terms of the size of the house, temperature and humidity, and the building materials. It was proven that the emission of indoor air pollutants from building materials lessened under 18 months after construction.
1 Introduction
According to the Dubai Healthcare City report, 15% of Dubai residents have suffered symptoms of SBS (Sick Building Syndrome) (Jung and Awad, 2021a; Awad and Jung, 2021). SBS, caused by various indoor and outdoor air pollutants, can be classified as fatigue, headache, red eyes, eye/nose/throat irritation, dry cough, dry or itchy skin, dizziness, and difficulty focusing on work (Jung and Al Qassimi, 2022). Due to this SBS phenomenon, the Dubai Municipality initiated the IAQ (Indoor Air Quality) concentration standards with less than 0.08 ppm (parts per million) of CH2O, less than 300 μg/m3 of TVOC (Total Volatile Organic Compound), and less than 150 μg/m3 of PM10 (Particulate Matter) (less than 10 microns) in 8 h of continuous monitoring before occupancy for new houses (Arar and Jung, 2021; DEWA, 2021).
The pollution state of the outdoor air is an essential factor affecting indoor air pollution (Jung et al., 2021a; Jung and Awad, 2021b). There is a difference in the amount of the outside air environment flowing into the room depending on the season, lifestyle, and housing type (Guyot et al., 2018; Jung and Mahmoud, 2022).
Indoor air pollutants in a house are affected by the current status of the outside air and the characteristics of various indoor pollutants (Leung, 2015). Indoor pollution sources are broadly classified into building material types and features, the number of years elapsed, indoor microclimate, and lifestyle characteristics. In particular, in new houses, the generation of hazardous chemicals from building materials is a significant factor in indoor air pollution (Tham, 2016; Tran et al., 2020; Gonzalez-Martin et al., 2021).
The type of material influences Volatile Organic Compound (VOC) emission of building materials and the internal characteristics such as the total amount of VOC contained in the material (elapsed years), as well as the environmental conditions exposed to the material (Liu and Little, 2012; Liu et al., 2022). In addition, it is reported that the effect on indoor temperature and humidity causes a significant difference in the amount of generation (Lundgren and Kjellstrom, 2013). However, this is primarily the result of experiments in which environmental conditions are strictly controllable, and more factors affect the release of chemical substances in the indoor living environment (Huang et al., 2014; Sharif-Askari and Abu-Hijleh, 2018).
Indoor air pollution in a house is affected by many factors, namely, the type and characteristics of pollutants such as furniture, temperature and humidity, ventilation rate, indoor living activities, and adsorption effect (Ganesh et al., 2021; Nandan et al., 2021). It has a more complex release mechanism than the emission characteristics seen in a single material (Huang et al., 2021).
Therefore, this study aims to obtain primary data by measuring the concentration of indoor hazardous chemical substances in apartment houses with different area characteristics and to identify the factors of external and internal pollutants that affect them.
2 Materials and methods
Most research on hazardous chemicals targets housing reports in the state before starting residential life (before moving in) (Jung et al., 2021b; Al Qassimi and Jung, 2022). There are few studies on the evaluation and characteristics of indoor air quality in living conditions (Jung et al., 2021c).
Surveys on indoor air quality in residential buildings are conducted on multi-use facilities and schools (Annesi-Maesano et al., 2013). Few studies have been undertaken on homes where people spend the longest time in the day (Sundell et al., 2011). In particular, there are minimal studies on actual condition investigation and evaluation of hazardous chemicals such as VOC and formaldehyde (HCHO) (Zhang et al., 2011; Zhang and Srinivasan, 2020).
Sick Building Syndrome (SBS), caused mainly by HCHO and VOCs from building materials, has been one of the severe research topics only in the past 10 years (Wang et al., 2022). Table 1 shows the effects of each hazardous substance on the human body.
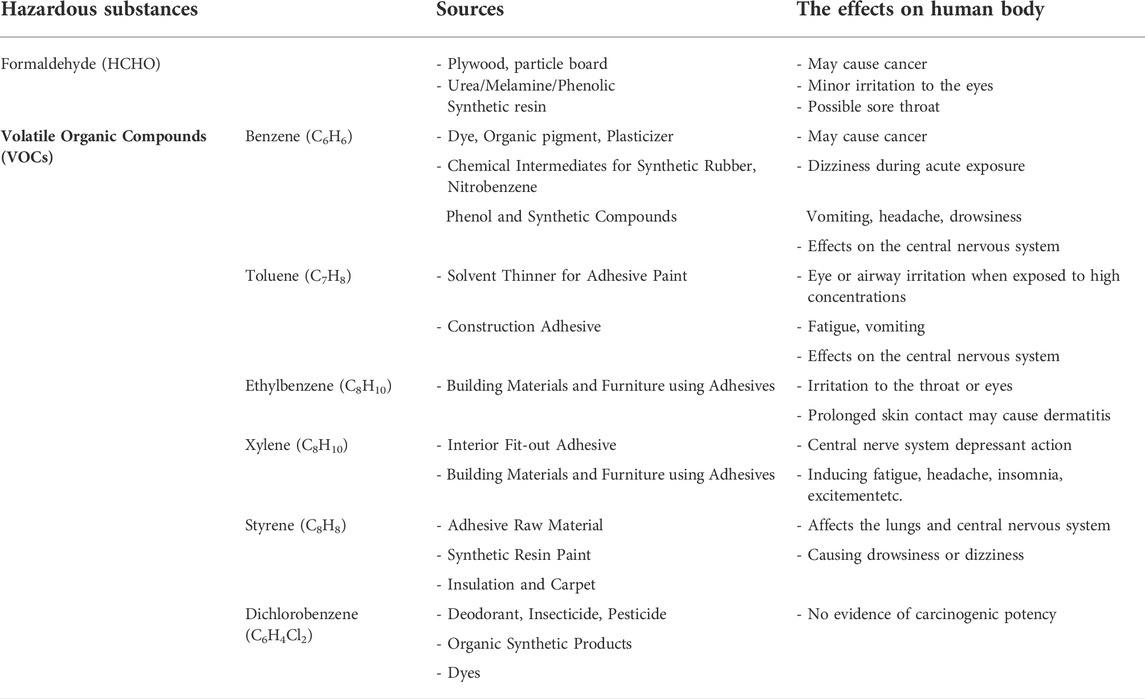
TABLE 1. The effects of hazardous substances on the human.
These chemicals are generated from unrated building materials such as adhesives, varnishes, paints, and tiles in newly built or renovated buildings (Salthammer et al., 2016; Brambilla and Sangiorgio, 2020). Even with a minimum amount, it can profoundly impact the human body. HCHO is emitted from wood, plywood, and furniture, and VOCs are emitted from textile products of household appliances (Salthammer, 2019) (Table 2).
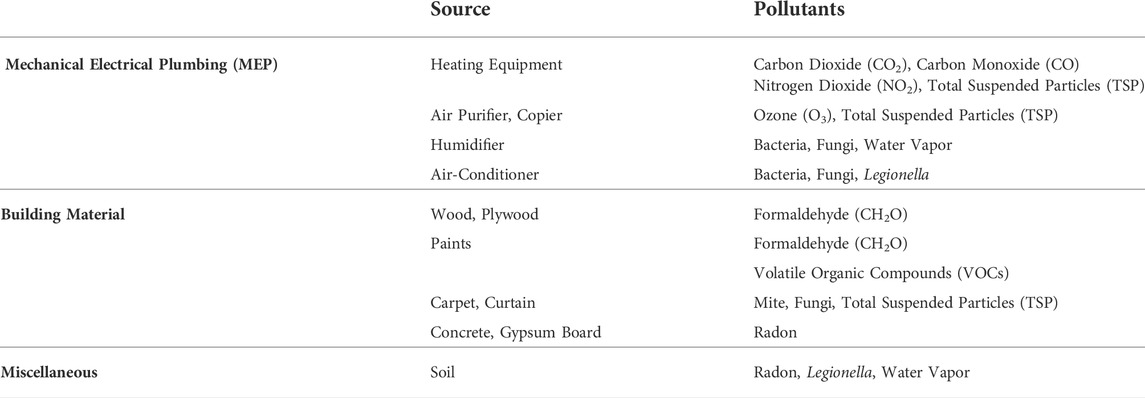
TABLE 2. Hazardous substances source and pollutants.
Table 3 shows the most advanced countries’ IAQ standards with detailed regulations. According to WHO standard guidelines, the average exposure time is also specified, suggesting the standard in detail according to the exposure time (WHO, 2010; Abdul-Wahab et al., 2015). Regarding European IAQ standards, the European Air Quality Guidelines were already established in 1987 b y WHO. In the States, EPA (Environmental Protection Agency) and ASHRAE (The American Society of Heating, Refrigerating and Air Conditioning Engineers) set the ventilation regulations for indoor air quality (ASHRAE, 2020; EPA, 2022).
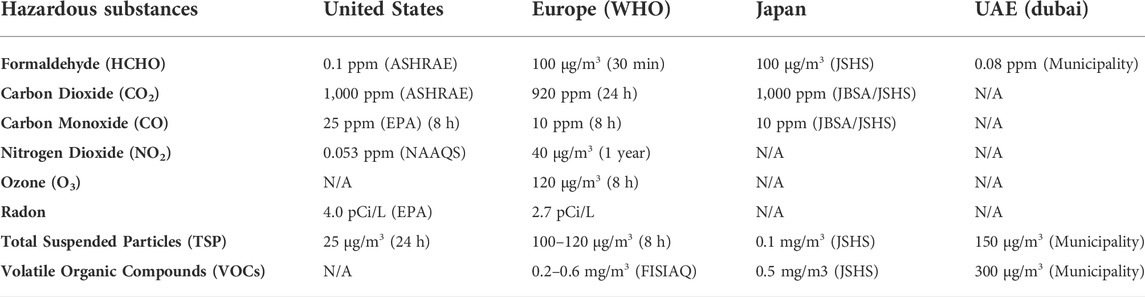
TABLE 3. Global standards for indoor air quality.
2.1 Selection of target area and apartments
The target areas and apartment complexes were classified into industrial and residential areas according to the level of point source pollution for the entire Dubai area (Awad and Jung, 2022) (Figure 1). The survey subjects were selected as U-Bora Tower at Business Bay (residential area) and Wasl Green Park Labor Camp at Ras Al Khor Industrial Area (industrial area), which are apartment buildings completed in 2020. U-Bora Tower at Business Bay (Figure 2) is adjacent to Dubai Mall and Downtown. Wasl Green Park Labor Camp is located in the heart of Ras Al Khor Industrial Area, an automobile industrial complex (Figure 3).
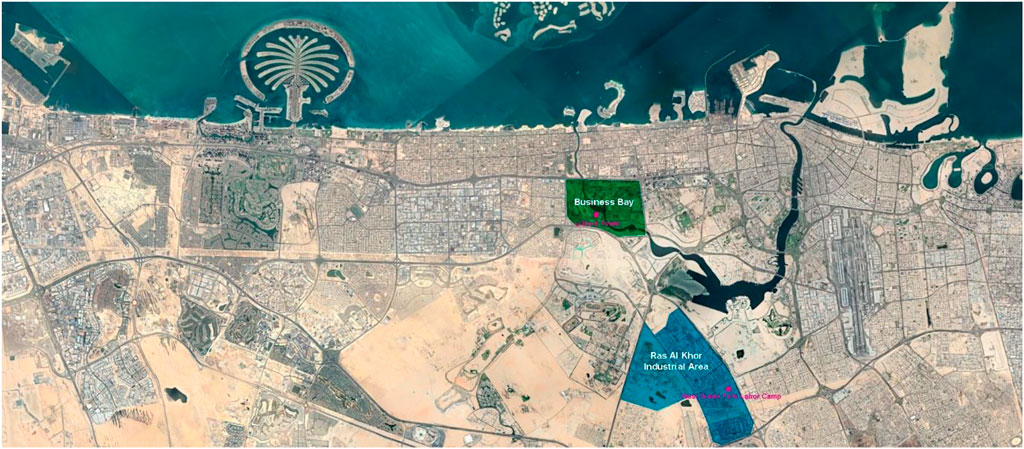
FIGURE 1. The location of U-bora tower at business bay and wasl green park labor camp at ras Al khor industrial area.
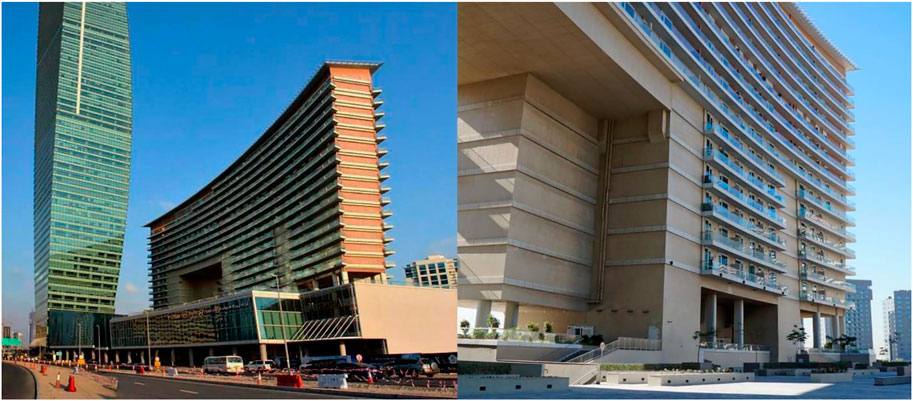
FIGURE 2. U-bora tower at business bay.
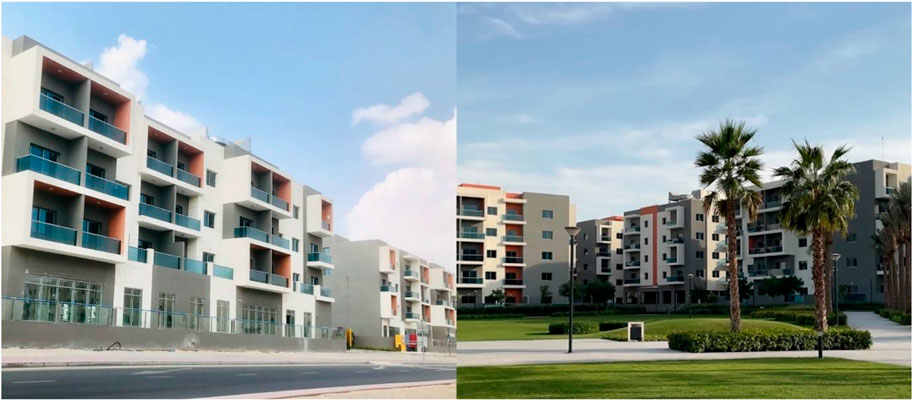
FIGURE 3. Wasl green park labor camp at ras Al khor industrial area.
2.2 Investigation of sources of pollution in apartments
To investigate the sources of pollutants existing inside or outside the apartment, after getting the appropriate ethical approvals and consents, a survey was conducted on the characteristics of the indoor and outdoor environments (Vardoulakis et al., 2020; Mannan and Al-Ghamdi, 2021). As for the contents of the investigation, the features of the external environment, internal environment renovation, electronic products and furniture purchased at the time of moving, built-in furniture, air cleaning methods, and improvement actions before moving in were investigated (Mofidi and Akbari, 2020; Whittem et al., 2022). The apartments to be examined for the source of pollution was selected in the same way as the target house to measure indoor hazardous chemicals, and methods such as interview, observation, and photography were used (Rosen et al., 2015; Bisello, 2020). The survey was conducted from November 14 to 25, 2021, for eleven households, five in the industrial area and six in the residential area.
2.3 Indoor chemical collection and analysis methods
Indoor concentrations were measured for a total of six chemical substances: Benzene (C6H6), Toluene (C7H8), Ethylbenzene (C8H10), Xylene (C8H10), Styrene (C8H8), and formaldehyde (HCHO) among harmful chemical substances in the indoor air (Morawska et al., 2013).
The indoor air collection and analysis were conducted according to the Indoor Air Measurement of WHO/UNEP (United Nations Environment Program) (UNEP, 2021; WHO, 2022). Ventilation was performed 30 min before concentration measurement, and sample air was collected from the center of the living room 5 h after closing the door. Sample collection was repeated twice for each measurement point (Batterman, 2017).
For VOC collection, a stainless tube adsorption tube filled with Tenax TA 200 mg was connected to a flow sampling pump, and a total of 3.0 L was collected at 100 ml/min for 30 min (Chiantore and Poli, 2021). GC/MS (Gas Chromatography/Mass Spectrometer, HP6890/5973N) equipped with an automatic thermal desorption device (Terbomatrix ATD, Perkin Elmer, United Kingdom) was used for VOC analysis (Longo et al., 2021).
Formaldehyde (HCHO) was collected using a flow sampling pump with a flow control device attached to the LpDNPHS10L cartridge (Supelco Inc. United States). 21.0 L of room air was collected for 30 min at 700 ml/min. The DNPH-carbonyl derivative was extracted with 5 ml of HPLC grade acetonitrile for sample extraction, and analysis was performed immediately after extraction. Analysis of formaldehyde from the extracted DNPH derivatives using HPLC (High-Performance Liquid Chromatography, Varian230).
2.4 Investigation of pollutants in the external environment by area
The actual conditions of the external environment and the pollutant situation in the area subject to this investigation were summarized based on the results of previous studies (Mejía et al., 2011; Leung, 2015). At the time of the survey for U-Bora Tower in Business Bay, it was found that the construction site of a new apartment building in the vicinity had the most significant impact on the residents of residential areas among the houses under the study (Al-Kodmany, 2018). The residents started to move in December 2020, and at the beginning of the move-in, they were satisfied with the clean environment (Bay, 2021). In June 2021, at the time of the summer survey, as shown in Figure 4, it was investigated that a different source of pollution than the initial move-in occurred due to noise and dust generated by the construction of new apartments in the vicinity (Amaral et al., 2020).
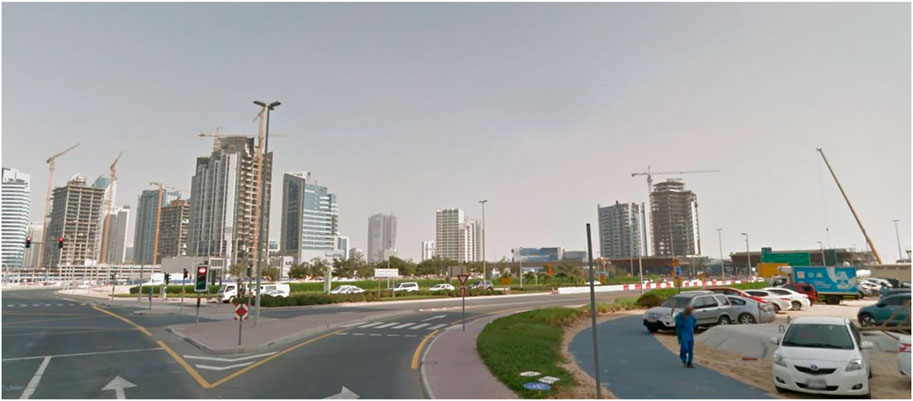
FIGURE 4. Urban context of U-bora tower at business bay.
Wasl Green Park at Ras Al Khor Industrial Area is located next to the 6-lane road. As shown in Figure 5, the front of the apartment faces an automobile repair shop (Green, 2021). In addition, it was investigated that noise and odors were generated from the external environment according to the operation schedule of nearby factories (Conti et al., 2020). Also, it was found that the most significant inconvenience for residents was the noise of factories and road dust and noise caused by the passage of vehicles.
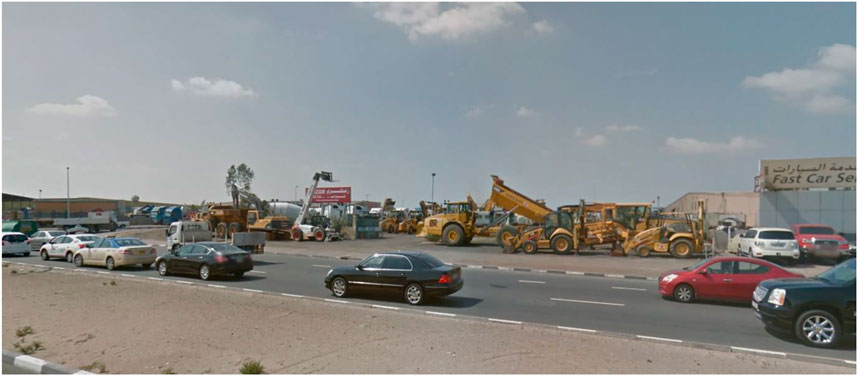
FIGURE 5. Urban context of wasl green park at ras Al khor industrial area.
In addition, there was no significant difference in the status of pollutants in the outside air in the two regions regarding Sulfur Dioxide (SO2) and Nitrogen Dioxide (NO2) (Vrijheid et al., 2011). It was reported that ozone (O3) in residential areas and Carbon Monoxide (CO) and Particulate Matter (PM10) were relatively high in industrial areas (Nasser et al., 2015).
2.5 Investigation of indoor air pollutants in the indoor environment
2.5.1 U-Bora Tower at business bay (residential area)
In the residential area of U-Bora Tower, indoor pollution sources were investigated for a total of six households, in the first floor, which are two 1-bedroom and four 2-bedroom. As for indoor air pollution sources, the purchase status of newly purchased furniture and electronic products for each house, whether there is a renovation, and how to clean the air were investigated (Amoatey et al., 2018).
The investigation was done for the units R2B-A, R2B-B, R1B-C, and R1B-D on 14 November 2021. While the unit R2B-E and the unit R2B-E was measured next day, on 15 November 2021.
R2B-A unit of U-Bora Tower has an area of 112.2 m2 and was surveyed on 14 November 2021. Four electronic products were purchased when moving in TV, refrigerator, computer, and washing machine. Eight furniture items were purchased: wardrobe, bookcase, chair, dining table, decorative cabinet, chest of drawers, bed, and side table. Built-in furniture includes closets, shoe cabinets, and decorative cabinets. Other purchases include carpets, curtains, rugs, pillows, and cushions.
R2B-B unit of U-Bora Tower was surveyed on 14 November 2021, with an area of 112.2 m2. The living room has been renovated, and the purchased electronic products are a TV, an oven range, and a refrigerator. There are eight pieces of furniture to buy: a chest of drawers, a bookshelf, a dining table, a dressing table, a sofa, a desk, and a bedroom chest of drawers. Built-in furniture was a wardrobe, shoe cabinet, and decorative cabinet, while textiles were purchased with curtains, quilts, pillows, and cushions.
R1B-C unit is 92.4 m2, and the survey was conducted on 14 November 2021. The living room was renovated, and a bake-out was completed a week before moving in. The purchased electronic products were a TV, DVD, computer, and washing machine, and the purchased furniture was a sofa and two decorative cabinets. Built-in furniture consisted of a shoe cabinet and two decorative cabinets, and other tables and pillows were purchased.
R1B-D unit has an area of 92.4 m2, and the survey date is 14 November 2021. The living room has been renovated, and the purchased electronic products are a TV, a computer, and a washing machine. The purchased furniture is eight pieces, including a wardrobe, bookcase, chair, dining table, dressing table, sofa, desk, and decorative cabinet. The built-in furniture was a decorative cabinet and shoe cabinet, and it was found that other electric mats were purchased and used.
Next is the R2B-E unit with a size of 112.2 m2 and the survey date is 15 November 2021. There are no new electronic products purchased at the time of moving in. The furniture purchased is a bookcase, a chair, a sofa, a desk, a chest of drawers, and a night table. Built-in furniture is a wardrobe, decoration cabinet, and shoe cabinet.
R2B-F unit has a size of 112.2 m2, and the survey date is 15 November 2021. Before moving in, cleaning was carried out by a professional company, and the purchased electronic products were 3 TVs, refrigerators, and DVDs, and nine furniture purchased were chests, bookcases, chairs, dining tables, and sofas, desks, decorative cabinets, beds, and night tables. Built-in furniture includes wardrobes, decoration cabinets, and shoe cabinets, and other purchased textiles include curtains, pillows, pillows, and cushions.
For the survey subjects in residential areas, it was investigated that 2B-A was ventilated by opening the door to clean the air. The remaining five households were all taking measures such as ventilation and installing flowerpots.
2.5.2 Wasl green park labor camp at ras Al khor industrial area (industrial area)
The current survey on the indoor environment in the industrial area was conducted for a total of five households, in the first floor, with 1-bedroom 2 and 2 bedroom three households, on 22 November 2021.
Unit I1B-A in the industrial area has an area of 85.8 m2, and the survey date is 22 November 2021. Two rooms have been renovated. The purchased electronic products include a TV, microwave oven, refrigerator, computer, and washing machine, and the purchased furniture is a wardrobe, sofa, desk, and chest of drawers. Built-in furniture is a wardrobe and shoe cabinet, and wooden blinds were purchased.
I2B-B unit has a size of 105.6 m2, and the survey date is 22 November 2009. These are households that have not undergone renovation and have just finished construction before moving in. The purchased furniture is a sofa, the built-in furniture includes a wardrobe and shoe cabinet, and the purchased textiles include curtains.
I1B-C unit is 85.8 m2 in size and has two rooms renovated. The purchased electronic products include a TV, microwave oven, refrigerator, DVD, computer, and washing machine. Nine pieces of furniture were purchased, including a wardrobe, bookcase, chair, dining table, sofa, desk, decorative cabinet, bed, and side table. Built-in furniture is a wardrobe (small room) and shoe cabinet, and purchased textiles include curtains.
I2B-D unit has a scale of 105.6 m2, and the survey was conducted on 22 November 2021. The purchased electronic products include a TV, microwave oven, refrigerator, DVD, computer, washing machine, etc., and the purchased furniture is eight pieces, including a wardrobe, bookcase, chair, dining table, dressing table, sofa, bookshelf, and decorative cabinet. The built-in furniture is a wardrobe and shoe cabinet; the other things I bought are curtains.
I2B-E unit is 112.2 m2 and was irradiated on 22 November 2021. These households have not undergone renovation, and those are treated with a charcoal liquid finish. The purchased electronic products include a TV, microwave oven, refrigerator, DVD, and washing machine, and the purchased furniture consists of 2 sofas and night tables. Built-in furniture is a wardrobe and shoe cabinet, and other purchased fabrics are curtains.
All housing units in the industrial area showed the same pattern as in the residential area, as the methods adopted for air purification were ventilation and flowerpots.
2.5.3 Summary of analysis results
The results of the survey on the sources of pollution in the internal and external environments, focusing on the houses to be investigated, are as follows.
In the case of residential areas, the external environment of the apartment to be investigated is a state in which temporary construction pollution occurs due to the surrounding construction. It was investigated that the industrial area is in a condition with a constant source of factory pollution. As for the renovation status after moving in, which is expected to affect the generation of harmful chemicals indoors, 7 cases occurred in residential areas. In comparison, a total of 2 cases occurred in industrial areas.
On average, the number of purchased electronic products was 2.8 per household in residential and 4.4 in industrial areas, resulting in many purchases in industrial areas. Also, in terms of the average number of assets of furniture and textiles, which are recognized as sources of continuous harmful substances, 6.8 in residential and 4.8 in industrial areas. The number of built-in furniture provided at the time of construction was found to be 2.6 per household in residential and 2.0 per household in industrial areas. In addition, the number of purchases of fabrics such as carpets and curtains was an average of 2.6 per household in residential and 1.0 per household in industrial areas.
In the improvement measures before moving in, it was found that bake-out and cleaning were carried out in the 2nd household in the residential area. In the industrial area, three generations of people who took measures for finishing construction, such as bio-finishing and charcoal liquid construction, were found. In other words, compared to industrial areas, in residential areas, there are temporary pollution sources for dust and noise caused by building on the external environment and continuously dissipating pollution sources such as furniture purchases, room extensions, and built-in furniture in the interior environment reduced. The probability that indoor pollutants are relatively high was confirmed.
3 Results
3.1 Comparative analysis of the condition of pollutants and building type concentration
3.1.1 Benzene (C6H6)
Benzene concentration (C6H6) in all surveyed houses was below 30 μg/m3, the WHO IAQ standard. As a result of comparing Benzene concentration in residential and industrial places, as shown in Figure 6, the minimum concentration was 11.07 μg/m3, and the maximum concentration was 19.67 μg/m3 in the residential area. The minimum concentration in the industrial area was 7.99 μg/m3, and the maximum concentration was 14.50 μg/m3. Also, the average concentration was 13.76 μg/m3 in residential housing and 10.54 μg/m3 in industrial housing, indicating a relatively high concentration in residential housing. However, it was analyzed that there was no significant difference between the two regions, as the difference in benzene concentration between the two regions was from an acceptable significance level of 0.05 to a significance level of 0.118 Table 4.
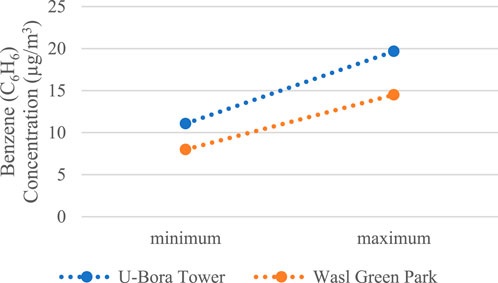
FIGURE 6. Benzene concentration levels in residential and industrial areas.
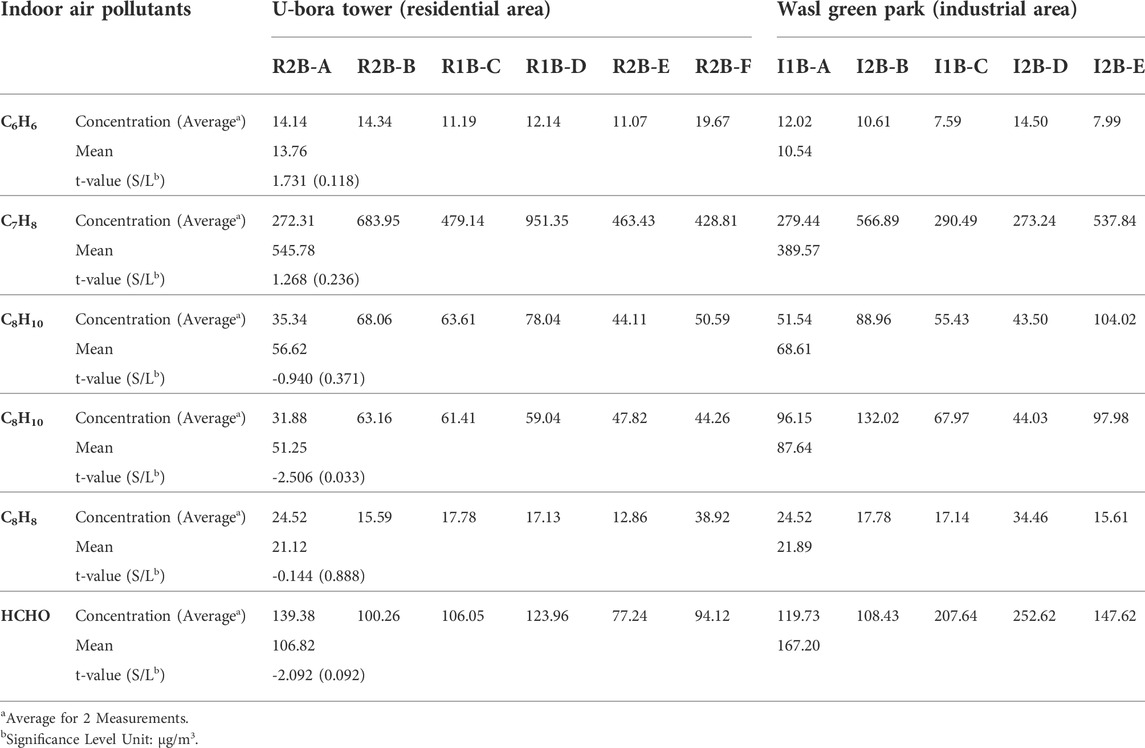
TABLE 4. Difference verification (t-test) result of indoor average concentration by building type.
3.1.2 Toluene (C7H8)
The concentration of Toluene (C7H8) was lower than the WHO IAQ standard of 1,000 μg/m3 in all the surveyed houses. In Figure 7 shows the minimum concentration in residential areas is 272.32 μg/m3, and the minimum concentration in homes in industrial areas. There was no significant difference from 273.24 μg/m3. The maximum concentration was 951.37 μg/m3, which was 1.7 times higher than the maximum concentration of 566.89 μg/m3 in the industrial area. The average concentration of houses in each region was 542.00 μg/m3 for residential houses and 389.58 μg/m3 for industrial houses, indicating that the residential houses were somewhat higher. However, the difference in the mean concentration of toluene between the measurement generations in the two regions was found to have a significance level of 0.237 from an acceptable significance level of 0.05, indicating no significant difference, Table 4.
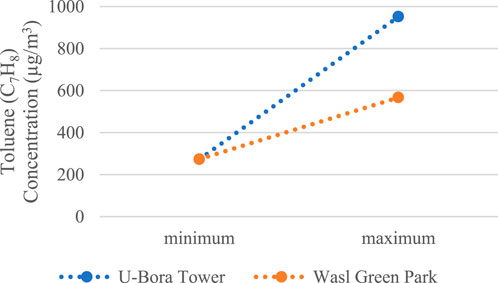
FIGURE 7. Toluene concentration levels in residential and industrial areas.
3.1.3 Ethylbenzene (C8H10)
The WHO IAQ standard for Ethylbenzene (C8H10) is presented as 350 μg/m3, and both residential and industrial houses showed a level below the recommended standard. In Figure 8 the minimum concentration in residential houses was 35.34 μg/m3, and the maximum concentration was 78.05 μg/m3. In the case of housing in an industrial area, the minimum concentration was 43.50 μg/m3, and the maximum concentration was 104.03 μg/m3, which was 1.2–2.9 times higher in the housing in the industrial area. The average concentration was 56.67 μg/m3 in residential houses and 68.70 μg/m3 in industrial houses, which was somewhat higher in industrial areas. However, the average ethylbenzene concentration between the two regions was analyzed from the acceptable significance level of 0.05 to the significance level of 0.372, indicating no significant difference, Table 4.
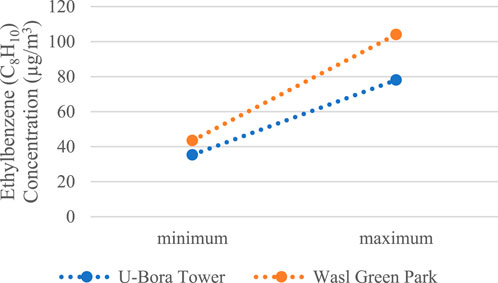
FIGURE 8. Ethylbenzene concentration levels in residential and industrial areas.
3.1.4 Xylene (C8H10)
In the case of Xylene (C8H10), an aromatic hydrocarbon called xylene is a common component of most combustion sources’ smoke and is found naturally in coal tar and petroleum, the concentration was below 700 μg/m3, the recommended standard for indoor air quality, in all the surveyed houses. In Figure 9 the minimum concentration in residential areas was 31.89 μg/m3, and the maximum was 63.16 μg/m3. In the case of housing in an industrial area, the minimum concentration was 44.13 μg/m3, and the maximum concentration was 132.01 μg/m3. The accommodation in the industrial area was about 1.4–2.2 times higher. The average concentration of xylene was 51.26 μg/m3 in residential area houses and 87.65 μg/m3 in industrial area houses, which was increased in industrial area houses due to the higher outdoor concentration in this industrial area. This difference was found to show a significant difference from the accepted significance level of 0.05 to the significance level of 0.033, Table 4.
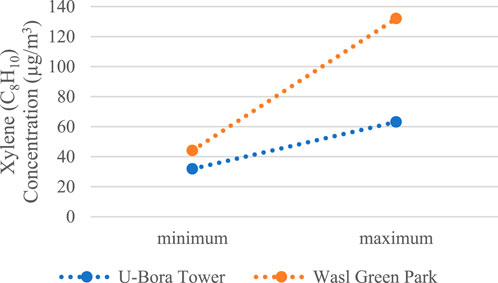
FIGURE 9. Xylene concentration levels in residential and industrial areas.
3.1.5 Styrene (C8H8)
In the case of Styrene (C8H8), the concentration was below the recommended WHO IAQ standard of 300 μg/m3 in both residential and industrial houses. In Figure 10 the minimum concentration in residential houses was 12.86 μg/m3, and the maximum was 38.91 μg/m3. In the case of housing in an industrial area, the minimum concentration was 15.60 μg/m3, and the maximum concentration was 34.47 μg/m3, so there was no significant difference between the minimum and full concentration. The average concentration for each region was 21.13 μg/m3 for residential housing and 21.90 μg/m3 for industrial housing, showing little difference in average concentration. It was confirmed that there was no significant difference at the acceptable significance level of 0.05 with a significance level of 0.889, Table 4.
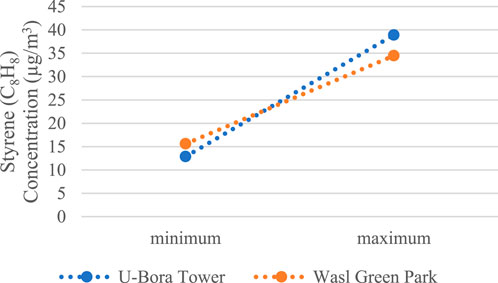
FIGURE 10. Styrene concentration levels in residential and industrial areas.
3.1.6 Formaldehyde (HCHO)
The formaldehyde (HCHO) concentration was less than the WHO IAQ standard of 210 μg/m3 in residential houses. On the other hand, in the case of industrial areas, the I2B-D unit was found to exceed the recommended standard at 252.62 μg/m3. The I1B-C unit did not exceed the recommended standard but showed a high concentration of 207.67 μg/m3. The average formaldehyde concentration was 106.84 µg/m3 in residential housing and 167.22 µg/m3 in industrial housing, indicating that the industrial area house is about 1.6 times higher than the residential area house. The concentration between these two regions, minimum and maximum in Figure 11, was analyzed to show a statistically significant difference from the acceptable significance level of 0.1 to the significance level of 0.092, Table 4.
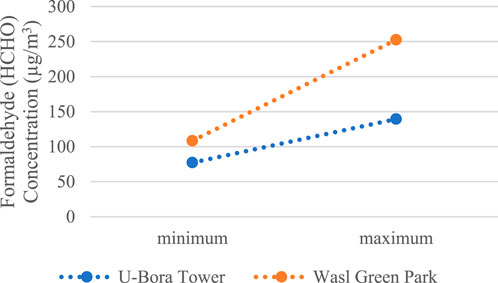
FIGURE 11. formaldehyde concentration levels in residential and industrial areas.
3.2 Analysis of the relationship between indoor concentration and physical factors
In this paper, among the physical factors affecting indoor concentration, factors such as temperature and humidity, elapsed years, building material specifications, housing size, and the relationship between indoor concentration were reviewed.
3.2.1 Temperature and humidity
The distribution of temperature and humidity for each target house is shown in Table 5. For the six units in the residential area, the indoor temperature at the time of measurement was 27.7–28.6°C, and the average temperature was 28.2°C. The humidity was 56.8–63.9%, and the average humidity was 61.6%. The five units in the industrial area had an indoor temperature of 28.2–30.8°C, with an average temperature of 29.4°C, and the humidity distribution was 45.1–73.2%, with an average humidity of 62.5%. The difference in temperature and humidity of the house to be measured in the two regions was small.
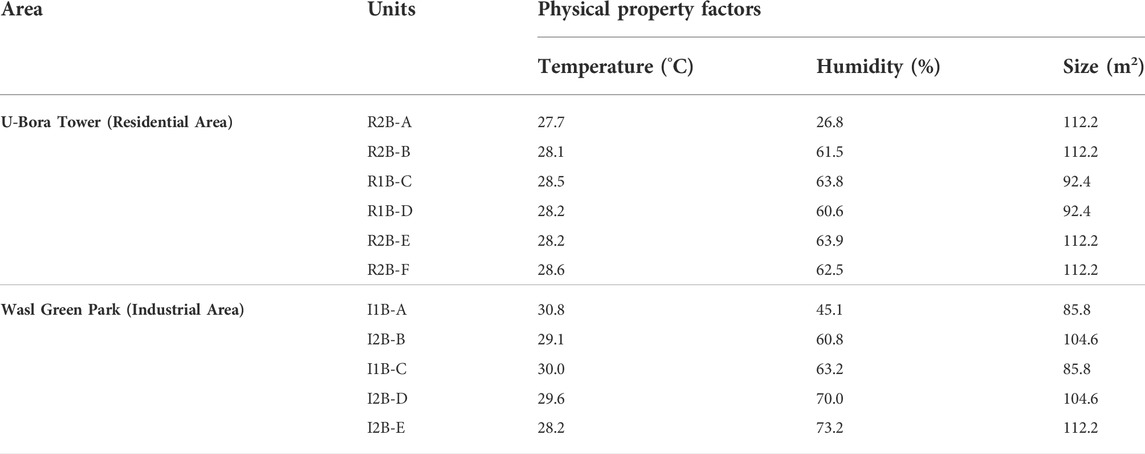
TABLE 5. Distribution of temperature, humidity, and size of the surveyed housing units.
In general, the degree of influence on the indoor concentration of each research house was reviewed for the conditions of temperature and humidity, which greatly influence the dissipation of chemical substances. Figure 12 shows the linear relationship between formaldehyde (HCHO) concentration and temperature for each generation. The value of R2 indicating the degree of proportionality was 0.15, indicating a low degree of relationship. This trend was the same for all indoor air pollutants. As shown in Table 6, in the case of Benzene (C6H6), the value of R2 was 0.03, Toluene (C7H8) 0.27, Ethylbenzene (C8H10) 0.05, Xylene (C8H10) 0.12, and Styrene (C8H8) 0.07, indicating a low degree of linear relationship, and Benzene (C6H6), Toluene (C7H8), and Ethylbenzene (C8H10) had a negative proportional relationship.
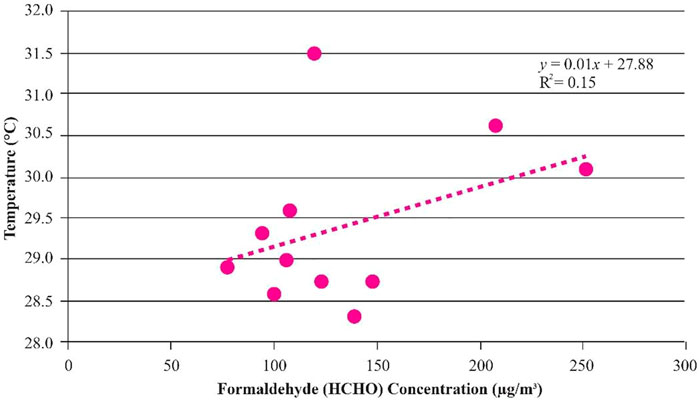
FIGURE 12. Relationship between formaldehyde (HCHO) concentration and temperature.
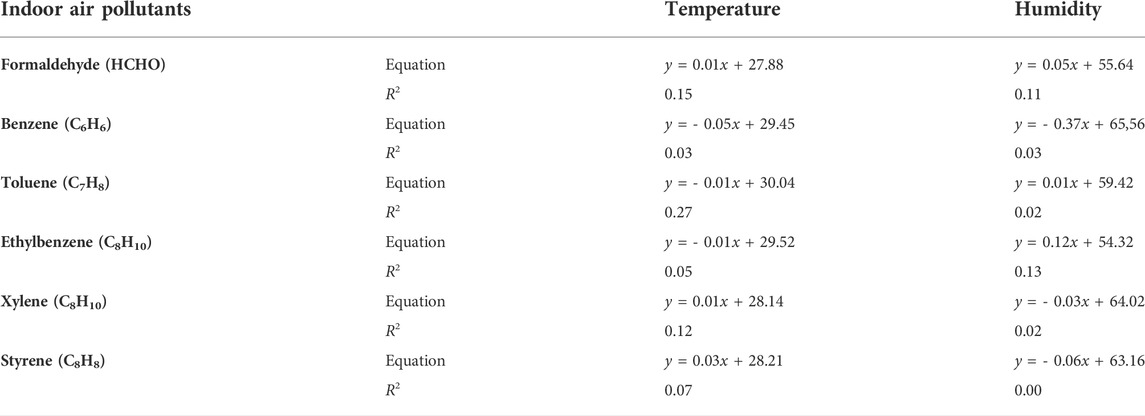
TABLE 6. Linear relationship between each chemical concentration and temperature and humidity.
Also, Figure 13 shows the relationship between formaldehyde concentration and humidity in each surveyed house. As shown in Table 6, the degree of linear relationship R2 was 0.11 for formaldehyde (HCHO), 0.03 for Benzene (C6H6), 0.02 for Toluene (C7H8), 0.13 for Ethylbenzene (C8H10), 0.02 for Xylene (C8H10), and 0.00 for Styrene (C8H8). Among them, Benzene (C6H6), Xylene (C8H10), and Styrene (C8H8) showed a negative linear relationship.
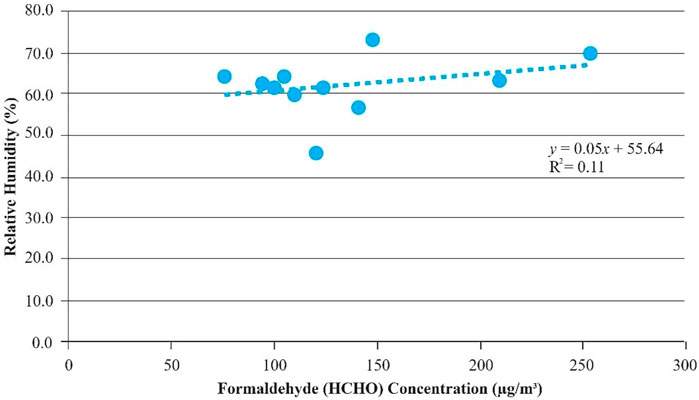
FIGURE 13. Relationship between formaldehyde (HCHO) concentration and humidity.
In the previous study, although there were differences by a chemical in the measurement of chemical substances in new houses before moving in, they reported a tendency to depend on temperature and humidity (Al Horr et al., 2016; Holøs et al., 2019). In addition, Davis, et al. said humidity was dependent on analyzing the effects of temperature and humidity for newly built apartments (Davis et al., 2016). However, there was a difference by material and reported no tendency to find temperature dependence (Nematchoua et al., 2015). Even in the case of new houses before moving in, which contained a relatively large amount of chemical substances, consistent strong dependence on temperature and humidity was not reported (Guyot et al., 2018; Ma et al., 2021). As in this study, the concentration of each chemical and the degree of influence of physical environmental factors such as temperature and humidity are very marginal in the house after a certain period (Patino and Siegel, 2018).
3.2.2 The size of the house
To examine the difference in the amount of emission analysis due to the difference in the size of the house, that is, the difference in the applied area of the finishing material, the size of each measurement target house was compared (Sarigiannis et al., 2011). As shown in Table 5, the size of each measurement target house was 105.6 m2 in the residential area and 99.0 m2 in the industrial zone, revealing subtle differences.
Figure 14 shows the linear relationship between the size of each house and the concentration of formaldehyde (HCHO). The value of R2, which indicates the linear relationship, is 0.06, indicating a low degree of a negative linear relationship. Benzene (C6H6) showed 0.17, Toluene (C7H8) 0.00, Ethylbenzene (C8H10) 0.00, Xylene (C8H10) 0.05, and Styrene (C8H8) 0.02, confirming that the relationship was very low for all chemicals (Table 7).
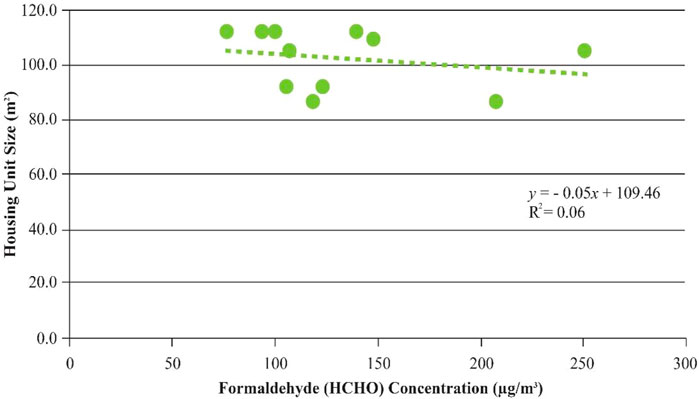
FIGURE 14. Relationship between formaldehyde (HCHO) concentration and housing unit size.
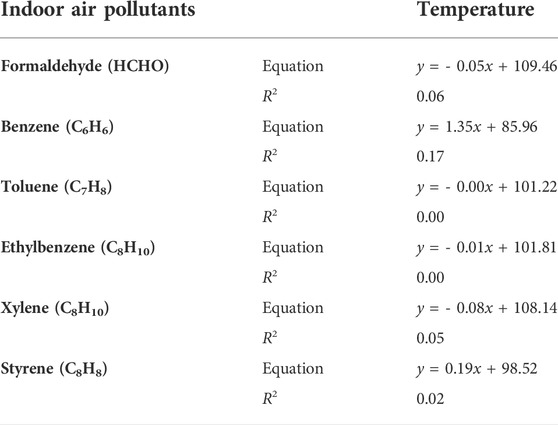
TABLE 7. Linear relationship between each chemical concentration and housing unit size.
4 Discussion
The majority of study on harmful products focuses on state housing reports before beginning residential living (before moving in). Studies on the assessment and features of indoor air quality in residential environments are few. Formaldehyde (HCHO), Benzene (C6H6), Toluene (C7H8), Ethylbenzene (C8H10), Xylene (C8H10), and Styrene (C8H8) were measured and analyzed to understand the distribution of hazardous chemicals in the living houses, new moving in and renewed ones, in both areas. Their impact on pollution sources was studied.
Concentrations of Benzene (C6H6), Toluene (C7H8), Ethylbenzene (C8H10), Xylene (C8H10), and Styrene (C8H8) in the houses to be measured fell short of the recommended indoor air quality standards in all surveyed houses, regardless of area. However, in the case of formaldehyde (HCHO), the generation exceeding or close to the recommended standard was found to be the second generation among the five surveyed households in the industrial area.
In this study, it was confirmed that formaldehyde (HCHO) was continuously detected high despite the elapsed time after construction for more than 1 year. In area comparison, the average concentrations of Benzene (C6H6) and Toluene (C7H8) were slightly higher in residential and industrial housing. Still, it was analyzed that there was no statistically significant difference. Styrene (C8H8) showed little difference in concentration between areas, and formaldehyde (HCHO) and Xylene (C8H10) were found to have high concentrations in an industrial area, which showed a statistically significant difference.
Also, as a result of analyzing the relationship between indoor physical influencing factors and indoor concentration, it was found that there were no discriminatory influencing factors in the house to be surveyed by region in terms of temperature and humidity, building material specifications, and house size. It is urgent to control the factors mentioned above in IAQ (Indoor Air Quality) regulation in Dubai, UAE.
Future considerations for further researches demand attention to the seasonal effects on these measurements, following the study of (Huang et al., 2018). While among environmental pollutions types, the noise, future study is recommended to realize its impact on the interior residential built environments and its users.
Although, this paper discussed six pollutants; Benzene (C6H6), Toluene (C7H8), Ethylbenzene (C8H10), Xylene (C8H10), Styrene (C8H8), and formaldehyde (HCHO), but based on the full inventory of harmful pollutants, mentioned in Table 2, further studies will give wider data for the Indoor Air Quality regulation in Dubai, UAE.
5 Conclusion
In this study, the actual conditions were identified by measuring the indoor concentration of apartments residing in two areas (industrial area and residential area) with different concentrations of pollutants in the outdoor air. In addition, the external environment, the size of the house, the number of years elapsed, the characteristics of building materials, the physical factors of the house such as indoor temperature and humidity, and the internal factors such as space expansion, the number of purchases of furniture and electronic products, etc. This study aimed to determine the degree of influence on the generation of harmful substances. Conclusions and recommendations based on this investigation and analysis of the results are as follows.
1) In the case of apartment houses in which 18 months or more have elapsed since construction, it was confirmed that Benzene (C6H6), Toluene (C7H8), Ethylbenzene (C8H10), Xylene (C8H10), and Styrene (C8H8) were at a stable level according to the indoor air pollutants standard. However, in the case of formaldehyde (HCHO), points exceeding or close to the standard were found, suggesting that long-term attention is required. As suggestion, a running study prove the validation of HCHO remover and its effects on such harmful component in the interior. HCHO remover is applied to wallpaper for interior finishing that could help the UAE residents for improving their IAQ. Such addition will help, not only the new apartments, but also the existing ones.
2) As for the generation of indoor chemical substances in the target apartment, the differences between residential and industrial areas were found to be minimal in terms of the house size, temperature, and humidity at the time of measurement and the specifications of the building materials used. However, in the case of the elapsed years, the housing in the residential area is shorter (about 6 months), and the generation of pollutants such as construction materials is judged to be relatively higher in the residential area. Investigations on internal pollution sources for purchases of furniture and electronic products, built-in types, extensions, and improvement measures also confirmed the possibility that houses in residential areas are exposed to more sources of pollution. However, as a result of examining the difference in the concentration of indoor pollutants in the actual target house, there was no statistically significant difference in Benzene (C6H6), Toluene (C7H8), Ethylbenzene (C8H10), and Styrene (C8H8) between areas. Still, it was confirmed that formaldehyde (HCHO) and Xylene (C8H10) showed significantly higher concentrations in industrial areas. The fact that there is no difference in concentration between the two regions or that the concentration is higher in houses in industrial areas is due to the characteristics of the release of hazardous chemicals from building materials in the case of residential houses 18 months or more after new construction. It was confirmed that the influence of indoor pollutants such as age, house size, temperature and humidity, wooden furniture and built-in furniture, expansion, and improvement measures was weakened.
3) In the case of existing apartment houses, indoor air pollution factors include weakening characteristics related to building materials, the degree of external air pollution, and the influx into daily life. Further investigation needs to be done.
Data availability statement
The original contributions presented in the study are included in the article/Supplementary Material, further inquiries can be directed to the corresponding author.
Author contributions
All authors contributed significantly to this study. CJ, GE, NA, and GE identified and secured the example buildings used in the study. The data acquisition system and installation of sensors were designed and installed by CJ and NA. NA and GE was responsible for data collection. CJ and NA performed data analysis. The manuscript was compiled by CJ and GE and reviewed by NA. All authors have read and agreed to the published version of the manuscript.
Acknowledgments
The authors would like to express their gratitude to Ajman University for APC support and the Healthy & Sustainable Built Environment Research Center at Ajman University for providing an excellent research environment.
Conflict of interest
The authors declare that the research was conducted in the absence of any commercial or financial relationships that could be construed as a potential conflict of interest.
Publisher’s note
All claims expressed in this article are solely those of the authors and do not necessarily represent those of their affiliated organizations, or those of the publisher, the editors and the reviewers. Any product that may be evaluated in this article, or claim that may be made by its manufacturer, is not guaranteed or endorsed by the publisher.
References
Abdul-Wahab, S. A., En, S. C. F., Elkamel, A., Ahmadi, L., and Yetilmezsoy, K. (2015). A review of standards and guidelines set by international bodies for the parameters of indoor air quality. Atmos. Pollut. Res. 6 (5), 751–767. doi:10.5094/apr.2015.084
Al Horr, Y., Arif, M., Kaushik, A., Mazroei, A., Katafygiotou, M., and Elsarrag, E. (2016). Occupant productivity and office indoor environment quality: A review of the literature. Build. Environ. 105, 369–389. doi:10.1016/j.buildenv.2016.06.001
Al Qassimi, N., and Jung, C. (2022). Impact of air-purifying plants on the reduction of volatile organic compounds in the indoor hot desert climate. Front. Built Environ. 7, 803516. doi:10.3389/fbuil.2021.803516
Al-Kodmany, K. (2018). Sustainability and the 21st century vertical city: A review of design approaches of tall buildings. Buildings 8 (8), 102. doi:10.3390/buildings8080102
Amaral, R. E., Brito, J., Buckman, M., Drake, E., Ilatova, E., Rice, P., et al. (2020). Waste management and operational energy for sustainable buildings: A review. Sustainability 12 (13), 5337. doi:10.3390/su12135337
Amoatey, P., Omidvarborna, H., Baawain, M. S., and Al-Mamun, A. (2018). Indoor air pollution and exposure assessment of the gulf cooperation council countries: A critical review. Environ. Int. 121, 491–506. doi:10.1016/j.envint.2018.09.043
Annesi-Maesano, I., Baiz, N., Banerjee, S., Rudnai, P., and Rive, S.Sinphonie Group. (2013). Indoor air quality and sources in schools and related health effects. J. Toxicol. Environ. Health, Part B 16 (8), 491–550. doi:10.1080/10937404.2013.853609
Arar, M., and Jung, C. (2021). Improving the indoor air quality in nursery buildings in united Arab Emirates. Int. J. Environ. Res. Public Health 18 (22), 12091. doi:10.3390/ijerph182212091
ASHRAE (2020). ASHRAE position document on indoor air quality. Retrieved from Available at: https://www.ashrae.org/file%20library/about/position%20documents/pd_indoor-air-quality-2020-07-01.pdf.
Awad, J., and Jung, C. (2021). Evaluating the indoor air quality after renovation at the greens in Dubai, united Arab Emirates. Buildings 11 (8), 353. doi:10.3390/buildings11080353
Awad, J., and Jung, C. (2022). Extracting the planning elements for sustainable urban regeneration in Dubai with AHP (analytic hierarchy process). Sustain. Cities Soc. 76, 103496. doi:10.1016/j.scs.2021.103496
Batterman, S. (2017). Review and extension of CO2-based methods to determine ventilation rates with application to school classrooms. Int. J. Environ. Res. Public Health 14 (2), 145. doi:10.3390/ijerph14020145
Bay, Business (2021). Ubora towers. Retrieved from Available at: https://www.dubai-businessbay.com/Business-Bay-Project/Business-Bay/Ubora-Towers-99.html.
Bisello, A. (2020). Assessing multiple benefits of housing regeneration and smart city development: The European project SINFONIA. Sustainability 12 (19), 8038. doi:10.3390/su12198038
Brambilla, A., and Sangiorgio, A. (2020). Mould growth in energy efficient buildings: Causes, health implications and strategies to mitigate the risk. Renew. Sustain. Energy Rev. 132, 110093. doi:10.1016/j.rser.2020.110093
Chiantore, O., and Poli, T. (2021). Indoor air quality in museum display cases: Volatile emissions, materials contributions, impacts. Atmosphere 12 (3), 364. doi:10.3390/atmos12030364
Conti, C., Guarino, M., and Bacenetti, J. (2020). Measurements techniques and models to assess odor annoyance: A review. Environ. Int. 134, 105261. doi:10.1016/j.envint.2019.105261
Davis, R. E., McGregor, G. R., and Enfield, K. B. (2016). Humidity: A review and primer on atmospheric moisture and human health. Environ. Res. 144, 106–116. doi:10.1016/j.envres.2015.10.014
DEWA (2021). Green building regulations & specifications. Retrieved from Available at: https://www.dewa.gov.ae/∼/media/Files/Consultants%20and%20Contractors/Green%20Building/Greenbuilding_Eng.ashx.
EPA (2022). Care for your air: A guide to indoor air quality. Retrieved from Available at: https://www.epa.gov/sites/default/files/2014-08/documents/careforyourair.pdf.
Ganesh, G. A., Sinha, S. L., Verma, T. N., and Dewangan, S. K. (2021). Investigation of indoor environment quality and factors affecting human comfort: A critical review. Build. Environ. 204, 108146. doi:10.1016/j.buildenv.2021.108146
Gonzalez-Martin, J., Kraakman, N. J. R., Perez, C., Lebrero, R., and Munoz, R. (2021). A state–of–the-art review on indoor air pollution and strategies for indoor air pollution control. Chemosphere 262, 128376. doi:10.1016/j.chemosphere.2020.128376
Green, WaslPark (2021). Live an enriched community lifestyle. Retrieved from Available at: https://www.waslgreenpark.com/.
Guyot, G., Sherman, M. H., and Walker, I. S. (2018). Smart ventilation energy and indoor air quality performance in residential buildings: A review. Energy Build. 165, 416–430. doi:10.1016/j.enbuild.2017.12.051
Holøs, S. B., Yang, A., Lind, M., Thunshelle, K., Schild, P., and Mysen, M. (2019). VOC emission rates in newly built and renovated buildings, and the influence of ventilation–a review and meta-analysis. Int. J. Vent. 18 (3), 153–166. doi:10.1080/14733315.2018.1435026
Huang, B., Lei, C., Wei, C., and Zeng, G. (2014). Chlorinated volatile organic compounds (Cl-VOCs) in environment—Sources, potential human health impacts, and current remediation technologies. Environ. Int. 71, 118–138. doi:10.1016/j.envint.2014.06.013
Huang, D., Tao, J., Cheng, M., Deng, R., Chen, S., Yin, L., et al. (2021). Microplastics and nanoplastics in the environment: Macroscopic transport and effects on creatures. J. Hazard. Mater. 407, 124399. doi:10.1016/j.jhazmat.2020.124399
Huang, K., Song, J., Feng, G., Chang, Q., Jiang, B., Wang, J., et al. (2018). Indoor air quality analysis of residential buildings in northeast China based on field measurements and longtime monitoring. Build. Environ. 144, 171–183. doi:10.1016/j.buildenv.2018.08.022
Jung, C., Al Qassimi, N., Arar, M., and Awad, J. (2021). The analysis of indoor air pollutants from finishing material of new apartments at business Bay, Dubai. Front. Built Environ. 7, 765689. doi:10.3389/fbuil.2021.765689
Jung, C., Awad, J., and Al Qassimi, N. (2021). Evaluation of residents’ comfort in high-rise residential buildings in Dubai, united Arab Emirates. Front. Built Environ. 7, 766057. doi:10.3389/fbuil.2021.766057
Jung, C., and Al Qassimi, N. (2022). Investigating the emission of hazardous chemical substances from mashrabiya used for indoor air quality in hot desert climate. Sustainability 14 (5), 2842. doi:10.3390/su14052842
Jung, C., and Awad, J. (2021). Improving the IAQ for learning efficiency with indoor plants in University classrooms in Ajman, United Arab Emirates. Buildings 11 (7), 289. doi:10.3390/buildings11070289
Jung, C., Awad, J., Mahmoud, N. S. A., and Salameh, M. (2021). An analysis of indoor environment evaluation for the Springs development in Dubai, UAE. Dubai: Open House International.
Jung, C., and Awad, J. (2021). The improvement of indoor air quality in residential buildings in Dubai, UAE. Buildings 11 (6), 250. doi:10.3390/buildings11060250
Jung, C., and Mahmoud, N. S. A. (2022). Extracting the critical points of formaldehyde (HCHO) emission model in hot desert climate. Air, Soil Water Res. 15, 117862212211050. doi:10.1177/11786221221105082
Leung, D. Y. (2015). Outdoor-indoor air pollution in urban environment: Challenges and opportunity. Front. Environ. Sci. 2, 69. doi:10.3389/fenvs.2014.00069
Liu, Z., and Little, J. C. (2012). Materials responsible for formaldehyde and volatile organic compound (VOC) emissions. Toxic. Build. Mater. 1, 76–121. doi:10.1533/9780857096357.76
Liu, Z., Yan, Y., Liu, T., Zhao, Y., Huang, Q., and Huang, Z. (2022). How to predict emissions of volatile organic compounds from solid building materials? A critical review on mass transfer models. J. Environ. Manag. 302, 114054. doi:10.1016/j.jenvman.2021.114054
Longo, V., Forleo, A., Giampetruzzi, L., Siciliano, P., and Capone, S. (2021). Human biomonitoring of environmental and occupational exposures by GC-MS and gas sensor systems: A systematic review. Int. J. Environ. Res. Public Health 18 (19), 10236. doi:10.3390/ijerph181910236
Lundgren, K., and Kjellstrom, T. (2013). Sustainability challenges from climate change and air conditioning use in urban areas. Sustainability 5 (7), 3116–3128. doi:10.3390/su5073116
Ma, N., Aviv, D., Guo, H., and Braham, W. W. (2021). Measuring the right factors: A review of variables and models for thermal comfort and indoor air quality. Renew. Sustain. Energy Rev. 135, 110436. doi:10.1016/j.rser.2020.110436
Mannan, M., and Al-Ghamdi, S. G. (2021). Indoor air quality in buildings: A comprehensive review on the factors influencing air pollution in residential and commercial structure. Int. J. Environ. Res. Public Health 18 (6), 3276. doi:10.3390/ijerph18063276
Mejía, J. F., Choy, S. L., Mengersen, K., and Morawska, L. (2011). Methodology for assessing exposure and impacts of air pollutants in school children: Data collection, analysis and health effects–a literature review. Atmos. Environ. 45 (4), 813–823. doi:10.1016/j.atmosenv.2010.11.009
Mofidi, F., and Akbari, H. (2020). Intelligent buildings: An overview. Energy Build. 223, 110192. doi:10.1016/j.enbuild.2020.110192
Morawska, L., Afshari, A., Bae, G. N., Buonanno, G., Chao, C. Y. H., Hänninen, O., et al. (2013). Indoor aerosols: From personal exposure to risk assessment. Indoor air 23 (6), 462–487. doi:10.1111/ina.12044
Nandan, A., Siddiqui, N. A., Singh, C., and Aeri, A. (2021). Occupational and environmental impacts of indoor air pollutant for different occupancy: A review. Toxicol. Environ. Health Sci. 13 (4), 303–322. doi:10.1007/s13530-021-00102-9
Nasser, Z., Salameh, P., Nasser, W., Abou Abbas, L., Elias, E., and Leveque, A. (2015). Outdoor particulate matter (PM) and associated cardiovascular diseases in the Middle East. Int. J. Occup. Med. Environ. Health 28 (4), 641–661. doi:10.13075/ijomeh.1896.00186
Nematchoua, M. K., Tchinda, R., Orosa, J. A., and Andreasi, W. A. (2015). Effect of wall construction materials over indoor air quality in humid and hot climate. J. Build. Eng. 3, 16–23. doi:10.1016/j.jobe.2015.05.002
Patino, E. D. L., and Siegel, J. A. (2018). Indoor environmental quality in social housing: A literature review. Build. Environ. 131, 231–241. doi:10.1016/j.buildenv.2018.01.013
Rosen, L. J., Myers, V., Winickoff, J. P., and Kott, J. (2015). Effectiveness of interventions to reduce tobacco smoke pollution in homes: A systematic review and meta-analysis. Int. J. Environ. Res. Public Health 12 (12), 16043–16059. doi:10.3390/ijerph121215038
Salthammer, T. (2019). Formaldehyde sources, formaldehyde concentrations and air exchange rates in European housings. Build. Environ. 150, 219–232. doi:10.1016/j.buildenv.2018.12.042
Salthammer, T., Uhde, E., Schripp, T., Schieweck, A., Morawska, L., Mazaheri, M., et al. (2016). Children's well-being at schools: Impact of climatic conditions and air pollution. Environ. Int. 94, 196–210. doi:10.1016/j.envint.2016.05.009
Sarigiannis, D. A., Karakitsios, S. P., Gotti, A., Liakos, I. L., and Katsoyiannis, A. (2011). Exposure to major volatile organic compounds and carbonyls in European indoor environments and associated health risk. Environ. Int. 37 (4), 743–765. doi:10.1016/j.envint.2011.01.005
Sharif-Askari, H., and Abu-Hijleh, B. (2018). Review of museums' indoor environment conditions studies and guidelines and their impact on the museums' artifacts and energy consumption. Build. Environ. 143, 186–195. doi:10.1016/j.buildenv.2018.07.012
Sundell, J., Levin, H., Nazaroff, W. W., Cain, W. S., Fisk, W. J., Grimsrud, D. T., et al. (2011). Ventilation rates and health: Multidisciplinary review of the scientific literature. Indoor air 21 (3), 191–204. doi:10.1111/j.1600-0668.2010.00703.x
Tham, K. W. (2016). Indoor air quality and its effects on humans—a review of challenges and developments in the last 30 years. Energy Build. 130, 637–650. doi:10.1016/j.enbuild.2016.08.071
Tran, V. V., Park, D., and Lee, Y. C. (2020). Indoor air pollution, related human diseases, and recent trends in the control and improvement of indoor air quality. Int. J. Environ. Res. Public Health 17 (8), 2927. doi:10.3390/ijerph17082927
UNEP (2021). Actions on air quality: A global summary of policies and programmes to reduce air pollution - executive summary. Advance draft. Retrieved from Available at: https://wedocs.unep.org/20.500.11822/35171.
Vardoulakis, S., Giagloglou, E., Steinle, S., Davis, A., Sleeuwenhoek, A., Galea, K. S., et al. (2020). Indoor exposure to selected air pollutants in the home environment: A systematic review. Int. J. Environ. Res. Public Health 17 (23), 8972. doi:10.3390/ijerph17238972
Vrijheid, M., Martinez, D., Manzanares, S., Dadvand, P., Schembari, A., Rankin, J., et al. (2011). Ambient air pollution and risk of congenital anomalies: A systematic review and meta-analysis. Environ. health Perspect. 119 (5), 598–606. doi:10.1289/ehp.1002946
Wang, M., Li, L., Hou, C., Guo, X., and Fu, H. (2022). Building and health: Mapping the knowledge development of sick building syndrome. Buildings 12 (3), 287. doi:10.3390/buildings12030287
Whittem, V., Roetzel, A., Sadick, A. M., and Kidd, A. N. (2022). How comprehensive is post-occupancy feedback on school buildings for architects? A conceptual review based upon integral sustainable design principles. Amsterdam: Building and Environment.
Who, (2022). Compendium of WHO and other UN guidance on health and environment. Retrieved from Available at: https://cdn.who.int/media/docs/default-source/environmental-health-impact/who_compendium_air_pollution_01042022_eo_final.pdf?sfvrsn=1c4cecb5_3.
Who, (2010). WHO guidelines for indoor air quality : Selected pollutants. Retrieved from Available at: https://www.euro.who.int/__data/assets/pdf_file/0009/128169/e94535.pdf.
Zhang, H., and Srinivasan, R. (2020). A systematic review of air quality sensors, guidelines, and measurement studies for indoor air quality management. Sustainability 12 (21), 9045. doi:10.3390/su12219045
Keywords: indoor air pollutants, formaldehyde (HCHO), volatile organic compound (VOC), dubai, UAE
Citation: Jung C, Alqassimi N and El Samanoudy G (2022) The comparative analysis of the indoor air pollutants in occupied apartments at residential area and industrial area in dubai, united arab emirates. Front. Built Environ. 8:998858. doi: 10.3389/fbuil.2022.998858
Received: 20 July 2022; Accepted: 09 September 2022;
Published: 23 September 2022.
Edited by:
Shichao Liu, Worcester Polytechnic Institute, United StatesReviewed by:
Mohammad Mehdi Ghiai, Texas Tech University, United StatesElena Ascari, National Research Council (CNR), Italy
Chenyang Bi, Virginia Tech, United States
Copyright © 2022 Jung, Alqassimi and El Samanoudy. This is an open-access article distributed under the terms of the Creative Commons Attribution License (CC BY). The use, distribution or reproduction in other forums is permitted, provided the original author(s) and the copyright owner(s) are credited and that the original publication in this journal is cited, in accordance with accepted academic practice. No use, distribution or reproduction is permitted which does not comply with these terms.
*Correspondence: Chuloh Jung, Yy5qdW5nQGFqbWFuLmFjLmFl