 Jaques van Heerden1,2*‡
 Tonya Marianna Esterhuizen3‡
 Elhem Jbebli4
 Faten Fedhila4Samar Rhayem4
 Imène Chabchoub5Boubacar Togo6Anel Van Zyl1‡Beverley Neethling7‡Karla Thomas8Robyn Charlton9‡Thandeka Ngcana10Gita Naidu10‡Jan du Plessis11‡Richard Nyeko12,13‡Joyce Balagadde-Kambugu13‡
 Laila Hessissen14‡Zeyad Abdel Aziz15
 Aya Gamal15‡Amany Mohamed Ali16
 Rana Hamdy17‡Hosam Y. Asfour17,18
 Moatasem Elayadi17‡
 Jennifer Geel9,19,20,21‡Jeannette Parkes22†‡
 Alan Davidson23†‡ on behalf of SIOP Africa Research Committee
- 1Department of Paediatrics and Child Health, Faculty of Medicine and Health Sciences, Stellenbosch University, Cape Town, South Africa
- 2Department of Paediatric Oncology, Antwerp University Hospital, Antwerp, Belgium
- 3Division of Epidemiology and Biostatistics, Faculty of Medicine and Health Sciences, Stellenbosch University, Stellenbosch, South Africa
- 4Department of Paediatric Oncology, Hôpital d'Enfants Béchir Hamza, Tunis, Tunisia
- 5Department of Medical Oncology, Farhat Hached UniversityHospital, Sousse, Tunisia
- 6Department of Paediatric Oncology, Centre Hospitalo-Universitaire Gabriel Trouré, Bamako, Mali
- 7Department of Paediatrics and Child Health, University of Kwa-Zulu Natal, Inkosi Albert Luthuli Central Hospital, Durban, South Africa
- 8Division of Paediatric Oncology, Department of Paediatrics, Frere Hospital, East London, South Africa
- 9Department of Paediatrics and Child Health, Faculty of Health Sciences, School of Clinical Medicine, University of the Witwatersrand, Johannesburg, South Africa
- 10Faculty of Health Sciences, Division of Paediatric Haematology and Oncology, Department of Paediatrics and Child Health, University of the Witwatersrand, Chris Hani Baragwanath Academic Hospital, Johannesburg, South Africa
- 11Department of Paediatrics and Child Health, Faculty of Health Sciences, University of the Free State, Bloemfontein, South Africa
- 12Department of Paediatrics and Child Health, Lira University, Lira, Uganda
- 13Division of Paediatric Haematology and Oncology, Uganda Cancer Institute, Kampala, Uganda
- 14Pediatric Oncology and Hematology Department, Hopital D'enfant Rabat, Faculty of Medicine and Pharmacy, Mohamed V University in Rabat, Rabat, Morocco
- 15Department of Pediatric Oncology, Borg El-Arab Children Cancer Hospital, Alexandria University, Alexandria, Egypt
- 16Department of Pediatric Oncology and Hematological Malignancies, South Egypt Cancer Institute, Assiut University, Assiut, Egypt
- 17Department of Pediatric Oncology, National Cancer Institute, Cairo University, Giza, Egypt
- 18Pediatric Oncology Department, 57357 Children's Cancer Hospital Egypt, Fom El-khalig Square, Kasr El-Aini St, Cairo, Egypt
- 19Division of Paediatric Haematology and Oncology, Faculty of Health Sciences, School of Clinical Medicine, University of the Witwatersrand, Johannesburg, South Africa
- 20Charlotte Maxeke Johannesburg Academic Hospital, Johannesburg, South Africa
- 21Wits Donald Gordon Medical Centre, Johannesburg, South Africa
- 22Department of Radiation Oncology, Groote Schuur Hospital and University of Cape Town, Cape Town, South Africa
- 23Division of Paediatric Haematology and Oncology, Red Cross War Memorial Children's Hospital, Department of Paediatrics and Child Health, University of Cape Town, Cape Town, South Africa
Introduction: Pediatric low-grade glioma (LGG) is a World Health Organization (WHO) Global Initiative for Childhood Cancer (GICC) index tumor constituting up to a third of pediatric central nervous system (CNS) tumors. The baseline characteristics, survival, and management resources for pediatric LGG in Africa are unknown. We aimed to evaluate the pediatric neuro-oncology multidisciplinary team resources, epidemiology, and survival outcomes of pediatric LGG in Africa to document baseline information prior to GICC implementation.
Methods: The study consisted of two parts: a survey completed by African pediatric oncology units (POU) to evaluate the local resources and a retrospective evaluation of data to determine the 5-year overall survival (OS) for patients under 18 years diagnosed with LGG between 2008 and 2018. Data were described in frequencies and percentages. Survival was expressed with Kaplan–Meier curves.
Results: Five-hundred and eighty-eight patients were included from fifteen POUs in six countries: South Africa (45.9%), Egypt (30.8%), Morocco (12.6%), Mali (4.4%), Tunisia (3.6%) and Uganda (2.7%). The median age was 4.4 years (interquartile range 2.4–7.3 years). The most common primary tumor site was the brainstem (n = 125, 21.3%), the most common histology was pilocytic astrocytoma (n = 270, 47.5%), the majority of tumors (n = 292, 93%) were localized, and 40 (6.8%) patients had neurofibromatosis. Complete resection was obtained in 99 (16.8%) cases, incomplete resection in 179 (30.4%), and no surgery or biopsy only was performed in 310 (52.7%) cases. One hundred and forty-seven (25.3%) of the 580 patients with a documented radiotherapy status, were irradiated, and 320 (54.4%) received chemotherapy. Only 259 (15.3%) patients received chemotherapy of which the most common chemotherapy regimen was vincristine-carboplatin (n = 220, 84.9%). The 5-year OS was 90.5% ± 1.6%. The 5-year OS in Tunisia was 95.1% ± 1.1%, 92.4% ± 2.1% in Egypt, 89.0% ± 3.2% in South Africa, 70.7% ± 6.7% in Morocco and 66.7% ± 15.7% in Uganda (p < 0.001). Four of the 41 (9.8%) responding countries reported having pediatric neuro-oncology subspecialists, and four (9.8%) had national pediatric LGG protocols. In Africa there is one radiotherapy center per 2,235,125 children and one neurosurgeon per 304,685 children, with ~70% of these resources accessible in four countries.
Discussion: Due to several resource challenges and developing treatment centers, only fifteen pediatric oncology units from six countries participated. We documented a baseline 5-year OS of 94.9% for LGG in African children. To obtain an accurate estimation of pediatric LGG survival in Africa, increasing participation from a wider range of countries, especially poorly resourced settings, is necessary.
Introduction
Pediatric low-grade glioma (LGG) was included in the World Health Organization (WHO) 2030 Global Initiative for Childhood Cancer (GICC) due to its relatively high incidence and high potential for cure, thereby possibly contributing to increasing the cure rates of all childhood cancers to 60% (1). Successful treatment requires comprehensive multidisciplinary care and multisectoral interventions (2). Pediatric LGG is a group of heterogeneous tumors originating from various neurological structures (3, 4), constituting up to 30%−40% of central nervous system (CNS) tumors in children globally (5). The tumors are classified as Grade I and II according to the WHO classification for their indolent pathophysiology and, in contrast to adult LGG, have low potential for malignant transformation (3, 4, 6). Approximately 75% of pediatric LGG are WHO grade 1 (6). Up to 30% of pediatric LGG can develop in supratentorial structures, 15% in deep midline structures, while < 10% develop in the optic pathway and brainstem, respectively (3, 4, 6), with metastatic disease present in < 5%−7% of patients (3, 4, 6). Neurofibromatosis type 1 and tuberous sclerosis are associated with distinct subtypes of LGG, such as optic pathway gliomas and subependymal giant cell astrocytomas, respectively (7).
Cure is possible following complete surgical resection with long-term overall survival (OS) exceeding 90% (3, 4, 7). However many of these tumors occur in anatomical areas of the brain not amenable to complete resection. Historically, focal radiotherapy was used if resection was incomplete or if progression occurred after three regimens of chemotherapy in a child older than 12 years with a tumor in a location amenable to radiation (8). However use of radiotherapy is controversial despite having better control rates and a shorter duration of treatment than chemotherapy, due to concerns of late sequelae (9). Chemotherapy is now advocated as front-line adjuvant therapy to defer radiotherapy in infants and young children (3, 4, 7). Chemotherapy is also the first-line treatment in gliomas of the optic pathways in an attempt to avoid radiotherapy or potential loss of vision during surgery (3). Chemotherapy protocols range from regimens with limited toxicity and easy accessibility, like vinblastine, vincristine, and carboplatin, to more toxic and harder-to-access options, such as thioguanine, procarbazine, lomustine, and vincristine (3, 4). Most chemotherapy regimens are given over an extended period of 12–18 months (3, 4). With increasing access to molecular diagnostics, the question arises whether targeted therapies or conventional chemotherapy should be administered as first-line chemotherapy (10). The best chance of cure and preservation of function in low- and middle-income countries (LMIC) relies on a multidisciplinary approach, cognizant of the burden of cancer care for families and with judicious combinations of minimally toxic chemotherapy, surgical resection, and radiotherapy when indicated (11).
There is limited data regarding the African pediatric LGG experience. Single-center survival outcomes have been reported from Egypt and Uganda, but they are not representative of their countries (12). Data from African childhood cancer registries show that fewer tumors are diagnosed than in high income countries, with a low proportion of CNS tumors, particularly LGG (13). Most publications from African countries included either adult patients (14, 15) or reported on different molecular alterations (16) and novel imaging modalities (17, 18) in pediatric LGG, but none have documented management approaches or treatment outcomes. An unpublished Master's thesis from the University of Cape Town, South Africa, documented the demographics of 86 patients with pediatric LGG between 2001 and 2017 (19, 20) with an estimated 5-year OS of 86.8% and progression-free survival (PFS) of 42.8% (19). An Egyptian study of 227 patients reported a 3-year OS of 87.3% and event-free survival (EFS) of 65.5% (21). Egypt, Tunisia, and Uganda reported respective outcomes of 87.3% (3-year OS), 78.5% (5-year OS), and 65.0% (3-year OS) (22). Three scoping reviews concluded that only epidemiology and management could be documented and that survival outcomes could not be reported (23) because too few publications contained African outcomes data. Another scoping review on the outcomes of brain tumors in children in Sub-Saharan Africa concluded that data were insufficient and inconsistent. The single-institution reports were not representative of the African situation, and data were limited to specific tumor types (24).
There may be epidemiological differences in CNS tumors in Africa compared to other continents, particularly regarding the distribution of histological subtypes (22). In a review of LGG in Africa, differences in tumor characteristics between adult LGG and pediatric LGG were highlighted (1). One example was a higher reported incidence of brainstem gliomas in children compare to adults in Africa and international literature (6, 22). Barriers like limited healthcare infrastructure and lack of robust registry systems in various African regions prevent comparison of results between African treatment centers while treatment strategies for pediatric LGG in Africa have been diverse and limited by resource constraints (6, 24). The GICC target of 60% refers to all index cancers combined rather than pediatric LGG alone (2, 24). To meet the ambitious targets of the WHO GICC, we questioned what the baseline survival of pediatric LGG was. In this study, we evaluated pediatric oncology units (POUs) as well as patient and tumor characteristics to determine the management resources, epidemiology, and baseline survival outcomes of pediatric LGG in Africa.
Materials and methods
Resource evaluation
Data on resources were sourced from a survey consisting of 13 questions sent to 91 SIOP Africa members from newly qualified multidisciplinary team members to medical staff with more than 20 years of experience via the Qualtrics® platform to include data from newly founded services to well-established services. The survey included eight questions on the composition of the multidisciplinary pediatric neuro-oncology team, three questions on the need for an African pediatric neuro-oncology working group and two setting-related questions (Appendix A). The survey was disseminated via email during September and October 2024. Data on radiotherapy resources were sourced from the website of the International Atomic Energy Agency's (IAEA) Directory of Radiotherapy Centers (DIRAC) (25), and data on the number of neurosurgeons were sourced from the website of the World Federation of Neurosurgical Societies (WFNS) (26). A complete multidisciplinary team (MDT) was defined as a pediatric oncologist, neurosurgeon and radiation oncologist, irrespective of whether the practitioners were in the same hospital or not. An incomplete MDT was defined as the absence of one or more of the three disciplines. Non-standard chemotherapy was defined as chemotherapy regimens that are not recommended by international neuro-oncology study groups.
Patient and tumor characteristics and survival data
Through SIOP Africa communication channels, SIOP Connect, and the SIOP Africa WhatsApp group, which has 530 members representing 41 African countries, all POUs in Africa were invited to participate in a study investigating patient and tumor characteristics and treatment outcomes. Data of all children under 18 years diagnosed with LGG on imaging or by biopsy between 1 January 2008 and 31 December 2018 were requested for inclusion. The 10-year period before 2018 was used as a baseline to coincide with the implementation of the GICC. The confirmation of inclusion can be seen in the consort flow diagram in Figure 1. In this study, histology was classified according to revised fourth edition of the WHO Classification of Central Nervous tumors published in 2016, since all cases were diagnosed before the subsequent edition of WHO classification in 2021. In addition, due to the limited molecular testing of brain tumors in Africa, the adoption of the 5th edition of WHO classification for CNS tumors was not applicable (27). In patients whose histology was not documented or whose tumors were diagnosed on imaging alone, the histology was classified as “unknown histology.” Crude progression-free survival (cPFS) was defined as survival that considers disease progression and death.
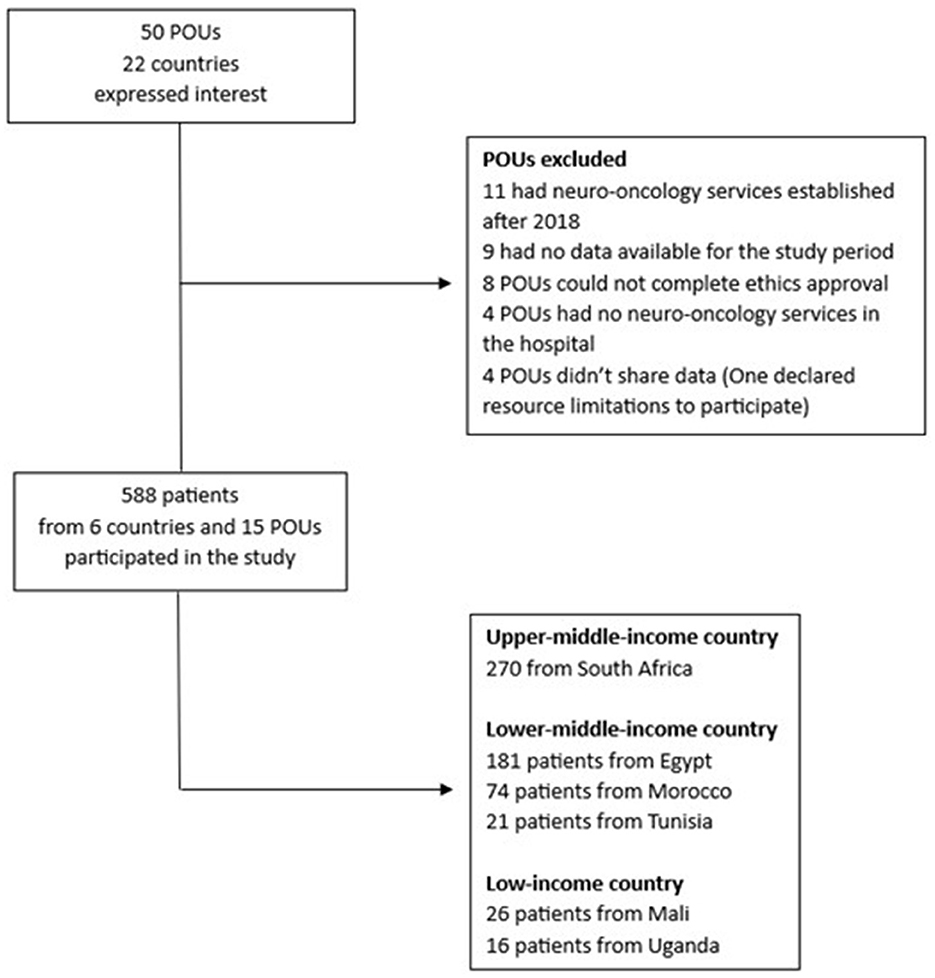
Figure 1. The flow diagram of the study inclusion.
Based on the capacity of each setting, data were captured electronically in three POUs, on Excel spreadsheets in 11 POUs and on a paper data collection sheet in one POU. Data were analyzed using IBM SPSS Version 25 (IBM Corporation, USA) statistical software. Frequencies, means, medians and ranges were described. Differences in medians and means were assessed using the Mann–Whitney U-test or Student's t-test. Fisher's exact test was applied in cohorts of less than five observations. The two-sided Pearson chi-square test (χ2) was used to assess the categorical association among covariates. Lost-to-follow-up was defined as patients who did not attend appointments for 6 months or more despite attempts to contact them. Patients lost-to-follow-up at the end of the study period were censored as dead. Kaplan–Meier analyses were performed to evaluate survival outcomes. For all calculations, a p-value < 0.05 was considered significant. Survival outcomes for the center in Mali were not determined due to inadequate dates and time points for calculating event-free, crude progression-free and overall survival outcomes.
The Stellenbosch University Health Research Ethics Committee (N23/03/022) granted ethical approval. Where necessary, approval was obtained from local ethics committees.
Results
Resource evaluation
Ninety-one specialists from multidisciplinary pediatric neuro-oncology teams from 41 of 54 (76%) African countries were invited to complete the survey, of which 54 (59.3% response rate) were fully completed. Of the 54 respondents, 48 (88.8%) were pediatric oncologists, three (5.6%) were neurosurgeons and three (5.6%) were radiation oncologists. The respondents represented 55 public and private sector POUs and their associated MDTs from 29 of 54 (53.7%) African countries (Figure 2).
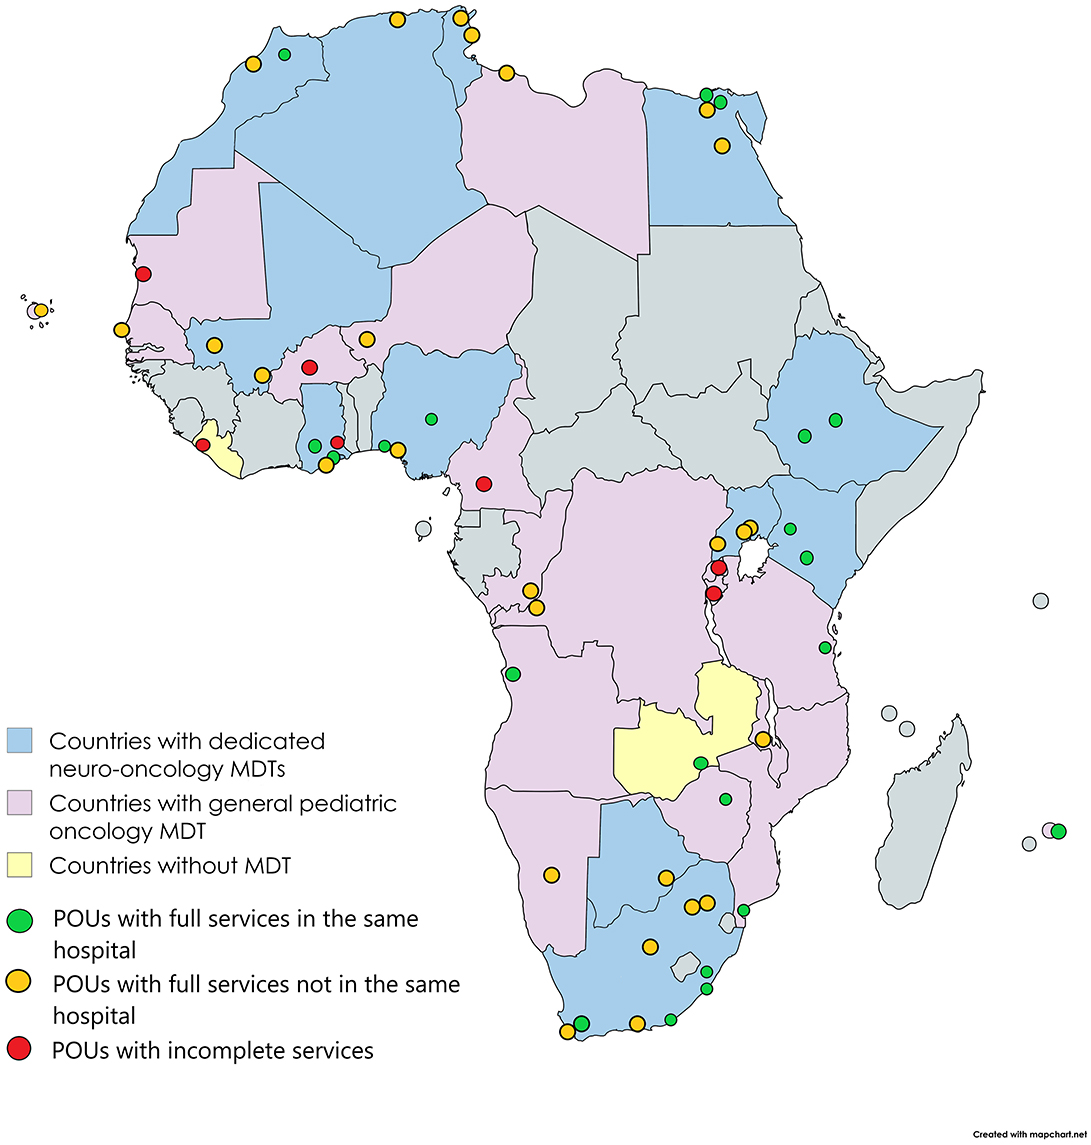
Figure 2. Number of countries with pediatric neuro-oncology multidisciplinary services and dedicated pediatric neuro-oncology multidisciplinary team meetings.
Four of these 29 (13.8%) countries (Kenya, Morocco, Zambia and Zimbabwe) reported having a national pediatric LGG protocol (Figure 3). Four pediatric neuro-oncology specialists were identified in Egypt, South Africa, Tunisia and Uganda (Figure 3). Fourteen (48.3%) countries had at least one POU with a dedicated neuro-oncology MDT meeting, and 22 (75.9%) had at least one POU where neuro-oncology cases were discussed in a general MDT meeting (Figure 3). Twenty-one (38.2%) POUs had a full MDT in the same hospital, 27 (49.1%) POUs had a full MDT but not all members in the same hospital and seven (12.7%) had incomplete MDTs. While all hospitals had access to computed tomography or magnetic resonance services, four (7.3%) reported no hospital-based pathology services. Twenty-seven (49.1%) POUs had access to a pediatric neurologist and/or pediatric endocrinologist. Eight (14.5%) had hospital-based genetic services. Seven (12.7%) POUs had dedicated neuro-oncology follow-up clinics, while 38 (69%) POUs could offer rehabilitation services such as physiotherapy, occupational therapy and speech therapy.
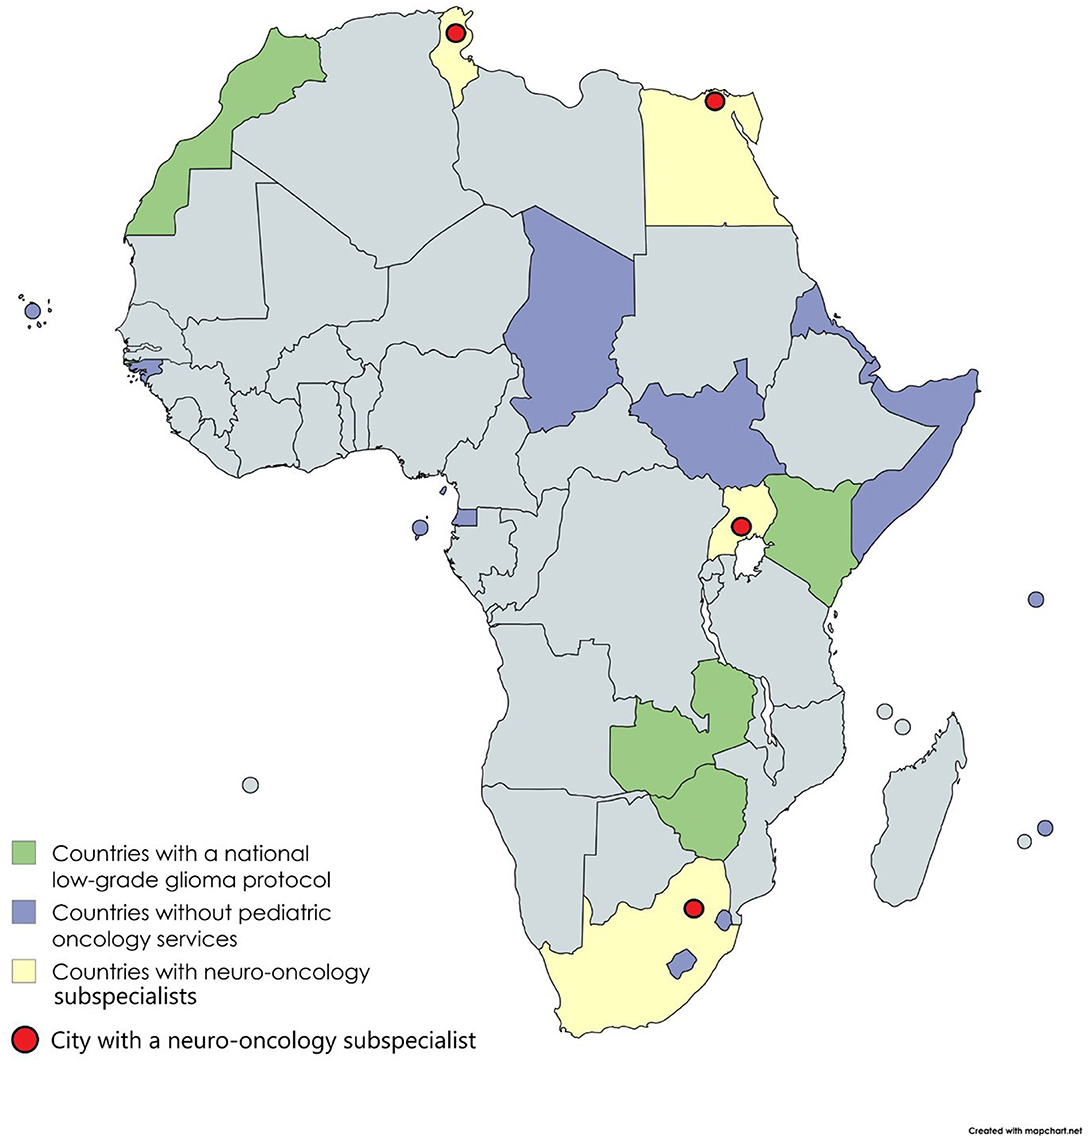
Figure 3. Number of countries with pediatric oncology services, national pediatric low-grade glioma protocols and pediatric neuro-oncology subspecialists.
All 54 respondents indicated that there should be a neuro-oncology research working group in Africa. Fifteen (27.8%) respondents commented that although some neuro-oncology resources exist, they were too few to manage the pediatric neuro-oncology burden with all other oncology and non-oncology-related demands. Respondents from 10 (18.5%) countries indicated that patients had to seek treatment outside their countries. This included Cape Verde and Mauritius, where only adult oncology services exist. Respondents from Egypt, Tunisia, and South Africa, with more resources than other countries, indicated a greater need for access to genetic and molecular diagnostics.
According to publicly available pan-African data, ~40.1% of the African population during 2023 were children under 15 years old, with an absolute number of 592,308,210 (see Supplementary Table 1) (28). There were 265 radiotherapy centers on the continent. The countries with the highest number of radiotherapy centers were Egypt (n = 75), South Africa (n = 62), and Morocco (n = 30), representing more than 63% of the continent's centers. A 2015 Lancet Oncology report reported more than 80% of radiotherapy machines were located in North and Southern Africa, while at least 20 countries had no radiotherapy machines (29). In 2020 There were 430 radiotherapy machines in Africa: with an estimated 71.3% coverage in North Africa, 65.1% coverage of Southern Africa, 8.9% of East Africa, 7.7% of West Africa with Central Africa trailing with 6.1% coverage (30). There are ~1,774 to 1,944 neurosurgeons in Africa. The countries with the most neurosurgeons are Egypt (n = 520), Algeria (n = 375), South Africa (n = 210), and Morocco (n = 200; 67% of all neurosurgeons in Africa). There is one radiotherapy center per 2,235,125 children and one neurosurgeon per 304,685 children in Africa.
Study-specific pediatric oncology unit resource distribution and patient inclusion
The retrospective chart review included 588 children diagnosed with LGG in six countries: South Africa (n = 270; 45.9%), Egypt (n = 181; 30.8%), Morocco (n = 74; 12.6%), Mali (n = 26; 4.4%), Tunisia (n = 21; 3.6%), and Uganda (n = 16; 2.7%; see Table 1). There were no discernible trends in the annual number of patients diagnosed in each country over the study period (see Figure 4).
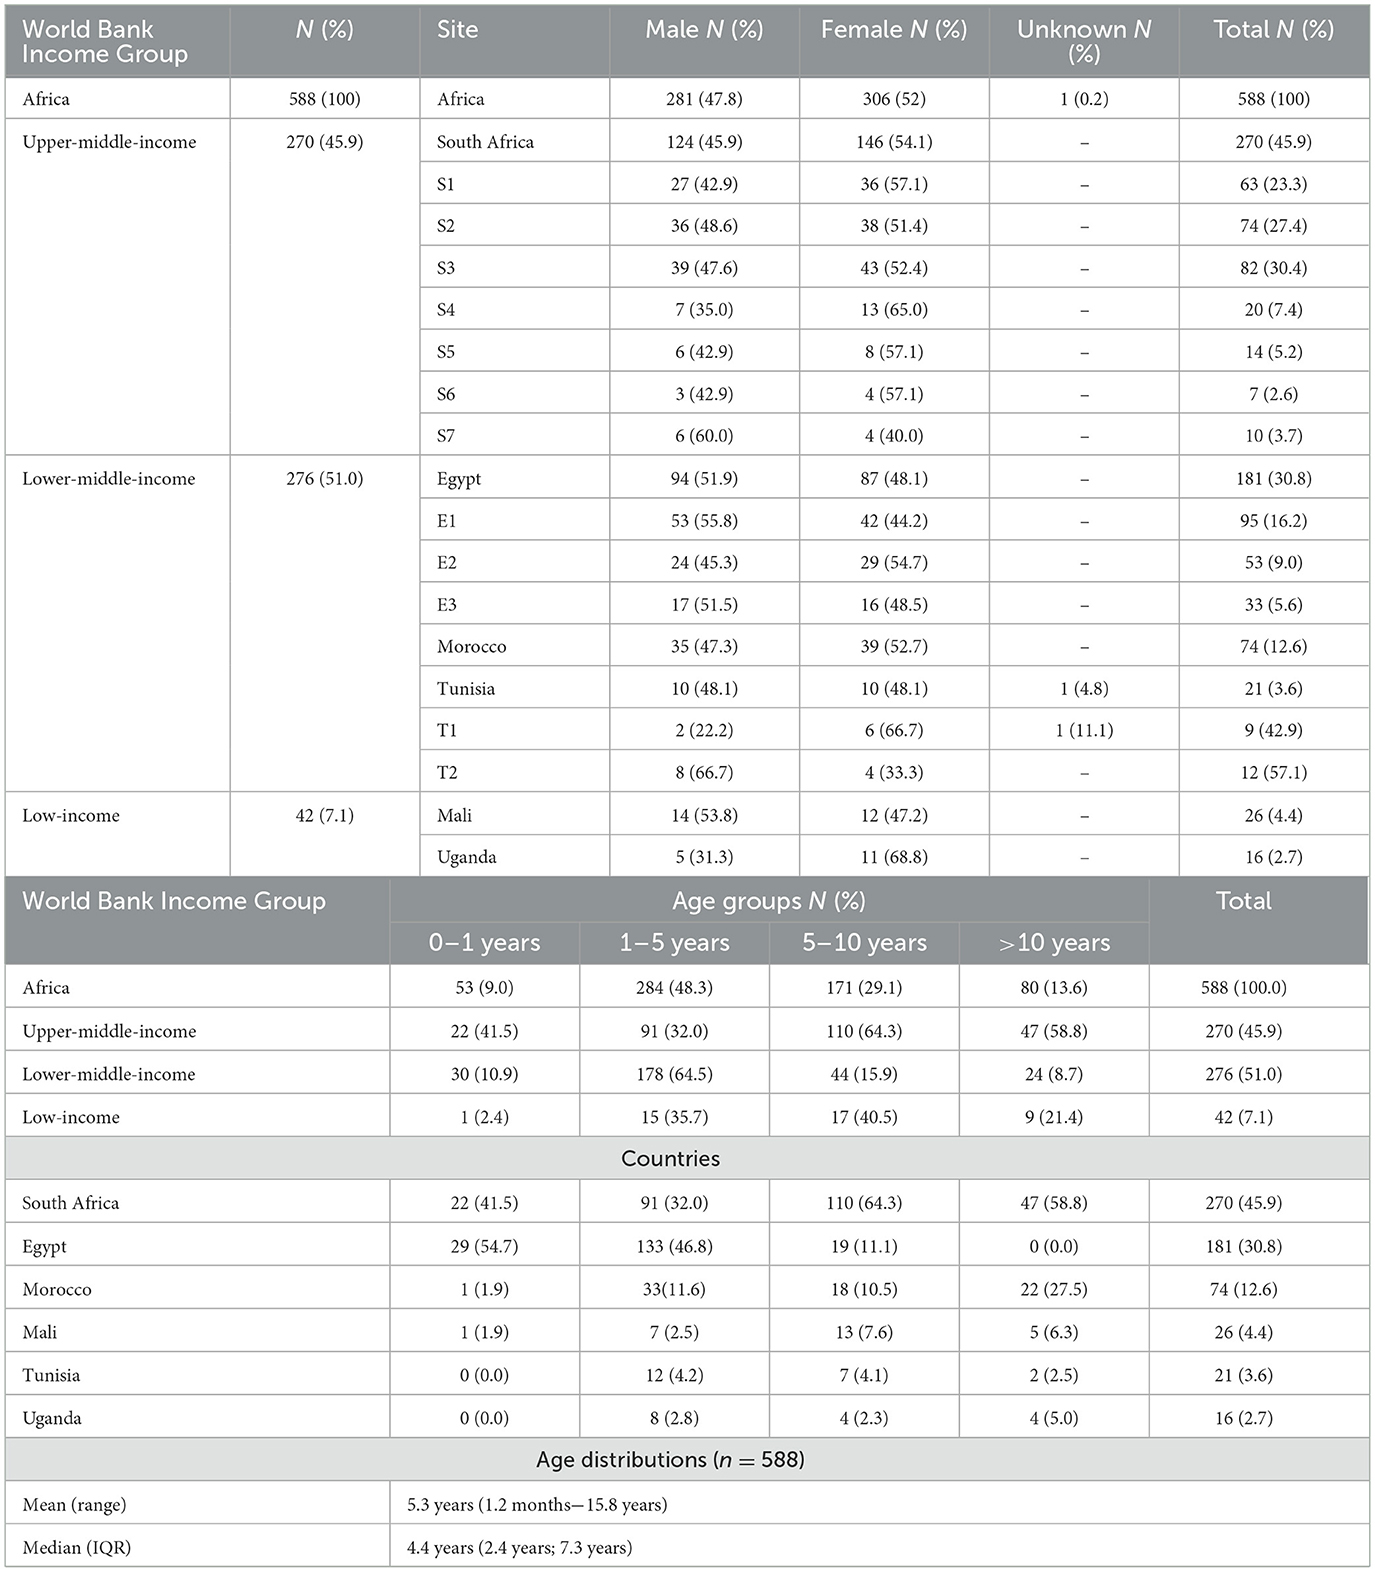
Table 1. Number, sex and age of children diagnosed with low-grade glioma from 2008 to 2018 in Africa.
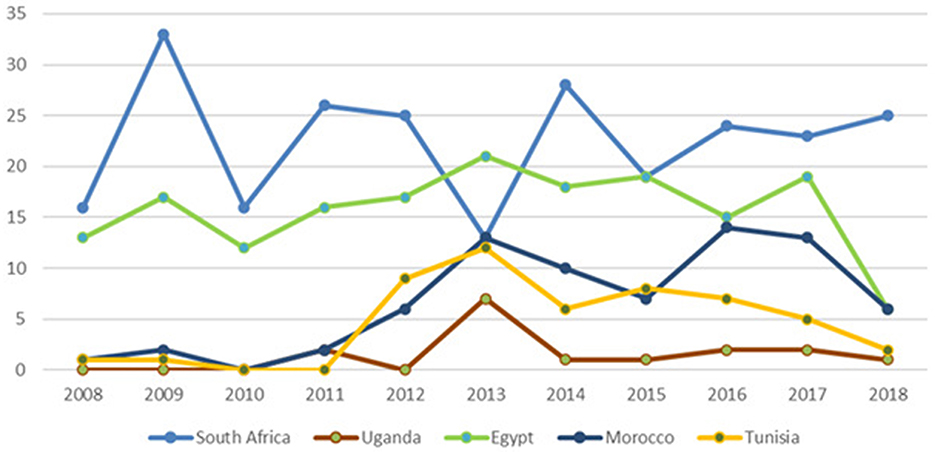
Figure 4. The yearly number of diagnoses per country over the study period. * *No dates of diagnosis were available for Mali.
Fifteen POU participated from the six countries (see Supplementary Table 2): seven from South Africa, three from Egypt, two from Tunisia, and one each from Mali, Morocco, and Uganda. Ten (66.6%) POUs had dedicated neuro-oncology MDT meetings. Two (13.3%) had pediatric neuro-oncology subspecialists, and four (26.6%) had dedicated neuro-oncology follow-up clinics. One POU had the full complement of radiotherapy and neurosurgery services and a pediatric neurologist and endocrinologist, pathologist, radiologist, and geneticist in the same hospital. All other POUs either did not have all the services or had to refer patients to another hospital for at least one service. None of the POUs had the full complement of neurosurgery, radiotherapy, a pediatric neurologist, a pediatric endocrinologist, and rehabilitation services (physiotherapy, occupational therapy, speech therapy, etc.) in the same follow-up clinic. However, rehabilitation services were available in nine (60%) of the POUs.
Patient and tumor characteristics
Two-hundred and seventy (45.9%) children were from an upper-middle-income country, 276 (51%) from a lower-middle-income country, and 42 (7.1%) from a low-income country (see Table 1). Collectively, there was a slight female predominance with a 1:0.9 ratio. The female predominance was also present in the South African, Moroccan, and Ugandan cohorts (see Table 1).
The median age at diagnosis was 4.4 years (IQR 2.4–7.3 years). Most children were between 1 and 5 years old at diagnosis (n = 284; 48.3%). This was the case in Egypt (n = 133; 73.5%), Morocco (n = 33; 44.6%), Tunisia (n = 12; 57%), and Uganda (n = 8; 50%), but in South Africa (n = 110; 40.7%) and Mali (n = 13; 50%), most children were between 5 to 10 years old. The predominant age group in the upper-middle (n = 110; 40.7%) and low-income countries (n = 17; 40.5%) was 5 to 10 years old, compared to the 1 to 5-year-old group in lower-middle-income countries (n = 178; 64.5%; see Table 1). In the entire cohort, the median duration of symptoms before diagnosis was 60 days (IQR 21 days; 120 days). In Tunisia, the median duration of symptoms was 13 days (IQR: 6 days; 18 days), in South Africa 45 days (IQR: 14 days; 112 days), in Mali 60 days (IQR: 30 days; 120 days), in Egypt 60 days (IQR: 30 days; 90 days), in Morocco 90 days (IQR: 30 days; 240 days), and in Uganda 120 days (IQR: 44 days; 240 days).
The three most common primary sites were the brainstem (n = 125; 21.3%), cerebellum (n = 124; 20.2%) and the cerebrum (n = 119; 20.2%; see Table 2). The brainstem was the main primary tumor site in South Africa (n = 82; 30.4%) and Morocco (n = 28; 37.8%), the cerebrum in Mali (n = 11; 53.8%), the cerebellum in Egypt (n = 53; 29.3%), and the optic nerves in Tunisia (n = 10, 47.6%). Notably 2 of the 7 centers in South Africa reported 66 of the 82 (80%) brainstem LGGs. In Uganda, tumors were equally prevalent in the cerebrum, cerebellum, and optic nerves (n = 4; 26.7%). The rate of optic nerve presentations in Africa was 16.7% but varied between the six countries: from 7.8% in South Africa to 47.6% in Tunisia. The median tumor diameter for all patients was 42 mm (IQR 21 mm−90 mm). Metastatic disease was present in 3.6% of the cohort, with the highest prevalence in Mali (7.7%), followed by Tunisia (4.8%), South Africa (4.1%), Egypt (2.8%), and Morocco (2.7%). None of the Ugandan patients had metastatic disease (see Supplementary Table 3).
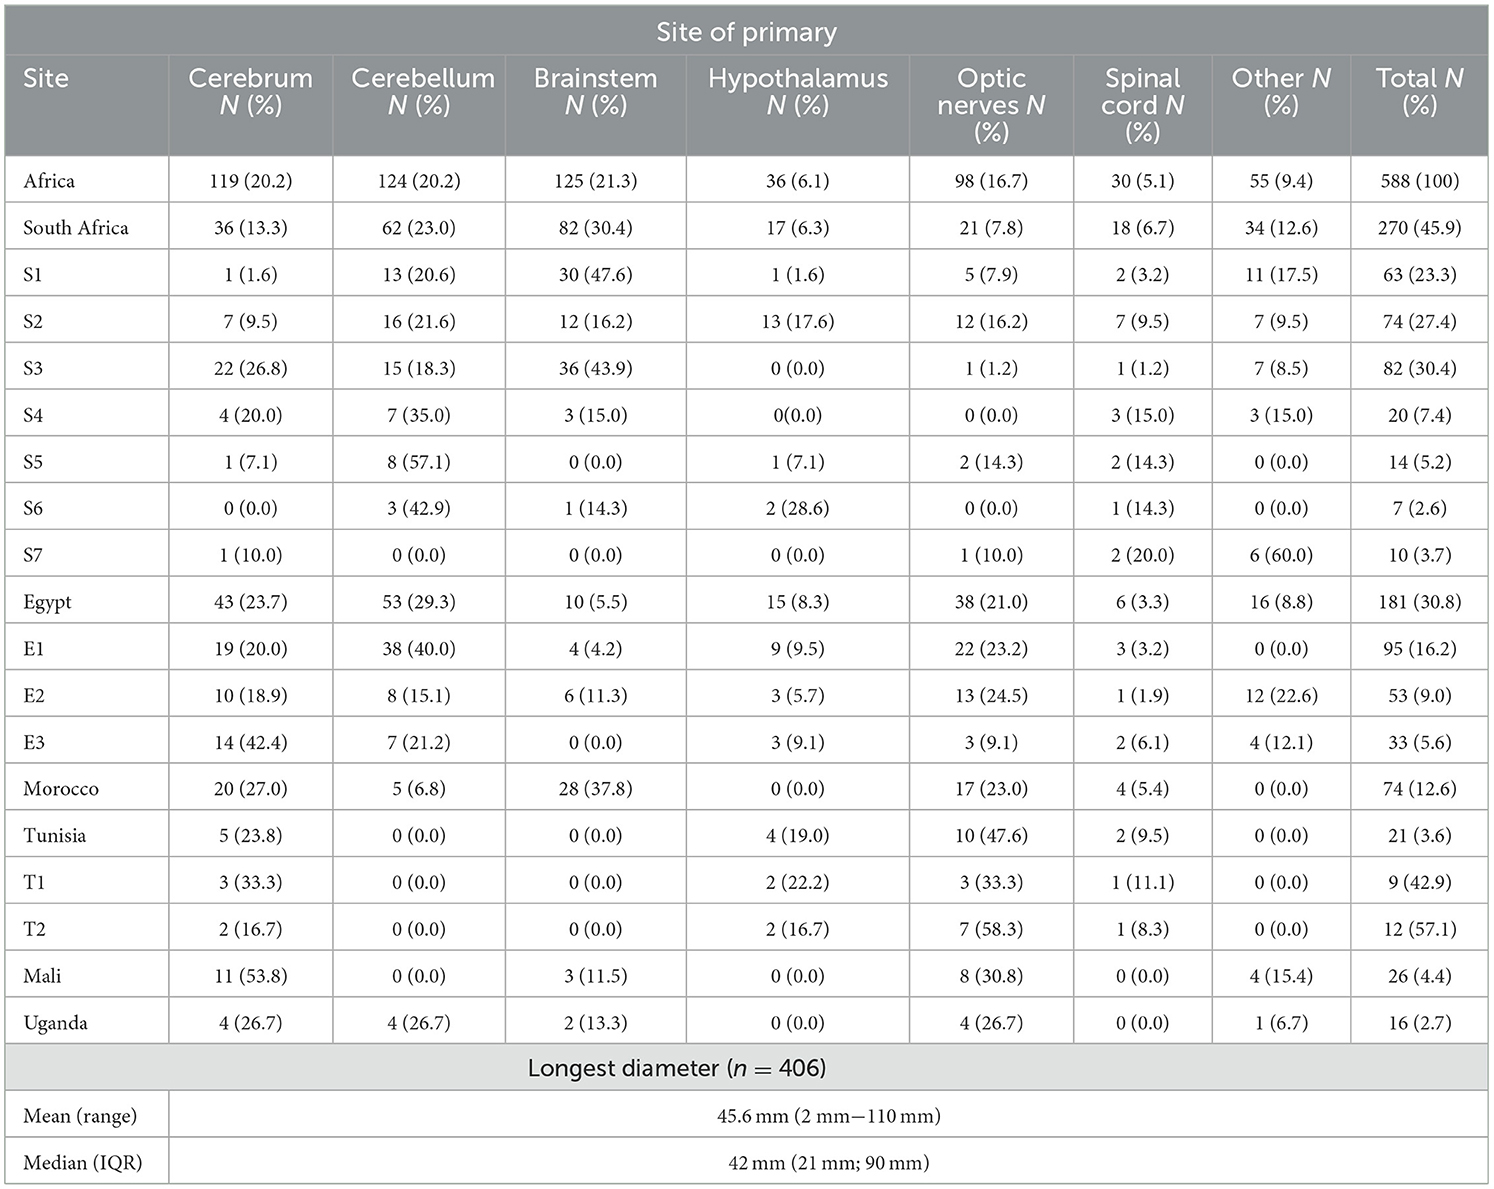
Table 2. The primary site and diameter of tumors.
A biopsy was performed to confirm the diagnosis in 379 patients (64.5%; see Supplementary Table 4). The country with the highest biopsy rate was Egypt (n = 163; 90.1%), ranging from 75.8% to 100%. Uganda, Tunisia, and South Africa had biopsy rates of 62.5%, 61.9%, and 61.5%, respectively. South Africa's rates ranged from 41.3% to 100%, with a median of 61.5%. Mali (n = 25, 96.2%) and Morocco (n = 48, 64.9%) predominantly relied on radiological diagnosis without being biopsied. In South Africa and Tunisia the number of tumors diagnosed on imaging alone was 104 (38.5%) and 8 (38.1%), respectively. Egypt diagnosed only 18 (9.9%) tumors on imaging alone.
The most common histological type for those tumors that were biopsied was pilocytic astrocytoma (n = 270; 47.5%; see Supplementary Table 5). This was reflected in South Africa (n = 129; 47.8%), Egypt (n = 106; 58.6%) and Morocco (n = 23; 31.1%). In Tunisia, pilocytic astrocytoma and diffuse astrocytoma were most commonly diagnosed (n = 6; 28.6% each). In Uganda, pilocytic astrocytoma and histology NOS were most prevalent (n = 5; 31.3% each). In Egypt, the second most common histology was diffuse astrocytoma.
Tumors were graded as WHO Grade I in 272 patients (46.3%) and Grade II in 143 patients (24.3%; see Supplementary Table 3) The remaining cases (n = 173; 29.4%) were diagnosed by imaging. In Egypt and South Africa, Grade I histology was more common (59.2% and 50.4%, respectively) than Grade II (40.3% and 14.1%, respectively). In Morocco and Tunisia, Grades I and II histology were equally diagnosed. In Uganda, Grade II histology (n = 7; 43.8%) was diagnosed more often than Grade I (n = 2; 12.4%).
Neurofibromatosis type I was clinically diagnosed or genetically confirmed (see Supplementary Table 6) in 6.8% of patients: Tunisia (19%), Morocco (12%), Egypt (9.4%), and South Africa (3.7%). No patients were diagnosed with neurofibromatosis in Mali or Uganda. More than 99% of patients had no documentation of tuberous sclerosis. Three (< 1%) cases were reported from South Africa.
Management of pediatric low-grade glioma in Africa
A complete resection (see Table 3) was achieved in 16.8% (n = 99) of patients, an incomplete resection was done in 30.4% (n = 179), and no interventions or biopsy only were documented in 52.7% (n = 310) of patients. Surgical resection (complete or incomplete) was done in 52.2% of patients in South Africa, followed by 50% in Morocco, 47.6% in Tunisia, 44.7% in Egypt, 37.5% in Uganda and 11.5% in Mali. The majority of patients (n = 433; 73.6%) did not receive radiotherapy (see Table 3). In 8 (1.4%) radiotherapy status was not documented. No patients in Mali and Uganda received radiotherapy. In Egypt, 12.2% (n = 22) of patients received radiotherapy, compared to 33.3% (n = 8) in Tunisia, 35.1% (n = 26) in Morocco, and 37% (n = 100) in South Africa. The majority of patients received no chemotherapy (n = 329; 56%; see Table 4). In the 259 patients who received chemotherapy, the most commonly used protocol was vincristine and carboplatin (n = 220; 84.9%), followed by vinblastine only (n = 14; 5.4%) and combination therapy with vincristine-etoposide-cyclophosphamide-carboplatin-procarbazine (n = 14; 5.4%). Five patients (1.9%) received temozolomide. In South Africa, 41.1% (n = 111) of patients received chemotherapy. Vincristine and carboplatin were administered in 43.2% (n = 48) of patients, and vinblastine or temozolomide in 0.01% (n = 1) each. No chemotherapy was administered in 75% (n = 12) of Ugandan patients, while 12.5% (n = 2) received vincristine and carboplatin and 12.5% (n = 2) received vinblastine. In Tunisia (n = 16; 76.3%) and Morocco (n = 36; 48.6%), vincristine and carboplatin were given the most frequently. In Egypt of the 114 (63%) patients who received chemotherapy, only Vincristine and carboplatin were administered. In Mali, six (25%) of the 24 patients who received chemotherapy, received a non-standard chemotherapy regimen, followed by vincristine, carboplatin, and vinblastine with four (16.7%) each. Eighteen (3.1%) patients received targeted therapy (BRAF-, MTOR-, MEKi-inhibitors, or bevacizumab), which were administered in Morocco (n = 7; 9.5%); South Africa (n = 9; 3.3%) and Egypt (n = 2; 1.1%; see Table 4).
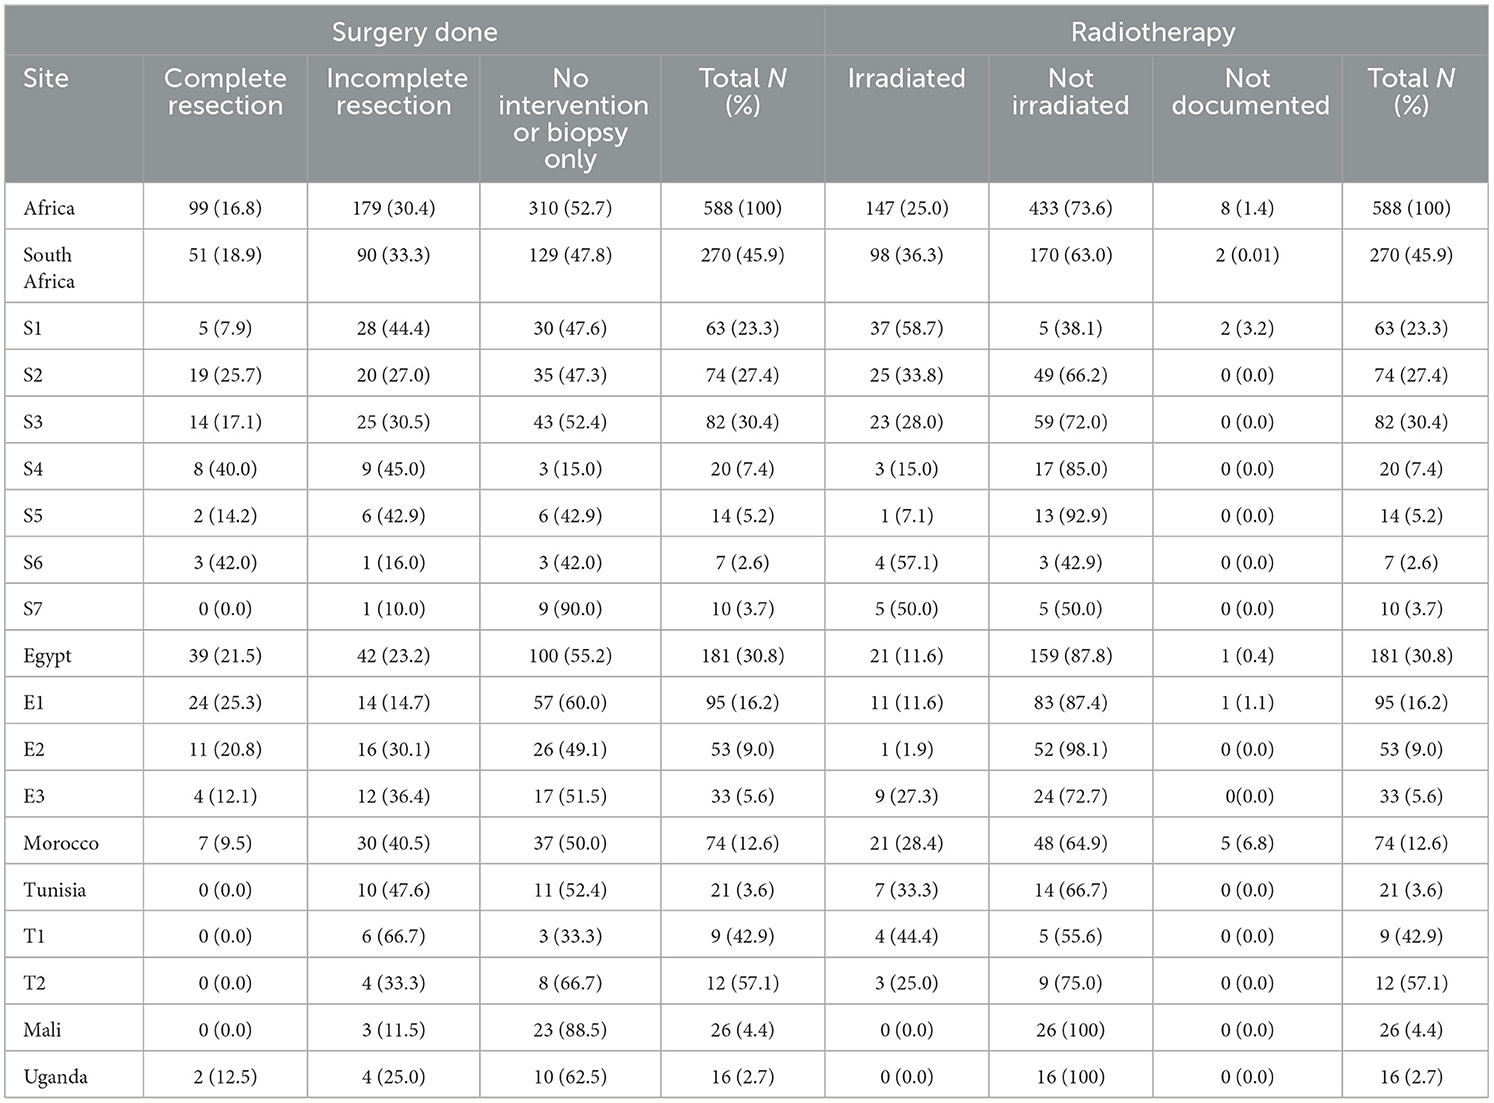
Table 3. Rates of surgical and radiotherapy interventions of children diagnosed with low-grade glioma in Africa.
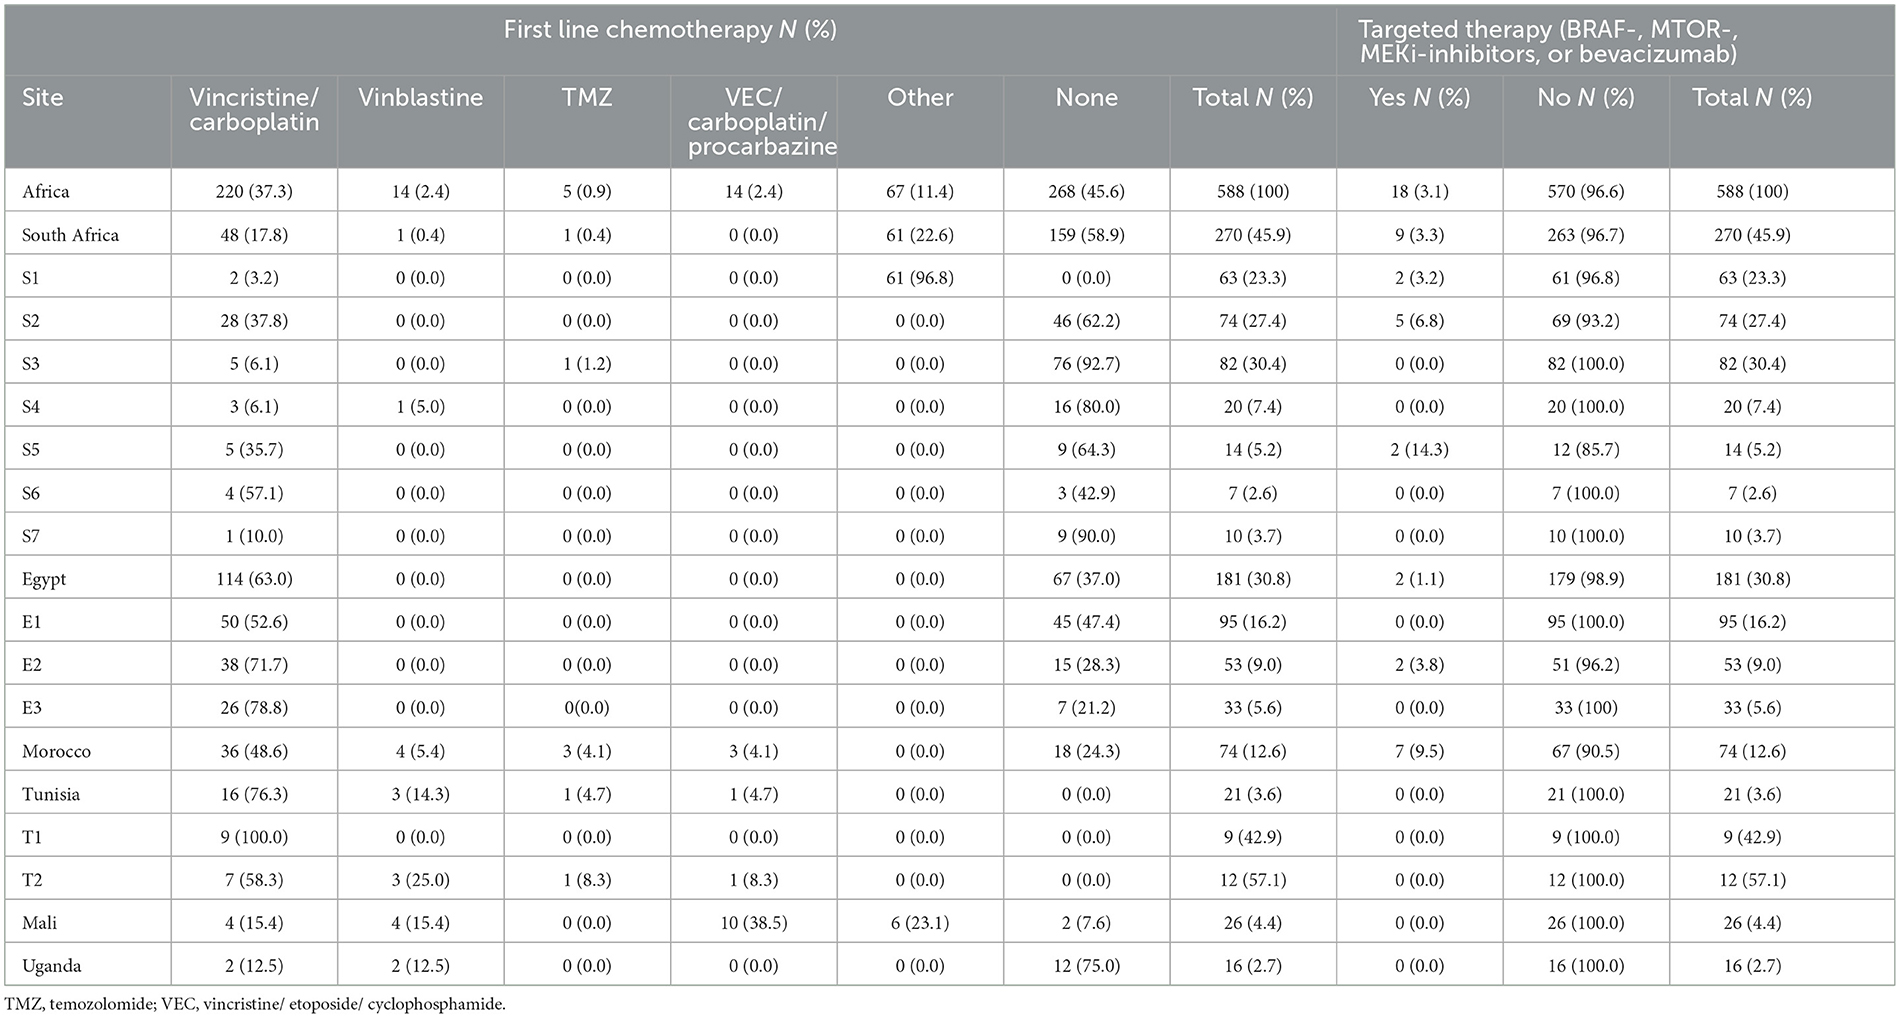
Table 4. Rates of chemotherapy treatment protocols of children diagnosed with low-grade glioma in Africa.
Survival events and outcomes
A third (n = 196; 33.3%) of patients experienced no events (see Supplementary Table 7). The most common event was tumor progression (n = 140; 23.8%), followed by patients being lost-to-follow-up (n = 130; 22.1%). In Morocco 38 patients experienced disease progression (51.4%), 47 in Egypt (26.0%) and 53 in South Africa (19.6%). Tunisia and Uganda reported no tumor progression events; in Mali, 7.7% (n = 2) of tumors progressed. The country with the highest number of patients lost-to-follow-up was Mali (n = 16; 61.5%), followed by Uganda with 50% (n = 8). Egypt had the lowest number of patients lost to follow-up (n = 28; 15.5%; range 9.1 to 18.9%), followed by South Africa (n = 53; 19.6%; range 0% to 57.1%). Eight (1.4%) of the patients developed secondary malignancies, all of whom were from South Africa. The highest percentage of disease-related deaths was reported from South Africa (n = 63; 23.3%), followed by Mali (n = 16; 23.1%) and Uganda (n = 3; 18.8%). No deaths were reported from Tunisia, eight were reported from Egypt (4.4%), and none from Morocco (12.2%). The median follow-up period was 91.1 months (IQR 33–141 months).
The 2-year and 5-year event-free survival (EFS; see Table 5) were 70.8% ± 2.3% and 62.0% ± 2.4%, respectively. The highest 2-year and 5-year EFS were reported from Tunisia with 95.0% ± 4.9% and 90.0% ± 6.7%, respectively, followed by South Africa with 81.1% ± 3.7% and 65.7% ± 4.5%, respectively, and Egypt with 79.9% ± 3.0% and 61.7% ± 3.5% respectively (p < 0.001). Morocco and Uganda had 2-year EFS of 35.1% ± 5.5% and 31.3% ± 11.6%, respectively, and 5-year EFS of 21.6% ± 4.7% and 31.3% ± 11.6% respectively (p < 0.001).
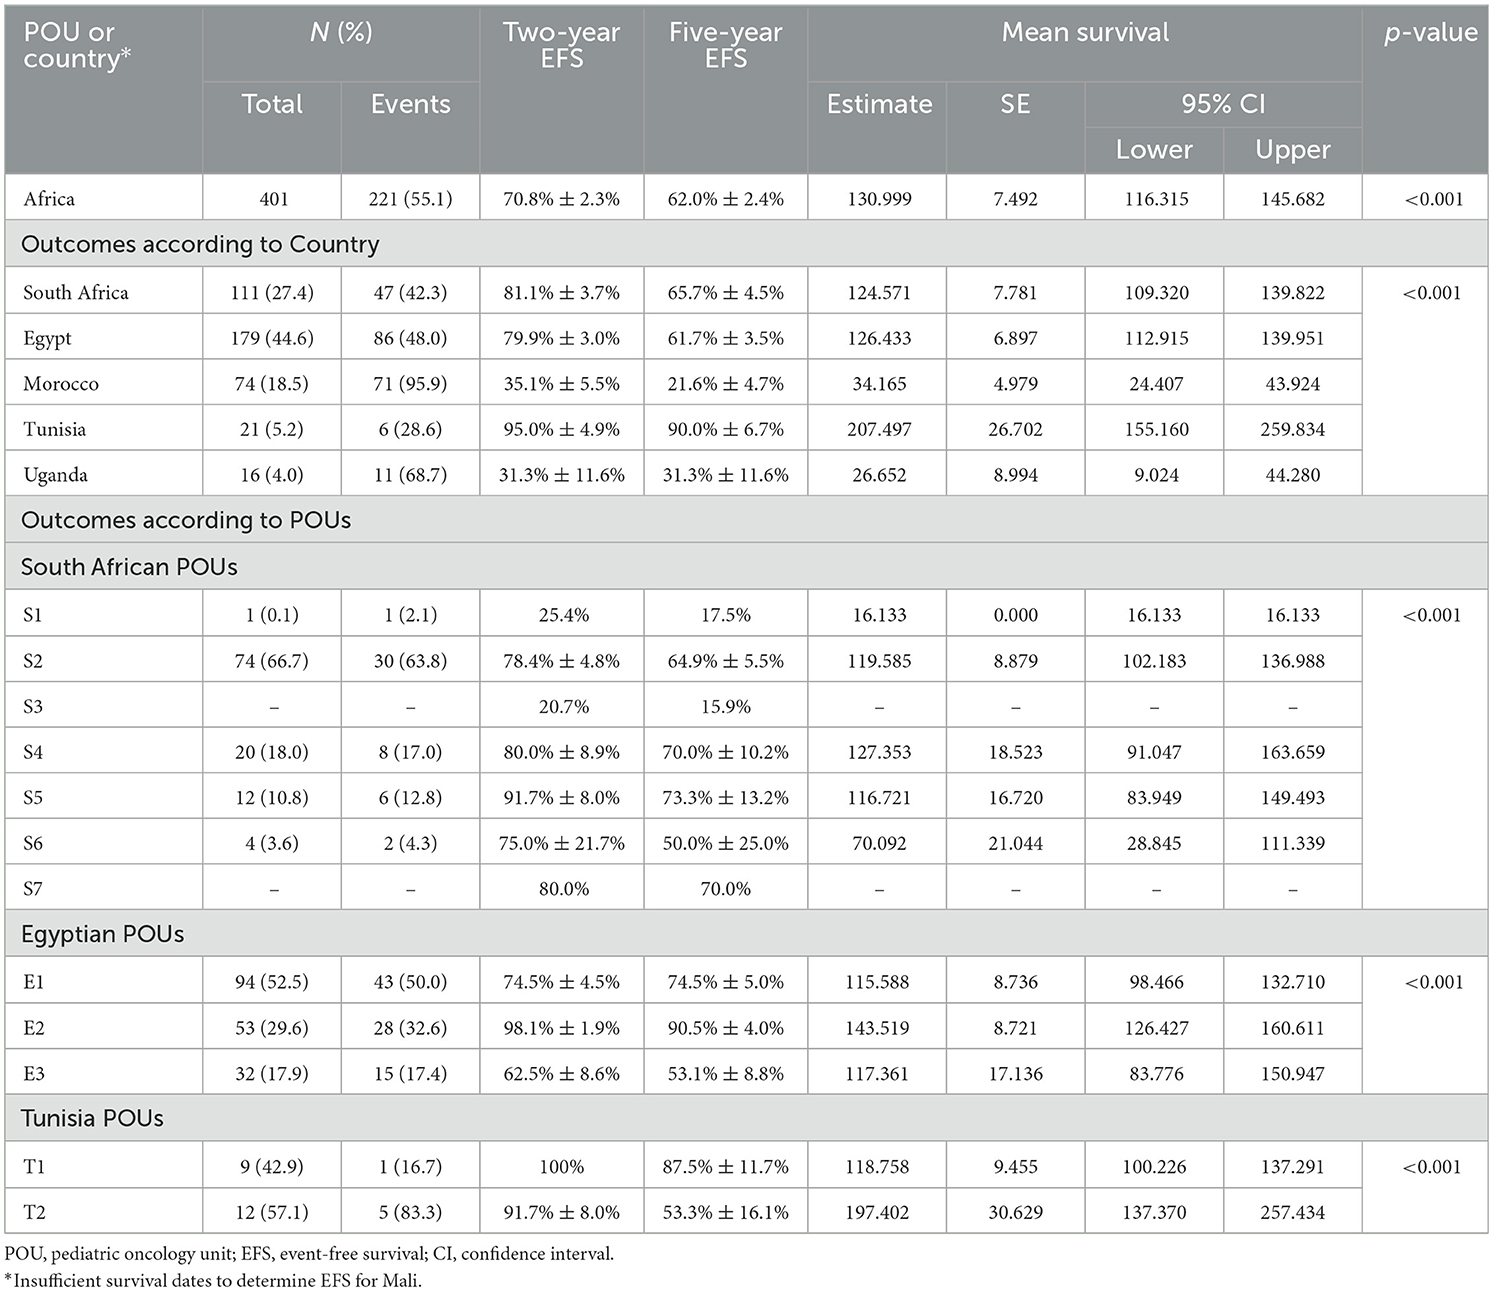
Table 5. Event-free survival outcomes children diagnosed with low-grade glioma in Africa from 2008 to 2018.
The 2-year and 5-year cPFS of the entire cohort were 87.8% ± 1.7% and 82.5% ± 2.1%, respectively (see Table 6). Tunisia had a 100% 2-year and 5-year cPFS, followed by Egypt with 95.9% ± 1.5% and 81.7% ± 1.5%, respectively, and South Africa with 88.4% ± 3.2% and 66.6% ± 4.5% respectively (p < 0.001). Morocco and Uganda had 2-year cPFS of 85.3% ± 4.6% and 79.7%, respectively, and 5-year cPFS of 36.4% ± 7.4% and 79.7% respectively (p < 0.001).
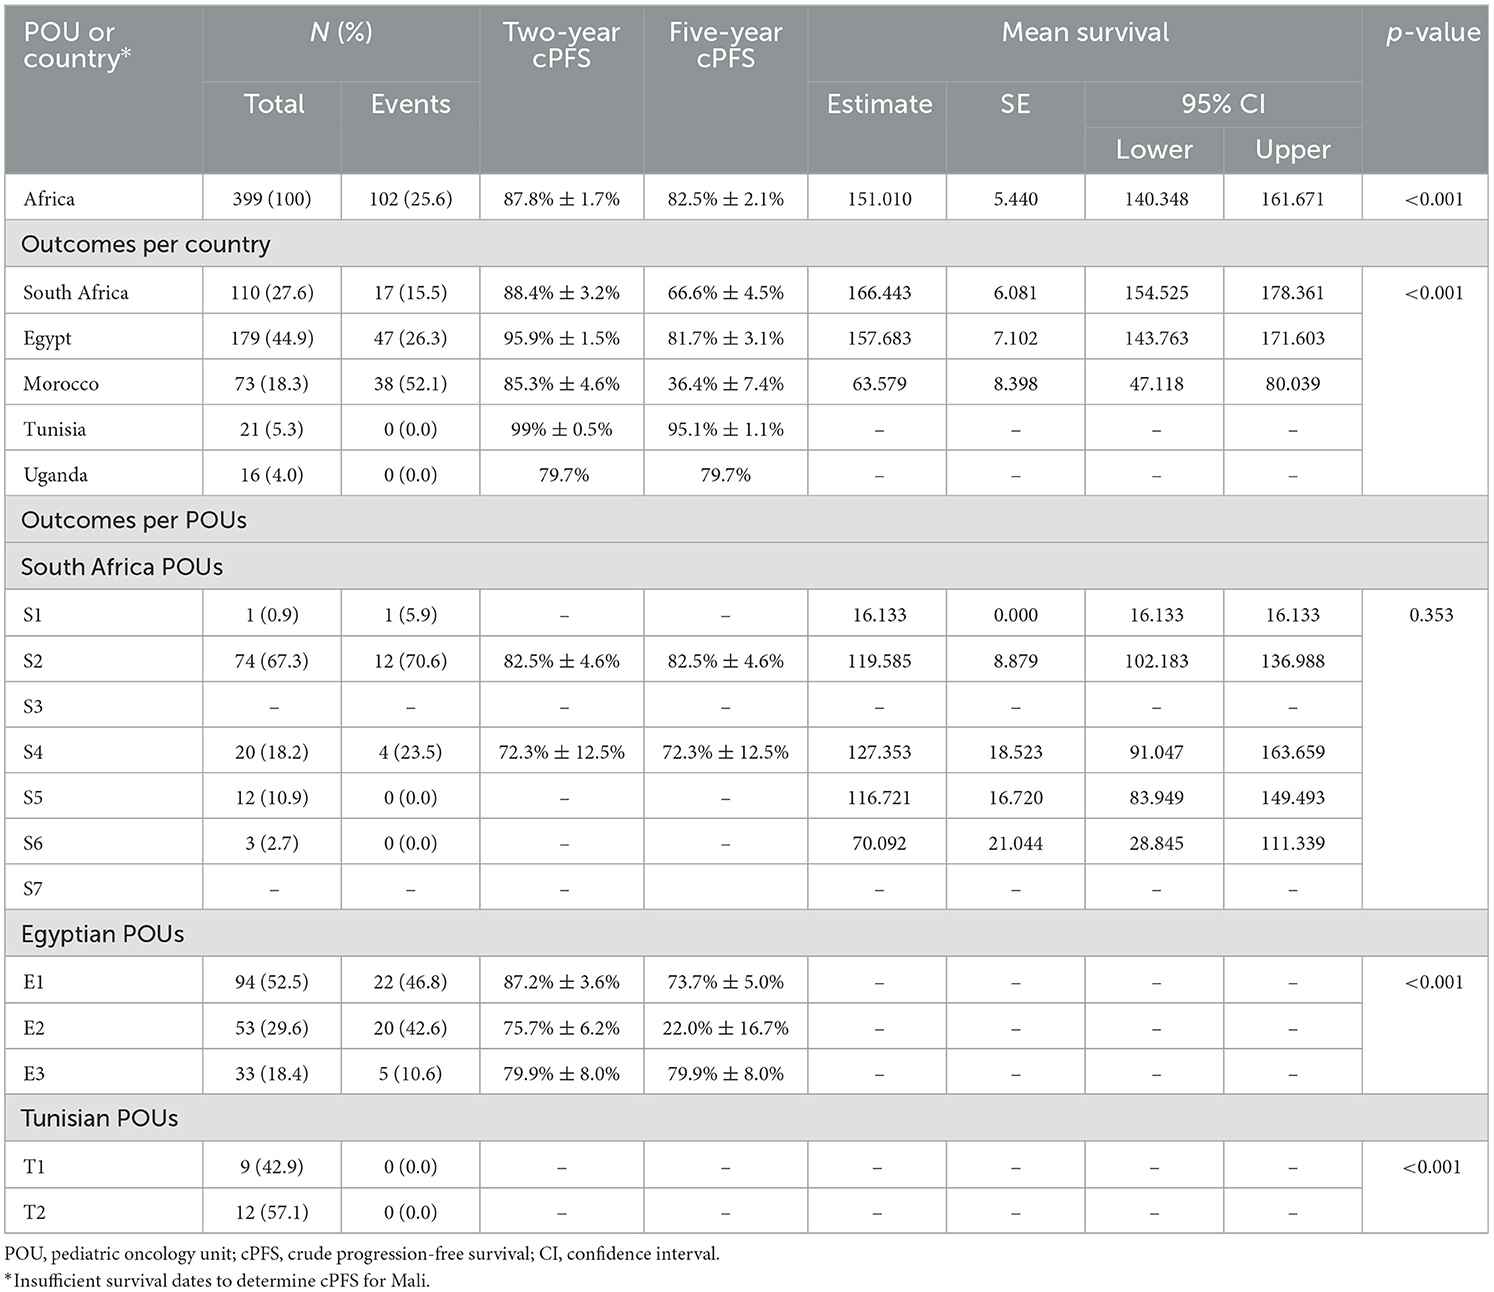
Table 6. Crude progression-free survival for children diagnosed with low-grade glioma from in Africa 2008 to 2018.
The 2-year and 5-year OS for the entire sample (see Table 7 and Figure 5) were 92.6% ± 1.4% and 90.5% ± 1.6%, respectively (p < 0.001). Tunisia had the highest 2-year and 5-year OS with 100% and 100%, respectively, followed by Egypt with 95.8% ± 1.6% and 92.4% ± 2.1%, and South Africa with 91.6% ± 2.7% and 89.0% ± 3.2% respectively (p < 0.001). Morocco and Uganda had 2-year OS of 89.8% ± 3.7% and 66.7% ± 15.7%, respectively, and 5-year OS of 70.7% ± 6.7% and 66.7% ± 15.7%, respectively (p < 0.001). South African, Egyptian and Tunisian OS data were represented by more than one POU (Table 7). In South Africa the 5-year OS of the seven POUs varied between 93.1% ± 3.0% to 19.0%. In Egypt the 5-year OS of the three POUs were 100%, 94.2% ± 2.9% and 68.2% ± 8.8%. Both the Tunisian POUs had 5-year OS of 100%.
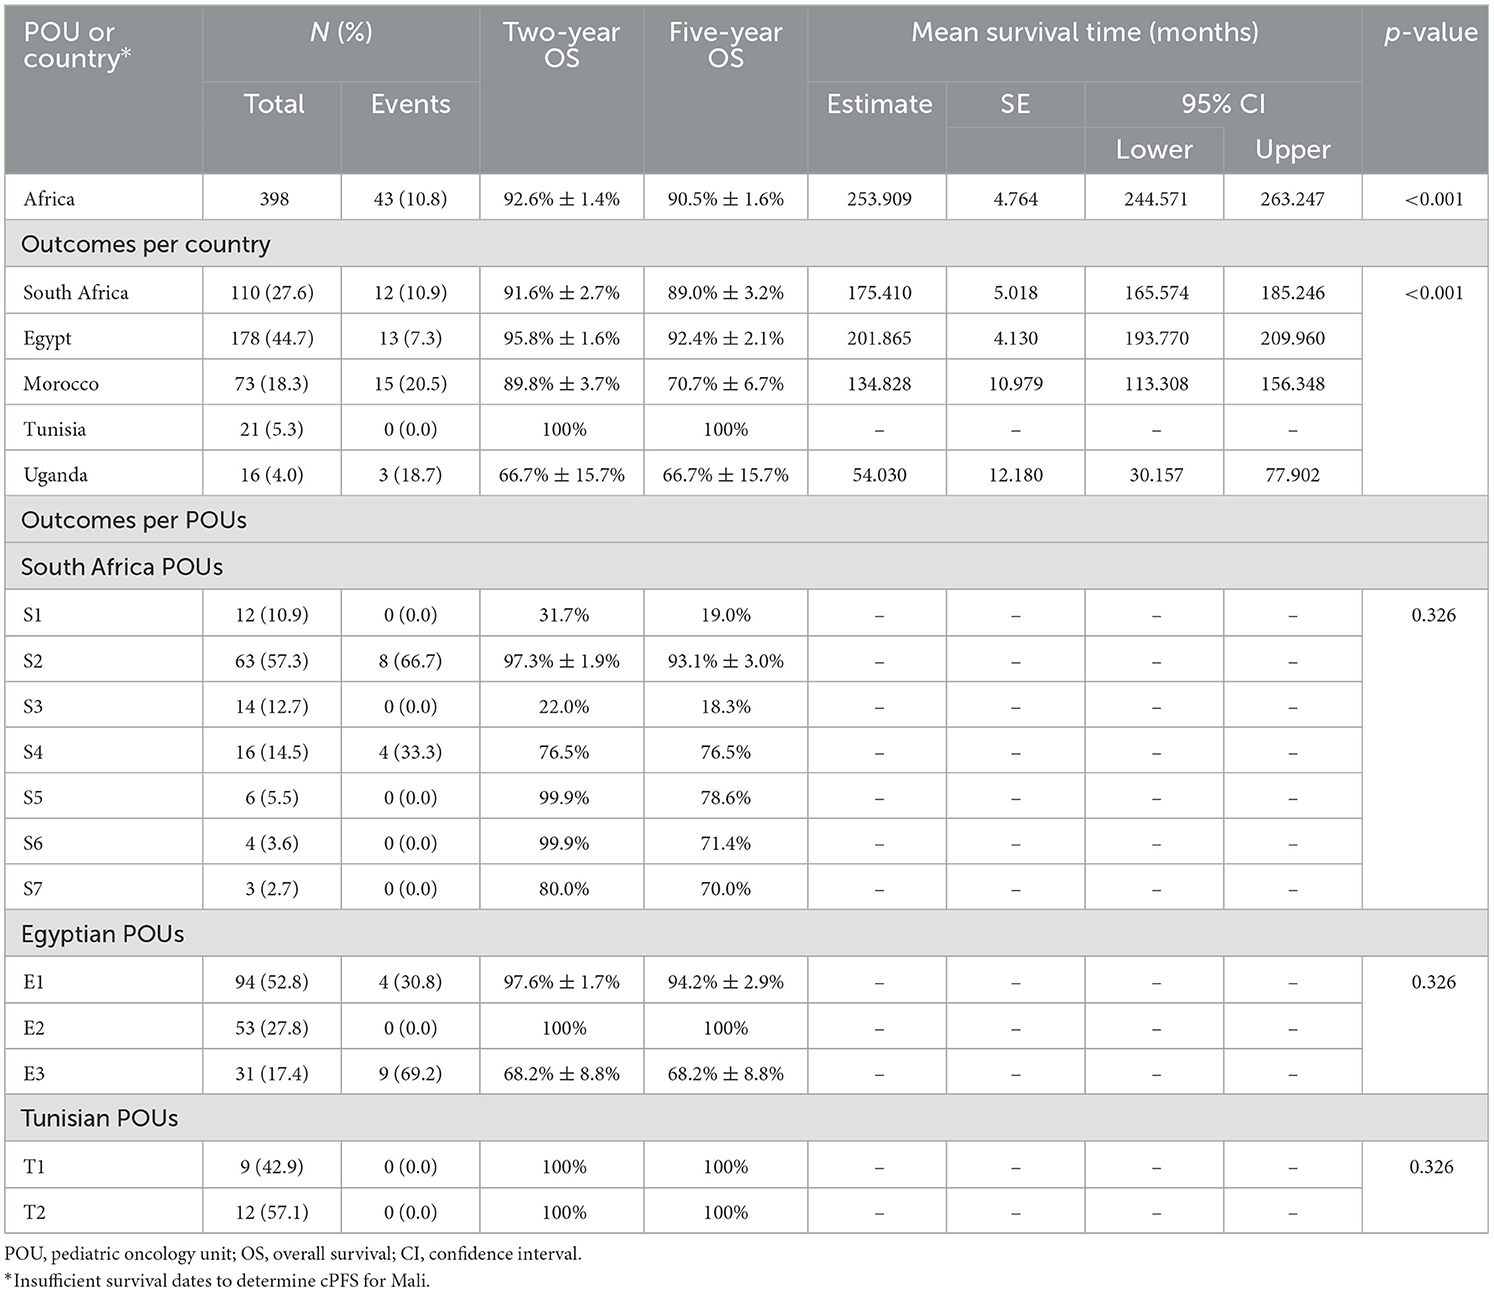
Table 7. Overall survival for children diagnosed with low-grade glioma in Africa from 2008 to 2018.
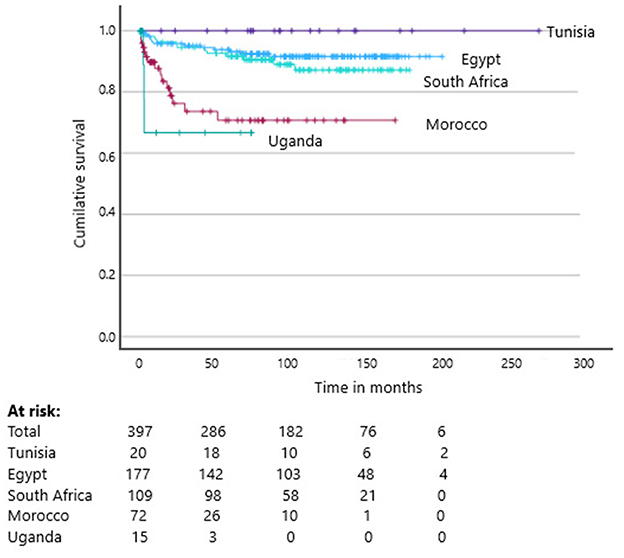
Figure 5. Kaplan–Meier Curves of the overall survival of children diagnosed with low-grade glioma between 2008 and 2018 (p < 0.001).
Based on the primary tumor site (Table 8), the 2-year OS and 5-year OS were respectively: 96.6% ± 2.0% and 95.2% ± 2.3% for the cerebellum, 96.0% ± 3.9% and 96.0% ± 3.9% the spinal cord, 97.0% ± 3.0% and 93.6% ± 4.4% for the hypothalamus, 95.7% ± 2.4% and 92.6% ± 3.2% for the cerebrum, 94.6% ± 2.6% and 92.9% ± 3.1% for the optic nerve and pathways. The 2-year OS and 5 year OS for the brainstem were the lowest with 74.0% ± 6.6% and 66.0% ± 7.3% respectively.
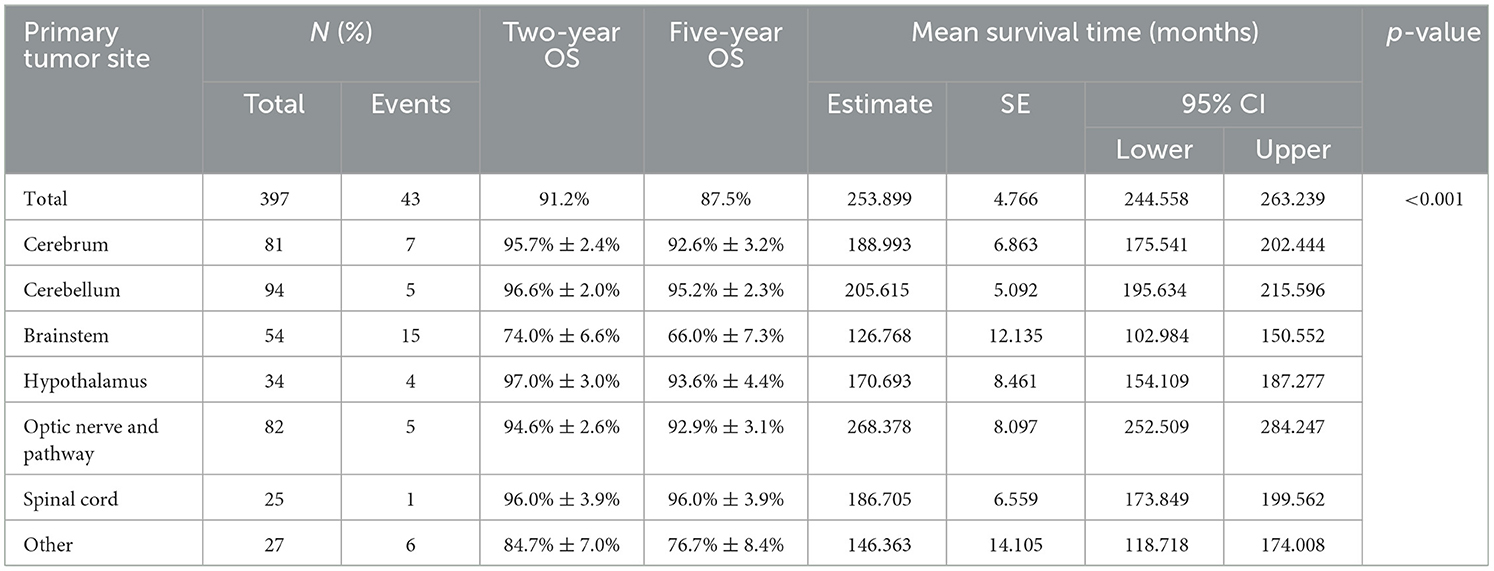
Table 8. Overall survival according to primary tumor site of low-grade glioma in Africa from 2008 to 2018.
The 2-year OS for WHO grade I and WHO grade II (Figure 6) were 97.1% ± 1.2% and 95.0% ± 1.6% respectively. The 5-year OS WHO grade I and WHO grade II were 91.5% ± 2.7% and 87.2% ± 3.3% respectively (p < 0.02). Based on histology (Table 9), the 2-year OS and 5-year OS were respectively: 94.9% ± 1.6% and 93.8% ± 1.7% for pilocytic astrocytoma, 100% and 92.9% ± 6.9% for Pilomyxoid astrocytoma, 90.3% ± 4.2% and 88.1% ± 4.6% for Diffuse astrocytoma and 96.0% ± 3.9% and 81.6% ± 8.4% for Subependymal giant cell astrocytoma. Ganglioglioma had 100% OS at both 2-years and 5-years. In tumors where the histology was unknown the 2-year and 5-year OS were 67.2% ± 8.4% and 62.7% ± 9.0% respectively.
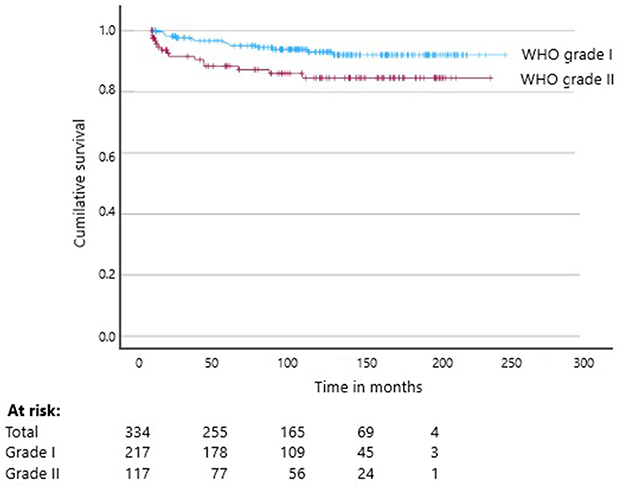
Figure 6. Kaplan–Meier Curve of the overall survival of pediatric low-grade glioma according to WHO grading between 2008 and 2018 (p < 0.02).
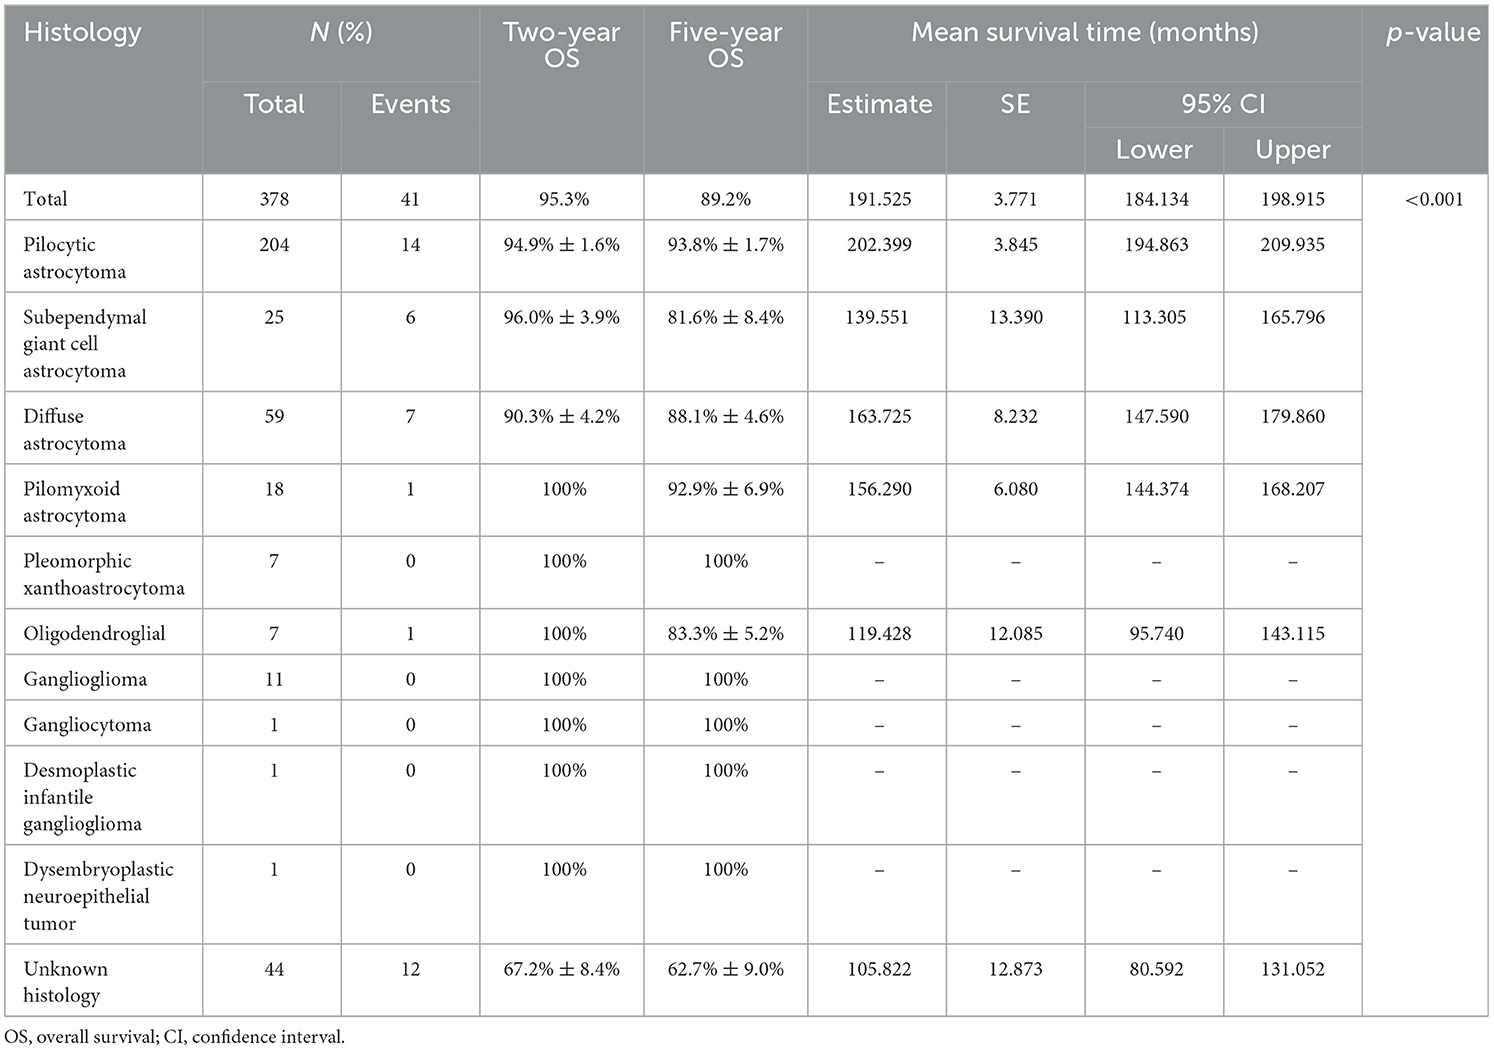
Table 9. Overall survival according to histological subtypes of low-grade glioma in Africa from 2008 to 2018.
Discussion
This study illustrates the heterogeneous resources, management and outcomes of pediatric LGG in Africa. Africa has fledgling multidisciplinary teams in many centers establishing neuro-oncology treatment approaches and many services that cannot offer all surgery, radiotherapy, or chemotherapy options. Diagnoses are still primarily made on imaging, and survival varies between and within countries. Providing adequate treatment and establishing dedicated long-term follow-up programs are challenging.
A key factor in evaluating tumor outcomes is the capacity to treat patients with neuro-oncological diseases (21). In many African settings, basic pediatric oncology services have not been established or have only recently been established, including the capacity to diagnose and treat children with LGG. Previously, children diagnosed with LGG were managed by neurosurgeons or adult oncology services. In our study, there is a significant heterogeneity in the availability of services. Excluding countries without pediatric oncology services, nearly 13% did not have neurosurgeons and radiotherapy facilities. In countries with radiotherapy services, challenges with maintenance contracts, workforces unaccustomed to treating pediatrics, and regulatory issues affecting access and availability limits optimal delivery of services (31). Nearly half of centers have to transport children to other hospitals to obtain radiotherapy services. Radiotherapy machines are inequitably distributed in the public and private sectors where private hospitals can only be accessed by self-funded patients or those who have private medical aid (31). In Africa, there is one radiotherapy center per 2.24 million children under the age of 15 years, one neurosurgeon per 304,685 children, and one pediatric neuro-oncology specialist for more than 150 million children. The majority of these services are concentrated in 7% of African countries. Many neuro-surgical and radiotherapy services are overburdened and primarily treat adult patients (30). In comparison, in the United States of America, there is one radiotherapy center per 28,000 children under the age of 15 years, one neurosurgeon per 15,468 children, and one pediatric neuro-oncology specialist per 373,330 children (25, 26).
In our study, the diagnosis of LGG was biopsy-confirmed in 65% of the cases, mainly in the three countries where neurosurgical services are concentrated (Egypt, South Africa, and Morocco). Morocco, Mali and several POUs in South Africa diagnosed 60% or more of pediatric LGG cases on imaging, which we postulate represents the greater African region in countries with limited resources. In hospitals where neurosurgeons deem tumors unresectable and refer patients to other centers, the number of image-diagnosed tumors is falsely elevated, and the primary tumor sites do not follow global trends (32). In the absence of an accurate tissue diagnosis, the optimal use of chemotherapy and targeted therapy options is limited. The matter is further complicated by late presentation and tumors that are deemed unresectable, which is often the case in Africa (33).
The most common primary site in this cohort was the brainstem compared to the cerebellum, optic tract and cerebrum in global reports (33). The high number of brainstem tumors in two South African centers and in Morocco skewed the overall results. The remaining countries reported primary tumors in the cerebellum, optic pathways and cerebrum, aligning with reports from the literature (8). One possible reason could be that diffuse midline gliomas may have been included in the sample in centers where diagnoses were based on imaging alone (34). The second possible reason is that fully resected tumors were not referred by neurosurgery in these centers. We do not believe that this represents a different demography of LGG by site in Africa.
Cases without a known histology, who was either not biopsied of diagnosed on radiological imaging, had a far inferior 5-year OS of 62.7% compared to cases with known histological results. Pilocytic astrocytoma was the most commonly reported histology in the entire sample, as well as in some individual countries, which is in line with global reports (34). There was a disproportionately high percentage of Grade II tumors in the African cohort. The majority (75%-80%) of pediatric LGG are WHO Grade I, compared to 65% in our study. A possible reason for this may be the accuracy of reports by pathologists, reflecting greater experience in diagnosing adult pathology rather than pediatric pathology. In our sample 13.6% of patients were older than 10 years and it may well be that some centers were reporting on an older group of pediatric LGG patients, resulting in a higher percentage of Grade II pathology. In our study obtaining a histological diagnosis was of prognostic significance. The limited pathology services in Africa frequently do not have access to central review services to verify diagnoses.
In our study the WHO 2016 brain tumor classification was ideal because the International Classification of Childhood Cancer (ICCC-3) adopts more detailed categories including categories based on molecular results. The ICCC-3 however does not consider clinical tumor behavior which is a hallmark of the WHO grading system. Therefore, the ICCC-3 does not contain distinct entities for astrocytoma, limiting a separate analysis of low-grade and high-grade astrocytic tumors (35). Our study showed that there was a difference in survival between the astrocytoma subtypes where Pilocytic astrocytoma had the best overall survival. Girardi et al. incorporated tumor grade into ICCC-3 to overcome the limitations of the ICCC-3 and account for differences in cancer registration practices globally. This allowed them to report on low-grade astrocytoma for the first time. Although they reported a 5-year OS between 78%−97%, the data set consisted mostly of well-resourced settings. Our study reported a comparative 5-year OS of 87%−97% for grade I and II histology, but investing in molecular diagnostics of low-grade glioma may improve prognostication, identify individual targetable tumor characteristics and limit possible harmful treatments (34).
We postulate that referral patterns could influence the ratio of operable and inoperable tumors managed independently by neurosurgeons and pediatric oncologists. Completely resected LGGs may never be seen or managed by pediatric oncologists, while tumors such as optic gliomas that are mainly treated by chemotherapy are commonly managed by ophthalmologists and pediatric oncologists (32, 36). Only 3.6% of the African sample had metastatic disease. We postulate that inadequate diagnostic services such as lack of MRI in some countries may contribute to this low rate (37). Morocco was the only country with a similar metastatic disease prevalence as the 7%−10% global prevalence (3).
In the entire cohort, neurofibromatosis type I was reported in 6.8% of cases, and tuberous sclerosis in < 1%. This is generally much lower than the globally reported rates (38, 39). Since African patients are poorly represented in most global studies, it is possible that the prevalence of these syndromes is less, however another possible explanation could be missed diagnoses of these predisposition syndromes due to healthcare professionals, with a lack of awareness, overlooking the clinical stigmata of these syndromes. Respondents from Tunisia reported neurofibromatosis type I in 19% of patients, which is comparable to the 15%−20% global prevalence (38, 39).
Pediatric LGG has a highly favorable OS, exceeding 90% in well-resourced settings (40). Based on the SEER registry data, 20-year OS in high-income countries reached between 87%−92% (6). In our study, Egypt and Tunisia achieved similar results, with South Africa just falling short of 90%. Although Morocco and Uganda did not achieve similar survival rates, both countries achieved the GICC goal of 60% and compared favorably with the 69.2% 5-year OS obtained by other LMICs such as Thailand and the Caribbean islands (19). In well-resourced settings, nearly 40% of pediatric patients with LGG treated with chemotherapy will have disease progression or relapse (19). In our study, progression and relapse accounted for 28.1% of all events but varied considerably between countries, with Morocco reporting progression in half of patients and relapse in 6.7%. Tunisia and Uganda did not document any progressions or relapses, possibly due to death. Another contributing factor could be the combination or sequence of treatment: radiotherapy has higher control rates exceeding 80%. Vincristine combined with carboplatin provides a 2-year PFS rate between 40%−50%, sometimes reaching higher rates in younger patients. Vinblastine alone offers comparable PFS rates but with fewer side effects, making it a strong alternative in cases where carboplatin isn't well-tolerated (41). In the six African countries included in our study, 22.1% of patients were lost to follow-up, with the percentage of patients reaching 50% in Uganda and 61.5% in Mali. These factors contribute to poor outcomes and may be due to abandonment of long treatment protocols especially when centers are far away from patient's home, or due to the absence of long-term follow-up options in many African countries (40).
In Africa, underdiagnosis and poor referral rates are major challenges for all patients but particularly brain tumor patients, and the data in our study reflect only the survival rates of patients who were diagnosed. When considering global data that that 25% of childhood cancers are pediatric brain tumors, of which 40% are LGGs, then based on a conservative age-standardized rate (ASR) for childhood cancer of 100 per million children under 15 years annually, there should be ~10 diagnoses of LGGs per million children per year. Clearly, the numbers reflected in this report are considerably lower than expected. South Africa averaged 25 diagnoses per year. In 2013 there were ~15 million children under 15 years in South Africa (42). Based on the population the South African number of diagnoses should equate to at least 240 cases of LGG annually.
In order to improve care for LGG in Africa, more resources would need to be invested into neurosurgical care with dedicated operating time for neuro-oncology, independent from trauma and infectious cases (43), and diagnostics such as MRI and pathology services. Neurosurgery services can achieve a dual purpose of achieving complete resections and obtaining tissue for pathology and potential molecular diagnostics (34, 36). The co-management of neuro-oncology patients by an organized MDT would limit referral bias, and possibly increase biopsy rates. Not only would an increase in biopsy rates promote more accurate diagnoses, but increase molecular diagnoses (44). Due to lack of data, it is not currently known whether the molecular targets reported in studies in the global north, reflect the African situation and genetics, since studies in this area are lacking. Furthermore, for non-resectable tumors, since chemotherapy rarely leads to complete remission and relapses are frequent, pediatric LGG becomes a chronic condition requiring multiple regimens at different times. It is possible that radiotherapy provided earlier in the course of the disease, especially for older children, may decrease the burden of care for families and decrease abandonment, as well as providing a shorter duration of treatment and better local control. Late effects from radiotherapy are a risk and are well described, however this strategy is particularly worth considering when there is risk to function, such as vision, or when abandonment is considered a risk (11).
Promoting comprehensive registration of neuro-oncological cases that includes clinical data would enable a more accurate assessment of the pediatric LGG burden and a more accurate evaluation of tumor characteristics compared to international reports. Development of an African pediatric oncology research platform or network would also assist in development and standardization of protocols, treatment guidelines and in publication of relevant local data to inform future studies and clinical approaches (45). Such a network should be established to foster collaboration, and improve research capacity, which may benefit not only LGG but all pediatric cancers (46). The most important is to conduct more prospective studies and collecting clinical and outcome data in real-time.
This data would in turn support effective resource planning, including chemotherapy procurement and the development of radiotherapy services (7). Such planning may be hindered by patients seeking cross-border care (47). Patients not treated in their home countries have a higher chance of abandoning treatment, contributing to poor survival outcomes (47). This is one possible reason for the higher loss-to-follow-up and death rates in South Africa and Uganda, who serve patients from neighboring countries without or limited services.
Establishing strong long-term follow-up programs and rehabilitation services could reduce patient loss to follow-up and improve daily functioning for those with oncological sequelae, ideally through an MDT approach (44, 48). This should include ophthalmology consultations for optic tract gliomas to preserve vision or prevent further vision loss.
The retrospective nature of this study contributed to limitations in data analysis and interpretation. LGG is an indolent tumor, so patients who were lost to follow-up may have lived longer than was censored in this study, creating a falsely lower EFS and OS. This may also have falsely decreased the number of patients at risk when evaluating survival curves. Events were not always dated, and some were collected retrospectively, with a potential recall bias. The majority of countries were not represented by the total number of POUs, mainly because these countries did not have established pediatric oncology programs during the study period and so this data is likely to reflects the centers with at least some resources and may not reflect the continent as a whole. All POUs from each country did not participate, therefore data are not representative of a whole country.
The use of hospital-based survival data in this study introduces potential biases compared to population-based data, due to differences in patient selection and access to health care. Our hospital-based survival data may provide a skewed view of pediatric LGG in each country that may not be generalizable to each national population or the African continent as a whole. Hospital data may represent outcomes influenced by selection, referral, and treatment biases. While hospital data is useful for evaluating specific treatments or settings, and in this study provides novel data, population-based data provide a more accurate and generalizable survival outcomes (49, 50).
Despite these limitations, the data provided from six African countries spanning low-, lower-middle- and upper-middle-income countries contribute to a greater understanding of the available resources and the resource constraints in the region. The survey respondents from 41 countries represented both the state and private sectors, and included pediatric oncologists, neurosurgeons and radiation oncologists, providing a broad perspective on the management of children with LGG across the continent. We have provided as comprehensive an overview as possible of the resources available to treat LGG based on the perspectives of clinicians working at the ground level. The findings on the numbers of patients with specific histological subtypes contribute to a better understanding of tumor characteristics in the African context and establish a base-line for future evaluations in achieving the goals set out by the WHO GICC.
Conclusion
This study highlights the significant deficits and disparities in resources, management and outcomes for pediatric LGG across six African countries. While some countries have begun to establish multidisciplinary teams for neuro-oncology, many still face limitations in surgery, radiotherapy, and chemotherapy options. The reliance on imaging for diagnosis, coupled with a lack of adequate treatment and long-term follow-up programs, pose substantial challenges in improving patient outcomes. Despite some successes, such as the high OS rates in Egypt and Tunisia, many children continue to be lost to follow-up, adversely affecting survival data. The stark contrast in resources and access to care when compared to high-income countries further emphasizes the urgent need for investment in pediatric oncology services in under-resourced settings. Strengthening neurosurgical capabilities and fostering multidisciplinary collaboration could improve diagnostic accuracy and treatment efficacy for pediatric LGG. Additionally, comprehensive data registration and resource planning are crucial to address the pediatric cancer burden in Africa. Establishing robust follow-up programs will help track patient outcomes and enhance the quality of care. Finally, creating pediatric oncology research networks could facilitate the development of standardized treatment protocols, ultimately benefiting all pediatric cancer patients across the continent and other similar resource settings globally. Addressing these issues holistically is essential to advance the care and outcomes for children with LGG in Africa.
Data availability statement
The original contributions presented in the study are included in the article/Supplementary material, further inquiries can be directed to the corresponding author.
Ethics statement
The studies involving humans were approved by the Stellenbosch University Health Research Ethics Committee (N23/03/022). The studies were conducted in accordance with the local legislation and institutional requirements. Written informed consent for participation was not required from the participants or the participants' legal guardians/next of kin in accordance with the national legislation and institutional requirements.
Author contributions
JH: Conceptualization, Data curation, Formal analysis, Methodology, Writing – original draft. TE: Conceptualization, Methodology, Writing – review & editing. EJ: Data curation, Writing – review & editing. FF: Data curation, Writing – review & editing. SR: Data curation, Writing – review & editing. IC: Data curation, Writing – review & editing. BT: Data curation, Writing – review & editing. AV: Data curation, Writing – review & editing. BN: Data curation, Writing – review & editing. KT: Data curation, Writing – review & editing. RC: Data curation, Writing – review & editing. TN: Data curation, Writing – review & editing. GN: Data curation, Writing – review & editing. JPl: Data curation, Writing – review & editing. RN: Data curation, Writing – review & editing. JB-K: Data curation, Writing – review & editing. LH: Data curation, Writing – review & editing. ZA: Data curation, Writing – review & editing. AG: Data curation, Writing – review & editing. AA: Data curation, Writing – review & editing. RH: Data curation, Writing – review & editing. HA: Data curation, Writing – review & editing. ME: Conceptualization, Data curation, Methodology, Writing – review & editing. JG: Data curation, Methodology, Writing – review & editing. JPa: Conceptualization, Supervision, Writing – review & editing, Methodology. AD: Conceptualization, Data curation, Supervision, Writing – review & editing.
Funding
The author(s) declare that no financial support was received for the research, authorship, and/or publication of this article.
Acknowledgments
The authors acknowledge the SIOP Africa Research Committee and SIOP Africa members for their support in completing this manuscript.
Conflict of interest
The authors declare that the research was conducted in the absence of any commercial or financial relationships that could be construed as a potential conflict of interest.
Generative AI statement
The author(s) declare that no Gen AI was used in the creation of this manuscript.
Publisher's note
All claims expressed in this article are solely those of the authors and do not necessarily represent those of their affiliated organizations, or those of the publisher, the editors and the reviewers. Any product that may be evaluated in this article, or claim that may be made by its manufacturer, is not guaranteed or endorsed by the publisher.
Supplementary material
The Supplementary Material for this article can be found online at: https://www.frontiersin.org/articles/10.3389/fcacs.2025.1528695/full#supplementary-material
Abbreviations
CNS, central nervous system; cPFS, crude progression-free survival; DIReC, Directory of Radiotherapy Centers; EFS, event-free survival; GICC, Global Initiative for Childhood Cancer; IQR, interquartile range; LGG, low-grade glioma; LMIC, low- and middle-income countries; MDT, multidisciplinary team; NOS, not otherwise specified; OS, overall survival; POUs, Paediatric Oncology Units; USA, United States of America; WFNS, World Federation of Neurosurgical Societies; WHO, World Health Organization.
References
1. World Health Organization. Global Initiative for Childhood Cancer: An Overview. WHO (2024). Available at: https://wwwwhoint/docs/default-source/documents/health-topics/cancer/who-childhood-cancer-overview-bookletpdf (accessed October 23, 2024).
2. World Health Organization. CureAll Framework: WHO Global Initiative for Childhood Cancer Increasing access, advancing quality, saving lives(2024). Available at: https://www.who.int/publications/m/item/global-initiative-for-childhood-cancer%20Accessed%20October%2031 https://www.who.int/publications/m/item/global-initiative-for-childhood-cancer (Accessed October 31, 2024).
3. Hessissen L, Parkes J, Amayiri N, Mushtaq N, Sirachainan N, Anacak Y, et al. SIOP PODC Adapted treatment guidelines for low grade gliomas in low and middle income settings. Pediatr Blood Cancer. (2017) 64(Suppl 5):26737. doi: 10.1002/pbc.26737
4. Sievert AJ, Fisher MJ. Pediatric low-grade gliomas. J Child Neurol. (2009) 24:1397–408. doi: 10.1177/0883073809342005
5. van Heerden J, Balagadde-Kambugu J, Angom R, Lusobya RC, Chantada G, Desjardins L, et al. Evaluating the baseline survival outcomes of the “six Global Initiative for Childhood Cancer index cancers” in Africa. Pediatr Hematol Oncol. (2022) 11:1–21. doi: 10.1080/08880018.2022.2140860
6. Bandopadhayay P, Bergthold G, London WB, Goumnerova LC, Morales LaMadrid A, Marcus KJ, et al. Long-term outcome of 4,040 children diagnosed with pediatric low-grade gliomas: an analysis of the Surveillance Epidemiology and End Results (SEER) database. Pediatr Blood Cancer. (2014) 61:1173–9. doi: 10.1002/pbc.24958
7. Fisher MJ, Jones DTW, Li Y, Guo X, Sonawane PS, Waanders AJ, et al. Integrated molecular and clinical analysis of low-grade gliomas in children with neurofibromatosis type 1 (NF1). Acta Neuropathol. (2021) 141:605–17. doi: 10.1007/s00401-021-02276-5
8. Collins KL, Pollack IF. Pediatric low-grade gliomas. Cancers. (2020) 12:1152. doi: 10.3390/cancers12051152
9. Bitterman DS, MacDonald SM, Yock TI, Tarbell NJ, Wright KD, Chi SN, et al. Revisiting the role of radiation therapy for pediatric low-grade glioma. J Clin Oncol. (2019) 37:3335–9. doi: 10.1200/JCO.19.01270
10. Cooney T, Yeo KK, Kline C, Prados M, Haas-Kogan D, Chi S, et al. Neuro-Oncology Practice Clinical Debate: targeted therapy vs conventional chemotherapy in pediatric low-grade glioma. Neurooncol Pract. (2020) 7:4–10. doi: 10.1093/nop/npz033
11. Moreira DC, Lam CG, Bhakta N, Boop FA, Chiang J, Merchant TE, et al. Tackling pediatric low-grade gliomas: a global perspective. JCO Glob Oncol. (2023) 9:e2300017. doi: 10.1200/GO.23.00017
12. Ward R, Jones HM, Witt D, Boop F, Bouffet E, Rodriguez-Galindo C, et al. Outcomes of children with low-grade gliomas in low- and middle-income countries: a systematic review. JCO Glob Oncol. (2022) 8:e2200199. doi: 10.1200/GO.22.00199
13. Steliarova-Foucher E. Cancer in children. In:Jemal A, Torre L, Soerjomataram I, Bray F, , editors. The Cancer Atlas, 3rd Edn. Atlanta, GA: American Cancer Society (2019). p. 42–3.
14. Jokonya L, Musara A, Esene I, Mduluza-Jokonya TL, Makunike-Mutasa R, Rothemeyer S, et al. Landscape, presentation, and characteristics of brain gliomas in Zimbabwe. Asian J Neurosurg. (2021) 16:294. doi: 10.4103/ajns.AJNS_404_20
15. Touati S, Djekkoun R, El-Okki MEH, Satta D. Epidemiology and survival analyses of 333 adult glioma patients from eastern Algeria (2008-2016). Afr Health Sci. (2020) 20:1250–8. doi: 10.4314/ahs.v20i3.29
16. Sabrina T, Rachid D, Luc V, Vincent R, Adel C, Nouredine A, et al. Glioma genetic susceptibility and survival analysis in the East Algerian population. Afr J Neurol Sci. (2021) 40:49–57.
17. Boudrioua A, Aloui A, Solaiman B, Asli L, Ben Salem D, Tliba S. Automatic three-dimensional detection and volume estimation of low-grade gliomas. Int J Imaging Syst Technol. (2021) 31:1678–91. doi: 10.1002/ima.22557
18. Rahima Z, Ahror B, Basel S, Douraied BS, Souhil T. Segmentation of low-grade gliomas based on the growing region and level sets techniques. In: 2018 4th Int Conf Adv Technol Signal Image Process ATSIP 2018. Monastir (2018). p. 1–5. doi: 10.1109/ATSIP.2018.8364479
19. Low grade gliomas treated at the University of Cape Town Academic Hospital complex: 2001-2017. Available at: https://open.uct.ac.za/handle/11427/33823?show=full (accessed May 3, 2022).
20. Kahl G, Davidson A, Figaji A, Pillay K, Kilborn T, Hendricks M, et al. Low grade gliomas treated at the University of Cape Town Academic Hospital complex: 2001-2017. Pediatric Blood Cancer. (2019) 66:e27989. doi: 10.1002/pbc.27989
21. Fawzy MA, El-Hemaly AI, Awad M, El Beltagy MA, Zaghloul M, Taha H, et al. Multidisciplinary treatment of pediatric low-grade glioma: experience of children cancer hospital of Egypt; 2007-2012. Indian J Med Paediatr Oncol. (2018) 39:488–92. doi: 10.4103/ijmpo.ijmpo_79_17
22. Ooi SZY, de Koning R, Egiz A, Dalle DU, Denou M, Tsopmene MRD, et al. Management and outcomes of low-grade gliomas in Africa: a scoping review. Ann Med Surg. (2022) 74:1–7. doi: 10.1016/j.amsu.2022.103246
23. Herdell V, Lassarén P, Boop FA, Bartek J Jr, Uche EO, Tisell M. Surgical outcomes of pediatric brain tumors in Sub-Saharan Africa: a systematic review. Brain Spine. (2022) 2:100912. doi: 10.1016/j.bas.2022.100912
24. Mbi Feh MKN, Lyon KA, Brahmaroutu A V, Tadipatri R, Fonkem E. The need for a central brain tumor registry in Africa: a review of central nervous system tumors in Africa from 1960 to 2017. Neurooncol Pract. (2021) 8:337–44. doi: 10.1093/nop/npaa086
25. Abdel-Wahab M, Gondhowiardjo SS, Rosa AA, Lievens Y, El-Haj N, Polo Rubio JA, et al. Global radiotherapy: current status and future directions-white paper. JCO Glob Oncol. (2021) 7:827–42. doi: 10.1200/GO.21.00029
26. World Federation of Neurosurgical Societies. World Federation of Neurosurgical Societies Member Societies. Available at: https://wfns.org/ (accessed October 5, 2024).
27. Louis DN, Ohgaki H, Wiestler OD, Cavenee WK, Ellison DW. WHO Classification of Tumours of the Central Nervous System WHO/IARC Classification of Tumours, 4th Edition Revised, Volume 1. Geneva: WHO.
28. Central Intelligence Agency USA. World Factbook, Countries: People and Societies. (2024).Available at: https://wwwciagov/the-world-factbook/ (accessed October 6, 2024).
29. Atun R, Jaffray DA, Barton MB, Bray F, Baumann M, Vikram B, et al. Expanding global access to radiotherapy. Lancet Oncol. (2015) 16:1153–86. doi: 10.1016/S1470-2045(15)00222-3
30. Elmore SNC, Polo A, Bourque JM, Pynda Y, van der Merwe D, Grover S, et al. Radiotherapy resources in Africa: an International Atomic Energy Agency update and analysis of projected needs. Lancet Oncol. (2021) 22:e391–9. doi: 10.1016/S1470-2045(21)00351-X
31. Abdel-Wahab M, Giammarile F, Carrara M, Paez D, Hricak H, Ayati N, et al. Radiotherapy and theranostics: a Lancet Oncology Commission. Lancet Oncol. (2024) 25:e545–80. doi: 10.1016/S1470-2045(24)00041-X
32. Mechita NB, Cherkaoui S, Abousselham L, Benmiloud S, Kili A, Kababri ME, et al. Implementing the WHO Global Initiative for Childhood Cancer in Morocco: Survival study for the six indexed childhood cancers. Pediatr Blood Cancer. (2022) 69:e29788. doi: 10.1002/pbc.29788
33. Bailey S, Davidson A, Parkes J, Tabori U, Figaji A, Epari S, et al. How can genomic innovations in pediatric brain tumors transform outcomes in low- and middle-income countries? JCO Glob Oncol. (2022) 8:e2200156. doi: 10.1200/GO.22.00156
34. Ryall S, Zapotocky M, Fukuoka K, Nobre L, Guerreiro Stucklin A, Bennett J, et al. Integrated molecular and clinical analysis of 1,000 pediatric low-grade gliomas. Cancer Cell. (2020) 37:569–83.e5. doi: 10.1016/j.ccell.2020.03.011
35. Girardi F, Di Carlo V, Stiller C, Gatta G, Woods RR, Visser O, et al. CONCORD Working Group. Global survival trends for brain tumors, by histology: Analysis of individual records for 67,776 children diagnosed in 61 countries during 2000-2014 (CONCORD-3). Neuro Oncol. (2023) 25:593–606. doi: 10.1093/neuonc/noac232
36. Cage TA, Samagh SP, Mueller S, Nicolaides T, Haas-Kogan D, Prados M, et al. Feasibility, safety, and indications for surgical biopsy of intrinsic brainstem tumors in children. Childs Nerv Syst. (2013) 29:1313–9. doi: 10.1007/s00381-013-2101-0
37. Davis FG, Malmer BS, Aldape K, Barnholtz-Sloan JS, Bondy LM, Brännström T, et al. Issues of diagnostic review in brain tumor studies: from the brain tumor epidemiology consortium. Cancer Epidemiol Biomarkers Prev. (2008) 17:484–9. doi: 10.1158/1055-9965.EPI-07-0725
38. Helfferich J, Nijmeijer R, Brouwer OF, Boon M, Fock A, Hoving EW, et al. Neurofibromatosis type 1 associated low grade gliomas: a comparison with sporadic low grade gliomas. Crit Rev Oncol Hematol. (2016) 104:30–41. doi: 10.1016/j.critrevonc.2016.05.008
39. Lobbous M, Bernstock JD, Coffee E, Friedman GK, Metrock LK, Chagoya G, et al. An update on neurofibromatosis type 1-associated gliomas. Cancers. (2020) 12:114. doi: 10.3390/cancers12010114
40. Gojo J, Preusser M. Improving long-term outcomes in pediatric low-grade glioma. Nat Cancer. (2024) 5:533–5. doi: 10.1038/s43018-024-00741-0
41. Lassaletta A, Zapotocky M. & Bouffet, E. Chemotherapy in pediatric low-grade gliomas (PLGG). Childs Nerv Syst. (2024) 40:3229–39. doi: 10.1007/s00381-024-06458-w
42. Statistic South Africa. Mid-year population estimates 2013. Available at: https://www.statssa.gov.za/publications/P0302/P03022013.pdf (accessed November 2, 2024).
43. Ukachukwu AK, Still MEH, Seas A, von Isenburg M, Fieggen G, Malomo AO, et al. Fulfilling the specialist neurosurgical workforce needs in Africa: a systematic review and projection toward 2030. J Neurosurg. (2022) 138:1102–13. doi: 10.3171/2022.2.JNS211984
44. Abdel-Baki MS, Hanzlik E, Kieran MW. Multidisciplinary pediatric brain tumor clinics: the key to successful treatment? CNS Oncol. (2015) 4:147–55. doi: 10.2217/cns.15.1
45. Pediatric cancer research trends and performance in Africa: A bibliometric analysis from 1991-2022 Moawia Elhassan et al. Ped Haematol Oncol J. (2024) 9:211–8. doi: 10.1016/j.phoj.2024.06.006
46. van Heerden J, Zaghloul M, Neven A, de Rojas T, Geel J, Patte C, et al. SIOP Africa. Pediatric Oncology clinical trials and collaborative research in africa: current landscape and future perspectives JCO Glob Oncol. (2020) 6:1264–75. doi: 10.1200/GO.20.00159
47. Mostert S, Arora RS, Arreola M, Bagai P, Friedrich P, Gupta S, et al. Abandonment of treatment for childhood cancer: position statement of a SIOP PODC Working Group. Lancet Oncol. (2011) 12:719–20. doi: 10.1016/S1470-2045(11)70128-0
48. Anieto EM, Madzimbe P, Potterton J, Delano P, Makupe P, Geel J, et al. Paediatric oncology physiotherapy in Africa: International Society of Paediatric Oncology (SIOP) Global Mapping Programme. Pediatr Blood Cancer. (2024) 71:e31299. doi: 10.1002/pbc.31299
49. Omonisi AE, Liu B, Parkin DM. population-based cancer registration in sub-saharan africa: its role in research and cancer control. JCO Glob Oncol. (2020) 6:1721–8. doi: 10.1200/GO.20.00294
Keywords: Africa, low-grade glioma, children, outcomes, systems, GICC
Citation: van Heerden J, Esterhuizen TM, Jbebli E, Fedhila F, Rhayem S, Chabchoub I, Togo B, Van Zyl A, Neethling B, Thomas K, Charlton R, Ngcana T, Naidu G, du Plessis J, Nyeko R, Balagadde-Kambugu J, Hessissen L, Aziz ZA, Gamal A, Ali AM, Hamdy R, Asfour HY, Elayadi M, Geel J, Parkes J and Davidson A (2025) Pediatric low-grade glioma in Africa: a baseline study before the implementation of Global Initiative for Childhood Cancer strategies. Front. Cancer Control Soc. 3:1528695. doi: 10.3389/fcacs.2025.1528695
Received: 15 November 2024; Accepted: 21 January 2025;
Published: 13 February 2025.
Edited by:
Jaime Shalkow, Cancer Center, ABC Medical Center, MexicoReviewed by:
Kristen Fessele, Memorial Sloan Kettering Cancer Center, United StatesFabio Girardi, Veneto Institute of Oncology (IRCCS), Italy
Copyright © 2025 van Heerden, Esterhuizen, Jbebli, Fedhila, Rhayem, Chabchoub, Togo, Van Zyl, Neethling, Thomas, Charlton, Ngcana, Naidu, du Plessis, Nyeko, Balagadde-Kambugu, Hessissen, Aziz, Gamal, Ali, Hamdy, Asfour, Elayadi, Geel, Parkes and Davidson. This is an open-access article distributed under the terms of the Creative Commons Attribution License (CC BY). The use, distribution or reproduction in other forums is permitted, provided the original author(s) and the copyright owner(s) are credited and that the original publication in this journal is cited, in accordance with accepted academic practice. No use, distribution or reproduction is permitted which does not comply with these terms.
*Correspondence: Jaques van Heerden, SmFxdWVzLnZhbmhlZXJkZW5AdXphLmJl
†These authors share senior authorship
‡ORCID: Jaques van Heerden orcid.org/0000-0002-4502-1169
Tonya Marianna Esterhuizen orcid.org/0000-0002-8703-1664
Anel Van Zyl orcid.org/0000-0003-3370-0874
Beverley Neethling orcid.org/0000-0002-7580-8042
Robyn Charlton orcid.org/0000-0001-5936-6654
Gita Naidu orcid.org/0000-0002-4412-3825
Jan du Plessis orcid.org/0009-0000-3535-0770
Richard Nyeko orcid.org/0000-0003-3859-349X
Joyce Balagadde-Kambugu orcid.org/0000-0003-2546-1068
Laila Hessissen orcid.org/0000-0002-3322-273X
Aya Gamal orcid.org/0009-0003-8420-1386
Rana Hamdy orcid.org/0000-0002-3476-0927
Moatasem Elayadi orcid.org/0000-0001-9791-0104
Jennifer Geel orcid.org/0000-0001-8792-3251
Jeannette Parkes orcid.org/0000-0002-7735-1111
Alan Davidson orcid.org/0000-0002-4646-4332