 Daniele Marcotulli
 Giorgia Fattorini
 Luca Bragina
 Jessica Perugini
 Fiorenzo Conti
- 1Department of Experimental and Clinical Medicine, Università Politecnica delle Marche, Ancona, Italy
- 2Center for Neurobiology of Aging, INRCA IRCCS, Ancona, Italy
Presynaptic proteins are potential therapeutic targets for epilepsy and other neurological diseases. We tested the hypothesis that chronic treatment with the SV2A ligand levetiracetam affects the expression of other presynaptic proteins. Results showed that in rat neocortex no significant difference was detected in SV2A protein levels in levetiracetam treated animals compared to controls, whereas levetiracetam post-transcriptionally decreased several vesicular proteins and increased LRRK2, without any change in mRNA levels. Analysis of SV2A interactome indicates that the presynaptic proteins regulation induced by levetiracetam reported here is mediated by this interactome, and suggests that LRRK2 plays a role in forging the pattern of effects.
Introduction
Levetiracetam (LEV), a broad-spectrum anti-epileptic drug approved by FDA in 1999, is widely prescribed for the treatment of partial and generalized epilepsy (Kaminski et al., 2012), and is attracting growing interest in the therapy of other diseases, including dyskinesia, neuropathic pain, and Alzheimer disease (Crepeau and Treiman, 2010; Sanchez et al., 2012). Lynch et al. (2004) discovered that the synaptic vesicle protein SV2A is the receptor for LEV, a finding confirmed later in SVA2A knockout mice (Garcia-Perez et al., 2015); synaptic activity and concomitant vesicular release allow LEV to enter recycling vesicles to reach SV2A and modulate transmitter release, with marked effects on rapidly discharging neurons (Meehan et al., 2011).
SV2 is a component of all vertebrate synaptic vesicles (SVs) (Lynch et al., 2004; Chang and Sudhof, 2009), where it plays a crucial role in the trafficking of synaptotagmin (SYT) 1, thereby regulating calcium-induced vesicle fusion (Xu et al., 2007). Interestingly, SV2 and SYT1 levels correlate with those of synaptogyrins (SGYRs) (Yao et al., 2010), suggesting that other SV proteins may be influenced by SV2, in agreement with the observation that SV2 proteins function as cargo in co-traffiking of SVs proteins (Yao et al., 2010).
The aim of present study was therefore to verify the hypothesis that chronic LEV treatment induces changes in the expression of SV proteins other than SV2A, in line with the emerging notion that presynaptic proteins are potential therapeutic targets for epilepsy and other neurological diseases (Li and Kavalali, 2017).
Materials and Methods
Animals and Treatment
Adult male Sprague-Dawley albino rats (170–200 g; Envigo RMS Srl, Udine, Italy) were used. Their care and handling was approved by the local ethical committee for animal research. All experimental procedures involving animals and their care were carried out in accordance with National laws and policies (D.L. n. 26, March 14, 2014) and with the guidelines established by the European Community Council Directive (2010/63/UE) and were approved by the local authority veterinary services. Animals were kept under a dark-light cycle of 12 h and permitted food and water ad libitum.
Rats were randomly divided into two groups. Animals of the first group were administered daily intraperitoneal (i.p.) injections of levetiracetam (54 mg/kg; Keppra, UCB Pharma, Braine-l’Alleud, Belgium; LEV) dissolved in physiological saline at a concentration of 10 mg/ml; those belonging to the second group received the vehicle (physiological saline; 5.4 ml/kg) i.p. (Ueda et al., 2007). All animals received i.p. injections each morning between 09:00 and 11:00; they were sacrificed on the 14th day, 2 h after having received the last i.p. injection.
Antibodies
Source, concentrations, and data on the characterization of primary and secondary antibodies used in this study are listed in Tables 1A,B.
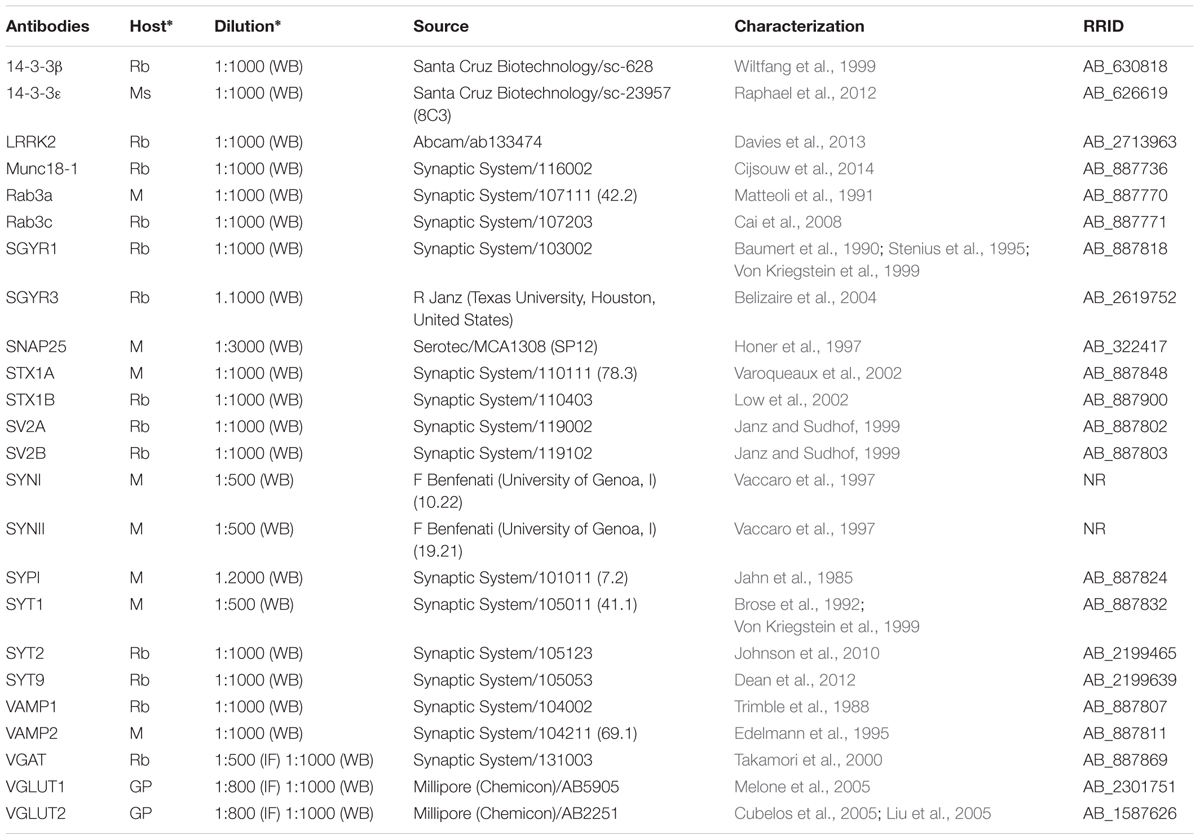
TABLE 1A. Primary antibodies.

TABLE 1B. Secondary antibodies.
Western Blotting
Levetiracetam-treated and control rats were anesthetized with chloral hydrate (300 mg/kg i.p.) and decapitated, and cerebral neocortex and hippocampus were quickly separated. Homogenization and crude synaptic plasma membrane preparation were carried out as described (Danbolt et al., 1990). Western blot experiments were carried out on supernatant of the first 1000 g centrifuge (S1), containing whole tissue protein content except crude nuclear fraction, blood and other debris (Danbolt et al., 1990; Xu et al., 2013) and on crude membrane synaptic fractions (P3) (Danbolt et al., 1990) (Figure 1). Bio-Rad Protein Assay (Bio-Rad Laboratories GmbH, Munchen, Germany) and a Beckman DU 530 spectrophotometer (Beckman Coulter, Fullerton, CA, United States) were used to determine the total amount of protein in each homogenate (3–4 measurements per homogenate). A standard curve with 2, 4, 6, 8, and 10 mg of bovine serum albumin (A4503, Sigma Chemicals, St. Louis, MO, United States) was drawn for each dosing run. As housekeeping proteins (such as α-actin and β-tubulin) are sensitive to experimental treatments (particularly to pharmacologic treatments) and to diverse physiological conditions, and have therefore some limitations as internal standards (Ferguson et al., 2005), 3–6 measurements were made for each brain region of each animal. To minimize procedural variables, homogenates from treated and control animals were loaded onto the same gel (Bragina et al., 2006). For quantitative analysis, we drew standard curves of increasing concentration of total protein from controls to define a linear range for immunoblot densitometric analysis (Bragina et al., 2006); for optimal resolution, western blotting studies were performed in crude synaptic membranes with 7 μg of total protein for each antigen, except for VGLUT2 studies in hippocampal samples and for LRRK2 in P3 of both hippocampus and neocortex, where 15 μg of total protein was used because of the poor antigen expression. Aliquots of crude membrane fraction (P3) or first centrifuge supernatant (S1) from treated and control animals were subjected to SDS-PAGE and separated proteins were electroblotted onto nitrocellulose filters using Trans-Blot TurboTM Transfer System (Bio-Rad, Hemel Hempstead, United Kingdom). To verify loading and transfer efficiency, nitrocellulose filters were visualized with 0.2% (w/v) of Ponceau S stain (Sigma, p-3504) in 3% trichloroacetic solution for 1 min; filters showing dishomogeneity were discarded (Bragina et al., 2006). Nitrocellulose filters selected were finally probed with primary antibodies at dilutions as reported in Table 1A. After exposure to appropriate secondary antibodies (Table 1B), bands were visualized by Bio-Rad Chemidoc and Quantity One software using the SuperSignal West Pico (Rockford, IL, United States) chemiluminescent substrate (Bragina et al., 2006). Quantitation of immunoreactive bands were performed using Analyze gels function of ImageJ software (v. 1.48, NIH).
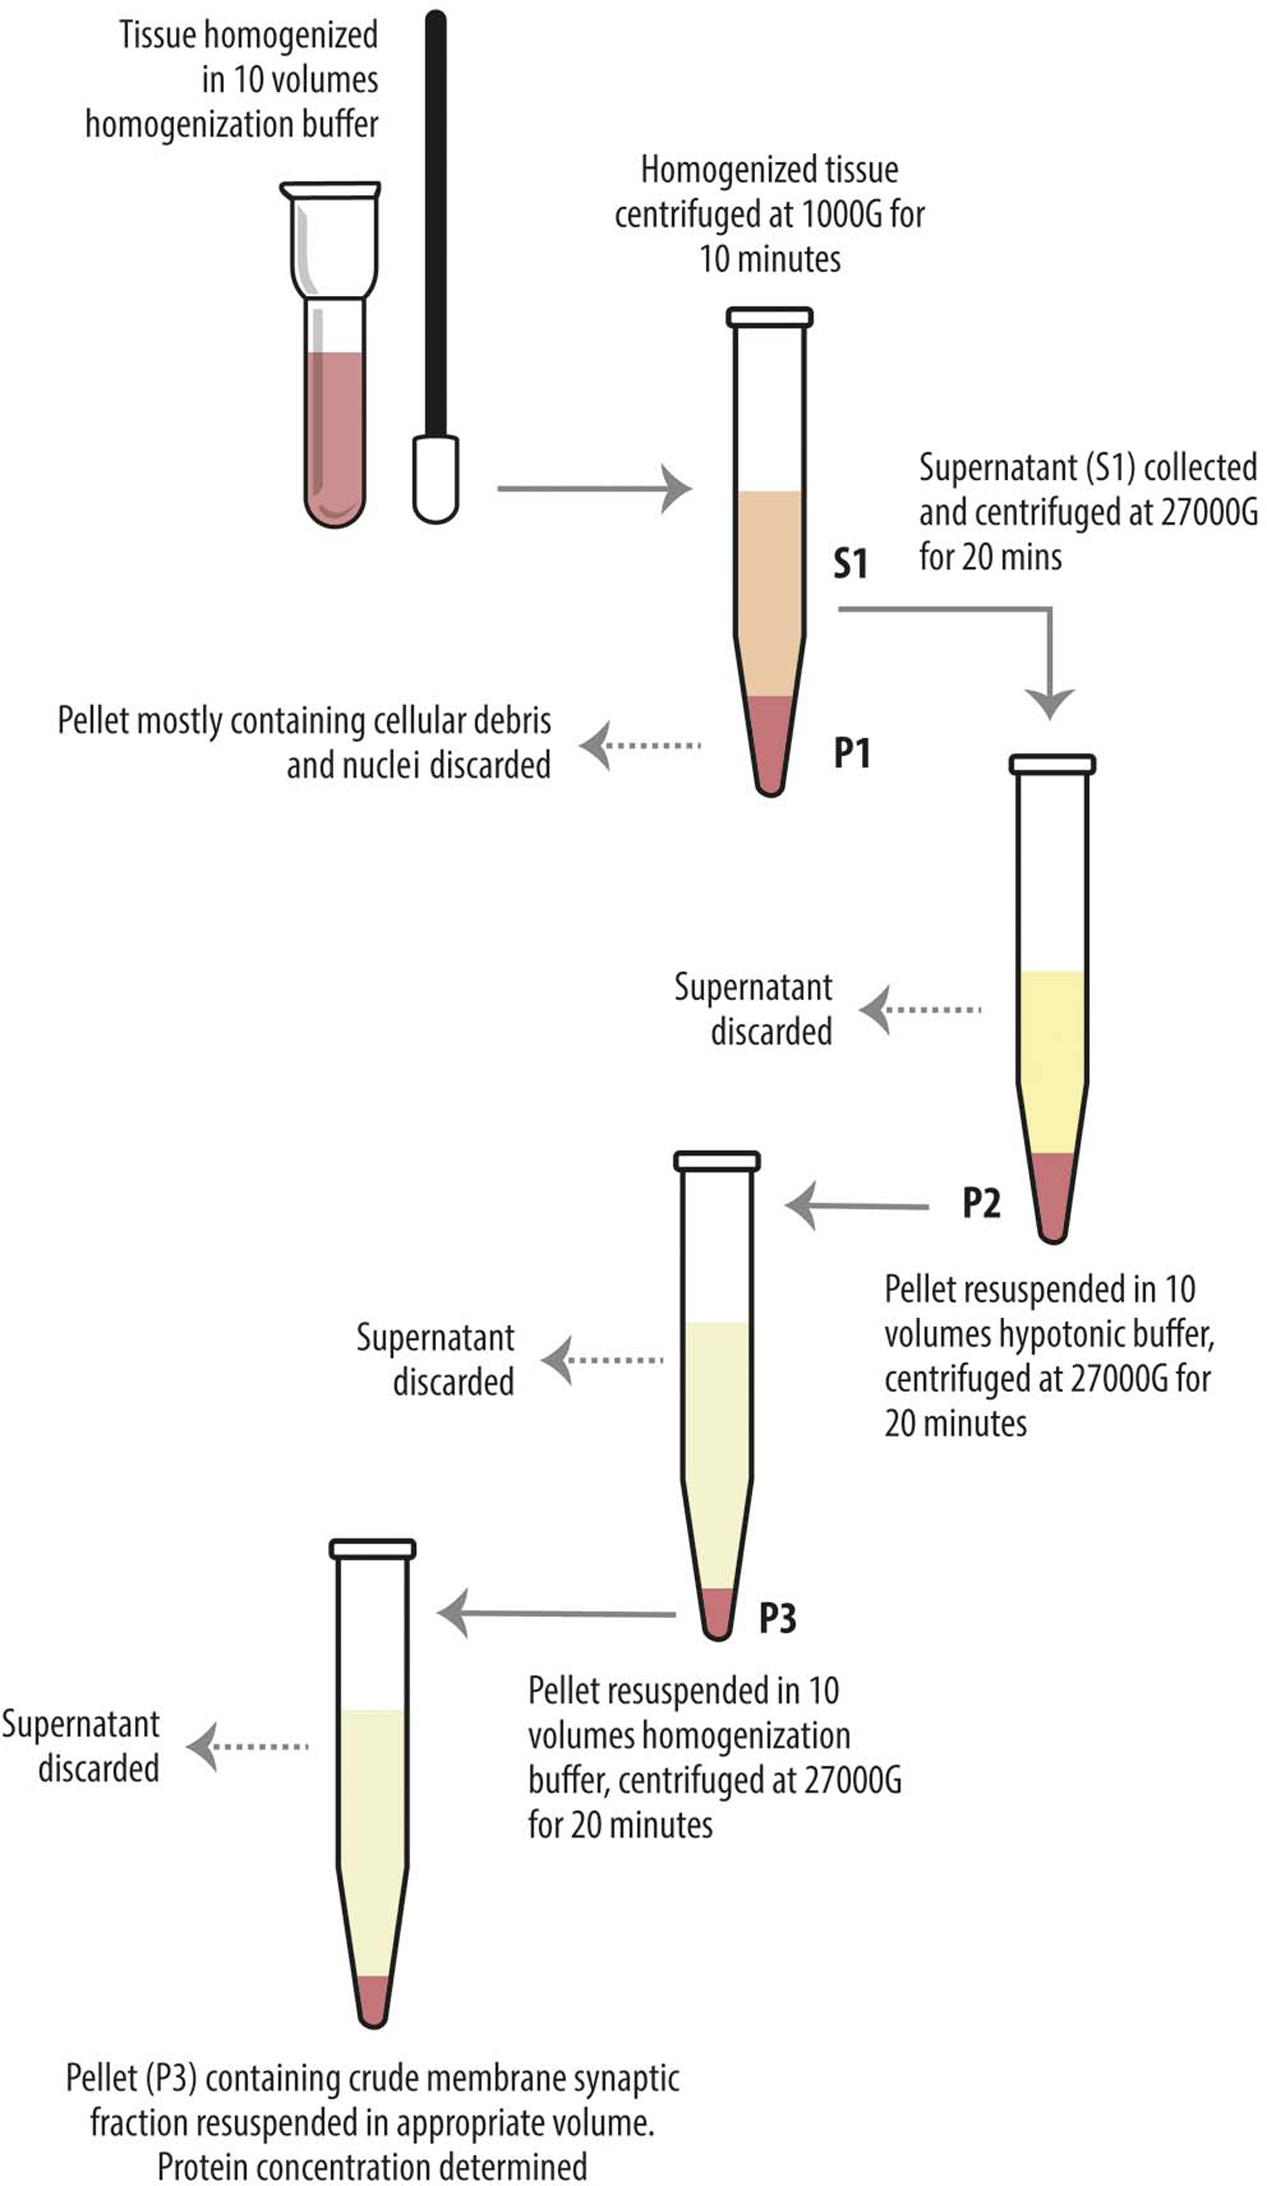
FIGURE 1. Diagram showing preparatory steps for western blotting samples (S1 and P3), according to Danbolt et al. (1990). The tissue was homogenized in about 10 volumes of homogenization buffer and centrifuged (10 min, 1000 g, 4°C). The pellets (P1) were discarded. The combined supernatants (S1) were centrifuged again (20 min, 27000 g, 4°C), and the pellets (P2) were suspended in about 10 volumes of hypotonic buffer and centrifuged (20 min, 27000 g, 4°C). The pellets (P3) were resuspended in 10 volumes of homogenization buffer in order to eliminate the hypotonic buffer and centrifuged (20 min, 27000 g, 4°C). The final pellets (P3) were resuspended in appropiate volume.
Immunofluorescence
Levetiracetam-treated and control rats were anesthetized with chloral hydrate (300 mg/kg i.p.), and perfused transcardially with a flush of saline followed by freshly depolymerized 4% paraformaldehyde (PFA) in phosphate buffered saline (PB 0.1 M). Brains were removed, post-fixed in the same fixative for 24 h at 4°C, and cut with a vibratome into 50-μm-thick sections. Sections were incubated for 1 h in normal goat serum (NGS, 10% in PB with 0.3% Triton X-100) and then for 2 h at room temperature plus overnight at 4°C in a solution containing either VGLUT1, or VGLUT2 or VGAT primary antibodies (Table 1A). The next day, sections were incubated in NGS 10% (30 min) and in appropriate secondary fluorescent antibodies (Table 1B). Sections were then mounted, air-dried and coverslipped using Vectashield mounting medium (H-1000; Vector, Burlingame, CA, United States). For all experimental series (i.e., VGLUT1, VGLUT2, and VGAT), LEV-treated and control animals sections were run in parallel to minimize the variability of experimental conditions. Labeled sections were examined using a Leica TCS-SP2 confocal laser microscope equipped with an argon (488 nm) and a helium/neon (543 nm) laser. Images from all experimental series were from the parietal cortex, and were acquired from randomly selected subfields in layers II–VI (at least four fields for layer/animal). Supplemental fields from layer IV were acquired for VGLUT2 experimental series considering its particular layer distribution (Conti et al., 2005). Layer I was not sampled because it hardly contains VGAT+ puncta (Minelli et al., 2003). Sections from LEV-treated and control animals labeled for each antigen were acquired in parallel with the same confocal parameters, in order to minimize the variability of experimental conditions. Images were acquired using a 63× oil immersion lens (numerical aperture 1.4; pinhole 1.0 and image size 512 pixels × 512 pixels, yielding a pixel size of 0.155 μm) from a plane in which the resolution of both stains was optimal and never >1.8 μm from the surface (Melone et al., 2005). To improve the signal/noise ratio, 10 frames/image were averaged. Quantitative analysis was performed in ∼1000 randomly selected subfields measuring about 25 μm × 25 μm from the 512 pixels × 512 pixels images. Images were deconvolved using Iterative Deconvolve 3D plugin1 of ImageJ software (v. 1.48, NIH) with the same parameters for all images of both LEV-treated and control group; number and size of puncta were measured with the function analyze particles of the same software. Puncta size smaller than 4 pixels were excluded from the sample.
Reverse Transcription-Polymerase Chain Reaction (RT-PCR)
Levetiracetam-treated and control rats were anesthetized with chloral hydrate (300 mg/kg i.p.) and decapitated, cerebral neocortex and hippocampus were quickly separated. Total RNA was extracted from whole hippocampus and cerebral neocortex after homogenization using TRIZOL reagent (Invitrogen, Milan, Italy), purified, digested with ribonuclease-free deoxyribonuclease and concentrated using RNeasy Micro kit (Qiagen, Milan, Italy) according to the respective manufacturer’s instructions. For determination of mRNA levels, 1 μg of RNA was reverse-transcribed with a High-Capacity cDNA RT Kit with RNase Inhibitor (Applied BioSystems, Foster City, CA, United States) in a total volume of 20 μl. Real time gene expression was analyzed in duplicate by using TaqMan Gene Expression Assays (Table 1C) and Master Mix TaqMan (Applied BioSystems, Foster City, CA, United States). Reactions were carried out in an ABI 7300 system (Applied BioSystems, Foster City, CA, United States) using 50 ng of RNA in a final reaction volume of 10 μl and the following thermal cycle protocol: initial incubation at 95°C 10 min, followed by 40 cycles of 95°C 15 s and 60°C 20 s. Technical duplicates were run for all samples and no RT and no template controls were included in all experiments. Stability comparisons of three candidate reference genes (TBP, β-actin and HPRT-1) were separately conducted for hippocampus and neocortex with the NormFinder algorithm2. The geometric mean of the most stable pair of genes was used as normalization factor for each sample. Relative mRNA expression was determined by the ΔCt method (2-ΔCt).
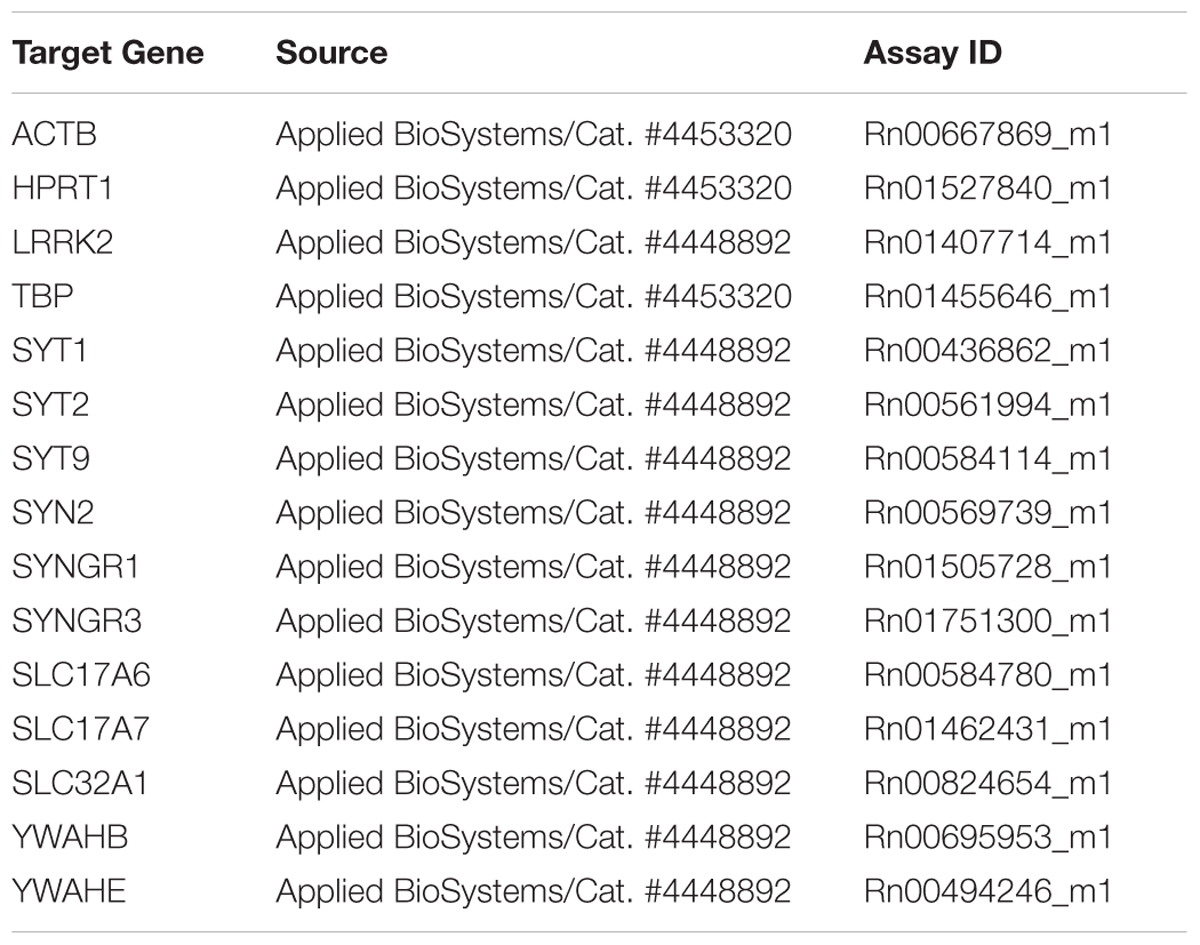
TABLE 1C. Taqman probes.
Statistical Analysis
Statistical significance was evaluated by the non-parametric Mann–Whitney U-test using the GraphPad Prism Software (v. 6.0; GraphPad Software, San Diego, CA, United States).
Network Analysis
We identified the interactions of the analyzed genes and proteins from eight databases: mentha; BioGrid; InnateDB; EBI-GOA-nonIntAct-MINT; Reactome-Fis; UniProt; BAR; InnateDB. Interactional data were merged and the interaction network was constructed using Cytoscape Software 3.4.0, redundant interactions were eliminated.
Ethics Statement
All experimental procedures involving animals and their care were carried out in accordance with National laws and policies (D.L.26, March 14, 2014), and with the European Community Council Directive guidelines (2010/63/UE); all procedures were approved by the local authority veterinary services (Università Politecnica delle Marche).
Results
We first measured the expression of vesicular proteins in neocortical crude membrane synaptic fractions (termed P3) (Figure 1) (Danbolt et al., 1990) of control and LEV-treated animals (Figures 2A,B, light blue). Quantitative analysis of independent samples showed that LEV treatment affected neither SV2A nor SV2B expression. Thus, LEV does not act by directly modifying the expression of its receptor; and its action does not induce secondary or compensatory changes in SV2A or SV2B levels. On the contrary, expression of SYTs was significantly reduced by LEV (p < 0.05); in particular, expression of SYT1, SYT2, and SYT9 was 77.10% ± 4.23%, 85.48% ± 3.22% and 79.43% ± 4.27% of controls, in the order. Significant changes following treatment were also observed for synapsin (SYN) II (73.79 ± 1.62%), SGYR1 (76.27% ± 3.68%), SGYR3 (73.92% ± 4.56%), VGLUT1 (68.81% ± 5.24%), VGLUT2 (82.60% ± 5.47%), and VGAT (77.33 ± 4.77%) (Figures 2A,B, light blue and blue). Levels of Rab3a, Rab3c, VAMP1, VAMP2, synaptophysin (SYP) I and SYNI were similar in both groups (Figures 2A,B, light blue), indicating that not all vesicular proteins considered here are altered by LEV. We also showed that in LEV-treated animals, expression of the major plasma membrane proteins participating in neurotransmitter release (i.e., STX1A, STX1B, SNAP23, SNAP25, and Munc18-1) were unchanged compared to controls (Figures 2A,B, green), an observation that highlights the central role of synaptic vesicles in LEV’s action. To verify whether LEV affected all terminals or a limited number of them, we studied the density (number of puncta/μm2) and the size (area in μm2) of VGLUT1, VGLUT2, and VGAT positive puncta, a simple and reliable method that is widely used to evaluate changes in the presynaptic compartment (Bozdagi et al., 2000; Antonova et al., 2001). The sections from LEV-treated and control animals were reacted in parallel with anti-VGLUT1, anti-VGLUT2 and anti-VGAT, and analyzed by confocal microscopy, as described earlier (Bragina et al., 2006) (Figures 3A,D,G). The results showed that their density was significantly reduced, whereas their size was unchanged compared to controls (Figures 3B,C,E,F,H,I). These studies showed that LEV does not act on all glutamatergic (either VGLUT1 or VGLUT2) or on all GABAergic terminals, in line with the observation that LEV exerts its effects only at active terminals (Meehan et al., 2011). WB analysis of the same vesicular and plasma membrane proteins was performed in hippocampal P3; results showed that LEV treatment did not affect their expression (data not shown).
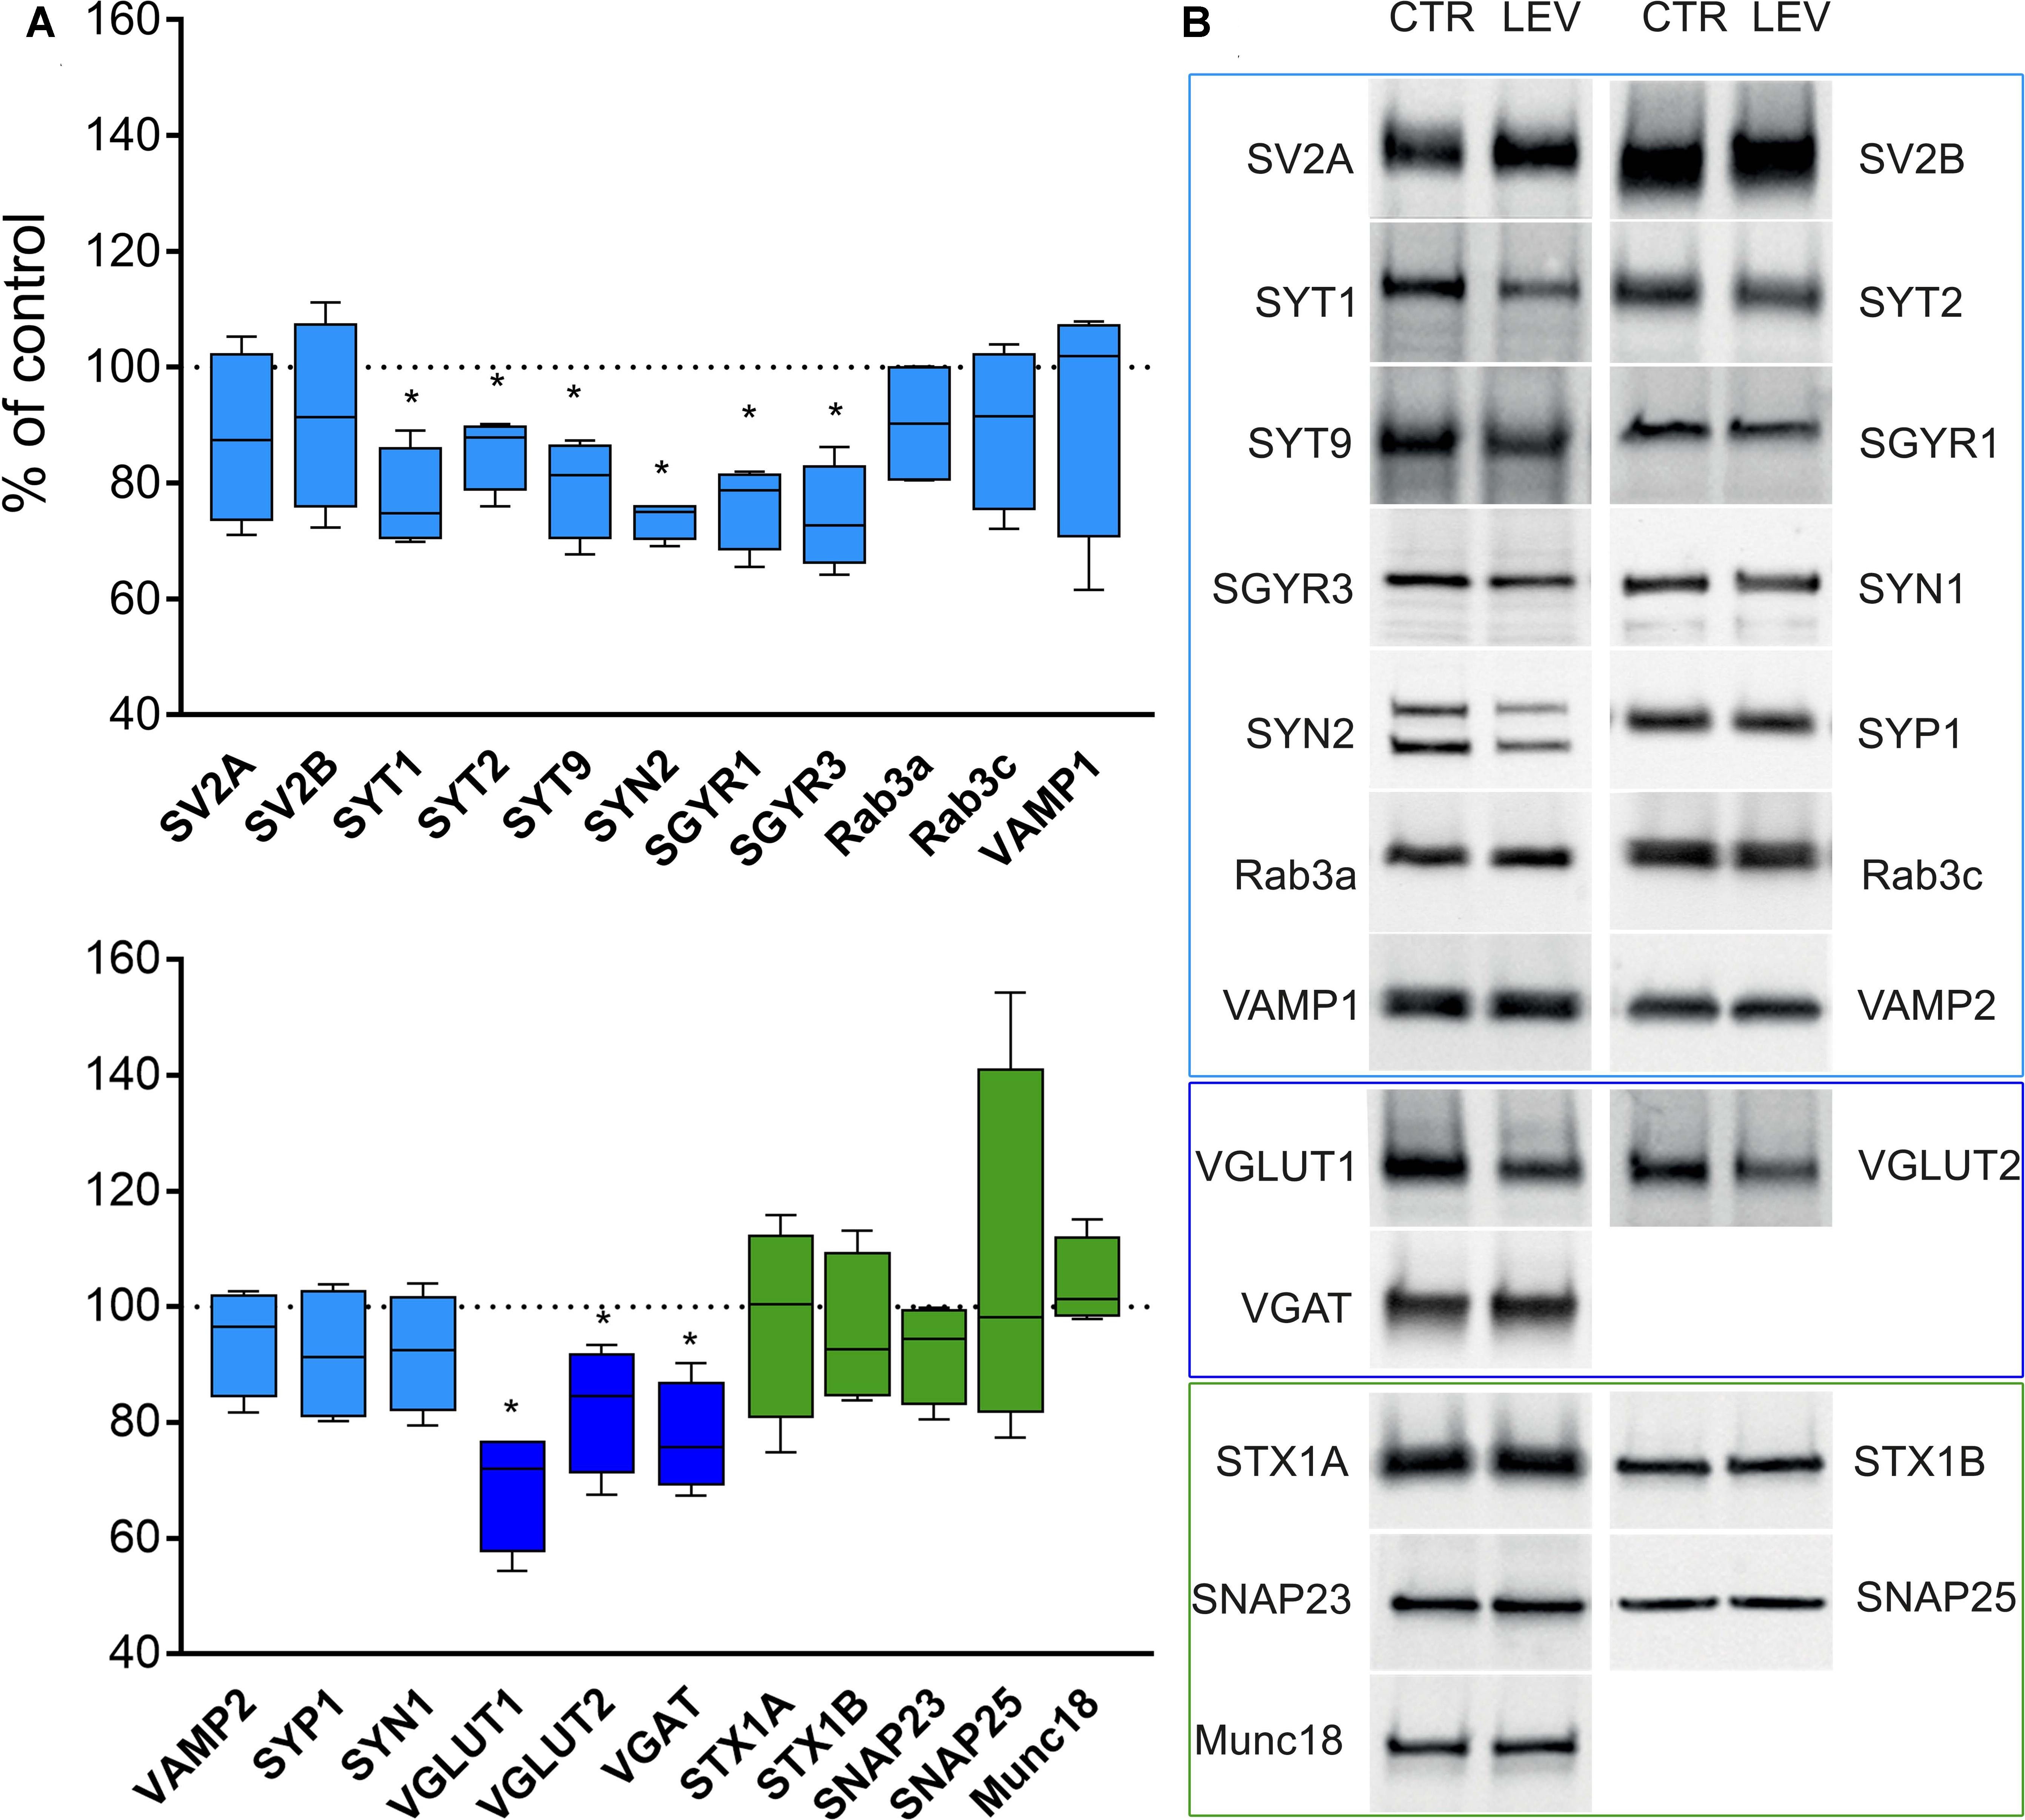
FIGURE 2. Levels of presynaptic proteins in crude synaptic membrane fraction (P3) of rat neocortex (A,B) in LEV treated animals (vesicular proteins, light blue; vesicular transporters, blue; and plasma membrane proteins, green). Values (mean ± SEM) are expressed as percentage of controls (dotted lines). ∗P < 0.05 (Mann–Whitney); n = 4 to 8 LEV, n = 4 to 8 CTR.
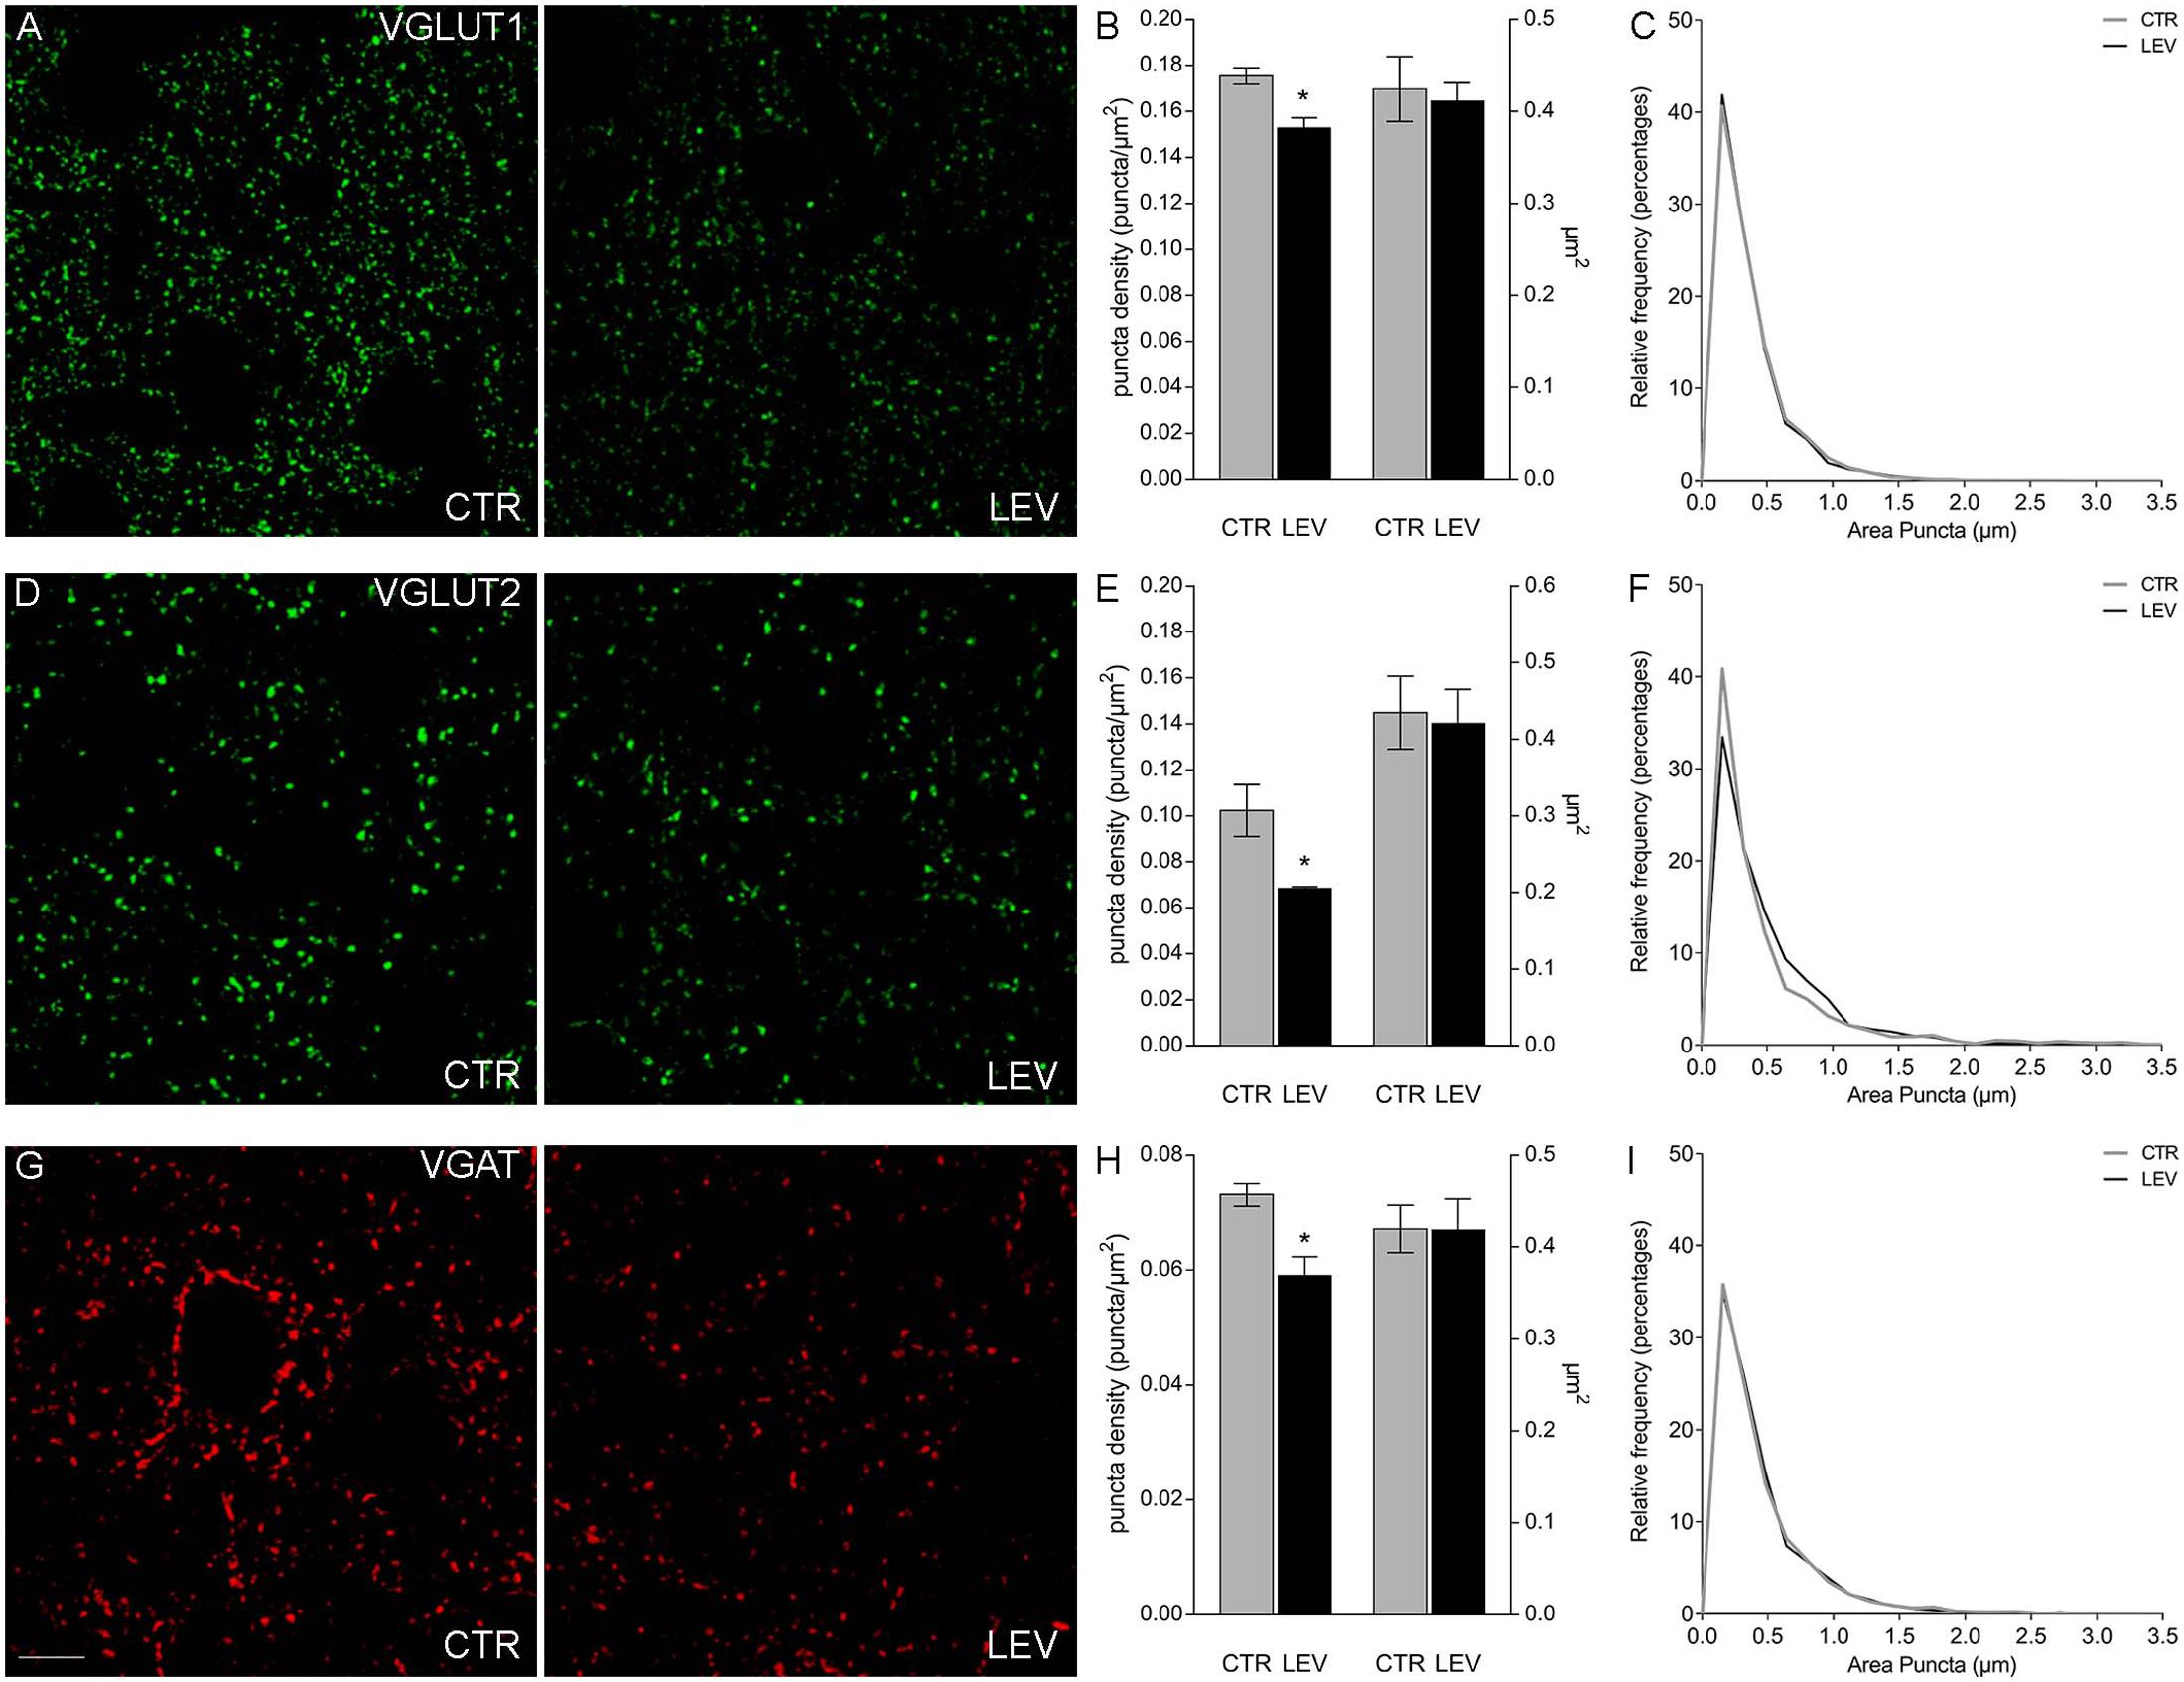
FIGURE 3. Confocal analysis of VGLUT1+ (A), VGLUT2+ (D), and VGAT+ (G) puncta in sections of rat cerebral cortex in LEV-treated (LEV; n = 4) and control animals (CTR; n = 4). Scale bar 10 μm. (B,E,H) Density (puncta/μm2; left axis) and mean size (μm2; right axis) of VGLUT1+ puncta of LEV (black) and control animals (gray). ∗P < 0.05 (Mann–Whitney). Density of VGLUT1, VGLUT2, and VGAT+ puncta were significantly reduced to 87.05% ± 2.58%, 66.83% ± 0.82%, and 80.78% ± 4.45% compared to controls in the order. ∗P < 0.05 (Mann–Whitney). (C,F,I) Since the average value can still hide differences in the distribution of positive puncta size (μm2), we compared the frequency distributions of VGLUT1+ (C), VGLUT2+ (F), and VGAT+ (I) puncta size of the control animal showing the highest puncta density (black) with the ones of the LEV-treated animal showing the lowest puncta density (gray), in order to maximize the possible effects produced by LEV.
Next, we asked whether LEV effects depended on transcriptional, translational or post-translational mechanisms. We therefore measured mRNA levels for LEV-regulated proteins, and analyzed WB of the same proteins in whole cellular proteins content devoid of nuclear fractions (termed S1) (Danbolt et al., 1990; Xu et al., 2013). In both neocortex and hippocampus of LEV-treated animals, mRNAs levels (Figures 4A,C) and S1 proteins expression (Figures 4B,D) were similar in the experimental and control groups, suggesting that LEV-induced changes are in all likelihood due to synaptic terminal-specific post-transcriptional mechanisms.
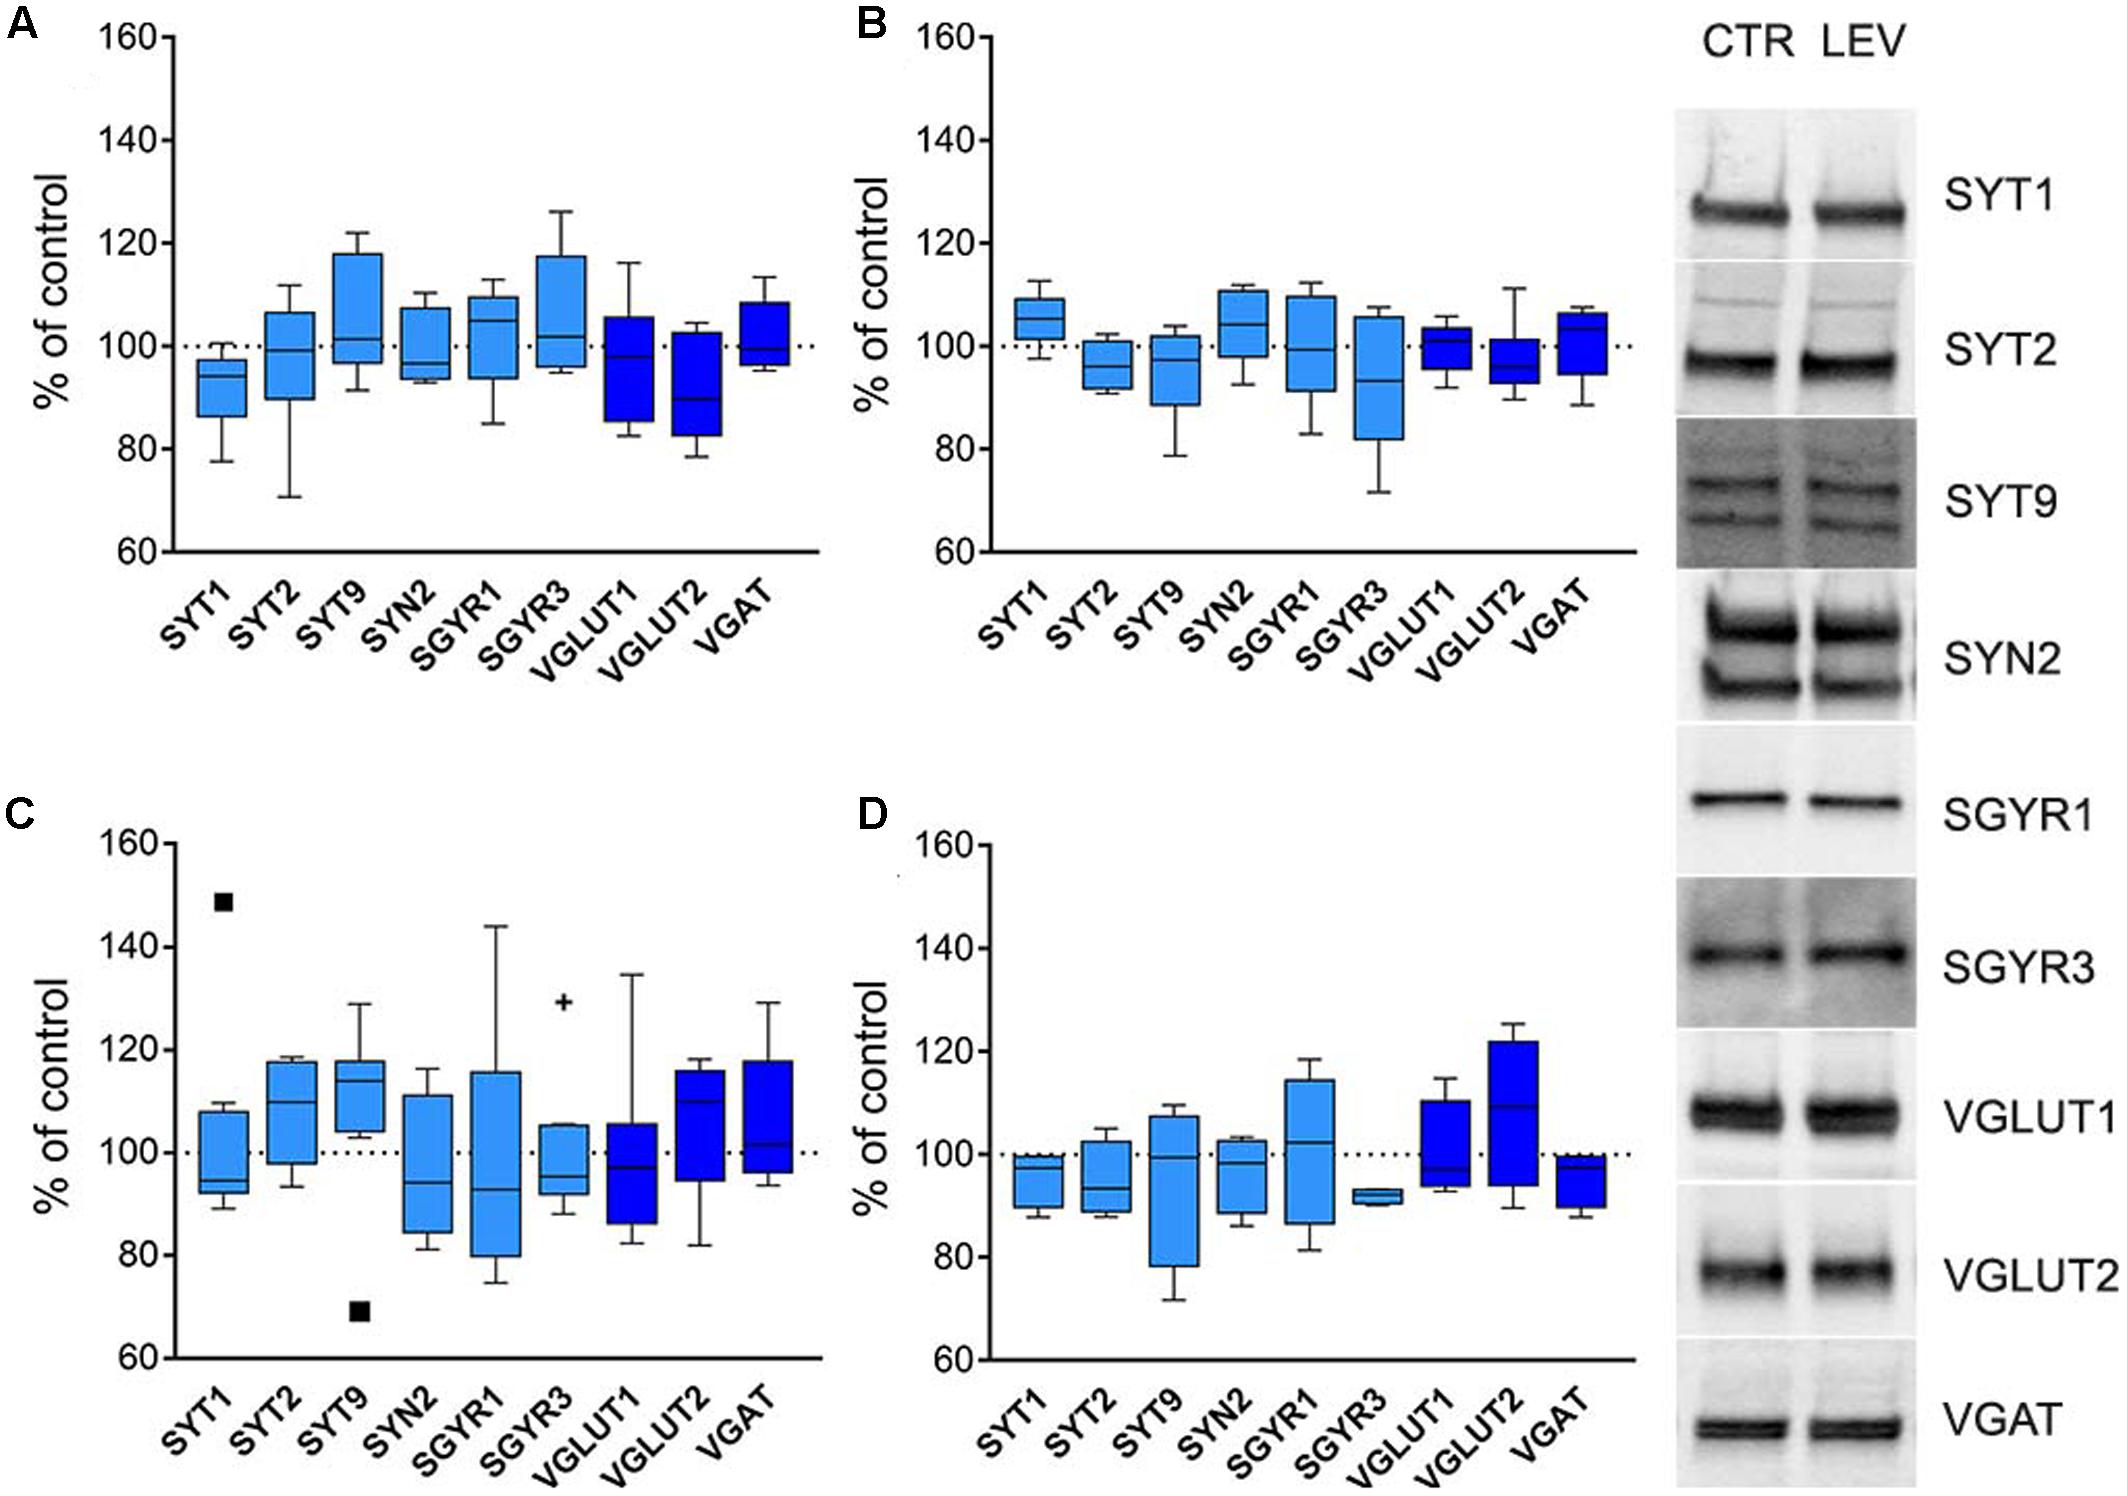
FIGURE 4. (A,C) Levels of mRNA coding for LEV-regulated proteins in rat neocortex (A) and hippocampus (C) of LEV treated animals (vesicular proteins, light blue; vesicular transporters, blue). Values (mean ± SEM) are expressed as percentage of controls (dotted lines). ∗P < 0.05 (Mann–Whitney); n = 8 LEV, n = 8 CTR. (B,D) Levels of LEV-regulated proteins in total proteins fraction (S1; excluding nuclei and debris) of rat neocortex (B) and hippocampus (D) of LEV-treated animals (vesicular proteins, light blue; vesicular transporters, blue). Values (mean ± SEM) are expressed as percentage of controls (dotted lines). Symbols in (C) identify outliers values. ∗P < 0.05 (Mann–Whitney); n = 4 to 8 LEV, n = 4 to 8 CTR.
To gain a deeper insight into LEV effects, we constructed a network of protein–protein interactions querying for the studied proteins. The analysis of the resulting network (Figure 5A) identified LRRK2 (leucine-rich repeat kinase 2, a large multidomain protein that includes a central catalytic tridomain with GTPase and kinase activities surrounded by a series of potential protein-protein interaction domains; Martin et al., 2014), 14-3-3β and 14-3-3𝜀 (14-3-3s are soluble proteins abundantly expressed in brain and involved in signal transduction, apoptotic, checkpoint control, and nutrient-sensing pathways by altering the subcellular localization of numerous binding partners; Aghazadeh and Papadopoulos, 2016) as SV2A interactors potentially capable of contributing to LEV effects. Therefore, we used RT-PCR and WB analysis to study mRNA and protein levels in neocortex. Results showed that mRNA levels coding for LRRK2 and 14-3-3s were not modified by LEV treatment (Figure 5B). WB studies showed that 14-3-3β and 𝜀 levels were not changed in S1 and P3 samples; and that LRRK2 protein levels were upregulated by LEV (up to 130.08 ± 9.35) in S1 but not in P3 samples, in line with its cellular localization (Martin et al., 2014) (Figure 5B,D). These findings indicate that LRRK2 up-regulation is mediated by a post-transcriptional mechanism. None of the mRNAs and proteins studied were modified by LEV in hippocampus, confirming the drug’s region-specific effect (Figure 5C). Finally, on a network re-analysis which included LRRK2 and 14-3-3s, we observed that LRRK2 never clustered with LEV-regulated proteins, while it strikingly clustered with most non-regulated presynaptic proteins, suggesting that LRRK2 plays a crucial role in defining the pattern of LEV effects (Figure 5E).
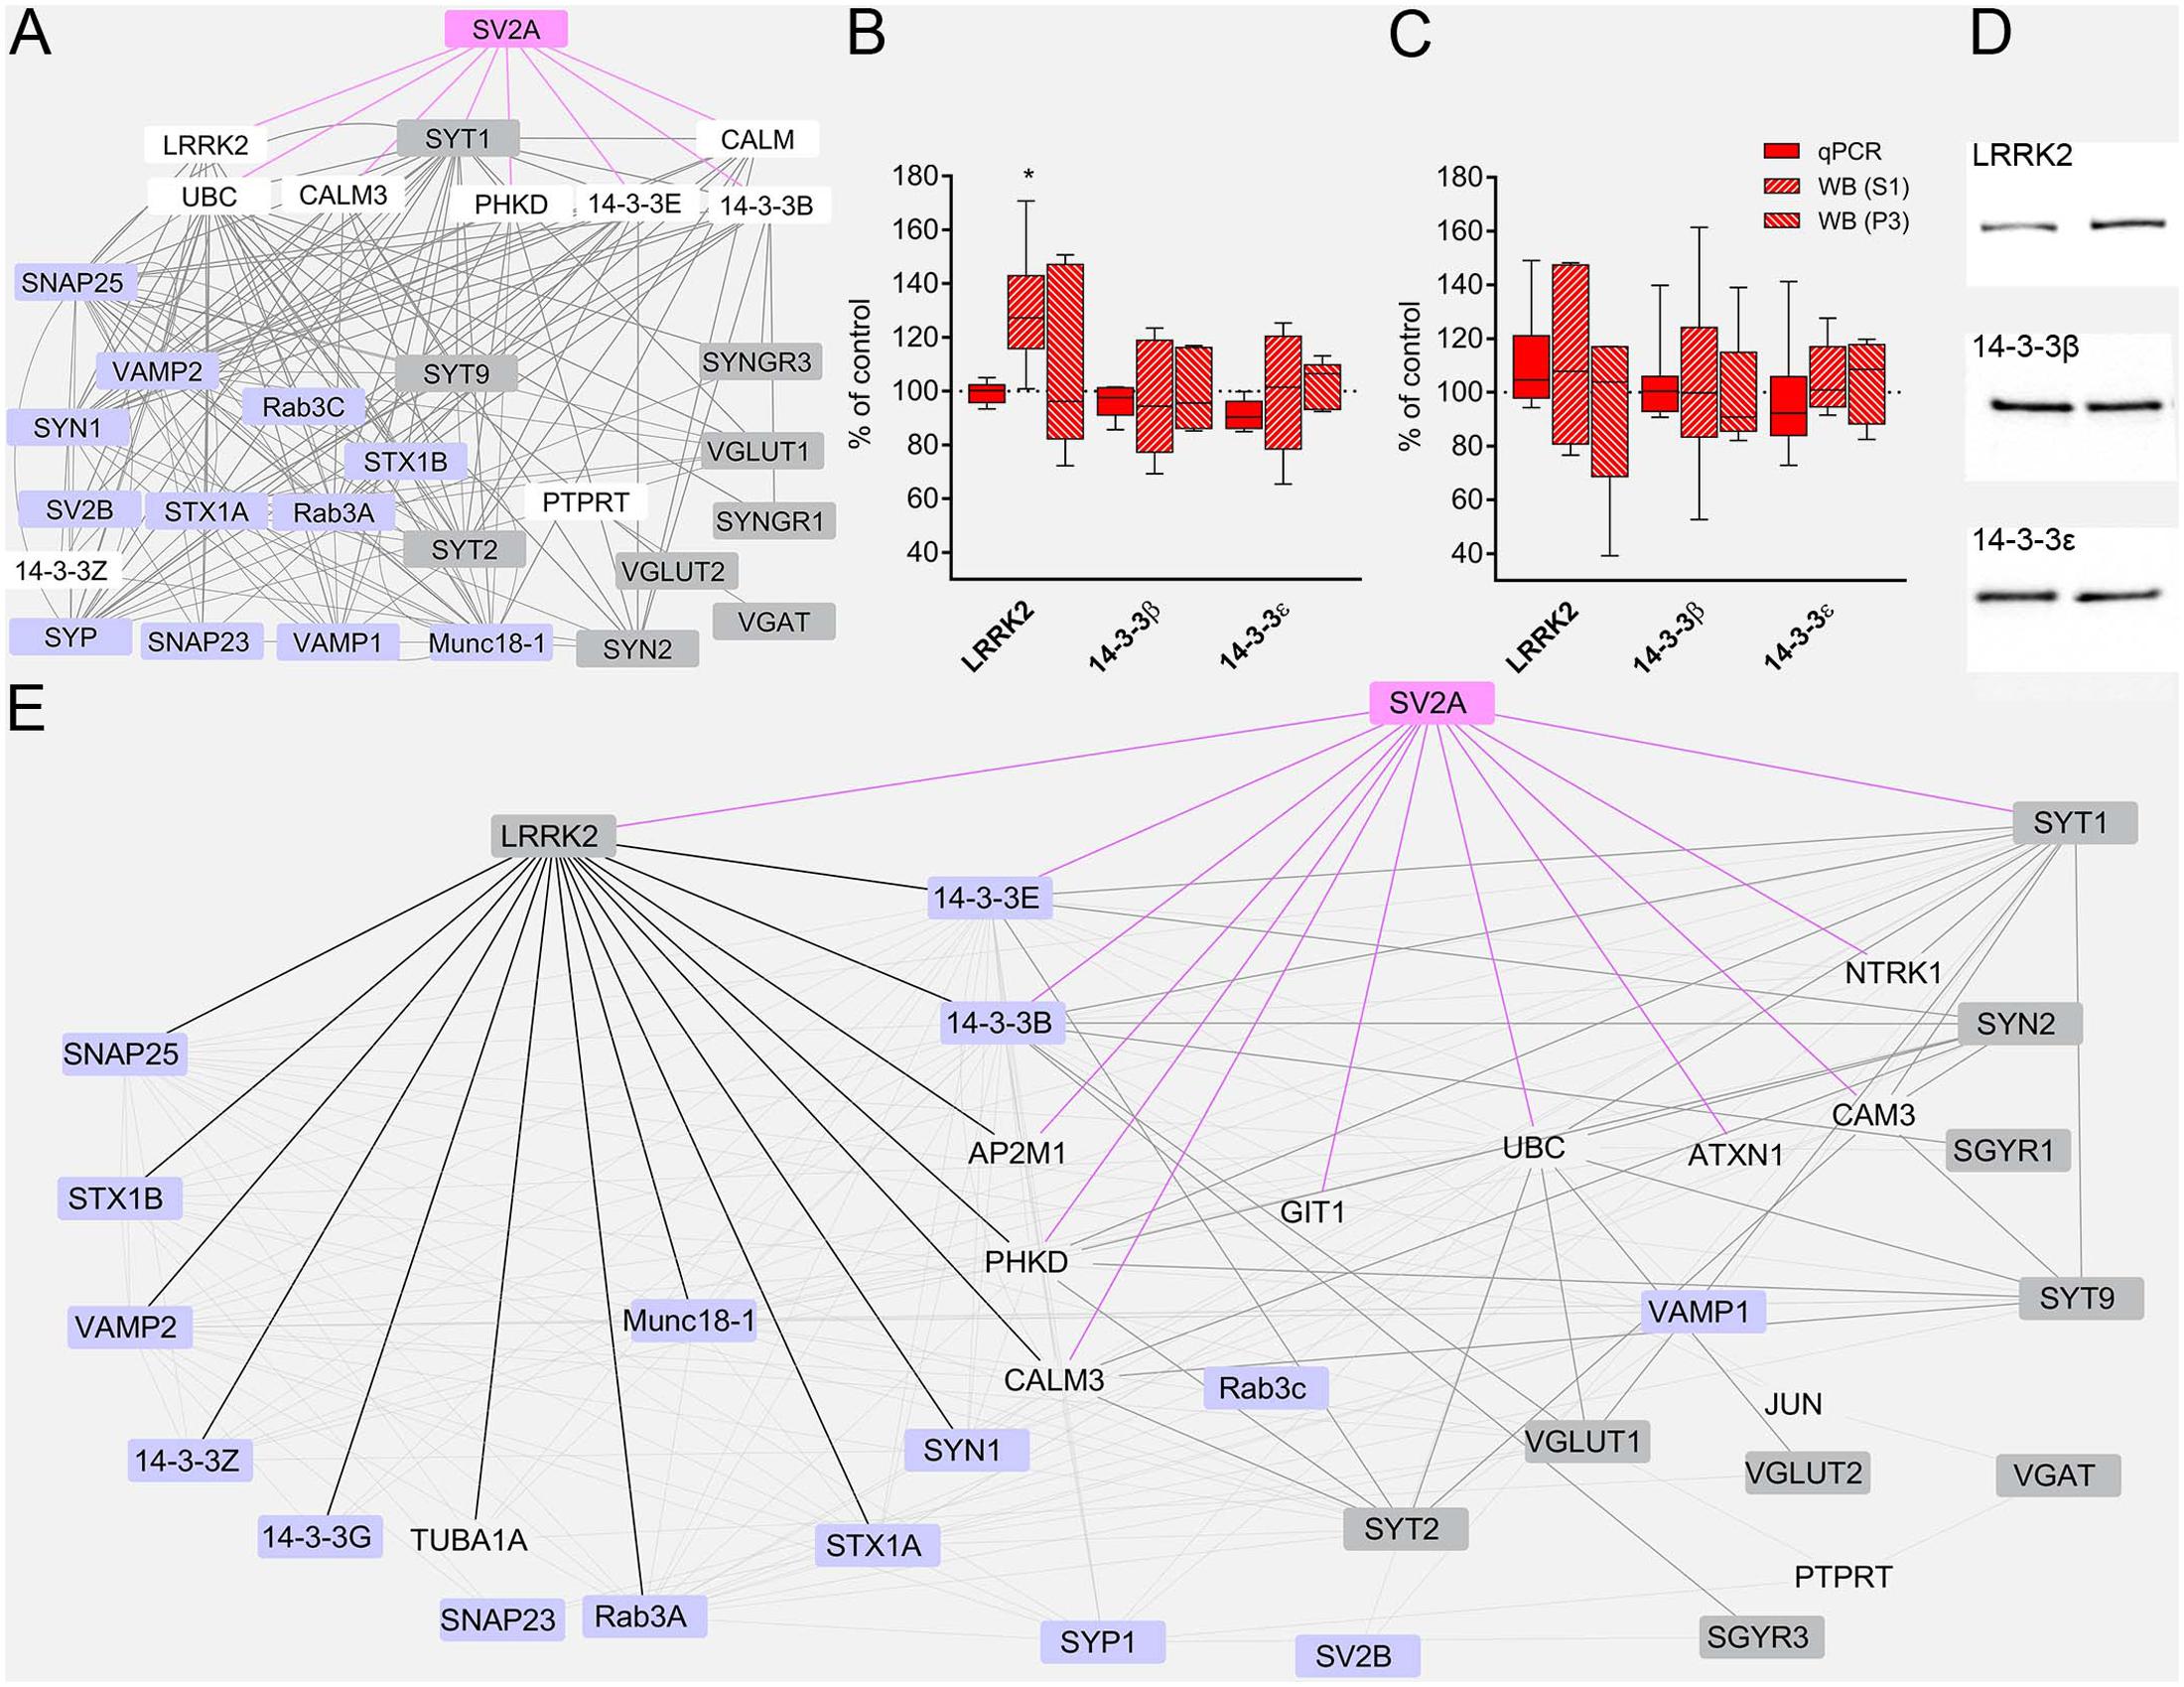
FIGURE 5. (A) The network of interactions of the presynaptic proteins investigated in the present study modeled from eight protein-protein interaction (PPI) databases. Nodes considered to be not relevant to our analysis or redundant are not shown. Regulated proteins, gray nodes; unregulated proteins, violet nodes; proteins not studied, white nodes; SV2A node and edges, pink. (B,C) RT-PCR of LRRK2 and 14-3-3s in rat neocortex (B) and hippocampus (C) of LEV treated animals. Levels of LRRK2 and 14-3-3s proteins in S1 samples of rat neocortex (B,D) and hippocampus (C) in LEV treated animals. Western blot showing levels of LRRK2 and 14-3-3s in P3 samples of rat neocortex (B) and hippocampus (C) in LEV treated animals. Values (mean ± SEM) are expressed as percentage of controls (dotted lines). ∗P < 0.05 (Mann–Whitney); n = 4 to 8 LEV, n = 4 to 8 CTR. (E) Network of analyzed PPI, querying for all proteins, including LRRK2, 14-3-3𝜀 and 14-3-3β. Nodes considered to be not relevant to our analysis or redundant are not shown. Regulated proteins, gray nodes; unregulated proteins, violet nodes; proteins not studied, transparent nodes; SV2A node and edges, pink; LRRK2 edges, black; modified proteins links to and from SV2A first degree interactors, thick gray edges.
Discussion
VGAT and the vast majority of VGLUT1 and VGLUT2 are expressed in axon terminals (e.g., Chaudhry et al., 1998; Kaneko et al., 2002; Minelli et al., 2003). However, VGLUT1 and VGLUT2 have also been described in some astrocytic processes (Bezzi et al., 2004; Montana et al., 2006; Ormel et al., 2012), and an astrocytic localization of most of the presynaptic proteins investigated here, including SV2, has also been described, albeit mostly in vitro (Montana et al., 2006), thus raising the possibility that a small part of the reported effects may be ascribed to astrocytes. In this context, it is worth noting that in Sanz-Blasco et al. (2016) reported that in astrocytic cultures LEV inhibits oligomeric Aβ-induced vesicular glutamate release. Accordingly, these data are compatible with the view that, perhaps, a minor part of the changes in presynaptic proteins induced by LEV may occur also in astrocytes.
All available evidence to date indicates that the synaptic vesicle protein SV2A is the only receptor for LEV (Lynch et al., 2004). On this basis, the results reported here indicate that LEV binding to SV2A down-regulates the expression of several SVs proteins in neocortex through a post-transcriptional mechanism, conceivably based on a protein-protein interaction network, in line with the reported LEV-induced reduction of release probability and quantal size (Wilson et al., 2005; Meehan et al., 2011; Li and Kavalali, 2017). The observations that SV2A is a regulator of SYT1 and SGYR1 levels (Yao et al., 2010); that modulation of presynaptic proteins results in reduced synaptic activity and release probability (Wilson et al., 2005; Meehan et al., 2011; Li and Kavalali, 2017); that deletion of SYNs, which are co-regulated with SV2A, abolishes LEV effectiveness (Boido et al., 2010); and that LEV is effective in epilepsy caused by Munc18-1 mutations (Dilena et al., 2016) are consistent with the present findings. In addition, we demonstrated that LEV affects neocortical but not hippocampal synapses. Considering that LEV action is activity-dependent, it is conceivable that its different effects in neocortex and hippocampus reflects their different pattern of activity (Ito et al., 2014), even though the different pattern of SV2A expression and function may also account for this selectivity (Venkatesan et al., 2012). Moreover, given that changes in the size of vesicular transporters positive puncta reflect the amount of protein expressed in terminals, while changes in density reflect the non-ubiquious action in all terninals, these studies are in line with the notion that LEV exerts its effects only at active terminals. Finally, we showed that LEV binding to SV2A up-regulates LRRK2, a proteostasis regulator (Martin et al., 2014), which is linked to most of the unregulated proteins of presynaptic interactome.
We used a dosing schedule that simulates chronic treatment in humans (Ueda et al., 2007). Considering the half-life of the studied proteins (Cohen et al., 2013), it is reasonable that the changes in protein levels require few days to take place. This could explain why LEV is not effective as a single-dose treatment in status epilepticus (Navarro et al., 2016).
The presynaptic protein-protein interaction network pointed out the centrality of 14-3-3β and 14-3-3𝜀 and LRRK2 in SV2A interactome. 14-3-3s are known to interact with multiple target proteins thereby interfering with protein folding and homeostasis (Aghazadeh and Papadopoulos, 2016). LRRK2 controls synaptic proteins levels by modulating autophagic proteins degradation, promoting translation (Martin et al., 2014), and accelerating endocytosis with regional and neuronal specificity (i.e., in GABAergic striatal neurons and not glutamatergic hippocampal neurons; Maas et al., 2017). Increased neocortical LRRK2, by regulating levels of LRRK2-linked proteins, may maintain normal concentrations of those proteins and, thus, may contribute to the pattern of LEV-induced regulations.
Levetiracetam-induced vesicular proteins down-regulation reported here may reduce synaptic strength of hyperactive terminals (Wilson et al., 2005; Xu et al., 2007; Meehan et al., 2011), thus preventing the probability of establishing epileptogenic circuits (Avramescu and Timofeev, 2008) and accounting for LEV neuroprotective effects (Löscher et al., 2016). Presynaptic proteins dysregulation is increasingly recognized in epilepsy (Li and Kavalali, 2017). Their differential involvement in the downstream mechanism of LEV effects may account for different responses to the drug administration in patients. In this context, it is worth noting that LEV reduces seizures in Munc18-1-related epileptic encephalopathy, which is refractory to other antiepileptic drugs (Dilena et al., 2016). According to our findings, this effect may depend on the fact that Munc18-1 is not among the proteins modulated by the interaction between LEV and SV2A. Therefore, LEV may conceivably be a therapeutic tool for those patients with mutations of presynaptic proteins not regulated by LEV that determine epileptic syndromes.
Furthermore, reduction of synaptic strength by SVs proteins down-regulation induced by LEV may also protect against abnormal and hypersynchronous brain activity (Bakker et al., 2012; Sanchez et al., 2012; Devi and Ohno, 2013; Shi et al., 2013; Nygaard et al., 2015), an early marker and a progression factor of Alzheimer’s disease (Bezzina et al., 2015). Moreover, Baker et al. (2015) describe a human condition with dyskinetic movement disorder, severe motor delay and profound cognitive impairment associated with a rare variant in SYT1. In addition, in a senescence-accelerated prone mouse 8 (SAMP8), Chen et al. (2007) demonstrated a positive correlation between SYT1 level and age-related cognitive impairment. Finally, Ohrfelt et al. (2016) demonstrate that, in cerebrospinal fluid, SYT1 levels are significantly higher in patients with dementia or mild cognitive impairment due to Alzheimer’s disease compared to controls. On these bases, it is conceivable to extend LEV treatment also in age-related cognitive impairment and in Alzheimer’s disease.
Conclusion
The presynaptic proteins regulation induced by LEV reported here claims that not only SV2A, but the interactions between presynaptic proteins downstream of SV2A, actually mediate LEV effects; and that LRRK2 plays a role in forging the underlying pattern of molecular changes.
Author Contributions
GF and DM conceived the project. GF, DM, JP, and LB performed the experiments, and gathered and analyzed the data. FC supervised the project, and discussed the data. GF, DM, and FC wrote the paper.
Funding
This work was made possible by grants provided by Ministero dell’Istruzione, dell’Università e della Ricerca (PRIN grant 2010JFYFY2) to FC, and by Università Politecnica delle Marche to GF and FC.
Conflict of Interest Statement
The authors declare that the research was conducted in the absence of any commercial or financial relationships that could be construed as a potential conflict of interest.
Acknowledgments
The authors thank Dr. Fabio Benfenati (University of Genoa, and IIT) for carefully reading an earlier version of this paper and for helpful advices, and Dr. Luigi Ferrante for help with statistical analysis.
Footnotes
References
Aghazadeh, Y., and Papadopoulos, V. (2016). The role of the 14-3-3 protein family in health, disease, and drug development. Drug Discov. Today 21, 278–287. doi: 10.1016/j.drudis.2015.09.012
Antonova, I., Arancio, O., Trillat, A. C., Wang, H. G., Zablow, L., Udo, H., et al. (2001). Rapid increase in clusters of presynaptic proteins at onset of long-lasting potentiation. Science 294, 1547–1550. doi: 10.1126/science.1066273
Avramescu, S., and Timofeev, I. (2008). Synaptic strength modulation after cortical trauma: a role in epileptogenesis. J. Neurosci. 28, 6760–6772. doi: 10.1523/JNEUROSCI.0643-08.2008
Baker, K., Gordon, S. L., Grozeva, D., Van Kogelenberg, M., Roberts, N. Y., Pike, M., et al. (2015). Identification of a human synaptotagmin-1 mutation that perturbs synaptic vesicle cycling. J. Clin. Invest. 125, 1670–1678. doi: 10.1172/JCI79765
Bakker, A., Krauss, G. L., Albert, M. S., Speck, C. L., Jones, L. R., Stark, C. E., et al. (2012). Reduction of hippocampal hyperactivity improves cognition in amnestic mild cognitive impairment. Neuron 74, 467–474. doi: 10.1016/j.neuron.2012.03.023
Baumert, M., Takei, K., Hartinger, J., Burger, P. M., Fischer Von Mollard, G., Maycox, P. R., et al. (1990). P29: a novel tyrosine-phosphorylated membrane protein present in small clear vesicles of neurons and endocrine cells. J. Cell Biol. 110, 1285–1294. doi: 10.1083/jcb.110.4.1285
Belizaire, R., Komanduri, C., Wooten, K., Chen, M., Thaller, C., and Janz, R. (2004). Characterization of synaptogyrin 3 as a new synaptic vesicle protein. J. Comp. Neurol. 470, 266–281. doi: 10.1002/cne.20008
Bezzi, P., Gundersen, V., Galbete, J. L., Seifert, G., Steinhauser, C., Pilati, E., et al. (2004). Astrocytes contain a vesicular compartment that is competent for regulated exocytosis of glutamate. Nat. Neurosci. 7, 613–620. doi: 10.1038/nn1246
Bezzina, C., Verret, L., Juan, C., Remaud, J., Halley, H., Rampon, C., et al. (2015). Early onset of hypersynchronous network activity and expression of a marker of chronic seizures in the Tg2576 mouse model of Alzheimer’s disease. PLOS ONE 10:e0119910. doi: 10.1371/journal.pone.0119910
Boido, D., Farisello, P., Cesca, F., Ferrea, E., Valtorta, F., Benfenati, F., et al. (2010). Cortico-hippocampal hyperexcitability in synapsin I/II/III knockout mice: age-dependency and response to the antiepileptic drug levetiracetam. Neuroscience 171, 268–283. doi: 10.1016/j.neuroscience.2010.08.046
Bozdagi, O., Shan, W., Tanaka, H., Benson, D. L., and Huntley, G. W. (2000). Increasing numbers of synaptic puncta during late-phase LTP: N-cadherin is synthesized, recruited to synaptic sites, and required for potentiation. Neuron 28, 245–259. doi: 10.1016/S0896-6273(00)00100-8
Bragina, L., Melone, M., Fattorini, G., Torres-Ramos, M., Vallejo-Illarramendi, A., Matute, C., et al. (2006). GLT-1 down-regulation induced by clozapine in rat frontal cortex is associated with synaptophysin up-regulation. J. Neurochem. 99, 134–141. doi: 10.1111/j.1471-4159.2006.04030.x
Brose, N., Petrenko, A. G., Sudhof, T. C., and Jahn, R. (1992). Synaptotagmin: a calcium sensor on the synaptic vesicle surface. Science 256, 1021–1025. doi: 10.1126/science.1589771
Cai, H., Reim, K., Varoqueaux, F., Tapechum, S., Hill, K., Sorensen, J. B., et al. (2008). Complexin II plays a positive role in Ca2+-triggered exocytosis by facilitating vesicle priming. Proc. Natl. Acad. Sci. U.S.A. 105, 19538–19543. doi: 10.1073/pnas.0810232105
Chang, W. P., and Sudhof, T. C. (2009). SV2 renders primed synaptic vesicles competent for Ca2+ -induced exocytosis. J. Neurosci. 29, 883–897. doi: 10.1523/JNEUROSCI.4521-08.2009
Chaudhry, F. A., Reimer, R. J., Bellocchio, E. E., Danbolt, N. C., Osen, K. K., Edwards, R. H., et al. (1998). The vesicular GABA transporter, VGAT, localizes to synaptic vesicles in sets of glycinergic as well as GABAergic neurons. J. Neurosci. 18, 9733–9750.
Chen, G. H., Wang, Y. J., Qin, S., Yang, Q. G., Zhou, J. N., and Liu, R. Y. (2007). Age-related spatial cognitive impairment is correlated with increase of synaptotagmin 1 in dorsal hippocampus in SAMP8 mice. Neurobiol. Aging 28, 611–618. doi: 10.1016/j.neurobiolaging.2006.03.001
Cijsouw, T., Weber, J. P., Broeke, J. H., Broek, J. A., Schut, D., Kroon, T., et al. (2014). Munc18-1 redistributes in nerve terminals in an activity- and PKC-dependent manner. J. Cell Biol. 204, 759–775. doi: 10.1083/jcb.201308026
Cohen, L. D., Zuchman, R., Sorokina, O., Muller, A., Dieterich, D. C., Armstrong, J. D., et al. (2013). Metabolic turnover of synaptic proteins: kinetics, interdependencies and implications for synaptic maintenance. PLOS ONE 8:e63191. doi: 10.1371/journal.pone.0063191
Conti, F., Candiracci, C., and Fattorini, G. (2005). Heterogeneity of axon terminals expressing VGLUT1 in the cerebral neocortex. Arch. Ital. Biol. 143, 127–132.
Crepeau, A. Z., and Treiman, D. M. (2010). Levetiracetam: a comprehensive review. Expert Rev Neurother 10, 159–171. doi: 10.1586/ern.10.3
Cubelos, B., Gimenez, C., and Zafra, F. (2005). Localization of the GLYT1 glycine transporter at glutamatergic synapses in the rat brain. Cereb. Cortex 15, 448–459. doi: 10.1093/cercor/bhh147
Danbolt, N. C., Pines, G., and Kanner, B. I. (1990). Purification and reconstitution of the sodium- and potassium-coupled glutamate transport glycoprotein from rat brain. Biochemistry 29, 6734–6740. doi: 10.1021/bi00480a025
Davies, P., Hinkle, K. M., Sukar, N. N., Sepulveda, B., Mesias, R., Serrano, G., et al. (2013). Comprehensive characterization and optimization of anti-LRRK2 (leucine-rich repeat kinase 2) monoclonal antibodies. Biochem. J. 453, 101–113. doi: 10.1042/BJ20121742
Dean, C., Dunning, F. M., Liu, H., Bomba-Warczak, E., Martens, H., Bharat, V., et al. (2012). Axonal and dendritic synaptotagmin isoforms revealed by a pHluorin-syt functional screen. Mol. Biol. Cell 23, 1715–1727. doi: 10.1091/mbc.E11-08-0707
Devi, L., and Ohno, M. (2013). Effects of levetiracetam, an antiepileptic drug, on memory impairments associated with aging and Alzheimer’s disease in mice. Neurobiol. Learn. Mem. 102, 7–11. doi: 10.1016/j.nlm.2013.02.001
Dilena, R., Striano, P., Traverso, M., Viri, M., Cristofori, G., Tadini, L., et al. (2016). Dramatic effect of levetiracetam in early-onset epileptic encephalopathy due to STXBP1 mutation. Brain Dev. 38, 128–131. doi: 10.1016/j.braindev.2015.07.002
Edelmann, L., Hanson, P. I., Chapman, E. R., and Jahn, R. (1995). Synaptobrevin binding to synaptophysin: a potential mechanism for controlling the exocytotic fusion machine. EMBO J. 14, 224–231.
Ferguson, R. E., Carroll, H. P., Harris, A., Maher, E. R., Selby, P. J., and Banks, R. E. (2005). Housekeeping proteins: a preliminary study illustrating some limitations as useful references in protein expression studies. Proteomics 5, 566–571. doi: 10.1002/pmic.200400941
Garcia-Perez, E., Mahfooz, K., Covita, J., Zandueta, A., and Wesseling, J. F. (2015). Levetiracetam accelerates the onset of supply rate depression in synaptic vesicle trafficking. Epilepsia 56, 535–545. doi: 10.1111/epi.12930
Honer, W. G., Falkai, P., Young, C., Wang, T., Xie, J., Bonner, J., et al. (1997). Cingulate cortex synaptic terminal proteins and neural cell adhesion molecule in schizophrenia. Neuroscience 78, 99–110. doi: 10.1016/S0306-4522(96)00489-7
Ito, S., Yeh, F. C., Hiolski, E., Rydygier, P., Gunning, D. E., Hottowy, P., et al. (2014). Large-scale, high-resolution multielectrode-array recording depicts functional network differences of cortical and hippocampal cultures. PLOS ONE 9:e105324. doi: 10.1371/journal.pone.0105324
Jahn, R., Schiebler, W., Ouimet, C., and Greengard, P. (1985). A 38,000-dalton membrane protein (p38) present in synaptic vesicles. Proc. Natl. Acad. Sci. U.S.A. 82, 4137–4141. doi: 10.1073/pnas.82.12.4137
Janz, R., and Sudhof, T. C. (1999). SV2C is a synaptic vesicle protein with an unusually restricted localization: anatomy of a synaptic vesicle protein family. Neuroscience 94, 1279–1290. doi: 10.1016/S0306-4522(99)00370-X
Johnson, S. L., Franz, C., Kuhn, S., Furness, D. N., Ruttiger, L., Munkner, S., et al. (2010). Synaptotagmin IV determines the linear Ca2+ dependence of vesicle fusion at auditory ribbon synapses. Nat. Neurosci. 13, 45–52. doi: 10.1038/nn.2456
Kaminski, R. M., Gillard, M., and Klitgaard, H. (2012). “Targeting SV2A for Discovery of Antiepileptic Drugs,” in Jasper’s Basic Mechanisms of the Epilepsies, eds J. L. Noebels, M. Avoli, M. A. Rogawski, R. W. Olsen, and A. V. Delgado-Escueta (Bethesda, MD: National Center for Biotechnology Information).
Kaneko, T., Fujiyama, F., and Hioki, H. (2002). Immunohistochemical localization of candidates for vesicular glutamate transporters in the rat brain. J. Comp. Neurol. 444, 39–62. doi: 10.1002/cne.10129
Li, Y. C., and Kavalali, E. T. (2017). Synaptic Vesicle-Recycling Machinery Components as Potential Therapeutic Targets. Pharmacol. Rev. 69, 141–160. doi: 10.1124/pr.116.013342
Liu, X. B., Low, L. K., Jones, E. G., and Cheng, H. J. (2005). Stereotyped axon pruning via plexin signaling is associated with synaptic complex elimination in the hippocampus. J. Neurosci. 25, 9124–9134. doi: 10.1523/JNEUROSCI.2648-05.2005
Löscher, W., Gillard, M., Sands, Z. A., Kaminski, R. M., and Klitgaard, H. (2016). Synaptic Vesicle Glycoprotein 2A Ligands in the Treatment of Epilepsy and Beyond. CNS Drugs 30, 1055–1077. doi: 10.1007/s40263-016-0384-x
Low, S. H., Marmorstein, L. Y., Miura, M., Li, X., Kudo, N., Marmorstein, A. D., et al. (2002). Retinal pigment epithelial cells exhibit unique expression and localization of plasma membrane syntaxins which may contribute to their trafficking phenotype. J. Cell Sci. 115, 4545–4553. doi: 10.1242/jcs.00116
Lynch, B. A., Lambeng, N., Nocka, K., Kensel-Hammes, P., Bajjalieh, S. M., Matagne, A., et al. (2004). The synaptic vesicle protein SV2A is the binding site for the antiepileptic drug levetiracetam. Proc. Natl. Acad. Sci. U.S.A. 101, 9861–9866. doi: 10.1073/pnas.0308208101
Maas, J. W., Yang, J., and Edwards, R. H. (2017). Endogenous Leucine-Rich Repeat Kinase 2 Slows Synaptic Vesicle Recycling in Striatal Neurons. Front Synaptic Neurosci 9:5. doi: 10.3389/fnsyn.2017.00005
Martin, I., Kim, J. W., Dawson, V. L., and Dawson, T. M. (2014). LRRK2 pathobiology in Parkinson’s disease. J. Neurochem. 131, 554–565. doi: 10.1111/jnc.12949
Matteoli, M., Takei, K., Cameron, R., Hurlbut, P., Johnston, P. A., Sudhof, T. C., et al. (1991). Association of Rab3A with synaptic vesicles at late stages of the secretory pathway. J. Cell Biol. 115, 625–633. doi: 10.1083/jcb.115.3.625
Meehan, A. L., Yang, X., Mcadams, B. D., Yuan, L., and Rothman, S. M. (2011). A new mechanism for antiepileptic drug action: vesicular entry may mediate the effects of levetiracetam. J. Neurophysiol. 106, 1227–1239. doi: 10.1152/jn.00279.2011
Melone, M., Burette, A., and Weinberg, R. J. (2005). Light microscopic identification and immunocytochemical characterization of glutamatergic synapses in brain sections. J. Comp. Neurol. 492, 495–509. doi: 10.1002/cne.20743
Minelli, A., Alonso-Nanclares, L., Edwards, R. H., Defelipe, J., and Conti, F. (2003). Postnatal development of the vesicular GABA transporter in rat cerebral cortex. Neuroscience 117, 337–346. doi: 10.1016/S0306-4522(02)00864-3
Montana, V., Malarkey, E. B., Verderio, C., Matteoli, M., and Parpura, V. (2006). Vesicular transmitter release from astrocytes. Glia 54, 700–715. doi: 10.1002/glia.20367
Navarro, V., Dagron, C., Elie, C., Lamhaut, L., Demeret, S., Urien, S., et al. (2016). Prehospital treatment with levetiracetam plus clonazepam or placebo plus clonazepam in status epilepticus (SAMUKeppra): a randomised, double-blind, phase 3 trial. Lancet Neurol. 15, 47–55. doi: 10.1016/S1474-4422(15)00296-3
Nygaard, H. B., Kaufman, A. C., Sekine-Konno, T., Huh, L. L., Going, H., Feldman, S. J., et al. (2015). Brivaracetam, but not ethosuximide, reverses memory impairments in an Alzheimer’s disease mouse model. Alzheimers Res Ther 7, 25. doi: 10.1186/s13195-015-0110-9
Ohrfelt, A., Brinkmalm, A., Dumurgier, J., Brinkmalm, G., Hansson, O., Zetterberg, H., et al. (2016). The pre-synaptic vesicle protein synaptotagmin is a novel biomarker for Alzheimer’s disease. Alzheimers Res Ther 8, 41. doi: 10.1186/s13195-016-0208-8
Ormel, L., Stensrud, M. J., Bergersen, L. H., and Gundersen, V. (2012). VGLUT1 is localized in astrocytic processes in several brain regions. Glia 60, 229–238. doi: 10.1002/glia.21258
Raphael, I., Mahesula, S., Kalsaria, K., Kotagiri, V., Purkar, A. B., Anjanappa, M., et al. (2012). Microwave and magnetic M2 proteomics of the experimental autoimmune encephalomyelitis animal model of multiple sclerosis. Electrophoresis 33, 3810–3819. doi: 10.1002/elps.201200200
Sanchez, P. E., Zhu, L., Verret, L., Vossel, K. A., Orr, A. G., Cirrito, J. R., et al. (2012). Levetiracetam suppresses neuronal network dysfunction and reverses synaptic and cognitive deficits in an Alzheimer’s disease model. Proc. Natl. Acad. Sci. U.S.A. 109, E2895–E2903. doi: 10.1073/pnas.1121081109
Sanz-Blasco, S., Pina-Crespo, J. C., Zhang, X., Mckercher, S. R., and Lipton, S. A. (2016). Levetiracetam inhibits oligomeric Abeta-induced glutamate release from human astrocytes. Neuroreport 27, 705–709. doi: 10.1097/WNR.0000000000000601
Shi, J. Q., Wang, B. R., Tian, Y. Y., Xu, J., Gao, L., Zhao, S. L., et al. (2013). Antiepileptics topiramate and levetiracetam alleviate behavioral deficits and reduce neuropathology in APPswe/PS1dE9 transgenic mice. CNS Neurosci Ther 19, 871–881. doi: 10.1111/cns.12144
Stenius, K., Janz, R., Sudhof, T. C., and Jahn, R. (1995). Structure of synaptogyrin (p29) defines novel synaptic vesicle protein. J. Cell Biol. 131, 1801–1809. doi: 10.1083/jcb.131.6.1801
Takamori, S., Rhee, J. S., Rosenmund, C., and Jahn, R. (2000). Identification of a vesicular glutamate transporter that defines a glutamatergic phenotype in neurons. Nature 407, 189–194. doi: 10.1038/35025070
Trimble, W. S., Cowan, D. M., and Scheller, R. H. (1988). VAMP-1: a synaptic vesicle-associated integral membrane protein. Proc. Natl. Acad. Sci. U.S.A. 85, 4538–4542. doi: 10.1073/pnas.85.12.4538
Ueda, Y., Doi, T., Nagatomo, K., Tokumaru, J., Takaki, M., and Willmore, L. J. (2007). Effect of levetiracetam on molecular regulation of hippocampal glutamate and GABA transporters in rats with chronic seizures induced by amygdalar FeCl3 injection. Brain Res. 1151, 55–61. doi: 10.1016/j.brainres.2007.03.021
Vaccaro, P., Dente, L., Onofri, F., Zucconi, A., Martinelli, S., Valtorta, F., et al. (1997). Anti-synapsin monoclonal antibodies: epitope mapping and inhibitory effects on phosphorylation and Grb2 binding. Brain Res. Mol. Brain Res. 52, 1–16. doi: 10.1016/S0169-328X(97)00219-2
Varoqueaux, F., Sigler, A., Rhee, J. S., Brose, N., Enk, C., Reim, K., et al. (2002). Total arrest of spontaneous and evoked synaptic transmission but normal synaptogenesis in the absence of Munc13-mediated vesicle priming. Proc. Natl. Acad. Sci. U.S.A. 99, 9037–9042. doi: 10.1073/pnas.122623799
Venkatesan, K., Alix, P., Marquet, A., Doupagne, M., Niespodziany, I., Rogister, B., et al. (2012). Altered balance between excitatory and inhibitory inputs onto CA1 pyramidal neurons from SV2A-deficient but not SV2B-deficient mice. J. Neurosci. Res. 90, 2317–2327. doi: 10.1002/jnr.23111
Von Kriegstein, K., Schmitz, F., Link, E., and Sudhof, T. C. (1999). Distribution of synaptic vesicle proteins in the mammalian retina identifies obligatory and facultative components of ribbon synapses. Eur. J. Neurosci. 11, 1335–1348. doi: 10.1046/j.1460-9568.1999.00542.x
Wilson, N. R., Kang, J., Hueske, E. V., Leung, T., Varoqui, H., Murnick, J. G., et al. (2005). Presynaptic regulation of quantal size by the vesicular glutamate transporter VGLUT1. J. Neurosci. 25, 6221–6234. doi: 10.1523/JNEUROSCI.3003-04.2005
Wiltfang, J., Otto, M., Baxter, H. C., Bodemer, M., Steinacker, P., Bahn, E., et al. (1999). Isoform pattern of 14-3-3 proteins in the cerebrospinal fluid of patients with Creutzfeldt-Jakob disease. J. Neurochem. 73, 2485–2490. doi: 10.1046/j.1471-4159.1999.0732485.x
Xu, J., Chen, Q., Zen, K., Zhang, C., and Zhang, Q. (2013). Synaptosomes secrete and uptake functionally active microRNAs via exocytosis and endocytosis pathways. J. Neurochem. 124, 15–25. doi: 10.1111/jnc.12057
Xu, J., Mashimo, T., and Sudhof, T. C. (2007). Synaptotagmin-1, -2, and -9: Ca2+ sensors for fast release that specify distinct presynaptic properties in subsets of neurons. Neuron 54, 567–581. doi: 10.1016/j.neuron.2007.05.004
Keywords: levetiracetam, vesicular transport proteins, SV2A, presynaptic proteins, interactome, LRRK2
Citation: Marcotulli D, Fattorini G, Bragina L, Perugini J and Conti F (2017) Levetiracetam Affects Differentially Presynaptic Proteins in Rat Cerebral Cortex. Front. Cell. Neurosci. 11:389. doi: 10.3389/fncel.2017.00389
Received: 19 July 2017; Accepted: 24 November 2017;
Published: 11 December 2017.
Edited by:
Fabio Blandini, Fondazione Istituto Neurologico Nazionale Casimiro Mondino (IRCCS), ItalyReviewed by:
Fabrizio Gardoni, Università degli Studi di Milano, ItalyAlexej Verkhratsky, University of Manchester, United Kingdom
Copyright © 2017 Marcotulli, Fattorini, Bragina, Perugini and Conti. This is an open-access article distributed under the terms of the Creative Commons Attribution License (CC BY). The use, distribution or reproduction in other forums is permitted, provided the original author(s) or licensor are credited and that the original publication in this journal is cited, in accordance with accepted academic practice. No use, distribution or reproduction is permitted which does not comply with these terms.
*Correspondence: Giorgia Fattorini, Zy5mYXR0b3JpbmlAdW5pdnBtLml0
†These authors have contributed equally to this work.