 Shelley M. Blackwell1,2*
 Braden J. Crowe1
 Colin Brady2
 Andrew J. Schmidt3
 John H. Walker2John R. Benemann1Tryg J. Lundquist1,2
- 1MicroBio Engineering Inc., San Luis Obispo, CA, United States
- 2California Polytechnic State University, San Luis Obispo, CA, United States
- 3Pacific Northwest National Laboratory, Richland, WA, United States
Hydrothermal liquefaction (HTL) is a developing alternative for municipal wastewater sludge management that converts sludge into biocrude oil that can be refined into a liquid transportation fuel for the road, marine, and aviation sectors. A major byproduct of HTL is an aqueous phase (AP) high in ammonia, organic carbon, and potentially toxic compounds. This study investigated the feasibility of disposing AP through discharge into the headworks of conventional activated sludge water resource recovery facilities (WRRFs). Bench-scale, acute inhibition experiments using non-nitrifying mixed liquor indicated that a single AP exposure did not inhibit the specific oxygen uptake rates (SOUR) at pilot- and full-scale dilutions (0.03%–0.4% v/v). In contrast, post-secondary nitrifying mixed liquor showed that SOUR inhibition was linearly correlated to the AP concentration. Chronic AP exposure studies (121 days of operation) in continuous-flow, 2.25-L, non-nitrifying activated sludge reactors also indicated that SOUR was unaffected at the pilot- and full-scale AP dilutions in synthetic wastewater feed. However, repeated-measure linear-mixed models showed statistically significant lower specific dissolved organic carbon (DOC) removal rates and percentage DOC removal associated with higher AP concentration in the influent. At the full-scale AP concentration, removal rates were 25 mg DOC/g TSS-hr less and mean percent DOC removal was 40% lower than controls, despite higher DOC loading to the +AP reactors. Furthermore, ultraviolet transmittance (UVT) in the effluent of these reactors was 93% less than in the controls. The results of this study suggest that while headworks discharge of AP at pilot scale might be feasible, full-scale would require pretreatment of the AP, especially at WRRFs that use ultraviolet disinfection. The lack of detectable inhibition in non-nitrifying activated sludge via batch SOUR tests contrasted with the reduction in DOC removal detected in the continuous reactor studies. This result indicates the value of continuous studies to adequately understand the implications of AP headworks discharge on activated sludge processes. To our knowledge, this study is the first to characterize the effects of chronic exposure of mixed liquor to AP in continuous-flow activated sludge reactors.
1 Introduction
In the USA, approximately 15,000 municipal WRRFs treat approximately 130 million m3 of wastewater per day, generating 13 million metric tons of sludge per year (dry basis, Seiple et al., 2017). At present, only half of the resulting sludge is beneficially utilized, typically applied on land as a nutrient enriching soil amendment; this practice is increasingly at risk due to contaminants of emerging concern such as per- and polyfluoroalkyl substances (PFAS), microplastics, and pharmaceuticals (Johnson, 2022; Pozzebon and Seifert, 2023; Xue et al., 2025). Even non-beneficial disposal practices, such as landfilling, are at risk due to organic waste diversion regulations either under consideration or in the process of implementation (McKenzie, 2024). Accordingly, there is a need for sludge management technologies that balance the beneficial recovery of carbon, nutrients, and energy against public health objectives.
Hydrothermal liquefaction (HTL) is a thermal depolymerization process that converts wet organic waste streams, such as municipal wastewater sludges, into a biofuel intermediate suitable for upgrading into liquid transportation fuels, including renewable diesel and sustainable aviation fuel (SAF; Chen et al., 2018; Cronin et al., 2022). In HTL, wet wastes are heated (250–550 °C) under pressure (5–25 MPa), promoting reactions that convert feedstock carbohydrate, protein, and lipid macromolecules into a liquid “biocrude” product. HTL reduces sludge volume by converting 40%–50% of feedstock solids into biocrude, while the remainder is predominantly solubilized in an aqueous phase (AP) product. Because reactions take place in the liquid phase, HTL does not require energy-intensive drying of the sludges prior to conversion (Snowden-Swan et al., 2016; Skaggs et al., 2018; Clack, 2022), thus recovering three to four times more energy in the biocrude than used in the process (Thomsen et al., 2020). This results in the upgraded fuels having a greenhouse gas intensity 70% lower than their fossil equivalents (Ha et al., 2022). Converting half the higher heating value of all wastewater sludges within the United States into crude oil (@ 43 GJ/Mg), would generate roughly the equivalent of 1 day of US oil consumption (∼20 million barrels crude oil, EIA monthly energy review 2025). Although this is only a fraction of US demand, HTL offers an alternative for the difficult-to-decarbonize aviation and marine transportation sectors. Skaggs et al. (2018) showed that municipal sludge in the US could provide 4.5% of its annual aviation kerosene demand. Furthermore, HTL offers the potential for a more affordable sludge management pathway than current practices and other emerging sludge reduction/processing technologies, such as pyrolysis (Clack et al., 2024). The combination of revenue from the sale of recovered biocrude and reduced solids disposal volumes contributes to lower projected costs than current solid management practices, positioning HTL as a sustainable and financially viable technology (Posmanik et al., 2017; Cox and Eskicioglu, 2024).
Significant research and development has advanced HTL technology, with pilots designed to process several dry tons of sludge per day at various stages of planning and/or implementation. Such pilots, and indeed any follow-on full-scale plants, require integration with existing WRRFs, as well as an understanding of the potential impacts of HTL byproducts on WRRF operations. For a mid-size WRRF serving a population of 100,000 (38,000 m3-d-1 influent flow), 44 wet metric tons per day of primary and secondary solids, when dewatered to ∼20% total solids content, would be processed via HTL, producing ∼3 m3-d-1 of biocrude. This assumes a typical sludge production index of 0.23 kg sludge per m3 treated wastewater (Tchobanoglous et al., 2014), 75% of which is volatile, and a HTL conversion yield of 0.4 g crude oil per g volatile solids (Cronin et al., 2021). In addition to the biocrude, associated byproducts include an aqueous, solid, and gas phase (predominantly CO2), in substantial enough quantities that their management will not be trivial. The aqueous product (AP) accounts for ∼90% of the wet sludge feedstock flow on a mass basis and would result in 40 m3 of AP daily. Challenges with the disposal of the AP are its high chemical oxygen demand (∼60–80 g/L, COD), total nitrogen (5–7 g/L, TN), and the presence of phenolics, heterocyclic nitrogenous compounds, and other potentially toxic compounds (Basar et al., 2023, Romero et al., 2025).
As it is the largest of the HTL byproducts on a volume basis and conceivably the most challenging to manage, HTL AP has been given considerable attention within the industry and is the focus of the present study. The most straightforward way to dispose of AP would be to return it to the main municipal wastewater flow at the headworks or just upstream of the biological secondary treatment step, similar to the handling of anaerobic digester sludge centrate at many treatment plants. Nonetheless, the downstream implications of returning the AP are not well understood. Disposing all primary and secondary solids via HTL and returning the AP to the plant headworks would be similar in volume to the practice of centrate return, accounting for 0.2%–1% of influent volume. However, with 3- to 30-fold increases in biochemical oxygen demand (BOD) and ammonia nitrogen concentrations, it could be as much as 20% of the total facility influent BOD load and 10% of the nitrogen load (Tchobanoglous et al., 2014). Additionally, and perhaps even more important, is the possibility of interrupting and/or inhibiting activated sludge bacterial processes due to potentially toxic compounds in the AP. Another potential challenge to overcome associated with AP return to the headworks is the dark color of the AP, which if not removed through the conventional activated sludge treatment process, could interfere with final disinfection processes, particularly for facilities using ultraviolet (UV) light.
Current research on the effect of recycling HTL AP to the headworks has been limited to batch studies. Basar et al. (2024) used batch aerobic degradation studies to compare the respirometric oxygen uptake and oxygen uptake rates of activated sludge exposed to AP generated at different HTL intensities. They found signs of inhibition with AP generated from HTL at higher temperatures but concluded that continuous flow evaluations are needed to better understand the potential for inhibitory effects or process interference. Macedo et al. (2023) also evaluated the implications of recycling HTL AP to the headworks. These studies, using 5-h batch experiments to evaluate nitrification inhibition by tracking the speciation of nitrogen constituents in municipal wastewater with activated sludge exposed to different concentrations of HTL AP, found increased nitrification inhibition with increasing AP concentrations. Previous investigations of potential options for treating HTL AP have evaluated anaerobic digestion (Zhou et al., 2015; Chen et al., 2020; Chen et al., 2021; Li et al., 2022), adsorption (Liu et al., 2019; Wang et al., 2022; Aktas et al., 2024) and catalytic hydrothermal gasification (Elliott et al., 2013; Elliott et al., 2014), among others, but as of now, there is not an obvious best solution in terms of cost, energy requirement, and potential locations for the integration of treated AP into the wastewater treatment process as a whole. The overarching goal of this study was to better understand and quantify the implications of returning the AP to the facility headworks, providing a preliminary dataset on continuous reactors fed AP diluted with synthetic wastewater, and potential treatment/process implications over week-to-month-long time periods. This was examined within the local context of a proposed HTL pilot installation at Central Contra Costa Sanitation District (CCCSD) in Martinez, California, USA. CCCSD treats 170,000 m3-d-1 average influent flow with non-nitrifying conventional activated sludge for secondary treatment to meet permitted total suspended solids (TSS, monthly average <30 mg/L) and carbonaceous biochemical oxygen demand limits (CBOD, monthly average <25 mg/L). Primary and secondary sludges are combined and dewatered by centrifugation, producing 200 metric tons with a solid content of ∼20% per day on average. Currently, the dewatered sludge is incinerated; however, with the incinerator approaching the end of its operational lifespan, the utility is exploring alternative solid management technologies, including HTL. Given the pre-commercialization status of HTL, the following studies were some of the first steps in determining the feasibility of a pilot-scale demonstration. They also provide the first insights based on results from continuous activated sludge reactors into possible challenges to successful adoption and integration of HTL within municipal wastewater treatment.
The following sections describe the methodologies and results of experiments using the HTL AP and sludge-to-product yields from an HTL campaign using CCCSD sludge. These products were used in laboratory trials simulating the return of the AP to the facility headworks to better understand the potential for this practice, both at pilot and full-scale, to interfere with CCCSD’s ability to meet their permitted discharge limits.
2 Materials and methods
2.1 Municipal wastewater sludge and mixed liquor samples
A single, 250-kg sludge sample consisting of equal parts primary and secondary sludge was collected in January 2018 from the CCCSD municipal WRRF in Martinez, California for bench-scale HTL runs. Because CCCSD standard operating procedures involve stabilizing the primary and secondary sludges with 6 wt% lime (calcium hydroxide) for odor reduction prior to dewatering, the sludge used in HTL trials had been stabilized in this manner. Even with this stabilization, the pH of the CCCSD sludge was 5.9 prior to HTL processing (similar to other HTL sludge feedstocks processed by PNNL), eliminating any potential for alkaline catalysis of the HTL process. Furthermore, calcium in HTL feed is known to partition to the solids byproduct, so the stabilization of the CCCSD sludge was not expected to affect the toxicity of AP or influence the bacterial treatment results presented herein.
Mixed liquor samples from the City of San Luis Obispo Water Resource Recovery Facility (SLOWRRF) were collected from the post-secondary treatment; nitrifying activated sludge basin, with solids retention times of 16-18 days, which followed a trickling filter and primary clarifier. These mixed liquor samples were used in laboratory analyses on the same day as collection. Mixed liquor samples were also collected from the CCCSD, the non-nitrifying activated sludge facility, considering HTL as a replacement to their incinerators. Unlike the SLOWRRF, solid retention times at the CCCSD were typically <1 day. CCCSD mixed liquor was shipped overnight on ice, then aerated for 1 hour to equilibrate to room temperature prior to use in laboratory analyses.
2.2 Hydrothermal liquefaction aqueous-phase production and characterization
HTL was performed on the CCCSD sludge at Pacific Northwest National Laboratory (PNNL) in Richland, WA in a continuous-flow HTL system. The HTL reaction temperature was 346 °C pressurized to 19.6 MPa, with a liquid hourly space velocity of 3.6 L L-1 hr-1 (17 min residence time). Solids, mostly inorganics from the feed sludge, were removed downstream of the HTL tubular reactor by settling and filtration at pressure. The biphasic AP and biocrude product were cooled and then separated through gravimetric sedimentation. Five distinct runs were performed with CCCSD sludge. The AP used in this investigation was generated from a 10-h HTL run. Further details of these runs were reported in earlier studies (Snowden-Swan et al., 2022; Cronin et al., 2022, referenced as feedstock WW-09).
The AP from the steady-state conditions during the 10-h run was packaged and shipped to San Luis Obispo, California, for use in the experiments described below. Once received in San Luis Obispo, the AP was stored at 4 °C. Note that there are currently no standardized hold times for AP. In the context of the current experiments, AP was used within 9 months of being produced. The solid and ash content of the sludge feed were determined at PNNL according to Standard Methods 2540 D and E. Elemental analyses were performed with ASTM D5291/D5373 (for carbon, hydrogen, and nitrogen), ASTM D5373, modified (for oxygen), and ASTM D1552/D4239 (for sulfur), also at PNNL. Relevant inputs from these trials as they relate to sludge feed and the anticipated headworks load are summarized in Table 1. Additionally, a commercial analytical laboratory tested the AP for 165 compounds and elements, including the 111 compounds of the Total Toxic Organics list potentially toxic pollutants specified by EPA methods 624, 625, and 608.
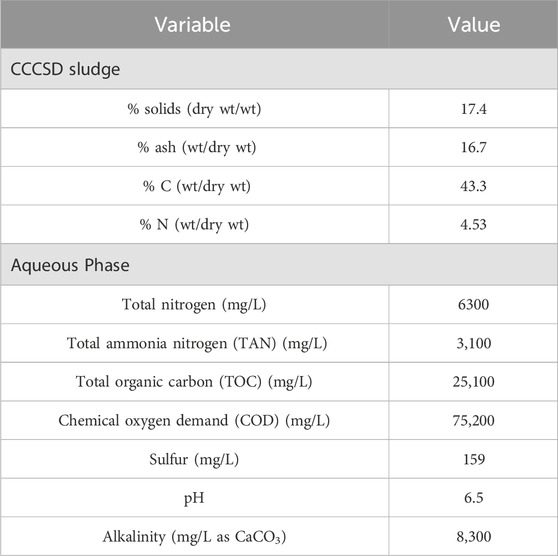
Table 1. Composition of CCCSD sludge (HTL feed) and AP produced during HTL.
2.3 Rationale for AP concentrations used in acute and chronic inhibition testing
The impacts on biological treatment unit operations were assessed via acute and chronic exposure studies, using AP-to-headwork-influent-flow dilutions expected in pilot- or full-scale implementation scenarios. AP dilutions were based on typical CCCSD flow rates and measured AP yields during the HTL campaign. This was done for both pilot (15 wet metric tons/day, 7.5% of CCCSD sludge) and full-scale (200 wet metric tons/day, 100% of CCCSD sludge) implementation scenarios. For acute inhibition testing (Section 2.4), we considered a range of influent-flow-to-AP dilutions to account for seasonal flow variations at the facility (Table 2). These dilutions represented similar overall biochemical oxygen demand (BOD) loads (kg/day) but varying influent concentrations (kg BOD/L) due to seasonal changes in influent flow—higher stormwater flows during winter and increased concentration during summer droughts.
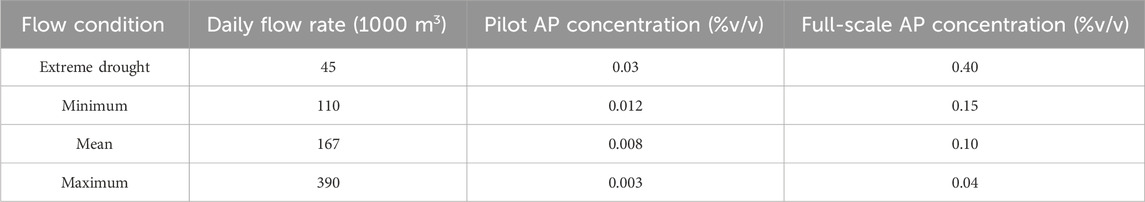
Table 2. Range of flow rates for a projected extreme drought, CCCSD daily minimum, mean and maximum in 2017 alongside the corresponding AP concentrations for both pilot and full-scale HTL implementation with AP recycle to the headworks.
Following CCCSD staff guidance, continuous chronic inhibition experiments (Section 3.5) focused on a “worst-case” scenario to assess the impact of AP headworks return, first assuming AP volumes in the pilot scenario and then ramping up the AP concentration to represent full-scale implementation. This scenario assumed the highest potential AP concentration within the plant’s influent, coupled with a low flow rate of 45,000 m3-d-1, representing the lowest potential flow during a summer drought. This conservative approach was adopted to account for extreme drought and water conservation practices, even though it was significantly lower than the daily minimum in 2017.
2.4 Acute inhibition testing: specific oxygen uptake rate
Acute inhibition was evaluated based on the specific oxygen uptake rate (SOUR) of mixed liquor during an initial single exposure to AP compared to the SOUR of an aliquot of the same mixed liquor not exposed to AP. Tests were conducted on activated sludge, first from a nitrifying activated sludge facility—the SLOWRRF—and then from a non-nitrifying activated sludge facility—the CCCSD. Based on the oxygen consumption rate method 2710.B in Standard Methods (APHA, 2017), SOUR was analyzed in 300-mL BOD bottles. These were filled with ∼200 mL of either synthetic wastewater for the AP treatment samples or with modified synthetic wastewater for the controls. The recipe of the synthetic wastewater for the control tests was modified to increase the organic carbon concentration so that it was similar to the carbon concentration in the +AP bottles due to the addition of AP (Table 3). The AP treatment bottles were spiked with the designated volume of AP depending on the dilution scenario being tested. Both control (no AP added) and +AP bottles were then shaken vigorously to bring the dissolved oxygen (DO) concentration to >8 mg/L. After this, a sufficient volume of settled activated sludge was added to fill the bottle completely with 500–1000 mg/L volatile suspended solids (VSS) in the bottle. A self-stirring, optical BOD probe (ProOBOD, YSI Inc, Ohio, USA) measured the DO concentration, which was recorded every 15 s for the first 2 minutes and then every minute until the concentration was less than 1 mg/L. SOUR was determined by measuring the consumption of dissolved oxygen per unit biomass over time (Equation 1) during the linear phase of the respiration curve.
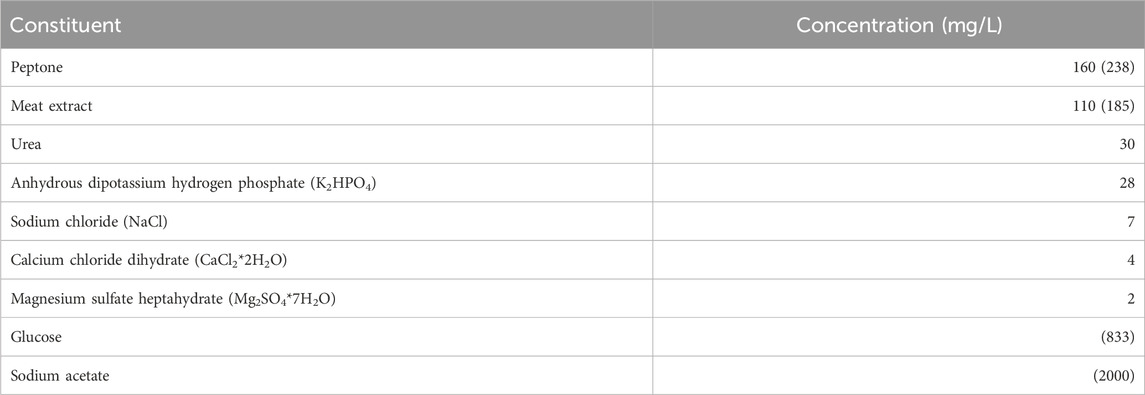
Table 3. Synthetic WW constituents and concentrations (Dalzell et al., 2002). Values in parentheses indicate the modified maximum concentrations for controls. This concentration was reached through stepwise increases in the control reactors as AP concentration during the ramp-up period increased with the final concentration implemented at full scale AP.
For each AP concentration, except for the 0.07% and 0.1% that were only run once, control and treatment SOUR tests were performed in triplicate. The percent inhibition for the three AP SOURs from a single sample day was averaged to obtain the percentage inhibition at a specific dilution on a given day according to Equation 2.
—where Ctrl avgSOUR = average SOUR (
Upon completion of the SOUR test, the total and volatile suspended solids concentration was measured on the entire volume of the bottle and evaluated in triplicate using Standard Methods 2540 D and E.
2.5 Effect of AP on WRRF effluent UVT
The effect of AP on WRRF effluent disinfection processes was assessed for the pilot-scale HTL implementation scenario by spiking CCCSD secondary clarifier effluent with AP and measuring the resulting UVT. This approach enabled the testing of a broader range of AP concentrations than trialed in the chronic inhibition study, encompassing both minimum and average daily flows rather than solely focusing on extreme drought conditions (Table 2). Dilutions ranged from 0.008% v/v, representative of the mean daily influent flow, up to 0.02% v/v, representing the pilot scale in extreme drought conditions. The secondary clarifier effluent was collected on 2 different days in the 2018/2019 winter, with residual particulate removed by filtration through nitrocellulose filters (0.22 µm pore size) prior to spiking with AP. UVT was reported as the mean of triplicate dilutions and measured via Standard Methods 5910B (APHA, 2017) using a UV-1700 PharmaSpec Shimadzu UV–Vis spectrophotometer at 254 nm.
2.6 Testing for chronic inhibition and cumulative effects of AP on non-nitrifying activated sludge
2.6.1 Reactor operations
The experimental set up consisted of four continuous-flow, bench-scale aerated reactors, each with a 2.25 L working volume and 4 L total volume (Figure 1). Reactors were seeded with mixed liquor from one of the aeration basins at the CCCSD. Each of the reactors was aerated with one 6.5-cm disk-shaped sparging stone at a rate of 2 L/min to maintain the reactor DO above 6 mg/L and the bacterial biomass in suspension. Air was provided by diaphragm air pumps, one pump per two aerated reactors. Two 2-channel, peristaltic pumps provided synthetic wastewater influent at a target rate of 7 mL/min for a 4.5-h hydraulic residence time (HRT). Batches of synthetic wastewater (Table 3) were prepared every 5 days and stored at room temperature. One basin provided the influent to the two control reactors, and a second basin provided the feed to the set of two test reactors. To account for the increase in organic carbon loading from the AP in the +AP reactors, as the AP concentration increased, influent control organic carbon was increased during the ramp up and full-scale periods (Table 3). Approximately 24 h of the effluent was collected and stored in bench top effluent basins. Once daily, the effluent basins were mixed and sampled for total suspended solids (TSS) and the collected volume measured. Neither influent nor effluent collection basins were refrigerated but rather maintained at room temperature. Once daily, the contents of the aerated reactor were poured into a large beaker for thorough mixing and then sampled for dissolved organic carbon (DOC), ultraviolet transmittance (%UVT), and TSS—details of analytical methods are described in Section 2.6.3. After sampling, 1 L of the mixed reactor contents was poured into an Imhoff cone and allowed to settle.
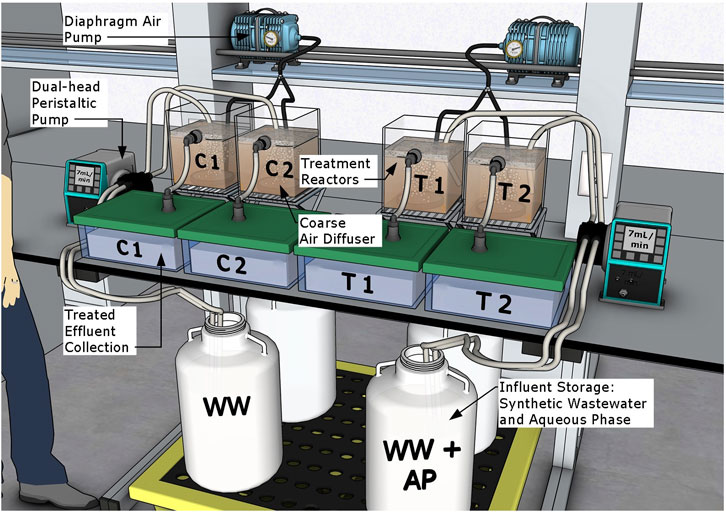
Figure 1. Graphic rendering of the set up for chronic inhibition experiments.
After 30 min of settling in the Imhoff cones, the supernatant was decanted and disposed of, and the settled solids were returned to the corresponding aerated reactor. The remaining 1.25 L working volume of the reactor was refilled with the 7 mL/min influent feed pump. Periodic SOUR analyses used the settled solids from the Imhoff cones rather than returning the settled solids into the aerated reactors. All four reactors were fed synthetic wastewater without any AP addition for roughly 5 weeks to assure similar performance among the four reactors. After this, two reactors served as controls and continued to be fed synthetic wastewater throughout the rest of the 121-day experimental period. The remaining two treatment reactors were fed synthetic wastewater spiked with AP at dilutions representative of pilot through full-scale installation of the HTL process at a WRRF discharging AP to its headworks. The timeline for these operations was broken down into four experimental periods, each lasting ∼1 month: baseline, pilot, ramp-up (in which the concentration of AP in the synthetic wastewater was increased gradually every 5–7 days), and full-scale (Table 4).
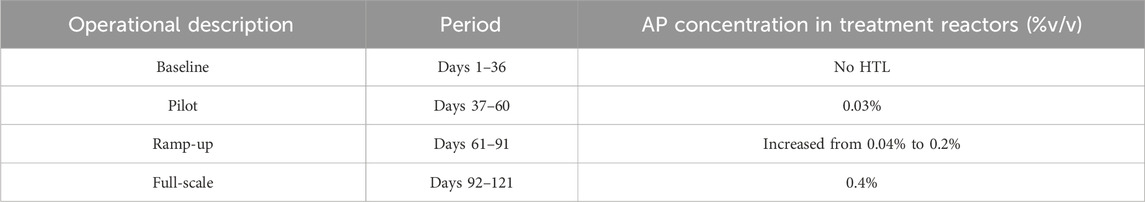
Table 4. Timeline and description of changes to AP concentration (%V/V) in influent to the bench-scale activated sludge reactors, representing the dilution of AP in the headworks for a pilot up to full scale implementation.
2.6.2 Reactor monitoring
The daily in situ temperature and DO of each aerated reactor were measured with an optical BOD probe (ProOBOD, YSI Inc, Ohio, USA). Influent flow rate and in situ reactor pH were also measured daily. Dissolved organic carbon (DOC), reactor and effluent TSS, ultraviolet transmittance (UVT), and settling efficiency were measured thrice weekly. SOUR analyses were conducted on settled mixed liquor at least once during each of these experimental periods. Unlike the SOUR tests to detect acute inhibition, these analyses measured the SOUR of the settled mixed liquor sampled from the aerated reactors but did not involve spiking the BOD bottle with any additional AP. Instead, the analyses were designed to detect whether the chronic exposure of the mixed liquor to AP in the synthetic wastewater resulted in any differences in SOUR compared to the mixed liquor fed pure synthetic wastewater. Due to the limited sample volumes from the reactors, these SOUR analyses were not conducted in triplicate. During the baseline period, duplicate reactors served as the source of replication. During the pilot and full-scale dilution periods, SOUR analyses were conducted on the settled mixed liquor combined from duplicate controls and compared to the SOUR of the combined mixed liquor from the duplicate reactors at 1 and 3 weeks into the period, providing replication over time.
2.6.3 Analytical methods
Reactor and effluent total suspended solids (TSS) were evaluated according to Standard Methods 2540 D. Dissolved organic carbon (DOC) was measured on filtered and acidified influent and effluent samples from the aerated reactors (1.2-µm glass fiber, H2SO4 to pH < 2) based on Standard Methods 5310 B using a Shimadzu TOC-V CSH Analyzer set to measure non-purgeable organic carbon. Ultraviolet transmittance was evaluated for aerated reactor effluent samples as described above according to Standard Methods 5910 B, and samples were filtered with nitrocellulose syringe filters and analyzed immediately after filtering. All Standard Methods referenced herein are from APHA (2017).
2.6.4 Statistical analysis
Simple linear regression analysis on the acute inhibition SOUR data was performed using the Data Analysis add-in in Excel. The percentage of DOC removed and the DOC removal rate were analyzed using a linear mixed model in SAS PROC MIXED. The fixed effects were AP, influent DOC concentration, and their interaction. Reactor differences were modeled using a random effect. For repeated measurements on the same reactor, an auto-regressive error correlation allowing for unequally-spaced time points was used.
3 Results
3.1 Acute inhibition testing using specific oxygen uptake rate
The SOUR measurements of the post-secondary, nitrifying (SLOWRRF) mixed liquor were compared to the SOUR of mixed liquor spiked with AP at a range of AP concentrations. The results showed a 7% reduction in the SOUR with a single exposure to AP at the lowest concentration tested (0.08% v/v), with the level of SOUR inhibition linearly increasing to 30% at the highest concentration (0.32% v/v) tested. Simple linear regression examined the relationship between AP concentration (x) and the percentage of SOUR inhibition (y); the resulting model (y = 0.80x + 0.0246) showed that AP concentration explained 83% of the variation in percentage SOUR inhibition (F (1, 7) = 34.76, p < 0.01). The 95% confidence interval for the regression coefficient ranged from 0.48 to 1.12 (Figure 2).
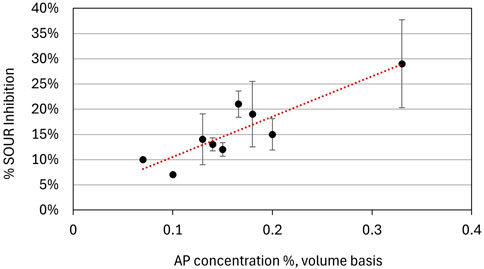
Figure 2. Percentage inhibition of SOUR as a function of AP concentration added to the mixed liquor samples from SLOWRRF. Error bars represent standard error of triplicate SOUR tests.
The CCCSD mixed liquor, however, did not show SOUR inhibition. Instead, at the four AP concentrations tested, the SOUR in bottles spiked with AP was higher than the controls. This increase in the SOUR, however, was not correlated to the AP concentration, with 28%, 8%, 25%, and 21% increases at AP concentrations of 0.04%, 0.14%, 0.3%, and 1% (%v/v) respectively (data not depicted in the figure).
Notably, treatment objectives differed between the WRRFs tested, likely influencing the bacterial consortia and their response when exposed to AP. At the time of mixed liquor collection, CCCSD did not promote nitrification in the aeration basin and operated at 1.0–1.3 days SRT (pers comm. CCCSD staff), whereas the SLOWRRF operated with significantly longer SRTs (16–18 days) to promote nitrification. At the short SRT of the CCCSD, the bacterial community would have been dominated by faster growing, more robust heterotrophs (Novak et al., 1977; Okabe et al., 1996; Moussa et al., 2005; Ni and Yu, 2007). The mixed liquor from the SLOWRRF, due to its long SRT, would have had a larger portion of ammonia oxidizing and nitrite oxidizing bacteria in the bacterial assemblage than in the CCCSD. Although the SOUR of heterotrophs and nitrifiers were not tested separately in either the SLOWRRF or CCCSD samples, it is hypothesized that the implicit difference in the bacterial communities based on the different SRTs might explain these different results. Follow-on studies are needed to examine the relative contribution to the SOUR from autotrophic (nitrifying) and heterotrophic bacterial consortia.
3.2 Effect of AP on effluent UVT
While the chronic inhibition experiment assessed the impact of AP on effluent UVT using the conservative, extreme-drought AP dilution at pilot through to full-scale HTL installation scenarios, here the UVT of a simple dilution curve examined a wider range of flow scenarios for the envisioned pilot scale installation only. These analyses compared the UVT of CCCSD secondary effluent (SE) spiked with AP to non-spiked SE (Figure 3). Without AP, CCCSD SE UVT measured 60% and decreased to 57% transmittance at the AP concentration expected during the average daily flow of 167,000 m3/d. The UVT of SE spiked with AP at the concentration expected during conservative summer drought flows of 45,000 m3/d was 10% less than non-spiked SE. This analysis, while not accounting for potential UVT improvements from activated sludge treatment, assessed the impact of AP over a range of flow conditions (extreme drought, annual mean daily flow) to provide a broader and potentially more representative data set to the CCCSD operational staff for assessing the potential implications of piloting HTL technology with AP headworks return.
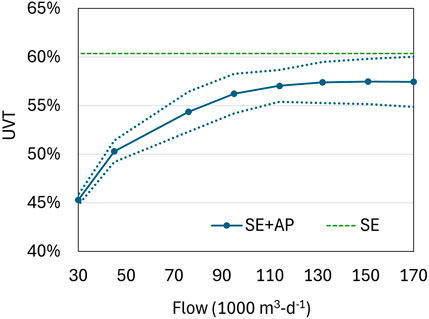
Figure 3. Averaged triplicate UVT of CCCSD secondary effluent (SE, green dashes) and AP diluted with CCCSD SE (blue) at a range of flow rates. UVT reduction when flows were above 95,000 m3-d-1 were minimal (<5%). Blue dotted lines represent average standard deviation of triplicate UVT measurements made on samples of SE on two different days. UVT was measured on 0.22-um filtered samples, so differences observed were due to dissolved constituents and not particulates in the secondary effluent.
3.3 Chronic effects of AP on non-nitrifying mixed liquor and downstream processes
To better understand the long-term implications of AP headworks return at the CCCSD, the next round of experiments evaluated the performance of bench-scale activated sludge aerated reactors operated with SRTs consistent with the non-nitrifying CCCSD. The experimental aim was to determine whether AP return resulted in cumulative or chronic effects to activated sludge and downstream processes using the expected pilot scale AP concentration (0.03% v/v) up through full-scale AP concentration (0.40% v/v) assuming conservative extreme-drought daily influent flow.
3.3.1 Reactor operation
All reactors were maintained at room temperature (21 °C). Reactor pH (∼8.2), dissolved oxygen (DO ∼6–7 mg/L), and hydraulic retention time (HRT; ∼six to eight h) were consistent and stable across all four reactors and throughout the three experimental periods (Table 5). In contrast, total suspended solids (TSS) varied between reactors and over time, with no apparent pattern or bias toward either control or treatment reactors. Due in part to poor sludge settleability, mean TSS concentrations across all experimental periods and reactors tended to be lower than typical values in the aeration basins of conventional activated sludge systems (260–500 mg/L vs 1,000–2,000 mg/L). This occurred despite the recycling of all settled solids and the elevated dissolved organic carbon concentration in synthetic wastewater. Low TSS was particularly pronounced in control reactors during the full-scale experimental period. Solid retention time (SRT) varied widely across the three periods, with mean SRTs of 2.7, 3.75, and 0.9 days during the baseline, pilot, and full-scale phases, respectively. Nevertheless, SRTs remained similar (<1-day difference) between control and +AP reactors within each period, allowing for valid within-period comparisons.
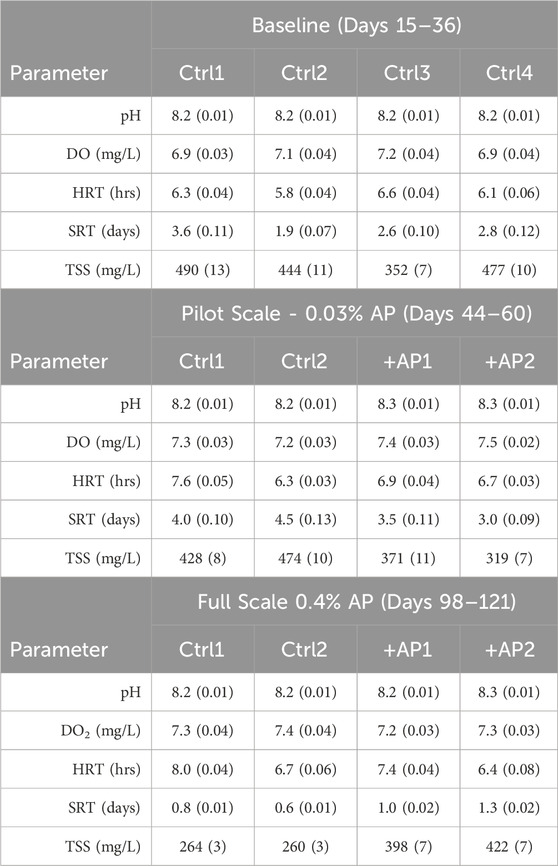
Table 5. Mean operational results of the two control and two + AP aerated reactors for three of the four experimental periods. Data during the initial week of each period was omitted to avoid the time in which the bacterial communities were acclimating to the new conditions. Standard errors of daily observations (pH, DO, and HRT) and thrice weekly measurements (TSS and SRT) during each experimental period are provided in parentheses.
These chronic inhibition tests aimed to provide preliminary feedback to the CCCSD regarding HTL implementation. Despite challenges in controlling TSS and SRT and resultant higher-than-desired variability, the experiments proceeded because the SRTs and HRTs remained relevant to the CCCSD’s operational range.
3.3.2 Specific oxygen uptake rate (SOUR)
Mixed-liquor SOUR, a measure of microbial activity, was similar for control and +AP reactors, ranging from 56 to 85 mg O2/g VSS - hr throughout the chronic inhibition experiments (Figure 4). The small number of samples on which SOUR was conducted prevented meaningful statistical comparison; however, the large overlap in standard error bars suggested insignificant differences between the SOUR of controls and +AP reactors and aligned with the acute inhibition tests which also showed no reduction in SOUR for the non-nitrifying CCCSD mixed liquor.
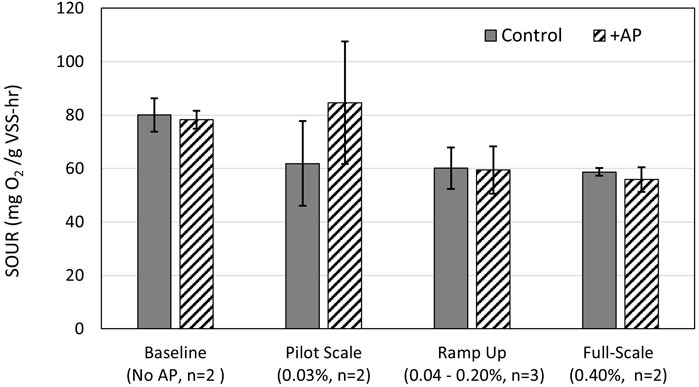
Figure 4. SOUR for mixed liquor was similar between control and +AP reactors during each of the test periods. During the baseline period (two left-most bars), the error bars represent the standard error of analytical replicates from one sample day. During the other three test periods, pilot, ramp-up and full-scale, the error bars are the standard error of samples collected from the aerated reactors on different days.
The observed range of SOUR values were two to four times greater than a typical SOUR for municipal mixed liquor reported in the literature (Madoni et al., 1999; Archibald et al., 2001; Márquez et al., 2022). A likely reason for this higher than typical SOUR has to do with the short operating SRT, selecting only for very active and fast-growing bacteria. In support of this reasoning, Huang et al. (1985) showed higher SOUR with shorter SRT and a similar SOUR range of 53–78 mg O2/g VSS - hr with a respective range of 2–30-day SRT. At SRTs from 8 to 30 days, the reduction in the SOUR plateaued to approximately 55 mg O2/g VSS - hr (Huang et al., 1985).
3.3.3 Organic carbon removal
In both controls and +AP reactors, the specific DOC removal rate increased with increasing carbon loading as the reactors progressed from the baseline (no AP), to pilot, ramp-up, and full-scale experimental periods (Figure 5). Low specific DOC removal rates were observed in all four reactors during the baseline through the pilot experimental periods and were related to the low influent DOC concentration. During ramp-up, the specific removal rates of the +AP reactors were consistently two-fold higher for approximately 2 weeks (days 75–89). This increase coincided with the increased influent DOC across all reactors, but because the influent DOC was disproportionately greater in the +AP reactors (Figure 6), it was not surprising that the removal rates of the +AP reactors were temporarily greater. By the end of the ramp-up period, however, the removal rates were again very similar between the control and + AP reactors (Figure 5). Figure 6 illustrates that during ramp-up, both control and +AP reactors showed an initial DOC increase of 100 mg/L in their effluent. The effluent DOC of the controls, however, dropped toward the end of the ramp-up period, indicating acclimation to steady-state (Figure 6A). In contrast, the effluent DOC concentration of the +AP reactors continued to increase beyond the initial 100 mg/L and then finally leveled off, fluctuating between 100 and 200 mg/L until the end of the experiment (Figure 6B). Throughout the full-scale period, the mean effluent DOC concentration of the +AP reactors was 50–150 mg/L higher than in the controls (Figure 6); moreover, the +AP reactors averaged 150 mg/L more TSS.
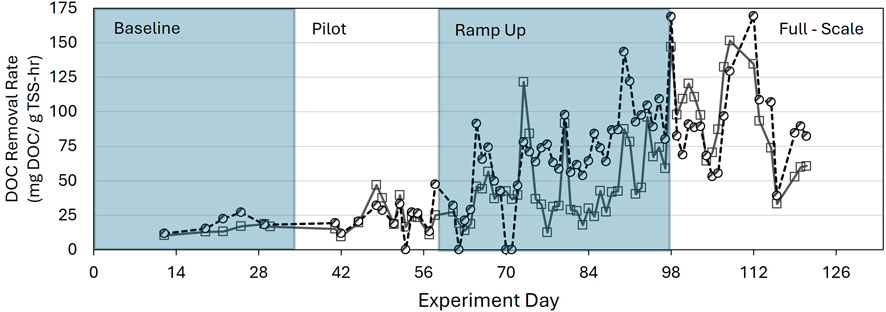
Figure 5. Time series of mean TSS-specific DOC removal rates for duplicate control (gray solid line and square markers) and duplicate +AP (black dashed line and circle markers) reactors.
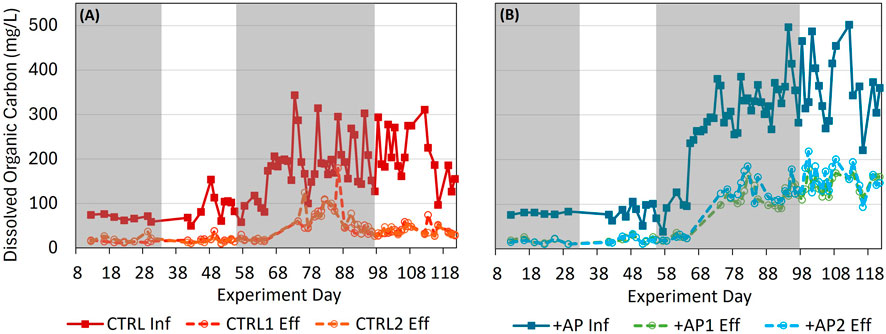
Figure 6. Time series of influent and effluent DOC concentration for duplicate (A) control and (B) +AP aerated reactors during the chronic inhibition studies. Influent DOC was intentionally increased during ramp-up to full-scale dilution in all reactors. Gray shaded boxes denote the baseline period where no AP was added to either influent basin and the ramp-up period where the concentration of AP in the influent was increasing every 5–7 days.
According to the multivariate linear mixed modeling results, the specific DOC removal rates and the percentage of DOC removed were significantly affected by not only the influent DOC concentration but also the AP concentration. Lower rates of DOC removal and a lower percentage of DOC removed were associated with higher influent AP concentration (p = 0.004, p < 0.0001 respectively). Table 6 summarizes the results of these models and describes in more detail the expected differences between the specific DOC removal rates and percentage of DOC removed of the control reactors and the +AP reactors at different influent AP concentrations. After accounting for differences in influent DOC concentration, the percentage of DOC removal at full-scale AP concentration averaged 40% less than in the no-AP reactors, and specific DOC removal rates averaged 24.7 mg DOC/g TSS-hr lower. Inhibitory effects of the increased AP concentration and an increased fraction of non-biodegradable organic carbon are potential explanations for these observed differences.
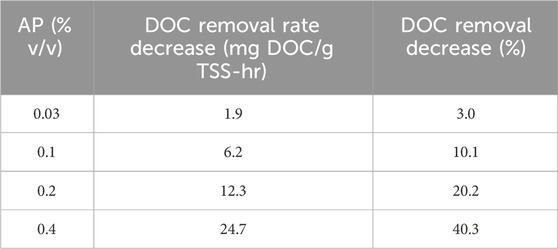
Table 6. Summary of mean decrease in DOC removal rates and % DOC removal in +AP reactors compared to No-AP controls. After adjusting for influent DOC concentration, each 0.01 increase in the %v/v of influent AP resulted in 0.66–1.36 lower percent DOC removed, P < 0.0001, CI = 95%, N = 171, and in a lower DOC removal rate of between 0.205 and 1.029 mg DOC/g TSS-hr, P = 0.004, CI = 95%, N = 251.
3.3.4 Effluent UVT
At the pilot AP concentration, the mean UVT of +AP effluent averaged 57%, or 10% less than the controls (Figure 7). At the full-scale AP concentration, UVT was reduced to an average of <4%. Interestingly, the 10% UVT reduction in the effluent of the continuous activated sludge reactors was identical to the reduction in UVT observed with straight dilution of AP using CCCSD SE at same dilution factor of 0.03% v/v. This similarity in the UVT reduction between the activated sludge effluent and the straight dilution of AP with no biological treatment suggests that the interfering constituents are not readily biodegraded under aerobic conditions.
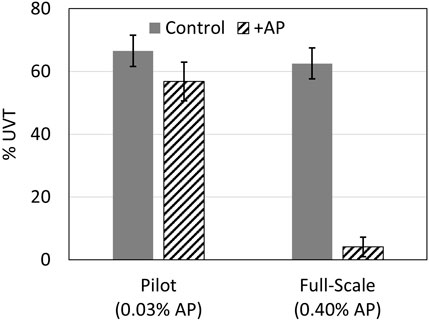
Figure 7. Mean UVT for pilot and full-scale experimental periods for duplicate control (gray) and +AP reactors (black striped). Control reactors ranged between 60% and 70% UVT during both experimental periods. Significant differences in UVT were observed between the control and +AP reactors at both dilutions (paired T-test, p < 0.01, N = 6, pilot and paired T-test, p < 0.01, N = 11, full-scale.
For the AP sample tested by the commercial laboratory, six of the 165 compounds and elements analyzed were detectable (all values as µg/L except where noted): phenol (32,000), 4-methylphenol (26,000), 1,1,2-trichloroethane (360), toluene (200), ethylbenzene (55), and octachlorodibenzo-p-dioxin (OCDD; 244 pg/L). Also detected were total cyanide (230), total arsenic (88), and mercury (0.689).
4 Discussion
In the present screening study, the effects of including AP in the feed of activated sludge reactors were assessed in terms of impact on wastewater treatment performance. The AP was dosed at levels representing the operation of a pilot HTL unit (0.03% v/v dilution) and full-scale HTL operation (0.4%) in an extreme summer drought scenario. The acute inhibition of non-nitrifying and nitrifying activated sludge cultures by low AP doses was assessed with the SOUR test. Chronic inhibition was assessed via the SOUR, DOC treatment performance, and UVT for continuous long-term laboratory activated sludge cultures fed synthetic wastewater containing AP.
4.1 Implications of acute and chronic SOUR results
The acute inhibition tests showed that post-secondary, nitrifying activated sludge cultures (SLOWRRF) were inhibited by AP, indicating for WRRFs with nitrogen limits and processes requiring nitrification, the need for treatment of the AP prior to return to the headworks. The reduced SOUR observed in SLOWRRF mixed liquor samples exposed to AP is consistent with reports in the literature associating a decreased SOUR with the presence of toxic or inhibitory constituents in the media (Archibald et al., 2001; Pernetti et al., 2003; Ricco et al., 2004). Research on the inhibitory effects of AP on nitrification in activated sludge, while limited by their batch study design, showed similar findings of nitrification inhibition, with 27%–44% inhibition reported by Macedo et al. (2023).
Unlike nitrifying activated sludge, SOUR tests on non-nitrifying samples (CCCSD) did not show evidence of acute inhibition from a single AP exposure. Likewise, SOUR from the continuous reactors exposed to AP did not differ notably from the SOUR of the control reactors at AP concentrations representing pilot through full scale. Despite the lack of observed difference in SOUR between the controls and +AP reactors in the chronic inhibition study, the limited replication and high degree of variability in reactor TSS and SRT limit the conclusions that can be drawn from these results.
4.2 Chronic exposure and dissolved organic carbon removal
Repeated-measure linear mixed models were used to analyze the time series of DOC removal data; these showed that both the reduction in percentage DOC removal and specific DOC removal rate in the +AP reactors compared to the controls was greater with increasing concentration of AP in the synthetic wastewater influent. These models accounted for both the temporal nature of the data and the variable DOC concentration in the influent. The results of this analysis on DOC removal over time underscore the importance of long-term studies in continuous reactors, where the batch SOUR studies did not detect inhibitory effects of AP; the longer-term continuous data show strong evidence of inhibition, even in the non-nitrifying reactors, and lend support to the conclusion that AP treatment is required before discharge to the headworks.
4.3 Implications for disinfection
The UVT of +AP reactor effluent during the chronic inhibition study averaged 57% and 4%, respectively, during the pilot and full-scale experimental periods. This is in comparison with the UVT of the controls averaging 65% over the same period. This reduction in UVT, at both pilot and full-scale AP concentration, is likely the result of recalcitrant DOC in the AP. Some compounds that absorb UV light in the region of 254 nm (Murillo-Acevedo et al., 2020; Mendez De Leo et al., 2002) are present in AP at relatively high concentrations: phenol (32,000 ug/L) and 4-methylphenol (26,000 ug/L). Supporting this conclusion, Si et al. (2018) identified recalcitrant constituents in AP, including N-heterocyclic and aromatic compounds and phenols. Additional compounds identified in other studies of AP from HTL of wastewater sludge known to absorb UV include pyrazine, methylpyrazine, and 2-pyrrolidone (Kilgore et al., 2023, Romero et al., 2025; Samir et al., 2020; Tsuru et al., 2021). While these UV-absorbing compounds may or may not affect activated sludge metabolism, if they are resistant to aerobic degradation and result in lower UVT, operational costs at plants that use UV disinfection would increase and their presence could interfere with the facility’s ability to meet bacterial removal requirements specified in their operating permit (Alimoradi et al., 2020).
On a practical level, when UVT is reduced, achieving the same level of disinfection requires either a longer exposure time to UV, increasing the intensity of UV radiation, or both (Severin, 1980; Tchobanoglous et al., 2014). In either case, the changes required to achieve an effective UV dose and corresponding increase in electricity translate to increased operational costs for the utility to meet their permitted disinfection requirements. As an example, one UV disinfection vendor reports an average 22% increase in specific power consumption, rising from 4.6 to 5.6 wh/m3 when UVT drops from 60% to 50% (Ultraaqua, 2022). Representing data from only one UV disinfection vendor, it is important to note that these numbers are variable and depend on many derating factors, including flow variation, fouling, and other site-specific characteristics of the wastewater. More relevant to an envisioned full-scale HTL installation is that effluent UVT of the +AP reactors during the full-scale AP concentration averaged 4%; this is a substantial decrease from the 65% UVT observed in the controls, clearly demonstrating the need for pre-treatment prior to AP headworks return, especially where UV disinfection is employed.
4.4 Total Toxic Organics
Phenols had the highest concentration (58 mg/L as phenol plus 4-methylphenol) of the 165 constituents tested in an AP sample as part of the Total Toxic Organics panel. While the 0.1 %v/v dilution of a full-scale facility (Table 2) would decrease the phenol concentrations to a generally non-toxic level (Water Quality Australia, 2000; US EPA, 2015b), the AP phenol concentrations exceeded the industrial discharge limit of the CCCSD, for example.
At low enough concentrations, both phenol and 4-methylphenol are biodegradable under aerobic or anaerobic conditions (Al-Khalid and El-Naas, 2012; Lin and Gu, 2021; Boyd et al., 1983), supporting the biological treatment of AP. However, if not degraded before discharge to headworks, phenols are more likely to inhibit nitrifiers than heterotrophic bacteria. Phenol concentrations of a few mg/L have been found to inhibit nitrifying bacteria (Lauchnor et al., 2023; Covarrubias-Vallejo et al., 2015).
Other potentially toxic organics detected—1,1,2-trichloroethane, toluene, and ethylbenzene—had concentrations 100–1000 times lower than the phenols. Each of these compounds, and especially cyanide, are well known to inhibit nitrifying bacteria (Han et al., 2014).
As a rough gauge of their importance as AP contaminants, the OCDD and mercury concentrations were below US EPA maximum contaminant levels (MCLs) for drinking water (US EPA, 2015a; US EPA, 2022), but the cyanide and arsenic are above the MCLs (USEPA, 2001; US EPA, 2023).
4.5 Treatment options for AP
For discharge from HTL/wastewater treatment facilities, AP constituents requiring treatment will be recalcitrant and/or toxic compounds, including those organics that interfere with disinfection, and in some cases, excess nutrients and salts. This treatment might take the form of pretreatment prior to mainstream treatment or completely separate sidestream treatment for discharge.
Various AP treatment technologies have been investigated. Aktas et al. (2024) demonstrated the successful use of granular activated carbon, achieving up to 94% removal of phenolics and 66% removal of COD—the removal of which will have a significant effect on UVT. However, the high concentration of organic carbon in AP (tens of thousands of mg/L) combined with the high cost of GAC treatment (Aktas et al., 2024; Jais et al., 2024), even for removal of extremely low concentrations of pollutants, will require the development and demonstration of other technologies. Although biological treatment might be challenging given the observed inhibitory effects of the AP, costs of biological treatment are typically lower than physical and chemical options. Aerobic pretreatment is a possibility, but anaerobic treatment can generate additional methane biofuel. A new example specific to AP is the Recirculating Anaerobic Dynamic Membrane Reactor, which has been shown to remove 65% of AP COD (Fonoll Almansa et al., 2025). Other emerging treatment options include wet air oxidation (WAO; also referred to as wet oxidation) and supercritical water oxidation (SCWO). WAO (catalyzed and non-catalyzed) reduced the COD of AP by 50%–90%, depending on the temperature and type of catalyst, if any (Kilgore et al., 2023; Thomsen et al., 2024, Vadlamudi et al., 2024). SCWO reduced the COD of AP by 98% (Wang et al., 2024).
However, none of these studies evaluated the potential effects of the treated AP on mainstream wastewater treatment processes. If the envisioned implementation of HTL continues to include AP discharge to headworks, research to identify a suitable pretreatment technology will require continuous activated sludge studies of the treated AP using real municipal wastewater and will need to include evaluation of the potential effects on other mainstream processes such as denitrification, phosphorus removal, membrane fouling, chlorine disinfection, and disinfection byproducts.
From a regulatory perspective, many municipal WRRFs, including the CCCSD, require industrial discharge permits even for onsite entities that discharge into the main influent of the facility. Given the likelihood that HTL infrastructure would be owned and operated by a third party and not a public utility, the concentration of constituents on lists like the Total Toxic Organics also support the need of AP treatment. Within the context of the CCCSD pilot evaluation, the presence of phenol at 32 mg/L in the AP would have required an exception to their typical industrial discharge permit requirement because, even at pilot scale, the phenol concentration exceeded the allowable limit.
4.6 Study limitations and future research
Synthetic wastewater was used in the chronic exposure studies to avoid the experimental uncertainty of the varying quality of real wastewater. Such variability, however, would be experienced at full scale. To assure scale-up performance, future pre-pilot studies will need to use flows of real wastewater and simulate temporal flow patterns.
The conclusions of the continuous activated sludge experiments are also somewhat uncertain due to the variability of the mixed liquor TSS concentrations and SRTs. Nonetheless, the present results aligned with previous batch experiments that evaluated the biological treatment of AP that identified nitrification inhibition (Macedo et al., 2023; Basar et al., 2024). In future research, better control of SRT would allow production of more distinct heterotrophic and nitrifying cultures, facilitating a better understanding of AP effects on these different culture types.
4.7 Conclusion
Despite its limitations, this seems to be the first study reporting the treatment of AP in continuous activated sludge reactors and associated downstream implications. Evidence from the continuous reactors suggests that for a full-scale activated sludge plant with HTL implemented, AP concentrations representative of the discharge of untreated AP to the headworks might result in (1) reduced DOC removal; (2) reduced specific DOC removal rates; and (3) a substantial decrease in UVT. Developing or identifying affordable AP treatment or disposal methods appears essential to HTL adoption within the municipal wastewater industry.
Data availability statement
The raw data supporting the conclusions of this article will be made available by the authors upon request, without undue reservation.
Author contributions
SB: Data curation, Methodology, Project administration, Visualization, Writing – original draft, Writing – review and editing. BC: Writing – original draft, Writing – review and editing. CB: Data curation, Writing – original draft, Writing – review and editing. AS: Writing – original draft, Writing – review and editing. JW: Formal analysis, Methodology, Writing – original draft. JB: Funding acquisition, Writing – original draft, Writing – review and editing. TL: Conceptualization, Project administration, Supervision, Writing – original draft, Writing – review and editing.
Funding
The author(s) declare that financial support was received for the research and/or publication of this article. This research was funded by the U.S. Department of Energy (DOE), Bioenergy Technology Office, through subawards under Award No. DE-EE-0007969 (HYPOWERS: Hydrothermal Processing of Wastewater Solids). This study describes the technical results and analysis. Neither the United States Government nor any agency thereof, nor any of its employees, makes any warranty, express or implied, or assumes any legal liability or responsibility for the accuracy, completeness, or usefulness of any information, apparatus, product, or process disclosed, or represents that its use would not infringe privately owned rights. Reference herein to any specific commercial product, process, or service by trade name, trademark, manufacturer, or other- wise does not necessarily constitute or imply its endorsement, recommendation, or favoring by the United States Government or any agency thereof. The views and opinions of authors expressed herein do not necessarily state or reflect those of the United States Government or any agency thereof.
Acknowledgments
The authors wish to thank Dan Frost and Amanda Schmidt of the CCCSD who provided extensive experimental input and feedback from the facility’s operational perspective. They also thank the collaborative HYPOWERS team, and the staff and students at Cal Poly who helped with reactor operations and sample analysis, especially Kathryn Baker for her help with sludge collection at the CCCSD.
Conflict of interest
Authors SB, BC, JB, and TL were employed by MicroBio Engineering Inc.
The remaining authors declare that the research was conducted in the absence of any commercial or financial relationships that could be construed as a potential conflict of interest.
Generative AI statement
The author(s) declare that no Generative AI was used in the creation of this manuscript.
Any alternative text (alt text) provided alongside figures in this article has been generated by Frontiers with the support of artificial intelligence and reasonable efforts have been made to ensure accuracy, including review by the authors wherever possible. If you identify any issues, please contact us.
Publisher’s note
All claims expressed in this article are solely those of the authors and do not necessarily represent those of their affiliated organizations, or those of the publisher, the editors and the reviewers. Any product that may be evaluated in this article, or claim that may be made by its manufacturer, is not guaranteed or endorsed by the publisher.
References
Aktas, K., Liu, H., and Eskicioglu, C. (2024). Treatment of aqueous phase from hydrothermal liquefaction of municipal sludge by adsorption: comparison of biochar, hydrochar, and granular activated carbon. J. Environ. Manag. 356, 120619. doi:10.1016/j.jenvman.2024.120619
Al-Khalid, T., and El-Naas, M. H. (2012). Aerobic biodegradation of phenols: a comprehensive review. Crit. Rev. Environ. Sci. Technol. 42, 1631–1690. doi:10.1080/10643389.2011.569872
Alimoradi, S., Stohr, H., Stagg-Williams, S., and Sturm, B. (2020). Effect of temperature on toxicity and biodegradability of dissolved organic nitrogen formed during hydrothermal liquefaction of biomass. Chemosphere 238, 124573. doi:10.1016/j.chemosphere.2019.124573
APHA (2017). Standard methods for the examination of water and wastewater. 23rd ed. Washington DC: American Public Health Association.
Archibald, F., Méthot, M., Young, F., and Paice, M. G. (2001). A simple system to rapidly monitor activated sludge health and performance. Water Res. 35 (10), 2543–2553. doi:10.1016/s0043-1354(00)00542-x
Basar, I. A., Liu, H., and Eskicioglu, C. (2023). Incorporating hydrothermal liquefaction into wastewater treatment–Part III: aqueous phase characterization and evaluation of on-site treatment. Chem. Eng. J. 467, 143422. doi:10.1016/j.cej.2023.143422
Basar, I. A., Stokes, A., and Eskicioglu, C. (2024). Evaluation of on-site biological treatment options for hydrothermal liquefaction aqueous phase derived from sludge in municipal wastewater treatment plants. Water Res. 252, 121206. doi:10.1016/j.watres.2024.121206
Boyd, S. A., Shelton, D. R., Berry, D., and Tiedje, J. M. (1983). Anaerobic biodegradation of phenolic compounds in digested sludge. Appl. Environ. Microbiol. 46 (1), 50–54. doi:10.1128/aem.46.1.50-54.1983
Chen, W. T., Zhang, Y., Lee, T. H., Wu, Z., Si, B., Lee, C. F. F., et al. (2018). Renewable diesel blendstocks produced by hydrothermal liquefaction of wet biowaste. Nat. Sustain. 1 (11), 702–710. doi:10.1038/s41893-018-0172-3
Chen, H., Hao, S., Chen, Z., Sompong, O., Fan, J., Clark, J., et al. (2020). Mesophilic and thermophilic anaerobic digestion of aqueous phase generated from hydrothermal liquefaction of cornstalk: molecular and metabolic insights. Water Res. 168, 115199. doi:10.1016/j.watres.2019.115199
Chen, Z., Rao, Y., Usman, M., Chen, H., Białowiec, A., Zhang, S., et al. (2021). Anaerobic fermentation of hydrothermal liquefaction wastewater of dewatered sewage sludge for volatile fatty acids production with focuses on the degradation of organic components and microbial community compositions. Sci. Total Environ. 777, 146077. doi:10.1016/j.scitotenv.2021.146077
Clack, K. E. (2022). Bioresource production from wastewater biosolids: a snapshot in time and future perspectives for a circular economy. Los Angeles: University of California.
Clack, K., Rajagopal, D., and Hoek, E. M. (2024). Life cycle and techno-economic assessment of bioresource production from wastewater. npj Clean. Water 7 (1), 22. doi:10.1038/s41545-024-00314-9
Covarrubias-Vallejo, J., González-Blanco, G., Prado-Barragán, A., and Beristain-Cardoso, R. (2015). Removal of ammonium and 4-methylphenol from synthetic wastewater by cell-free extracts of nitrifying sludge. Water, Air, and Soil Pollut. 226 (12), 424. doi:10.1007/s11270-015-2696-8
Cox, A. E., and Eskicioglu, C. (2024). Ammonia recovery via stripping from hydrothermal liquefaction aqueous from sludge for anaerobic co-digestion pretreatment. Chem. Eng. J. 496, 153715. doi:10.1016/j.cej.2024.153715
Cronin, D., Schmidt, A. J., Billing, J., Hart, T. R., Fox, S. P., Fonoll, X., et al. (2021). Comparative study on the continuous flow hydrothermal liquefaction of various wet-waste feedstock types. ACS Sustain. Chem. and Eng. 10 (3), 1256–1266. doi:10.1021/acssuschemeng.1c07214
Cronin, D. J., Subramaniam, S., Brady, C., Cooper, A., Yang, Z., Heyne, J., et al. (2022). Sustainable aviation fuel from hydrothermal liquefaction of wet wastes. Energies 15 (4), 1306. doi:10.3390/en15041306
Dalzell, D. J. B., Alte, S., Aspichueta, E., De la Sota, A., Etxebarria, J., Gutierrez, M., et al. (2002). A comparison of five rapid direct toxicity assessment methods to determine toxicity of pollutants to activated sludge. Chemosphere 47 (5), 535–545. doi:10.1016/s0045-6535(01)00331-9
Elliott, D. C., Hart, T. R., Schmidt, A. J., Neuenschwander, G. G., Rotness, L. J., Olarte, M. V., et al. (2013). Process development for hydrothermal liquefaction of algae feedstocks in a continuous-flow reactor. Algal Res. 2 (4), 445–454. doi:10.1016/j.algal.2013.08.005
Elliott, D. C., Hart, T. R., Neuenschwander, G. G., Rotness, L. J., Roesijadi, G., Zacher, A. H., et al. (2014). Hydrothermal processing of macroalgal feedstocks in continuous-flow reactors. ACS Sustain. Chem. and Eng. 2 (2), 207–215. doi:10.1021/sc400251p
Fonoll Almansa, X., Baydoun, M., Patel, A., Thorson, M. R., Schmidt, A., and Norton Jr, J. W. (2025). Using a recirculating anaerobic dynamic membrane bioreactor to treat hydrothermal liquefaction aqueous by-product. Front. Chem. Eng. 7, 1515470. doi:10.3389/fceng.2025.1515470
Ha, M., Gutenberger, G., Ou, L., Cai, H., and Hawkins, T. R. (2022). Opportunities for recovering resources from municipal wastewater no. ANL/ESD-21/11. Argonne, IL (United States): Argonne National Lab.ANL.
Han, Y., Jin, X., Wang, Y., Liu, Y., and Chen, X. (2014). Inhibitory effect of cyanide on nitrification process and its eliminating method in a suspended activated sludge process. Environ. Sci. Pollut. Res. Int. 21 (4), 2706–2713. doi:10.1007/s11356-013-2226-4
Huang, J. Y., Cheng, M. D., and Mueller, J. T. (1985). Oxygen uptake rates for determining microbial activity and application. Water Res. 19 (3), 373–381. doi:10.1016/0043-1354(85)90098-3
Jais, F. M., Ibrahim, M. S. I., El-Shafie, A., Choong, C. E., Kim, M., Yoon, Y., et al. (2024). Updated review on current approaches and challenges for poly-and perfluoroalkyl substances removal using activated carbon-based adsorbents. J. Water Process Eng. 64, 105625. doi:10.1016/j.jwpe.2024.105625
Johnson, G. R. (2022). PFAS in soil and groundwater following historical land application of biosolids. Water Res. 211, 118035. doi:10.1016/j.watres.2021.118035
Kilgore, U. J., Subramaniam, S., Fox, S. P., Cronin, D. J., Guo, M. F., Schmidt, A. J., et al. (2023). Wet air oxidation of HTL aqueous waste. Biomass Bioenergy 176, 106889. doi:10.1016/j.biombioe.2023.106889
Lauchnor, E. G., and Semprini, L. (2013). Inhibition of phenol on the rates of ammonia oxidation by Nitrosomonas europaea grown under batch, continuous fed, and biofilm conditions. Water Res. 47 (13), 4692–4700. doi:10.1016/j.watres.2013.04.052
Li, R., Liu, D., Zhang, Y., Tommaso, G., Si, B., Liu, Z., et al. (2022). Enhanced anaerobic digestion of post-hydrothermal liquefaction wastewater: Bio-methane production, carbon distribution and microbial metabolism. Sci. Total Environ. 837, 155659. doi:10.1016/j.scitotenv.2022.155659
Lin, Y.-H., and Gu, Y.-J. (2021). Biodegradation kinetic studies of phenol and p-Cresol in a batch and continuous stirred-tank bioreactor with Pseudomonas putida ATCC 17484 cells. Processes 9 (1), 133. doi:10.3390/pr9010133
Liu, D., Zhang, Y., Zhou, J., Tsang, Y. F., Liu, Z., Zhang, Y., et al. (2019). Improved methane production and energy recovery of post-hydrothermal liquefaction waste water via integration of zeolite adsorption and anaerobic digestion. Sci. Total Environ. 651, 61–69. doi:10.1016/j.scitotenv.2018.09.175
Madoni, P., Davoli, D., and Guglielmi, L. (1999). Response of SOUR and AUR to heavy metal contamination in activated sludge. Water Res. 33 (10), 2459–2464. doi:10.1016/s0043-1354(98)00455-2
Macêdo, W. V., Schmidt, J. S., Jensen, S. B., Biller, P., and Vergeynst, L. (2023). Is nitrification inhibition the bottleneck of integrating hydrothermal liquefaction in wastewater treatment plants? J. Environ. Manag. 348, 119046.
Márquez, P., Gutiérrez, M. C., Toledo, M., Alhama, J., Michán, C., and Martín, M. A. (2022). Activated sludge process versus rotating biological contactors in WWTPs evaluating the influence of operation and sludge bacterial content on their odor impact. Process Saf. Environ. Prot. 160, 775–785. doi:10.1016/j.psep.2022.02.071
McKenzie, M. (2024). International policy overview of organic waste bans to landfill. New Zealand: Department of the Prime Minister and Cabinet, 42. Available online at: www.dpmc.govt.nz/sites/default/files/2024-07/PMCSA-24-03-02-V1-OPMCSA-Internship-output-Organic-waste-bans-to-landfills-M-McKenzie-V1-wcs.pdf.
Mendez De Leo, L. P., Bianchi, H. L., and Fernández-Prini, R. J. (2002). Thermodynamics of 4-methylphenol dissociation in water at high temperature using UV–Vis spectroscopy. J. Chem. Thermodyn. 34, 1467–1479. doi:10.1016/S0021-9614(02)00203-3
Moussa, M. S., Hooijmans, C. M., Lubberding, H. J., Gijzen, H. J., and Van Loosdrecht, M. C. M. (2005). Modelling nitrification, heterotrophic growth and predation in activated sludge. Water Res. 39 (20), 5080–5098. doi:10.1016/j.watres.2005.09.038
Murillo-Acevedo, Y. S., Giraldo, L., Poon, P. S., Matos, J., and Moreno-Piraján, J. C. (2020). The Cramer’s rule for the parametrization of phenol and its hydroxylated byproducts: UV spectroscopy vs. high performance liquid chromatography. Environ. Sci. Pollut. Res. 28, 6746–6757. doi:10.1007/s11356-020-10897-8
Ni, B. J., and Yu, H. Q. (2007). Model-based analysis on growth of activated sludge in a sequencing batch reactor. Appl. Microbiol. Biotechnol. 77, 723–731. doi:10.1007/s00253-007-1185-4
Novak, J. T., Zurow, A., and Becker, H. (1977). Factors influencing activated sludge properties. J. Environ. Eng. Div. 103 (5), 815–828. doi:10.1061/jeegav.0000679
Okabe, S., Hiratia, K., Ozawa, Y., and Watanabe, Y. (1996). Spatial microbial distributions of nitrifiers and heterotrophs in mixed-population biofilms. Biotechnol. Bioeng. 50 (1), 24–35. doi:10.1002/(sici)1097-0290(19960405)50:1<24::aid-bit4>3.0.co;2-3
Pernetti, M., Di Palma, L., and Merli, C. (2003). A real time toxicity bioassay for activated sludge reactor. Int. J. Chem. React. Eng. 1 (1), 20121024. doi:10.2202/1542-6580.1076
Posmanik, R., Labatut, R. A., Kim, A. H., Usack, J. G., Tester, J. W., and Angenent, L. T. (2017). Coupling hydrothermal liquefaction and anaerobic digestion for energy valorization from model biomass feedstocks. Bioresour. Technol. 233, 134–143. doi:10.1016/j.biortech.2017.02.095
Pozzebon, E. A., and Seifert, L. (2023). Emerging environmental health risks associated with the land application of biosolids: a scoping review. Environ. Health 22 (1), 57. doi:10.1186/s12940-023-01008-4
Ricco, G., Tomei, M. C., Ramadori, R., and Laera, G. (2004). Toxicity assessment of common xenobiotic compounds on municipal activated sludge: comparison between respirometry and microtox®. Water Res. 38 (8), 2103–2110. doi:10.1016/j.watres.2004.01.020
Romero, A. D., Poli, J. V., Larson, S., Stagg-Williams, S., Carter, R., and Sturm, B. S. (2025). Inhibition of nitrifying bacteria from heterocyclic N-containing organic compounds from municipal sludge hydrothermal liquefaction. Front. Chem. Eng. 7, 1532958. doi:10.3389/fceng.2025.1532958
Samir, B., Kalalian, C., Roth, E., Salghi, R., and Chakir, A. (2020). Gas-phase UV absorption spectra of pyrazine, pyrimidine and pyridazine. Chem. Phys. Lett. 751, 137469.
Seiple, T. E., Coleman, A. M., and Skaggs, R. L. (2017). Municipal wastewater sludge as a sustainable bioresource in the United States. J. Environ. Manag. 197, 673–680. doi:10.1016/j.jenvman.2017.04.032
Severin, B. F. (1980). Disinfection of municipal wastewater effluents with ultraviolet light. J. Water Pollut. Control Fed. 52, 2007–2018. Available online at: http://www.jstor.org/stable/25027663.
Si, B., Li, J., Zhu, Z., Shen, M., Lu, J, Duan, N., et al. (2018). Inhibitors degradation and microbial response during continuous anaerobic conversion of hydrothermal liquefaction wastewater. Sci. Total. Environ. 630, 1124–1132.
Skaggs, R. L., Coleman, A. M., Seiple, T. E., and Milbrandt, A. R. (2018). Waste-to-Energy biofuel production potential for selected feedstocks in the conterminous United States. Renew. Sustain. Energy Rev. 82, 2640–2651. doi:10.1016/j.rser.2017.09.107
Snowden-Swan, L. J., Zhu, Y., Jones, S. B., Elliott, D. C., Schmidt, A. J., Hallen, R. T., et al. (2016). Hydrothermal liquefaction and upgrading of municipal wastewater treatment plant sludge: a preliminary techno-economic analysis. (No. PNNL-25464-Rev. 1). Richland, WA: Pacific Northwest National Laboratory (PNNL). doi:10.2172/1258731
Snowden-Swan, L. J., Li, S., Jiang, Y., Thorson, M. R., Schmidt, A. J., Seiple, T. E., et al. (2022). Wet waste hydrothermal liquefaction and biocrude upgrading to hydrocarbon fuels: 2021 state of technology (no. PNNL-32731). Richland, WA (United States): Pacific Northwest National Lab.PNNL.
Tchobanoglous, G., Stensel, H. D., Burton, F. L., and Tsuchihashi, R. (2014). Wastewater engineering: treatment and resource recovery. 5th ed. McGraw-Hill Education.
Thomsen, L. B. S., Carvalho, P. N., Dos Passos, J. S., Anastasakis, K., Bester, K., and Biller, P. (2020). Hydrothermal liquefaction of sewage sludge; energy considerations and fate of micropollutants during pilot scale processing. Water Res. 183, 116101. doi:10.1016/j.watres.2020.116101
Thomsen, L. B. S., de Carvalho Carregosa, J., Wisniewski Jr, A., Anastasakis, K., and Biller, P. (2024). Continuous wet air oxidation of aqueous phase from hydrothermal liquefaction of sewage sludge. J. Environ. Chem. Eng. 12 (3), 112672. doi:10.1016/j.jece.2024.112672
Tsuru, S., Sharma, B., Nagasaka, M., and Hättig, C. (2021). Solvent effects in the ultraviolet and X-ray absorption spectra of pyridazine in aqueous solution. J. Phys. Chem. A 125 (33), 7198–7206. doi:10.1021/acs.jpca.1c05183
UltraAqua (2022). Understanding UV Transmittance (UVT) for Water Treatment. Available online at: https://ultraaqua.com/blog/uv-transmittance/.
US EPA (2015a). National Primary Drinking Water Regulations [Overviews and Factsheets]. Availble online at: https://www.epa.gov/ground-water-and-drinking-water/national-primary-drinking-water-regulations (Accessed December 2024).
US EPA (2015b). Update of human health ambient water quality criteria: phenol. U.S. Environmental Protection Agency. Available online at: www.regulations.gov/document/EPA-HQ-OW-2014-0135-0247.
US EPA (2022). Drinking water contaminants - cyanide. U.S. Environmental Protection Agency. Available online at: www.apecwater.com/blogs/contaminants-facts/cyanide-contaminants-removal-water.
US EPA (2023). Drinking water contaminants – Mercury. Available online at: www.apecwater.com/blogs/contaminants-facts/mercury-contaminants-removal-water.
US EPA (2001). Drinking water arsenic rule history. Available online at: www.epa.gov/dwreginfo/drinking-water-arsenic-rule-history.
Vadlamudi, D. P., Lei, X. G., Goldfarb, J. L., and Tester, J. W. (2024). Wet oxidation of aqueous phase byproducts from uncatalyzed and acid-catalyzed hydrothermal liquefaction of manure. Chem. Eng. J. 498, 155524.
Wang, Z., Zhang, C., Watson, J., Sharma, B. K., Si, B., and Zhang, Y. (2022). Adsorption or direct interspecies electron transfer? A comprehensive investigation of the role of biochar in anaerobic digestion of hydrothermal liquefaction aqueous phase. Chem. Eng. J. 435, 135078. doi:10.1016/j.cej.2022.135078
Wang, Y., Qian, L., Yang, D., Gong, Y., Yuan, C., Hu, Y., et al. (2024). Integration of hydrothermal liquefaction of cyanophyta and supercritical water oxidation of its aqueous phase products: biocrude production and nutrient removal. Sci. Total Environ. 914, 169835. doi:10.1016/j.scitotenv.2023.169835
Xue, J., Verstraete, W., Ni, B. J., Giesy, J. P., Kaur, G., Jiang, D., et al. (2025). Rethink biosolids: risks and opportunities in the circular economy. Chem. Eng. J. 510, 161749. doi:10.1016/j.cej.2025.161749
Keywords: hydrothermal liquefaction, resource recovery, municipal sludge, biocrude, biofuel, aqueous-phase treatment
Citation: Blackwell SM, Crowe BJ, Brady C, Schmidt AJ, Walker JH, Benemann JR and Lundquist TJ (2025) Effects of the hydrothermal liquefaction aqueous phase on activated sludge. Front. Chem. Eng. 7:1541144. doi: 10.3389/fceng.2025.1541144
Received: 07 December 2024; Accepted: 26 August 2025;
Published: 22 October 2025.
Edited by:
Xavier Fonoll Almansa, The University of Texas at Austin, United StatesReviewed by:
Muhammad Usman, University of Alberta, CanadaJarosław Serafin, University of Barcelona, Spain
Copyright © 2025 Blackwell, Crowe, Brady, Schmidt, Walker, Benemann and Lundquist. This is an open-access article distributed under the terms of the Creative Commons Attribution License (CC BY). The use, distribution or reproduction in other forums is permitted, provided the original author(s) and the copyright owner(s) are credited and that the original publication in this journal is cited, in accordance with accepted academic practice. No use, distribution or reproduction is permitted which does not comply with these terms.
*Correspondence: Shelley M. Blackwell, U2hlbGxleUJsYWNrd2VsbEBNaWNyb0Jpb0VuZ2luZWVyaW5nLmNvbQ==