 Gaoxiang Qi1,2*
- 1Institute of Wetland Agriculture and Ecology, Shandong Academy of Agricultural Sciences, Jinan, China
- 2State Key Laboratory of Nutrient Use and Management, Shandong Academy of Agricultural Sciences, Jinan, China
Polyacrylamide (PAM), a widely utilized flocculant in sewage treatment, typically finds its way into sewage sludge (SS) and undergoes transformation during the SS treatment process. Despite its prevalence and potential implications, the transformation of PAM during SS treatment has scarcely been documented in the literature. This study investigated the transformation of PAM during two prevalent thermal treatment processes of SS: hydrothermal carbonization (HTC) and pyrolysis. To comprehensively analyze the transformation products, LC-MS/MS was employed to examine the liquid products obtained from the HTC treatment of PAM, while TG-FTIR was utilized to analyze the pyrolysis gas. Upon subjecting PAM to HTC treatment in the temperature range of 150–240 °C, a detailed analysis of the water quality characteristics of the liquid phase derived from PAM was conducted. The analysis successfully identified a total of 81 components, consisting of 35 carbonaceous and 46 nitrogenous compounds. Notably, when the reaction temperature remained below 150 °C, the decomposition of both the side chains and the backbone of PAM was relatively mild. However, as the temperature exceeded 180 °C, the deamination process was significantly enhanced. Concurrently, the pH of the liquid phase decreased, which could be attributed to the decomposition of high molecular polybasic acids into low-molecular weight organic acids. The TG-FTIR analysis of PAM revealed that the mass loss during the pyrolysis of PAM at 30–1,000 °C could be distinctly divided into five stages. The initial mass loss stage was primarily attributed to the removal of adsorbed water and organic solvents. The second mass loss stage was hypothesized to be a result of intramolecular decomposition accompanied by the elimination of CHx and C=C groups. The subsequent third, fourth, and fifth mass loss stages were predominantly due to the release of amides and CO2. Additionally, it was observed that CO was generated through the reduction of CO2 by the carbon present in the solid residues. The conclusion of this study presents a comprehensive discussion of environmental implications based on the results of HTC and pyrolysis treatments of PAM.
1 Introduction
Polyacrylamide (PAM), one of the most commonly used flocculants in the sewage treatment process, is a nitrogen-containing high-molecular weight polymer which can be divided into three types: cationic PAM (cPAM), anionic PAM (aPAM), and non-ionic PAM (nPAM) (Xiong et al., 2018). During the sludge settling process, PAM plays a crucial role in transforming sewage sludge (SS). Through the mechanisms of electrostatic adsorption and bridging, PAM aggregates the fine particles of SS into larger flocs, and the aggregation significantly accelerates the sedimentation rate, effectively facilitating the separation of solid-phase sludge from the liquid phase, thereby enhancing the overall efficiency of the sludge settling process (Lv et al., 2022). PAM can be transformed into SS by charge neutralization and interparticle bridging (Aguilar et al., 2005; Moussas and Zouboulis, 2009). Although the dosage of PAM is very low (usually lower than 20 mg/g of total solids) in aqueous phase, the polymer fraction can concentrate after flocculation (Cantrell et al., 2012). When SS is digested anaerobically in the subsequent treatment process, PAM can be partially hydrolyzed and utilized by microorganisms as carbon and nitrogen sources (Dai et al., 2015; Wang et al., 2018). Previous studies have found that the monomer acrylamide will be produced during the anaerobic digestion of cPAM (Wang et al., 2018), which is a known neurotoxin and a potential carcinogen (Xiong et al., 2018). Moreover, when PAM flocculated SS is treated by thermal process (such as commonly reported hydrothermal carbonization (HTC) or pyrolysis), PAM contained in SS can be converted into dissolved nitrogen-containing compounds or nitrogen-containing off-gas, which may create potential environmental risks.
Studies on the thermal stability of PAM started in the 1980s, as PAM was a commonly used additive in enhancing oil recovery (Uranta et al., 2018). In oilfield processes including drilling, polymer flooding, and enhancing oil recovery, PAM is a commonly used water-soluble polymer (El Karsani et al., 2014; Ma et al., 2015). Improving the thermal stability of PAM is one of the most important factors preventing the widespread oilfield applications of PAM chemicals in harsh reservoir conditions. PAM solution is usually converted into carboxylic acid, carboxylate, amide, and imide after thermal treatment under relative mild conditions (<100 °C) (Ma et al., 2015; Moradi-Araghi et al., 1988). Little research has been conducted to address PAM degradation under higher temperatures, such as the condition for SS hydrothermal treatment (Chen et al., 2021). In addition, when SS is treated by pyrolysis, PAM also undergoes pyrolysis reaction. However, there are few studies on the pyrolysis characteristics of PAM (Fu et al., 2021). As a nitrogen-containing polymer, harmful exhaust gases such as HCN and NOx may be produced during the PAM pyrolysis process. Unfortunately, the conversion pathways and mechanisms of PAM under pyrolysis conditions are still unclear.
HTC and pyrolysis have emerged as highly promising techniques for SS treatment, offering advantages such as a significant reduction in SS volume, effective fixation of heavy metals, and efficient resource utilization (Fonts et al., 2012; Wang et al., 2019). Nevertheless, previous research has largely overlooked the migration and transformation of PAM during these processes. As a nitrogen-rich high-molecular weight polymer, the thermochemical conversion of PAM may pose potential environmental risks, which demands in-depth investigation. This study investigated the conversion of PAM during two commonly used SS thermal treatment processes: HTC and pyrolysis. LC-MS/MS and TG-FTIR methods were used to analyze the liquid product and pyrolysis gas derived from PAM, respectively. During the pyrolysis treatment process of SS, the decomposing products’ flocculants may react with that of SS, as reported by our previous study of SS treatment by HTC. Therefore, in the section of pyrolysis experiment, SS and mixtures of PAM and SS were designed to evaluate the interaction of pyrolysis products (Qi et al., 2022). The results obtained in this study will reveal the conversion process of PAM during the HTC and pyrolysis processes, providing supporting data for hazardous substance control during the thermal treatment processes of SS.
2 Materials and methods
2.1 Materials preparation
cPAM (MW = 8–15 × 106, cationic degree = 10–60%, linear-chain) used in this study was purchased from Macklin (Shanghai, China). SS was collected from a pilot plant with a capacity of 10 m3/d using the A2O process. The collected SS was filtered using centrifugation and oven drying.
2.2 SS thermal treatment by HTC and pyrolysis
HTC was treated in a high-pressure reactor with a working volume of 1 L (WHFS-1L, Weihai, China). In each experiment, the reactor was loaded with 2 g/L cPAM. The heating program of the reactor was from ambient to target temperature at a rate of 2 °C/min and then kept for 60 min. The cooling process was from target temperature to 85 °C at a rate of 5 °C/min and was maintained at 85 °C until removed from the reactor. After the reactor cooled to 85 °C, the mixture consisting of unreacted cPAM colloid and liquid was separated by Whatman cellulosic filter paper on a Buchner funnel. The aqueous phase was collected for further analysis. Batch HTC treatment under the same condition was repeated three times, and the results of water quality were expressed as the mean value. Pyrolysis experiments of PAM were conducted by a TGA (TGA/DSC 3+, Mettler Toledo, Switzerland) instrument coupled with an FTIR spectrophotometer (Vertex 70, Bruker, Germany). The mass of the cPAM loaded was controlled at 5 mg. The pyrolysis heating program was from 30 °C to 1000 °C at a heating rate of 10 °C/min with a nitrogen flow rate of 60 mL/min. For pyrolysis of the PAM and SS mixture, the mass ratio of SS to PAM was precisely controlled at 1:1. To enhance the homogeneity of the mixture, SS was first blended with 10% (w/v) PAM solutions, followed by freeze-drying.
2.3 Analytical methods
2.3.1 TOC, TN, NH4+-N, and pH analysis of the liquid phase
TN and NH4+-N were measured according to our previous research (Wang et al., 2021). TOC was measured using high temperature combustion (TOC-L CPH/CPN, Shimadzu, Japan). pH was measured using a pH meter (PHS-3C, Leici Instruments Shanghai, China).
2.3.2 LC-MS/MS analysis of the liquid phase derived from HTC-treated PAM
LC-MS/MS analysis was performed on Dionex Ultimate 3000 ultrahigh-performance liquid chromatography (UHPLC) instrument coupled with a Thermo Q-ExActive™ Plus Orbitrap™ high-resolution mass spectrometer (Thermo Fisher Scientific). The analytes were separated by an Acquity UPLC HSS T3 column (100 × 2.1 mm, 1.7 μm particle size) maintained at 40 °C and eluted with a mobile phase consisting of (A) ammonium formate solution containing 0.05% formic acid and (B) acetonitrile at a flow rate of 0.35 mL/min. A gradient elution program was as follows: 0 ∼ 0.5 min, 2% B; 0.5–2.0 min, 2% B ∼ 30% B; 2.0–6.0 min, 30% B-40% B; 6.0–13. 0 min, 40% B-70% B; 13.0–16. 0 min, 70% B-98% B; 16.0–18.0 min, 98% B; 18.0–18.5 min, 98% B-2% B; 18.5–20.0 min, 2% B. MS/MS was performed with an electrospray (ESI) interface in the positive ion mode. Mass parameters were as follows: spray voltage, 3500 V; sheath gas flow, 35 L/min; auxiliary gas flow, 10 L/min; temperature, 320 °C; scan mode, full MS/dd-MS2; scan range m/z, 70–1,050. Thermo Compound Discover 2.0 combined with the m/z Cloud library was used to match fragments and filter out the components with a matching degree greater than 70%. For specific compounds, the LCMS data under the five conditions of PAM, HTC150, HTC180, HTC210, and HTC240 were normalized in Origin Lab (version 2018), and heatmaps were obtained to evaluate relative contents within the samples under different conditions.
2.3.3 TG-FTIR analysis of PAM
TG-FTIR analysis was conducted by a TGA (TGA/DSC 3+, Mettler Toledo, Switzerland) instrument coupled with an FTIR spectrophotometer (Vertex 70, Bruker, Germany). The FTIR spectra of gaseous products were recorded every 0.22 min at a resolution of 1.92 cm−1 with a wavenumber range from 4,000 to 600 cm−1.
2.4 Statistical analysis
Statistical analysis of the liquid-phase products from HTC was performed using SPSS 20.0 software. Analysis of variance (ANOVA) was employed to assess the differences among various treatments. According to the ANOVA results, mean values labeled with the same letter indicate no significant difference. Additionally, Duncan’s range test was conducted to compare the differences, with a significance level set at 5%. All data, except where otherwise stated, are presented as the mean of three replicates.
3 Results and discussion
3.1 General characteristics of liquid phase products derived from HTC-treated PAM
The elements’ conversion pathway during the hydrothermal treatment process of SS was significantly affected by temperature, and the product distribution and properties were also strongly dependent on the treating temperature (Wang et al., 2020; Huang et al., 2021). Therefore, the appropriate temperature was important for SS treatment by HTC (Xu et al., 2020). To reveal the hydrothermal conversion pathway of PAM under different temperatures, batch HTC experiments using PAM as the substrate were conducted with a temperature range between 150 °C and 240 °C.
The appearance of hydrothermal-treated PAM solutions at different temperatures is compared in Figure 1. Obviously, the turbidity and color of the derived PAM solutions changed under different temperatures. The turbidity of the obtained PAM solution at 150 °C was highest, which may be ascribed to the decreased hydrophobicity of PAM degradation products after the loss of hydrophilic groups such as -NH2 at this temperature. As the temperature increases above 180 °C, the increased transparency of the PAM solution may be due to the further decomposition of hydrophobic substances and the increased solubility of degradation products in water. In addition, the color of the PAM solution after HTC treatment gradually deepened with the increase of temperature, which may be due to a color reaction, such as Maillard reaction, occurring at high temperature because the thermal decomposition products of PAM simultaneously contained carbonyl compounds and amines (Supplementary Tables S1, S2).
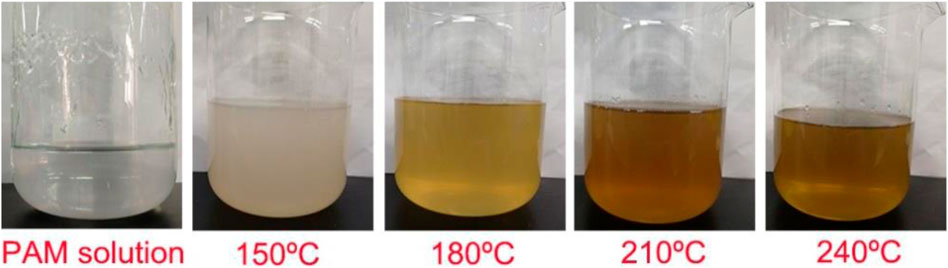
Figure 1. Images of PAM solution and the liquid derived from HTC-treated cPAM at different temperatures.
The properties of the liquid phase obtained at different treatment temperatures were analyzed, and the results are shown in Figure 2. As can be seen from Figure 2, the contents of TOC, TN, and NH4+-N in the liquid phases increased gradually with a reaction temperature between 150 °C and 210 °C, which was due to the hydrolysis of amide groups and the degradation of PAM polymer. However, the NH4+-N content decreased slightly as the temperature continued to rise to 240 °C, which may be due to more ammonia being evaporated to the gas phase under this condition. The pH values of the liquid phase were affected by the hydrolysis of amide groups and the degradation of polymers; the pH value of liquid phase can reflect the hydrothermal degradation of PAM to a certain extent. With the increase of the reaction temperature from 150 °C to 180 °C, the pH and NH4+-N/TN ratio of the liquid-phase increased gradually, with the pH and NH4+-N/TN ratio highest at 180 °C. The pH and NH4+-N/TN ratio showed a downward trend, with a temperature range of 180 °C to 240 °C. In the lower temperature range (<180 °C), the hydrothermal conversion of PAM was mainly based on the hydrolysis of amide groups to produce ammonia without producing small-molecule organic acids. Therefore, the contribution of organic acid to the acidity of the liquid phase was relatively weak. As the reaction temperature increased (>180 °C), the degradation and dissociation of organic acids was enhanced and the pH of the liquid phase decreased gradually.
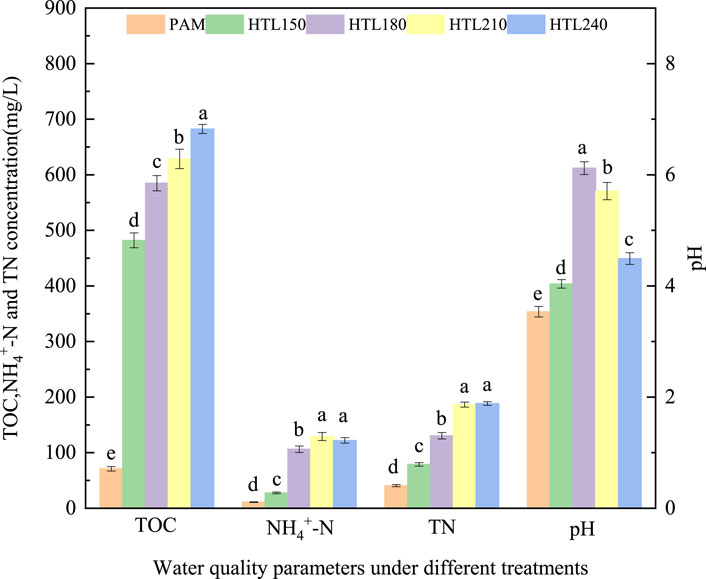
Figure 2. Characteristics of raw PAM solution and the liquid derived from HTC treatment.
PAM deamination will occur at elevated temperatures, generating carboxylic acid and ammonia under acidic conditions. The ratio of NH4+-N/TN can roughly reflect the degree of PAM deamination. When the temperature was below 150 °C, the concentration of NH4+-N in the liquid phase was relatively low, suggesting that PAM deamination was weak, with less ammonia being hydrolyzed. When the temperature was higher than 180 °C, the ratio of NH4+-N/TN was higher than 0.5, indicating that more NH4+-N was produced from PAM by deamination. Through calculation, the contributions of PAM to the NH4+-N and TN of HTC liquid phase products were 53.9–61.1 mg/g PAM and 65.3–94.2 mg/g PAM, respectively under 180–240 °C conditions.
3.2 LC-MS analysis of the liquid phase derived from HTC-treated PAM
To evaluate the hydrothermal conversion products of PAM under different temperatures, the components in the liquid phase were measured by LC-MS and semi-quantitatively analyzed based on the intensity of the TIC peak areas. For the liquid phases obtained at different temperatures, the intensity of peaks with specific retention times on the TIC curves is shown in Figure 3. It can be seen there that the hydrothermal degradation products of PAM exhibit differences at R.T. 0–5 min and R.T. 10 min at different temperatures. In order to compare the differences of components in the liquid phase more clearly, the 81 compounds detected by LC-MS were divided into two groups: nitrogenous and carbonaceous compounds. Detailed information of these 81 compounds is shown in Supplementary Tables S1 and S2. According to the TIC intensities of the two classes of compounds, heat maps reflecting the relative contents of PAM hydrothermal degradation products at different temperatures were drawn (Figure 4).
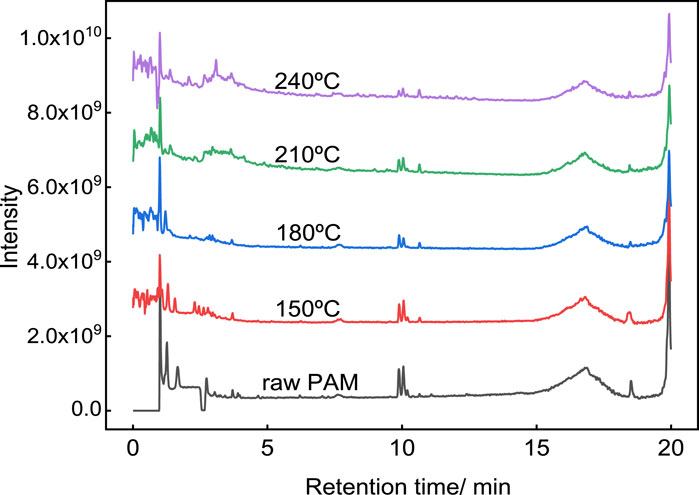
Figure 3. TIC spectrum of the PAM solution and the liquid derived from HTC-treated PAM at different temperature.
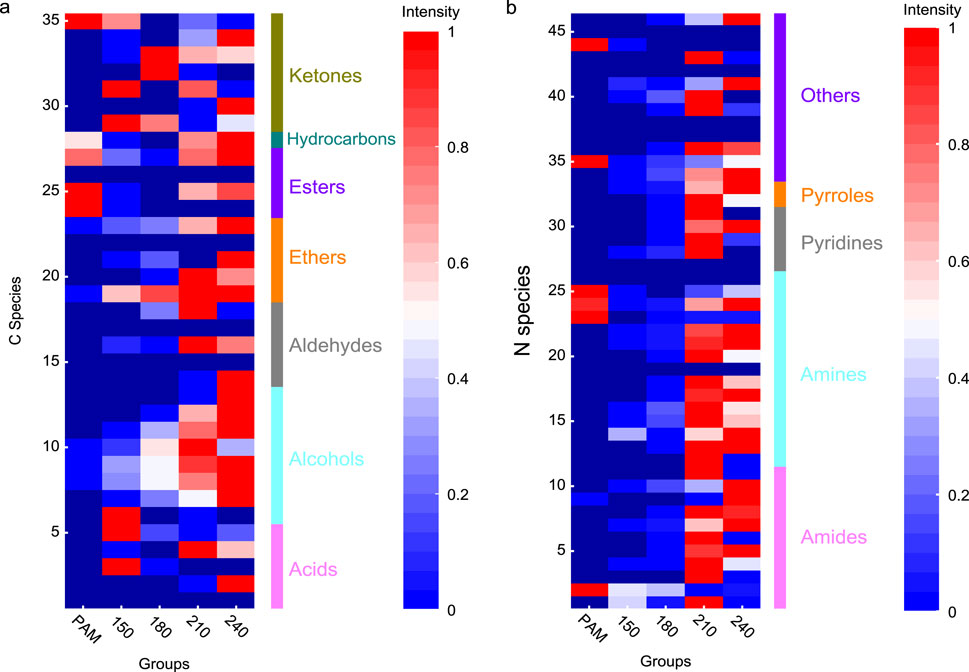
Figure 4. Carbon and nitrogen species in the liquid phase derived from HTC-treated PAM under different conditions. (a) C species. (b) N species.
As shown in Figure 4, 35 carbonaceous compounds were classified into seven groups: ketones, hydrocarbons, esters, ethers, aldehydes, alcohols, and acids. Compared with the control group, there was a certain increase in the type and intensity of components with increased reaction temperature. Overall, ketones, ethers, aldehydes, alcohols, and acids increased to varying degrees with increased temperature. Interestingly, we found that among nine kinds of alcohols in Supplementary Table S1 (No. 6–14), seven belong to PEG polymers with different degrees of polymerization. The formation of PEGn may derive from the cationic pendant group in cPAM because the acylamino group under hydrogen process leads to the generation of carboxylic groups with 3N carbons (Chen et al., 2021). The 46 nitrogenous compounds were classified into five groups: amides, amines, pyridines, pyrroles, and others. Among the five kinds of nitrogen-containing compounds, 26 compounds belonged to amides and amines, accounting for approximately 57% of the total nitrogen-containing compounds. The formation of amines and amides from the -CONH-structure of PAM was similar to protein hydrolysis (Xiao et al., 2019). The formation of pyridines, pyrroles, and other nitrogen-containing components may come from further reactions of these products at high temperatures.
3.3 TG-FTIR analysis of PAM pyrolysis products
The chemical composition of SS used in this study was measured, and the results are shown in Table 1. As shown there, the formula of SS used in this study can be calculated as C3.57H5.46O2.27N0.46S0.01, which mainly consisted of microorganism biomass. Proximate analysis suggested the volatile matter and fixed carbon contents of SS were relatively high and the ash content low.
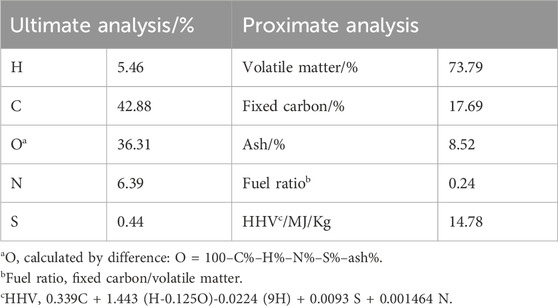
Table 1. Chemical properties of sewage sludge used in this study.
In order to study the thermal stability characteristics of SS, PAM, and the mixture, TG-FTIR was characterized in a nitrogen environment from 30 °C to 1,000 °C. As shown in Figure 5a, the decomposition process of SS can be divided into five stages: 30–150 °C (DTG peak 112 °C), 150–267 °C (DTG peak 281 °C), 267–440 °C (DTG peak 422 °C), 440-550 °C (DTG peak 475 °C), and 850–1,000 °C (DTG peak 936 °C). For PAM, as can be seen from the TG-DTG curve, the decomposition process can also be divided into five stages: 30–116 °C, 116–329 °C (DTG peak 273 °C), 329–c. 530 °C (DTG peak 392 °C), c. 720–914 °C (DTG peak 880 °C), and 914 °C–1,000 °C. For the mixture of SS and PAM, the decomposition process can also be divided into three stages due to the overlapping of the peaks of the SS and PAM: 30–78 °C, 78–650 °C (DTG peak 277 °C), and 650 °C–1,000 °C (DTG peak 878 °C). In order to clarify the thermal degradation products of various substrates at different thermal degradation stages, 2D FTIR spectra at specific temperatures were separated from the subsequent series 3D FTIR results (Supplementary Table S1). For SS, the first mass loss stage was mainly caused by dehydration (Lin et al., 2016). At the second mass loss stage, the main decomposition product of SS was CO2 (wavenumber 2360 and 2,310 cm−1) (Yang et al., 2016), in addition to a small amount of NH3 (wavenumber 966 and 931 cm−1) (Guo et al., 2021) and HCN (wavenumber 714 cm−1) (Chen et al., 2016). At the third mass loss stage of SS, alkyl carbon (wavenumber 2927 and 2,856 cm−1) (Yang and Chen, 2020) began to appear in the products, and the absorption peak of NH3 and HCN also increased. In the subsequent fourth and fifth stages, the absorption peaks of CO2, NH3, and HCN weakened, the absorption peaks of alkyl carbon increased, and CO absorption (wavenumber 2183 and 2,105 cm−1) peaks appeared. The total weight loss of SS during pyrolysis at 30 °C–1,000 °C is around 75%, which differs from the results reported by Jayaraman and Gökalp (2015). The mass loss stages of PAM were similar to results reported by Fu et al. (2021). The first mass loss stage was attributed to the removal of adsorbed water and organic solvents on PAM (Tutaş et al., 1991). The second mass loss stage of PAM was proposed due to intramolecular decomposition (Fu et al., 2021; Caglar et al., 2017), with CHx (wavenumber 2,975, 2,925, 2,823, and 2,775 cm−1) (Yang and Chen, 2020; Bitire et al., 2021) and C=C (wavenumber 1617 cm−1) removal as shown in Supplementary Table S1b. The third and fourth mass loss stage of PAM was mainly due to the amides (C=O at wavenumber 1701 cm−1 and C-N at wavenumber 1170 cm−1) (Guo and Bustin, 1998) and CO2 release (Supplementary Table S1b). In the last mass loss stage, the absorption was mainly caused by amides, CO2, and CO. Interestingly, both PAM and SS generated absorption peaks of NH3 and HCN during TG testing. For the mixture of SS and PAM, the mass loss stages were overlapped, and only two typical mass loss stages were observed. At the first mass loss stage, the products mainly included alkyl carbon, CO2, and a small amount of NH3 and HCN. At the second mass loss stage, the products were mainly CO2, CO, and a small amount of NH3 and HCN. After multistage mass loss, secondary dehydration probably occurred, with approximately 26% (SS), 7% (PAM), and 10% (mixture of SS and PAM) of charcoal remaining as solid residues, mainly consisting of biochar and ash (Gai et al., 2013).
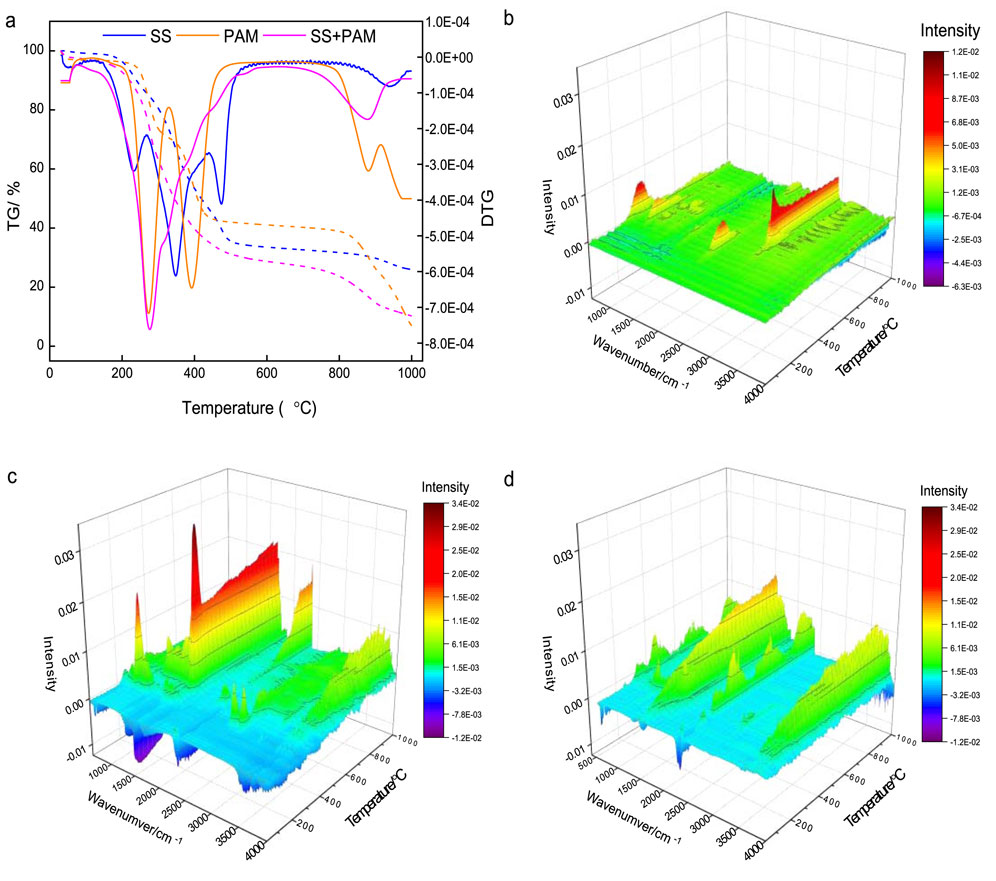
Figure 5. TG-FTIR analysis of SS, PAM, and the mixture of SS and PAM. (a) TG-DTG curves of three substrates. (b) 3D FTIR spectrum obtained from SS. (c) 3D FTIR spectrum obtained from PAM. (d) 3D FTIR spectrum obtained from the mixture of SS and PAM.
To more comprehensively reveal the volatile matter during the thermal weight loss process of the three substrates, the subsequent 3D FTIR spectra (Figures 5b–d) were analyzed. As shown in Figure 5b, four main IR absorption regions in the 3D FTIR spectrum of SS TG test products were identified. Region 1 (200–400 °C and 670 cm−1) was probably associated with inorganic compounds such as SiO2, and region 2 (300–600 °C and 930 and 966 cm−1) was attributed to NH3 release. Region 3 (200–400 °C and 2,310 and 2,360 cm−1) corresponded to CO2 and region 4 (400–1,000 °C and 2,852, 2,935, and 3,015 cm−1) was due to the–CHx stretching vibration. As for PAM shown in Figure 5c, there were five distinct absorption regions in the 3D FTIR spectrum. Region 1 (200–400 °C and 932 and 966 cm-1) corresponding to NH3 suggested that NH3 was released at a relative low temperature during PAM pyrolysis process. Regions 2 (300–1,000 °C and 1,610 and 1700 cm−1) and region 3 (600–1,000 °C and 1,557, 1,652, and 2,360 cm−1) were probably ascribed to amide groups. Region 4 (600–1,000 °C and 2,360 cm−1) suggested that CO2 would be released during the pyrolysis process, and region 5 (400–1,000 °C and 2,850–3,000 cm−1) was caused by the –CHx. As for the mixture of SS and PAM shown in Figure 5d, three distinct absorption regions in the 3D FTIR spectrum were selected. The characteristic of 3D FTIR absorption peaks was not the superposition of SS and PAM FTIR absorption peaks, and the absorption intensity of the released substances changed continuously with temperature. Region 1 (200–1,000 °C and approximately 1,550 and 1700 cm−1) attributed to C=O and N-H suggested that amides would be released from the mixture during pyrolysis. Region 2 (200–1,000 °C and approximately 2,350 cm−1) indicated that the CO2 was released from the carboxyl groups of SS and PAM during pyrolysis process, and region 3 (200–1,000 °C and 3,100–3,600 cm−1) was attributed to O–H and N–H of alcohols, and amides and amines (Chan and Wang, 2018).
In order to better analyze the absorption intensity tendencies of some functional groups with the increase of temperature, the evolution of the absorbance intensity of nine typical functional groups was chosen for primary analysis as a function of temperature (Figure 6). Four main carbonaceous gases emitted from the thermal decomposition process of PAM were CO2, CO, hydrocarbon, and C=O-containing products (acids and esters). The temperature range of CO2 generation by PAM pyrolysis was divided into three distinct ranges (approximately 400 °C, 600 °C, and 900 °C), which was derived from carbonyl pyrolysis. The temperature of CO2 generated by SS pyrolysis ranged from 200 °C to 400 °C, which is consistent with previous experimental results. CO pyrolysis products were mainly produced at a high-temperature stage (approximately 900 °C) because CO was produced by CO2 reduction by C in the solid phase. Hydrocarbon production by PAM pyrolysis was at approximately 260 °C and 380 °C, generated by side chains and skeletons, while SS pyrolysis produced hydrocarbons at approximately 480 °C. C=O-containing species released from PAM was at approximately 400 °C, which corresponded to our previous results (Qi et al., 2022). Five main nitrogen-containing gases—NH3, HCN, NO2, NO, and N2O—emitted from the thermal decomposition process of PAM at different temperature were also evaluated. As shown in Figure 6, NH3 and NO2 were the main nitrogen-containing products during PAM pyrolysis. NH3 was mainly produced at approximately 250 °C, while NO2 production was always at a high level when the temperature was above 400°C.
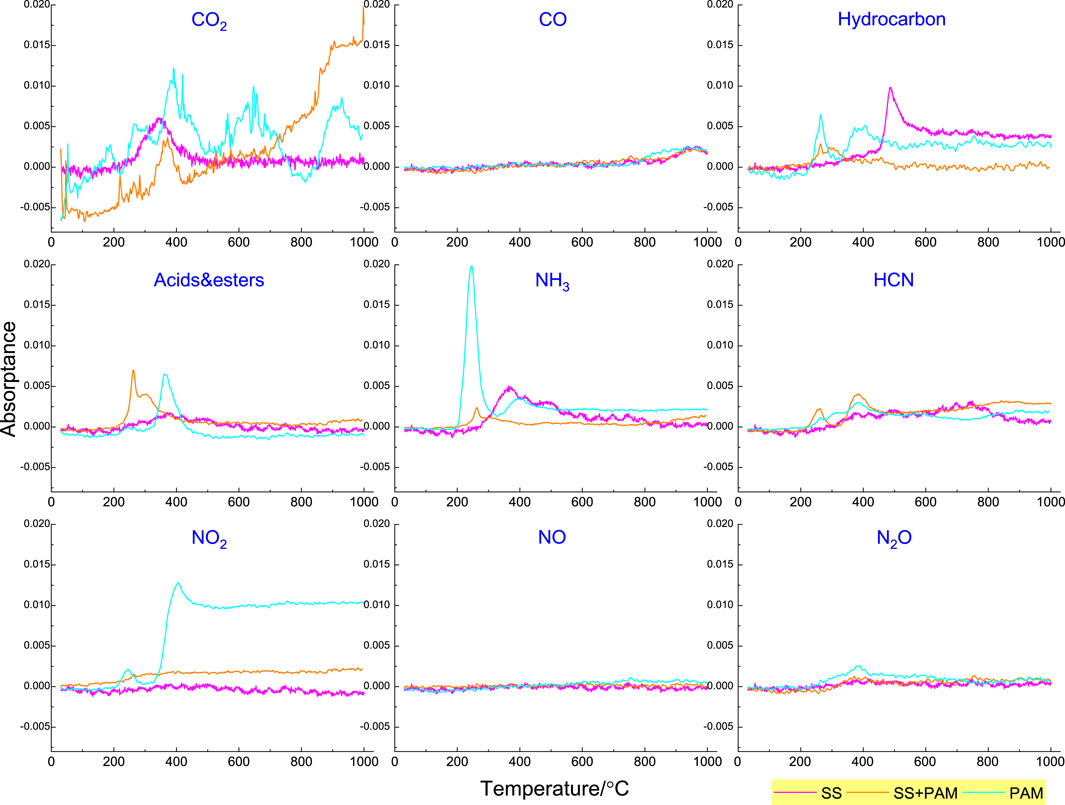
Figure 6. Evolution of gaseous products containing C and N species during PAM pyrolysis at a heating rate of 10 °C/min.
3.4 Environmental implications of the results of HTC and pyrolysis treatment of PAM
These research results of the HTC and pyrolysis treatment of PAM provide have environmental implications for guiding the thermal treatment of SS in wastewater treatment plants. For the HTC treatment of PAM, understanding how temperature affects the conversion pathway and product properties of PAM provides crucial insights for wastewater treatment. We can optimize the degradation of PAM by controlling the treatment temperature precisely. The identification and analysis of liquid-phase products by LC-MS provide valuable information for environmental monitoring. The 81 compounds identified enable the development of more targeted water quality assessment methods. The results are helpful for formulating appropriate environmental standards and creating advanced treatment technologies to remove or transform these potentially harmful substances before they enter the environment.
For the TG-FTIR analysis of PAM pyrolysis products, a detailed understanding of the decomposition stages of PAM, SS, and their mixtures is beneficial for solid waste management. By understanding the gaseous products released during pyrolysis, such as the specific temperature ranges for the emission of carbonaceous and nitrogen-containing gases, measures can be taken to capture and treat these emissions, thereby reducing air pollution and its contribution to climate change.
4 Conclusion
The thermal transformation of PAM during HTC and pyrolysis was investigated in this study, and the main conclusions are as follows.
(i) Under HTC reaction conditions below 150 °C, PAM deamination (side chain decomposition) and polymer cleavage (backbone decomposition) were weak. As the reaction temperature increased to above 180 °C, the deamination of PAM was strengthened, and the pH of liquid phase decreased because the high molecular polybasic acids decomposed into small organic acids. The components of the liquid phase were complex, with nitrogen-free compounds including alcohols, aldehydes, acids, and esters. Nitrogen-containing compounds mainly consisted of amides and amines, as well as pyridines, pyrroles, and other nitrogen-containing components.
(ii) The decomposition process of PAM can be divided into five stages. The first mass-loss stage was mainly attributed to the removal of adsorbed water and organic solvents on PAM, and the second mass loss stage of PAM was proposed due to intramolecular decomposition, with CHx and C=C removal. The third and fourth mass loss stage was mainly due to the amides and CO2 release, and the last mass loss was caused by amides, CO2, and CO.
Data availability statement
The original contributions presented in the study are included in the article/Supplementary Material; further inquiries can be directed to the corresponding author.
Author contributions
GQ: Formal Analysis, Methodology, Conceptualization, Supervision, Data curation, Writing – original draft, Software, Investigation, Project administration, Visualization, Resources, Funding acquisition, Validation, Writing – review and editing.
Funding
The author(s) declare that financial support was received for the research and/or publication of this article. This work was supported by the Engineering Laboratory of Wetland Agricultural Ecology of Shandong Province (2021GXRC007), the Key R&D Projects of Shandong Province (2020CXGC010804), the Natural Science Foundation of Shandong Province (ZR2022QC227), Science & Technology Specific Projects in Agricultural High-tech Industrial Demonstration Area of the Yellow River Delta (2022SZX44), and the Agricultural Science and Technology Innovation Project of Shandong province (CXGC2023B01).
Conflict of interest
The authors declare that the research was conducted in the absence of any commercial or financial relationships that could be construed as a potential conflict of interest.
Generative AI statement
The authors declare that no Generative AI was used in the creation of this manuscript.
Publisher’s note
All claims expressed in this article are solely those of the authors and do not necessarily represent those of their affiliated organizations, or those of the publisher, the editors and the reviewers. Any product that may be evaluated in this article, or claim that may be made by its manufacturer, is not guaranteed or endorsed by the publisher.
Supplementary material
The Supplementary Material for this article can be found online at: https://www.frontiersin.org/articles/10.3389/fceng.2025.1605228/full#supplementary-material
References
Aguilar, M., Sáez, J., Lloréns, M., Soler, A., Ortuño, J., Meseguer, V., et al. (2005). Improvement of coagulation–flocculation process using anionic polyacrylamide as coagulant aid. Chemosphere 58 (1), 47–56. doi:10.1016/j.chemosphere.2004.09.008
Bitire, S. O., Jen, T.-C., and Belaid, M. (2021). Transesterification of parsley seed oil using a green catalyst: considering the optimization process and modeling. Int. J. Sustain. Energy 40 (10), 977–1001. doi:10.1080/14786451.2021.1890737
Caglar, B., Coldur, F., Caglar, S., Cubuk, O., Tabak, A., and Topcu, C. (2017). Structural, thermal and morphological properties of a novel poly (acrylamide-co-methacrylic acid)/organoclay nanocomposite. Inorg. Nano-Metal Chem. 47 (3), 360–364. doi:10.1080/15533174.2016.1186063
Cantrell, K. B., Hunt, P. G., Uchimiya, M., Novak, J. M., and Ro, K. S. (2012). Impact of pyrolysis temperature and manure source on physicochemical characteristics of biochar. Bioresour. Technol. 107, 419–428. doi:10.1016/j.biortech.2011.11.084
Chan, W. P., and Wang, J.-Y. (2018). Formation of synthetic sludge as a representative tool for thermochemical conversion modelling and performance analysis of sewage sludge–Based on a TG-FTIR study. J. Anal. Appl. Pyrolysis 133, 97–106. doi:10.1016/j.jaap.2018.04.015
Chen, G., Ma, X., Lin, M., Peng, X., and Yu, Z. (2016). Pollutant emission characteristics and interaction during low-temperature oxidation of blended coal. J. Energy Inst. 89 (1), 40–47. doi:10.1016/j.joei.2014.12.001
Chen, H., Chen, Z., Nasikai, M., Luo, G., and Zhang, S. (2021). Hydrothermal pretreatment of sewage sludge enhanced the anaerobic degradation of cationic polyacrylamide (cPAM). Water Res. 190, 116704. doi:10.1016/j.watres.2020.116704
Dai, X., Luo, F., Zhang, D., Dai, L., Chen, Y., and Dong, B. (2015). Waste-activated sludge fermentation for polyacrylamide biodegradation improved by anaerobic hydrolysis and key microorganisms involved in biological polyacrylamide removal. Sci. Rep. 5 (1), 11675. doi:10.1038/srep11675
El Karsani, K. S., Al-Muntasheri, G. A., Sultan, A. S., and Hussein, I. A. (2014). Impact of salts on polyacrylamide hydrolysis and gelation: new insights. J. Appl. Polym. Sci. 131 (23). doi:10.1002/app.41185
Fonts, I., Gea, G., Azuara, M., Ábrego, J., and Arauzo, J. (2012). Sewage sludge pyrolysis for liquid production: a review. Renew. Sustain. energy Rev. 16 (5), 2781–2805. doi:10.1016/j.rser.2012.02.070
Fu, X., Yang, Q., and Zhang, Y. (2021). Thermal decomposition behavior and mechanism study of cationic polyacrylamide. J. Therm. Analysis Calorim. 146, 1371–1381. doi:10.1007/s10973-020-10131-0
Gai, C., Zhang, Y., Chen, W. T., Zhang, P., and Dong, Y. (2013). Thermogravimetric and kinetic analysis of thermal decomposition characteristics of low-lipid microalgae. Bioresour. Technol. 150, 139–148. doi:10.1016/j.biortech.2013.09.137
Guo, J., Zheng, L., Li, Z., Zhou, X., Cheng, S., Zhang, L., et al. (2021). Effects of various pyrolysis conditions and feedstock compositions on the physicochemical characteristics of cow manure-derived biochar. J. Clean. Prod. 311, 127458. doi:10.1016/j.jclepro.2021.127458
Guo, Y., and Bustin, R. M. (1998). Micro-FTIR spectroscopy of liptinite macerals in coal. Int. J. Coal Geol. 36 (3-4), 259–275. doi:10.1016/s0166-5162(97)00044-x
Huang, J., Wang, Z., Qiao, Y., Wang, B., Yu, Y., and Xu, M. (2021). Transformation of nitrogen during hydrothermal carbonization of sewage sludge: Effects of temperature and Na/Ca acetates addition. Proc. Combust. Inst. 38 (3), 4335–4344. doi:10.1016/j.proci.2020.06.075
Jayaraman, K., and Gökalp, I. (2015). Pyrolysis, combustion and gasification characteristics of miscanthus and sewage sludge. Energy Convers. Manag. 89, 83–91. doi:10.1016/j.enconman.2014.09.058
Lin, Y., Liao, Y., Yu, Z., Fang, S., Lin, Y., Fan, Y., et al. (2016). Co-pyrolysis kinetics of sewage sludge and oil shale thermal decomposition using TGA–FTIR analysis. Energy Convers. Manag. 118, 345–352. doi:10.1016/j.enconman.2016.04.004
Lv, S., Peng, W., Cao, Y., Liu, S., Wang, W., Fan, G., et al. (2022). Synthesis and characterisation of a novel pH-sensitive flocculant and its flocculation performance. J. Mol. Liq. 348, 118480. doi:10.1016/j.molliq.2022.118480
Ma, Q., Shuler, P. J., Aften, C. W., and Tang, Y. (2015). Theoretical studies of hydrolysis and stability of polyacrylamide polymers. Polym. Degrad. Stab. 121, 69–77. doi:10.1016/j.polymdegradstab.2015.08.012
Moradi-Araghi, A., Hsieh, E., and Westerman, I. (1988). “Role of imidization in thermal hydrolysis of polyacrylamides,” in Water-soluble polymers for Petroleum recovery (Springer), 271–278.
Moussas, P., and Zouboulis, A. (2009). A new inorganic–organic composite coagulant, consisting of polyferric sulphate (PFS) and polyacrylamide (PAA). Water Res. 43 (14), 3511–3524. doi:10.1016/j.watres.2009.05.015
Qi, G., Wang, X., Shen, Y., Liu, X., Asraful Alam, M., Liu, B., et al. (2022). Effect of different flocculants on the characteristics of hydrochar and hydroliquid derived from the hydrothermal treated active sludge. A comparative study. J. Environ. Chem. Eng. 10 (3), 107514. doi:10.1016/j.jece.2022.107514
Tutaş, M., Sağlam, M., and Yüksel, M. (1991). Investigation of pyrolysis products of polyacrylamide by pyrolysis—gas chromatography. J. Anal. Appl. pyrolysis 22 (1-2), 129–137. doi:10.1016/0165-2370(91)85012-v
Uranta, K., Russell, P., and Hamad, F. (2018). Determining safe maximum temperature point (SMTP) for polyacrylamide polymer (PAM) in saline solutions. J. Oil, Gas Petrochem. Sci. 1 (1), 1–8. doi:10.30881/jogps.00004
Wang, D., Liu, X., Zeng, G., Zhao, J., Liu, Y., Wang, Q., et al. (2018). Understanding the impact of cationic polyacrylamide on anaerobic digestion of waste activated sludge. Water Res. 130, 281–290. doi:10.1016/j.watres.2017.12.007
Wang, L., Chang, Y., and Li, A. (2019). Hydrothermal carbonization for energy-efficient processing of sewage sludge: a review. Renew. Sustain. Energy Rev. 108, 423–440. doi:10.1016/j.rser.2019.04.011
Wang, X., Shen, Y., Liu, X., Ma, T., Wu, J., and Qi, G. (2021). Fly ash and H2O2 assisted hydrothermal carbonization for improving the nitrogen and sulfur removal from sewage sludge. Chemosphere 290, 133209. doi:10.1016/j.chemosphere.2021.133209
Wang, Z., Zhai, Y., Wang, T., Peng, C., Li, S., Wang, B., et al. (2020). Effect of temperature on the sulfur fate during hydrothermal carbonization of sewage sludge. Environ. Pollut. 260, 114067. doi:10.1016/j.envpol.2020.114067
Xiao, H., Zhai, Y., Xie, J., Wang, T., Wang, B., Li, S., et al. (2019). Speciation and transformation of nitrogen for spirulina hydrothermal carbonization. Bioresour. Technol. 286, 121385. doi:10.1016/j.biortech.2019.121385
Xiong, B., Loss, R. D., Shields, D., Pawlik, T., Hochreiter, R., Zydney, A. L., et al. (2018). Polyacrylamide degradation and its implications in environmental systems. NPJ Clean. Water 1 (1), 17. doi:10.1038/s41545-018-0016-8
Xu, D., Han, X., Chen, H., Yuan, R., Wang, F., and Zhou, B. (2020). New insights into impact of thermal hydrolysis pretreatment temperature and time on sewage sludge: structure and composition of sewage sludge from sewage treatment plant. Environ. Res. 191, 110122. doi:10.1016/j.envres.2020.110122
Yang, B., and Chen, M. (2020). Py–FTIR–GC/MS analysis of volatile products of automobile shredder residue pyrolysis. Polymers 12 (11), 2734. doi:10.3390/polym12112734
Keywords: polyacrylamide, sewage sludge treatment, hydrothermal carbonization, pyrolysis, thermochemical transformation
Citation: Qi G (2025) Transformation of polyacrylamide during hydrothermal carbonization and pyrolysis. Front. Chem. Eng. 7:1605228. doi: 10.3389/fceng.2025.1605228
Received: 03 April 2025; Accepted: 28 April 2025;
Published: 29 May 2025.
Edited by:
Chang Geun Yoo, SUNY College of Environmental Science and Forestry, United StatesReviewed by:
Jing Zhang, East China University of Science and Technology, ChinaSiqi Tang, University of Illinois at Urbana-Champaign, United States
Copyright © 2025 Qi. This is an open-access article distributed under the terms of the Creative Commons Attribution License (CC BY). The use, distribution or reproduction in other forums is permitted, provided the original author(s) and the copyright owner(s) are credited and that the original publication in this journal is cited, in accordance with accepted academic practice. No use, distribution or reproduction is permitted which does not comply with these terms.
*Correspondence: Gaoxiang Qi, dmlwX3FpZ3hAMTYzLmNvbQ==