 Victor Manuel Maytorena-Soria1
 David Antonio Buentello-Montoya
- 1Departamento de Ingeniería Química y Metalurgia, Universidad de Sonora, Hermosillo, Mexico
- 2Tecnologico de Monterrey, Escuela de Ingenieria y Ciencias, Jalisco, Mexico
- 3Tecnologico de Monterrey, Escuela de Ingenieria y Ciencias, Nuevo Leon, Mexico
Gasification is a technology that can produce high-value fuels and chemicals from waste biomass, with challenges mainly associated to energy required and scaling up. At the same time, solar-driven gasification can tackle the problems associated to the energy required by allothermal systems, but its feasibility requires not only technological maturation, but also a strategic location. This work analyses the potential of solar gasification in Mexico using thermodynamic simulations, based on the Gibb’s Free Energy method, and geographical and demographic information. Results indicate that states with large waste biomass production (e.g., Sinaloa and Veracruz) are better suited for solar gasification than states with a large direct normal irradiance (e.g., Sonora), particularly when based on the H2/CO ratio of the syngas. An index (Per capita Energy Self-sufficiency Index, PESI) was defined to establish a metric for the potential of different states for solar gasification, and it was found that several states (for example, Sinaloa with 480% and Sonora with 245%) can produce more energy from solar gasification than their per capita consumption.
1 Introduction
Gasification is a technology where feedstock (such as coal, biomass or plastic) is decomposed under a controlled oxidation atmosphere (usually air or steam) to produce a mixture of gases, composed of H2, CO, CH4 and CO2, called syngas (Buentello-Montoya et al., 2023a). The decomposition of biomass during gasification is endothermic, that is, requires a source of energy to drive the reactions. Depending on the oxidizing atmosphere, gasification can be autothermal (with oxygen or even air), where the energy released during the combustion stage can drive the process, or allothermal (with steam or CO2), which requires an external source of energy. Although syngas from steam gasification usually has better quality than air-produced syngas, steam gasification is limited by the energy required for steam production (Mousavi Rabeti et al., 2023; Nathan et al., 2017; Freda et al., 2022). However, even with its limitations, gasification remains an attractive technology due to the versatility of syngas, since it has different applications (Rafati et al., 2017).
At the same time, solar energy is basically limitless and could supply more than enough power to satisfy society’s needs (Maytorena and Buentello-Montoya, 2022). Concentrated solar power (CSP) uses irradiation coming from the sun to harness heat, which can be used for heat or electricity production (Maytorena and Buentello-Montoya, 2022); CSP technologies vary in applications, approaches and scales, depending on the purpose. Examples of CSP technologies are heliostat fields, dish Stirling and parabolic trough collectors (PTCs) (Loutzenhiser and Muroyama, 2017). CSP can be coupled with thermochemical biomass treatments like gasification (in what is called solar gasification) to tackle restrictive energy consumption. In solar gasification, radiation is harnessed directly by the feedstock (in direct heating processes) or by a heat transfer fluid (in indirect heating processes) (Nathan et al., 2017; Loutzenhiser and Muroyama, 2017; Maytorena and Buentello-Montoya, 2024; Abanades et al., 2021). Compared to conventional allothermal gasification, solar gasification is supplied of heat through concentrated solar power increasing the process cold gas efficiency and reducing the carbon footprint (Wieckert et al., 2013). However, when compared to other biomass conversion technologies such as pyrolysis or anaerobic digestion, solar gasification faces challenges in scalability, reactor design, the intermittency of solar energy and the resistance of the reactor materials. Pyrolysis and anaerobic digestion, for example, are commercially mature and easier to implement at small scales, but they typically yield lower-value products (for example, biogas with a relatively low energy density, in the case of anaerobic digestion (Pecchi and Baratieri, 2019)), require large energy inputs or extensive upgrading (Maytorena and Buentello-Montoya, 2024). Solar gasification offers the advantage of producing hydrogen-rich syngas with a reduced fossil energy footprint, but its technological maturity remains limited to pilot-scale demonstrations and can be circumstantial based on the availability of resources, leading to extensive research to increase the technology readiness level. Some experimental studies on solar gasification have been conducted worldwide, focusing on steam as the gasifying agent, followed by CO2 and, to a lesser extent, air or oxygen, as found in Table 1, where a summary of recent studies found in Scopus-indexed databases is included.
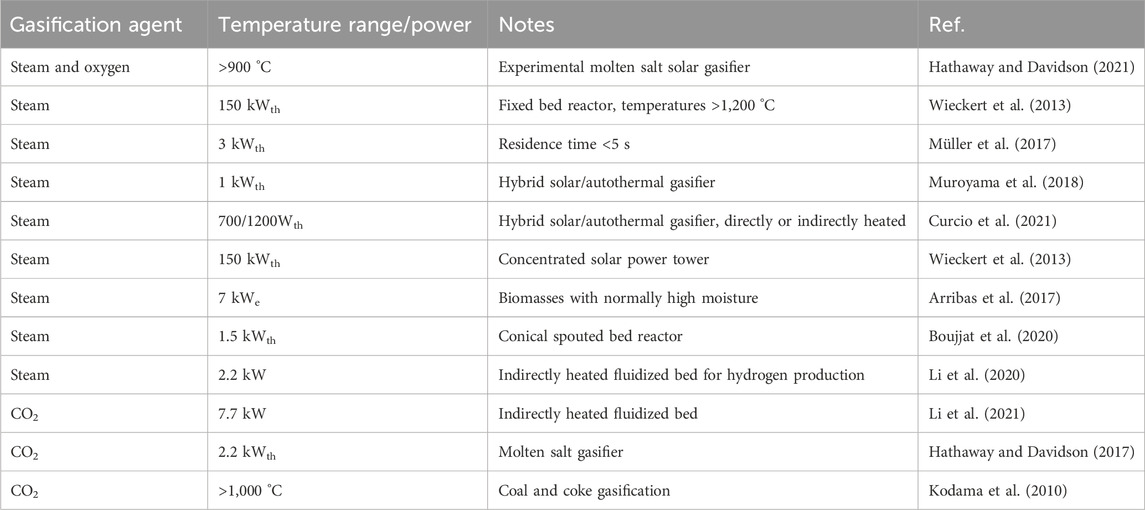
Table 1. Summary of experimental solar gasification studies reported between 2015 and 2025.
Although solar power can be relatively reliable in every location worldwide, the climatological characteristics favor some geographical locations (Global Solar Atlas, 2020). A particular case is Mexico, where based in the Global Solar Atlas, the World Bank has reported that around 0.1% of the total area is enough to produce enough energy to satisfy its needs (Global Solar Atlas, 2020; World Bank, 2020). Moreover, Mexico generates more than 30,000 Mtons of organic waste per year, which can serve as a decentralized feedstock for energy production from gasification, tackling constraints associated to resource availability (Molina-Guerrero et al., 2020; Aldana et al., 2014).
This work addresses research gaps by presenting a nationwide assessment of the geographic potential of solar-driven gasification in Mexico, moving beyond reactor-scale demonstrations to whole region analysis based on a simulation model. Since the hydrodynamics and transport phenomena associated with gasification can be heavily dependent on the biomass physical properties, a complete Computational Fluid Dynamics study considering different biomasses with variable composition across a whole country is prohibitively complicated. Similarly, kinetic studies usually consider biomass “lumps” or model compounds, hence, results can become complicated to relate with varying and diverse biomass composition. Therefore, thermodynamic equilibrium modeling is combined with information on state-level biomass availability and solar resource data to identify regions in Mexico where solar gasification could provide meaningful energy contributions or support alternatives such as hydrogen-based chemical production. For the analysis, calculations were conducted using thermodynamic simulations based on an in-house-developed Python code. The reported information can be relevant for engineers, scientists and stakeholders in different countries with similar scenarios. The integrated approach presents the potential relevance of combined CSP and waste-to-energy technologies in countries with both high solar resources and significant agricultural waste streams.
To provide an insight into the potential of solar gasification when compared to the autothermal technology using air (that is, non-solar), results are presented under the same conditions considering (Buentello-Montoya et al., 2023a) air and (Mousavi Rabeti et al., 2023) steam as gasification agents. The structure of the work is as follows. After the introduction, the methodology is conferred, starting with a description of the model employed in the simulations, followed by the methodologies used to assess the performance of gasification and information on the input used on each state. The following section presents and discusses the results. In the results and discussion section, firstly, autothermal (non-solar) and allothermal gasification with steam are compared in terms of the heating value of the produced gas and process efficiency. Afterwards, results are presented by state where the potential of solar gasification is assessed based on aspects such as the solar energy received by the state and the average agricultural waste biomass composition, among others. Finally, the manuscript closes by presenting a summary and a series of conclusions from the findings.
2 Methodology
2.1 Description of the thermodynamic model
The model employed in the simulations is a thermodynamic equilibrium model which follows the Gibb’s free energy minimization method as found in Equation 1 (Privat et al., 2016):
Where
Where
The average RMSE by species is presented in Table 2 (which serves to determine which species has the largest error), while Table 3 presents details on the simulated literature. The global average RMSE value is less than 5%, which indicates agreement and accuracy of the model when compared with similar models with MAEs ranging from less than 5% to more than 10% (Puig-Arnavat et al., 2010).
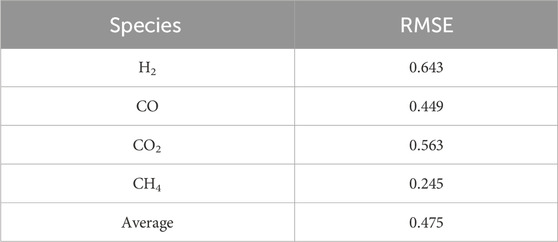
Table 2. Overall Mean Absolute Error, calculated from results from the simulations and the experiments.
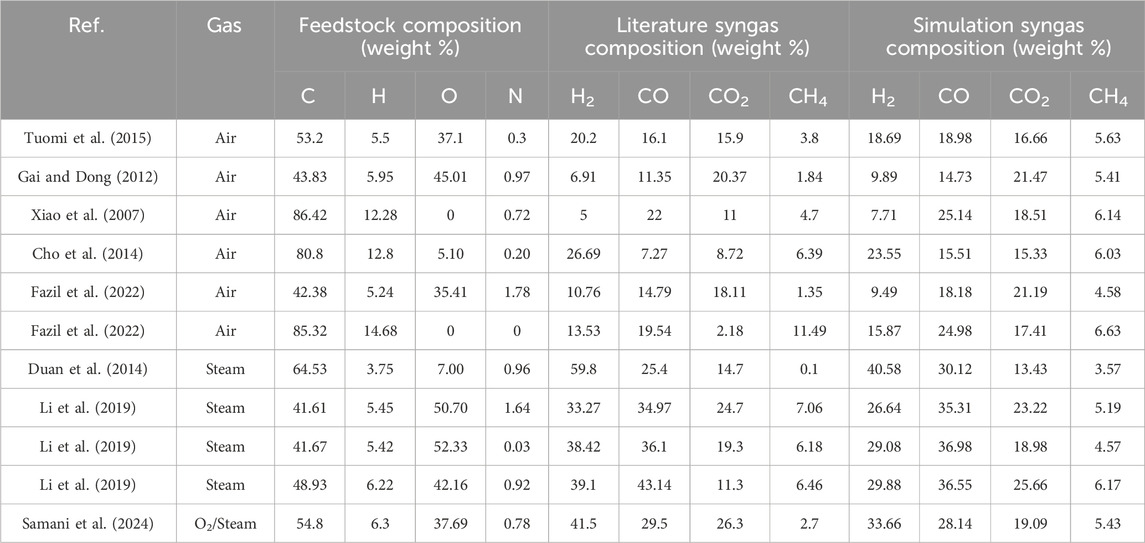
Table 3. Details on the literature simulated to validate the model, the reported syngas composition and the simulations retults.
2.2 Material balance
The mass balances were solved at the gasification temperatures and considering the feedstock biomass compositions, to fulfill the minimization of the Gibbs’ free energy (Privat et al., 2016). While gasification involves a number of reactions and stages (for example, drying, devolatilization, pyrolysis and reduction (Maytorena and Buentello-Montoya, 2024)), Gibb’s free energy based models do not include full kinetics and instead use a single global reaction that accounts for all of the semi reactions, and provide accurate results for gasifiers with long residence times (such as downdraft and fluidized bed gasifier) (Privat et al., 2016).
The mass balance (Equation 3) involved solving the global reaction and finding the components fraction at the minimum Gibb’s free energy, considering H2, CO, CO2, CH4, H2O and a tar (C6H6) as the possible products:
Where
The air mass was established as a function of the equivalence ratio,
The steam mass was calculated with Equation 8 from the steam-to-biomass ratio (SBR):
Where
2.3 Energy balance
A parabolic trough collector was assumed as the employed technology to harness the solar radiation and fuel the reactions in each case, with a solar receiver Concentration Ratio (
Where
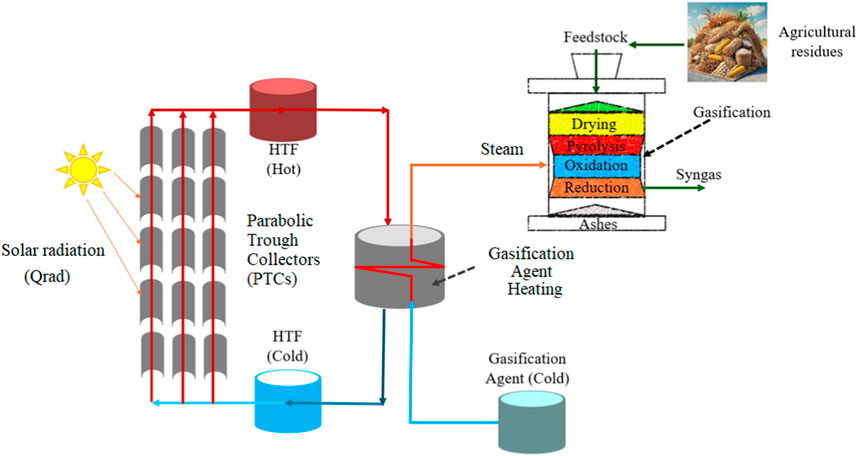
Figure 1. Schematic of the solar gasification reactor system emulated during the simulations. Heat is collected using Parabolic Trough Collectors and used to heat a heat transfer fluid, which is then used to generate steam for gasification.
It was assumed that the receiver has a constant efficiency of 80% (Maytorena and Buentello-Montoya, 2022). The
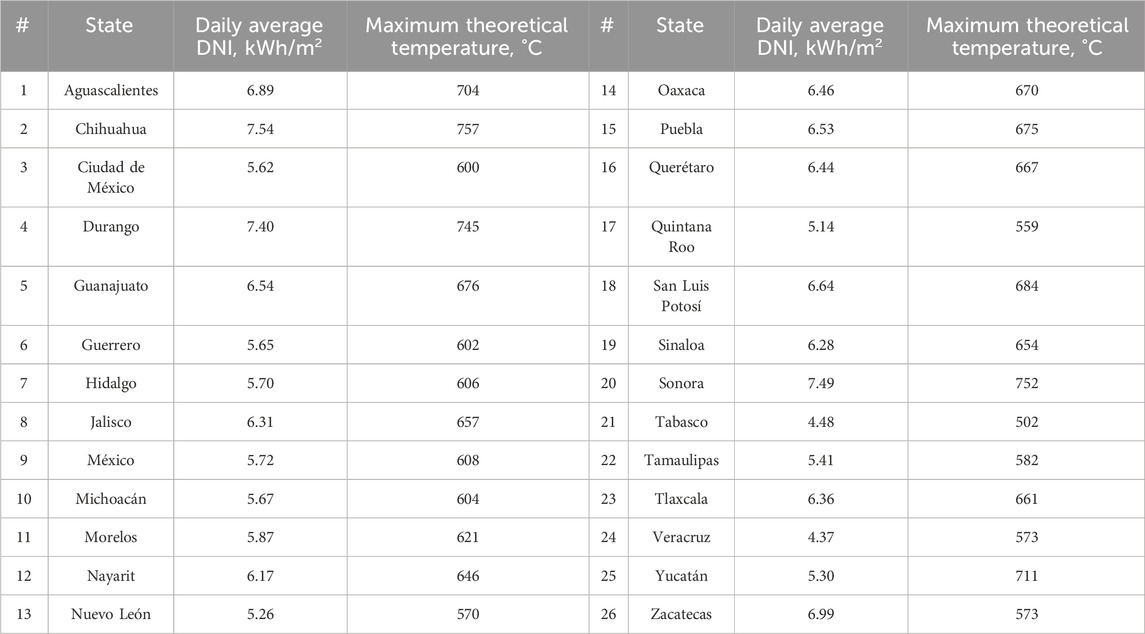
Table 4. Average direct normal irradiation received per day by the states of Mexico (Global Solar Atlas, 2020).
Since the used model assumes thermodynamic equilibrium, the achievable temperature by the HTF was calculated following Equation 17 (Stefan-Boltzmann’s law):
Where
The temperature achievable by the reactants inside the gasifier was calculated with Equation 18:
Where
The enthalpy of reaction was calculated with Equation 19:
Where
Where
2.4 Gasification efficiency assessment
To assess the gasification process, different parameters were employed; a commonly used index is the Cold Gas Efficiency (
Where the LHV of the syngas (in MJ/Nm3) is calculated with Equation 23 from its composition (Khartchenko and Kharchenko, 2014):
Additionally, the Carbon Conversion Efficiency (
2.5 Analysis of the potential of gasification in México
To determine the potential of gasification an analysis per state was performed. First, the availability of the biomass and the population of each state was determined. Then, an average availability per capita was estimated by dividing the total produced biomass (
Based on the biomass availability and DNI, energy density index (EDI), which represents the maximum achievable energy to be produced via gasification with air or steam (using solar energy as a source of energy was calculated). The EDI was calculated from the syngas LHV, and the available waste biomass (Equation 26):
Where
Finally, to assess how the energy demand per state compares to the energy production potential, the Per capita Energy Self-sufficiency Index (PESI) was defined. The PESI (Equation 27) describes the energy contents in the produced syngas associated to the per capita produced waste to the per capita consumed energy:
Where
2.6 Feedstock characterization
The elemental composition of the waste used in the simulations by state was assumed as the weighted average of the elemental composition of each type of residue generated in each state (Vassilev et al., 2010; Kumar et al., 2022; Silva et al., 2019), based on the average agricultural waste masses produced per state per year. The agricultural waste composition from different states throughout Mexico was collected from (SIAP, 2024); the information can be found in Table 5. A total of 13 different agricultural residues were considered, representing an estimated amount of 53 million tons per year, including maize, sugar cane, sorghum and wheat, among others. Information was not available for 5 out of the 31 states: Baja California, Campeche, Coahuila, Colima and Chiapas. The proximate analysis is not included since ashes do not participate in the reactions.
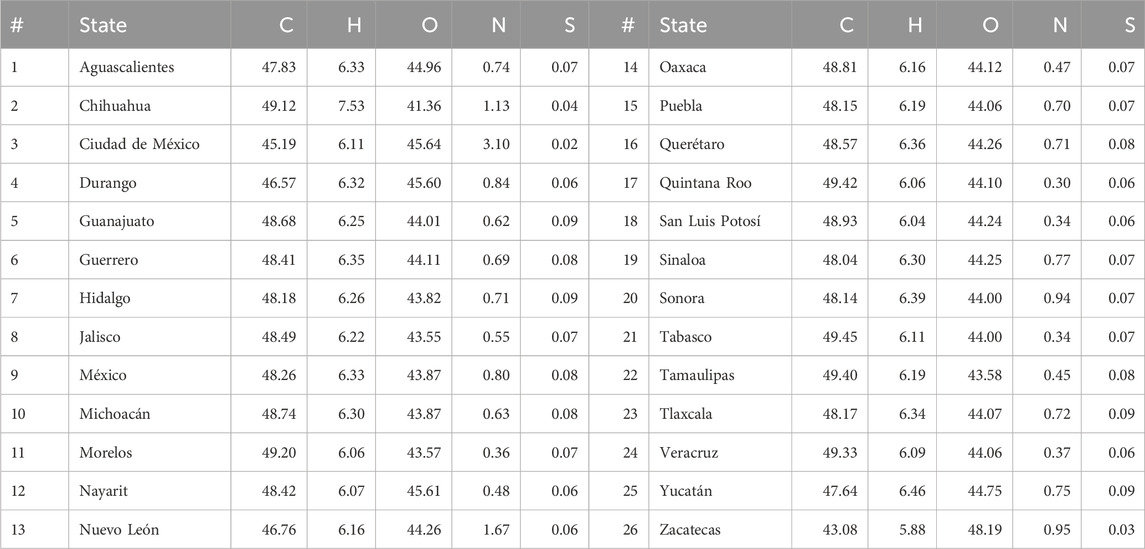
Table 5. Average ultimate composition from the agricultural waste in different states in Mexico, in weight percent.
2.7 Cost analysis
To evaluate the cost of gasification, an Order-of-Magnitude estimate was made for each state. The base costs for Direct Capital Cost (DCI), utilities (water, electricity) consumption and other variable costs (for example, salaries) were adapted from (Boujjat et al., 2021) and are presented in Tables 6 and 7.
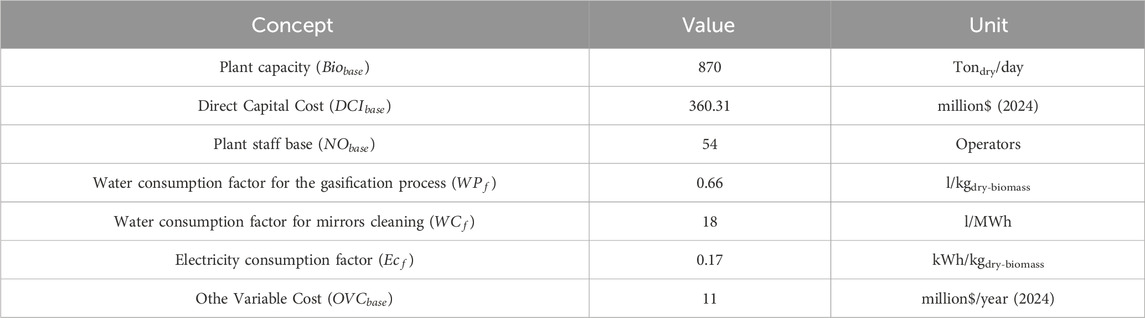
Table 6. Base data for the cost analysis (Boujjat et al., 2021).
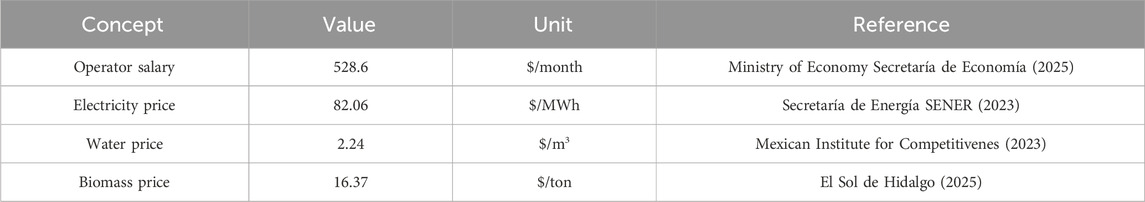
Table 7. Variable cost factors (considering 2024 prices).
For the cost analysis, DCI, Fixed Costs (FC) and Variable Costs (VC) were considered. The DCI per state (
For the estimation of fixed cost per state (
Variable costs per state (
Where
The Total Variable Cost per state (
Then
Where
The second indicator represents the unitary cost of energy per state (
Where
3 Results and discussion
Simulations were conducted considering the maximum achievable temperature under the mean irradiation conditions for every state (Buentello-Montoya et al., 2023a). Air and (Mousavi Rabeti et al., 2023) steam as the gasification agent; although air gasification is an autothermal technology, the results are presented since they can be useful to provide a comparison with steam gasification under the same conditions, considering that one of the bottlenecks for steam gasification lies in the energy required to produce steam at the given temperature (Buentello-Montoya et al., 2023a; Maytorena and Buentello-Montoya, 2022; Samani et al., 2024; Buentello-Montoya et al., 2023b). In the upcoming section, firstly the effect of the gasifying agent in the produced gas, and the process CCE and CGE is presented. Afterwards, the results are presented by state; in the “by state” analysis, the effect of the DNI, the biomass composition and biomass availability is assessed, where the effect in the energy production potential and the H2/CO ratio is presented and discussed.
3.1 Effect of the gasifying agent in the syngas quality and process efficiency
The effect of the DNI in the produced gas LHV is shown in Figure 2, where the ER (for air gasification) was varied from 0.2 to 0.4 (usual for air gasification (Sikarwar et al., 2016)), while the SBR (for steam gasification) was varied from 0.5 to 1.0 (usual for steam gasification (Sikarwar et al., 2016)). Figure 2a corresponds to gasification using air, while Figure 2b portrays results from gasification using steam. It can be seen that in the case of air, the LHV increases with DNI (albeit slightly), whereas in the case of steam, the DNI results in a decrease in LHV. Higher DNI leads to higher temperatures, which favors the reverse WGS reaction thus decreasing the H2 contents in the syngas. On the other hand, as expected (due to carbon and H2 oxidation, as well as dilution of the gas with nitrogen) the LHV decreases with increasing ER and increases with the SBR (due to an increase in the hydrogen contents in the reactants).
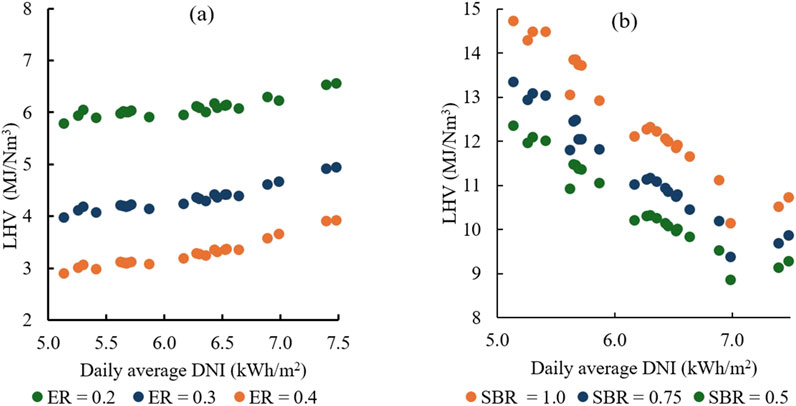
Figure 2. Effect of the DNI in the syngas LHV using (a) air and (b) steam as gasification agent.
With regards to the H2/CO ratio, a significant difference can be seen when comparing the use of air and steam in gasification (Figure 3), where the ratio increases in a ratio of around 1:5 when changing air to steam. The increase occurs due to the abundance of H2O for the WGS reaction, where the reaction occurs in reverse with increasing temperature due to its exothermicity. This implies that for the synthesis of products such as Fischer-Tropsch fuels, high temperatures (or alternatively, high DNIs) are not necessarily favorable. However, the DNI can be potentially controlled using window shade-like devices (Maytorena and Buentello-Montoya, 2024). With regards to the ER (in the case of air gasification), the ratio decreases with increasing ER (due to the production of additional CO from the carbon in the biomass). With respect to the SBR (for steam gasification), a marginal decrease occurs with increasing SBR due to shifts in equilibrium in the WGS and the Boudouard reactions (Buentello-Montoya et al., 2020). With air gasification, higher temperatures promote the decomposition of biomass to H2, CO and CO2. On the other hand, in the case of steam gasification, higher temperatures lead to the formation of large amounts of H2O from H2; this is further reflected when analyzing the H2/CO ratio.
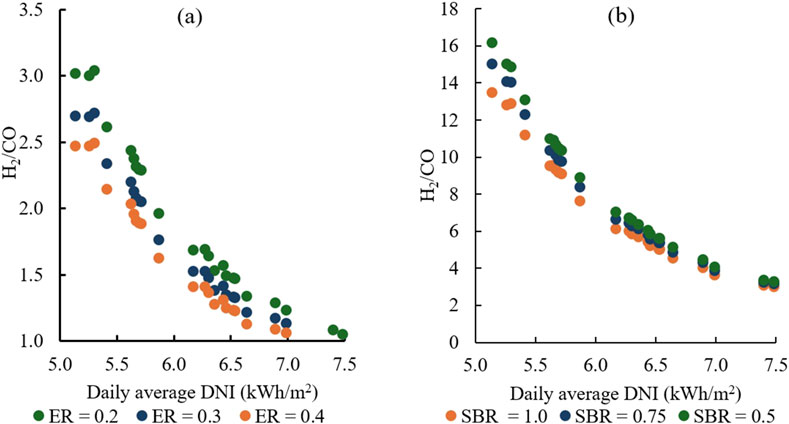
Figure 3. Effect of the DNI and gasification agent in the syngas H2/CO ratio, where (a) corresponds to air and (b) to steam as agent, respectively.
On the other hand, increasing the gasification temperature and ER (Figure 4a) results in an increased CCE. On the contrary, the CCE decreases with increasing SBR due to shifts in equilibrium in the Boudouard and the carbon gasification reactions (as portrayed in Figure 4b). At higher temperatures, higher CCEs are achieved using air than when compared to using steam. This can be attributed to thermodynamics favoring reactions such as combustion and the Boudouard reaction (Buentello-Montoya et al., 2020). On the other hand, the CGE increases with DNI using air (Figure 4c) and decreases with DNI using steam (Figure 4d). With regards to the mass of gasification agent, the increase in ER results in lower CGE (mainly due to dilution of the syngas with N2) while the larger hydrogen availability with increasing SBR results in an increased LHV, leading to an increase in the CGE.
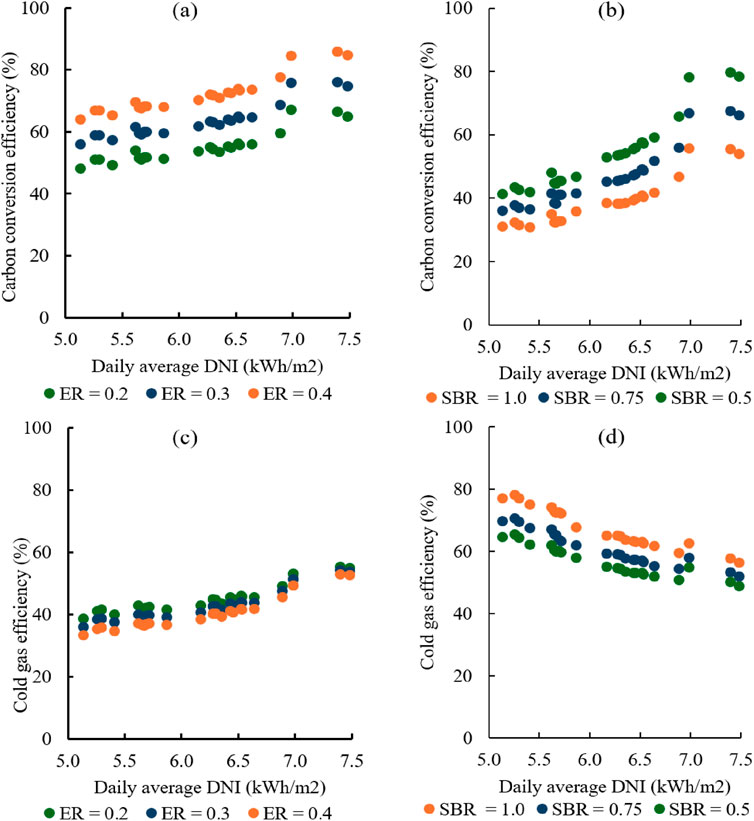
Figure 4. Effect of the DNI in the process CCE using air and steam as gasification agent. (a) CCE using different ERs (0.2, 0.3 and 0.4), (b) CCE using different SBRs (0.5, 0.75 and 1.0), (c) CGE using different ERs (0.2, 0.3 and 0.4) and (d) CGE using different SBRs (0.5, 0.75 and 1.0).
3.2 Energy density by state
Figure 5 provides information on the waste agricultural biomass availability by state, where 5a shows the average total produced biomass, Figure 5b shows the population by state, 5c shows the average produced biomass per capita, 5 days portrays a map of the normalized average biomass waste generation by state (calculated by diving the average production of state
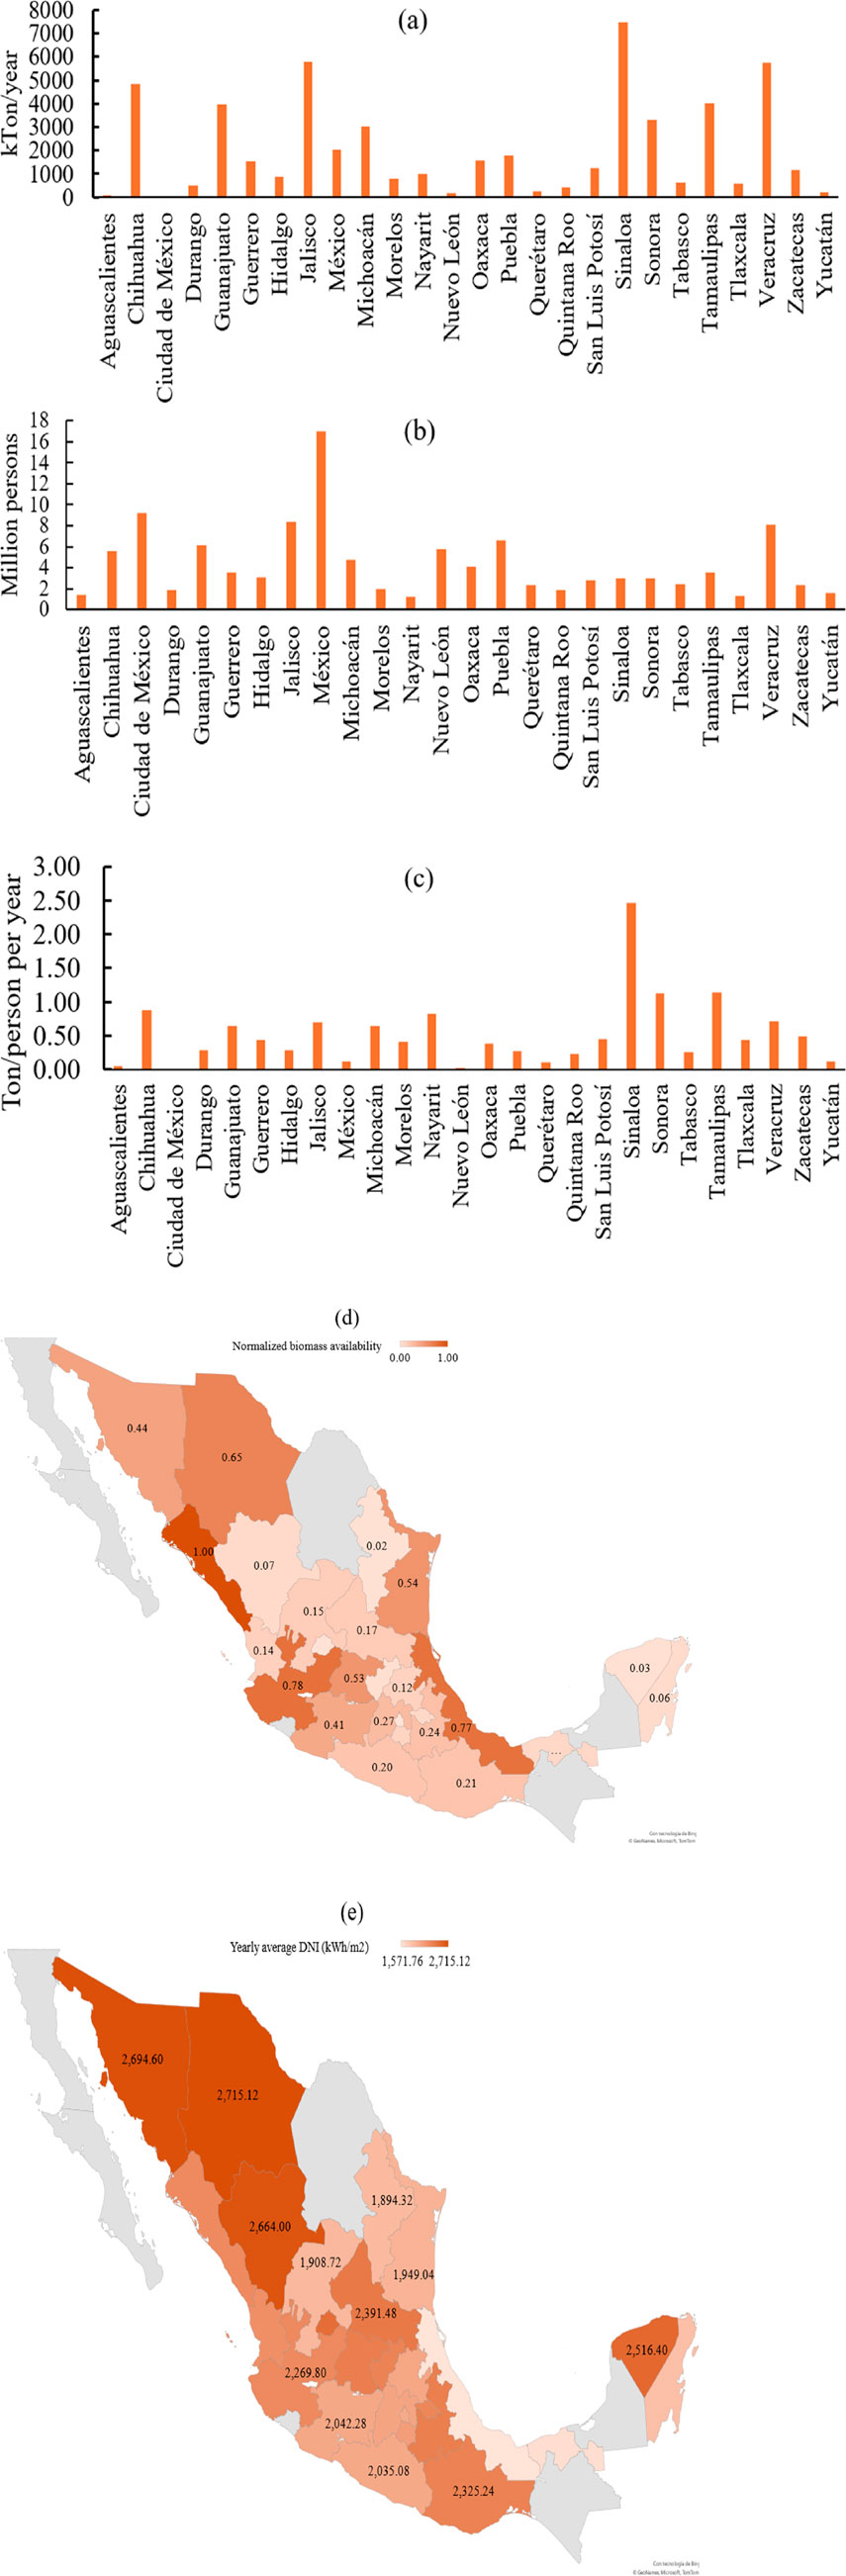
Figure 5. Biomass availability and DNI by state, where (a) shows the waste biomass by state (in tons/year), (b) shows the waste biomass per capita, (c) shows a map of the normalized waste generation, (d) shows the normalized average biomass waste generation and (e) shows the average yearly DNI (in kWh/m2) (Global Solar Atlas, 2020).
Figure 6a presents the EDI calculated per state via gasification with air, while Figure 6b shows the EDI of gasification with steam. The presented results were obtained with a constant gasification agent mass to achieve a gas yield of ≈1.2 Nm3/kg biomass (ER of 0.2, for air and SBR of 0.5 for steam).
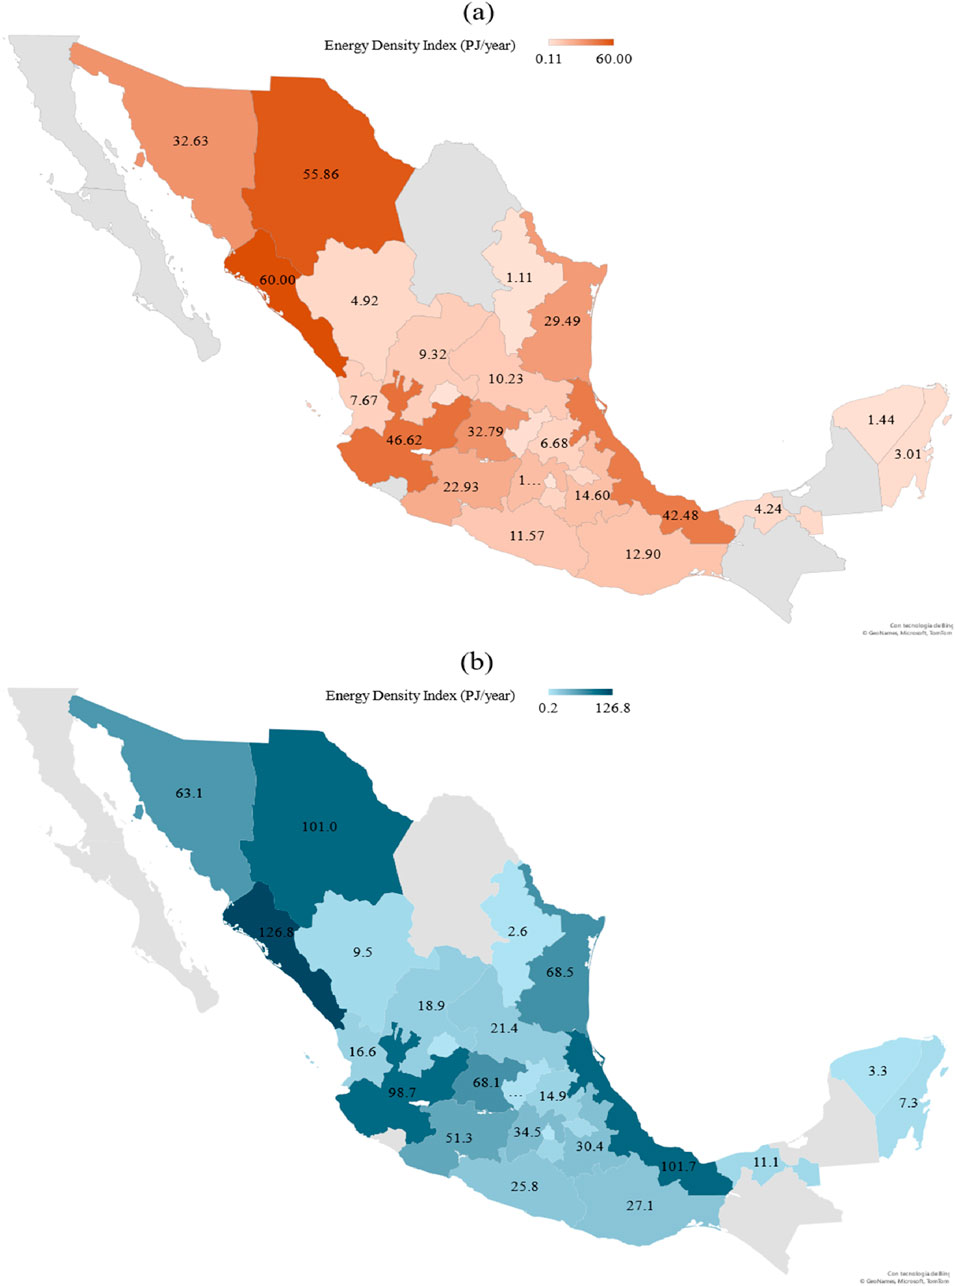
Figure 6. Energy Density Index in PJ/year, obtained with (a) air and (b) steam gasification.
The states with the highest EDIs using air are Sinaloa, Chihuahua, Jalisco and Veracruz, with 60, 55.9, 46.6 and 42.5 PJ/year, respectively. Interestingly, although the EDI tends to be higher in the north, the relationship does not hold true for every case. Using steam as a gasifying agent results in Sinaloa, Veracruz, Chihuahua and Jalisco, with 126.8, 101.7, 100.1 and 98.7 PJ/year, respectively, being the states with the highest values. In contrast, for both gasifying agents, Ciudad de México, Aguascalientes, Nuevo León, Yucatán and Querétaro result in the lowest energy potential, where 0.10, 0.65, 1.1, 1.4 years 2.1 PJ/year were obtained with air, and 0.24, 1.3, 2.6, 3.3 and 4.5 PJ/year were obtained with steam. The results indicate that (1) the states with the most and least potential are the same, regardless of the gasification agent, and (Mousavi Rabeti et al., 2023) the defining aspect in the potential for solar gasification as a source of energy is the biomass availability, above the biomass composition and the DNI. This goes in agreement with Machine-Learning studies that report that the LHV of a syngas is more than anything affected by the gasification temperature, even if the H2 content in the syngas is directly related to the hydrogen contents in the biomasses, while the biomass component with the highest importance in the overall process performance is carbon (Buentello-Montoya et al., 2025). Notwithstanding, the biomass composition has a significant effect. For example, Chihuahua ranks fourth in waste generation (Figure 6a) but ranks second in the EDI using air, and Veracruz ranks third in waste generation, but ranks second in EDI with steam. Generally speaking, the energy density using steam increases by a factor of around 2.2 when replacing air with steam. This highlights the potential of the inclusion of solar energy for the allothermal process.
3.3 H2/CO by state
H2/CO is an important indicator of the potential applications of syngas, as, for example, for the synthesis of some chemicals a high H2/CO ratio (>2) is necessary. Figure 7 shows the H2/CO by state, where Figures 7a,b represent the use of air and steam as gasification agent, respectively. By comparing Figure 7 with Figure 5e, it can be inferred that a negative relationship between the DNI and the H2/CO exists, where the increase in DNI has a more significant effect when using steam; the more significant effect can be related to the exothermicity of the water-gas shift reaction. Still, when using steam, most states have a H2/CO>>2, indicating a potential for additional syngas applications besides energy. However, from the biomass availability (Figure 5), it can be inferred the states with the highest H2/CO ratio (Veracruz with 26.7, Tamaulipas with 11.2 and Nuevo Leon with 12.8, all located in eastern Mexico) also have a low-to-average normalized biomass productions (Veracruz 0.77, Tamaulipas 0.54 and Nuevo Leon 0.02), indicating that in Mexico, the H2/CO is not the sole important decision making indicator for a H2-based chemicals plant, since this criteria may result in feedstock availability problem. Additionally, something to notice is that the states with higher H2/CO ratio are close to existing petrochemical facilities (in Guanajuato, Hidalgo Tabasco and Veracruz), which can be an opportunity to use that infrastructure to convert the syngas into chemicals through processes such as Fischer-Tropsch (Gobierno de México, 2022). Moreover, establishing a plant for biomass processing in the states by the Gulf of Mexico (Veracruz and Tabasco) could benefit from other economic activities such as aquaculture, or from waste such as algae washed ashore; this analysis is outside of the scope of the present work, however.
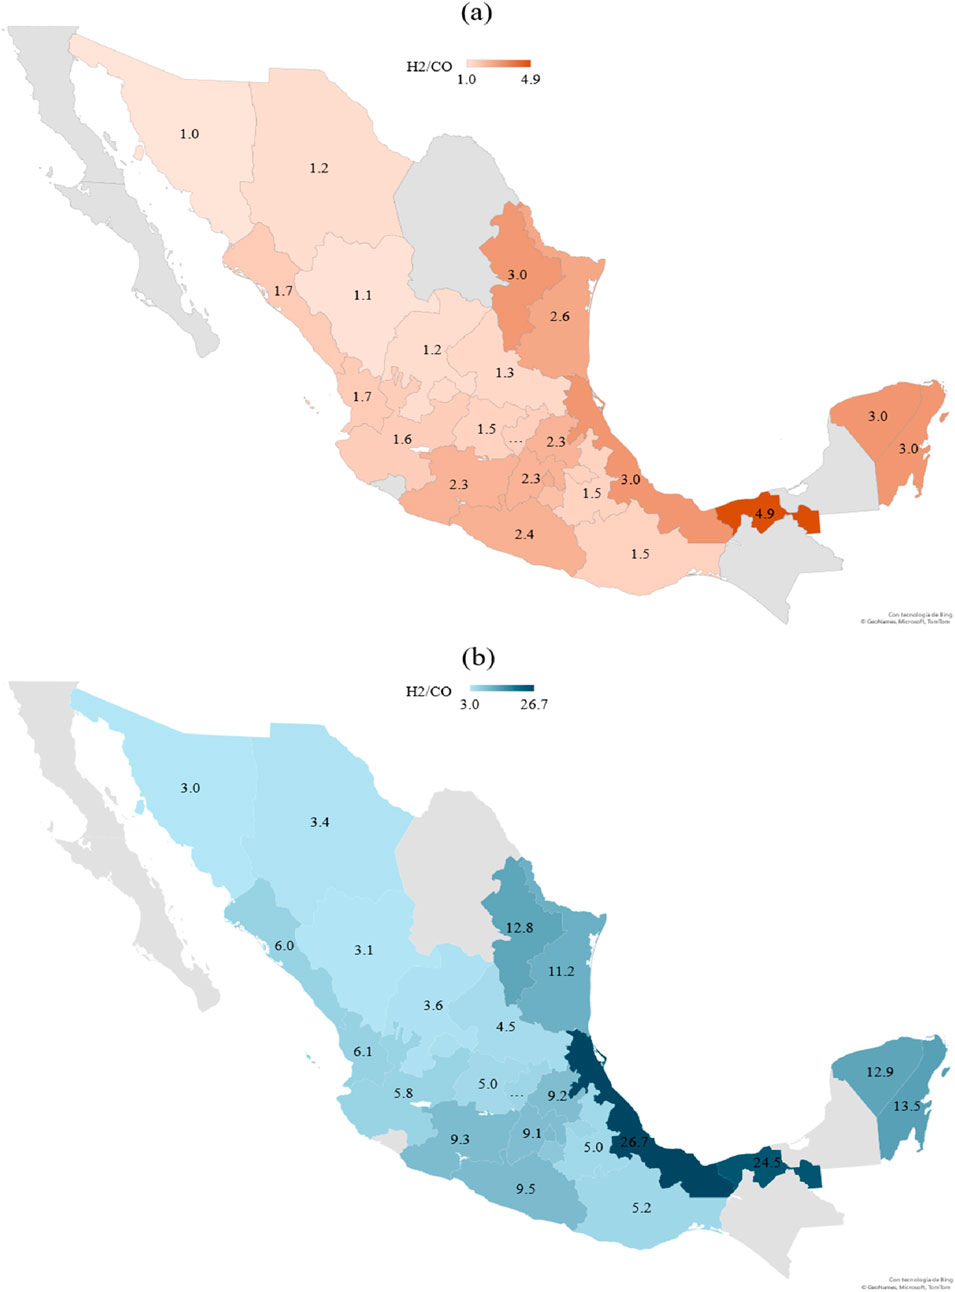
Figure 7. H2/CO ratio by state. (a) Corresponds to air gasification and (b) to steam gasification.
3.4 Per capita self-sufficiency index
To evaluate the extent to which each state could rely on its own agricultural residues and solar resource for energy generation, the Per Capita Energy Self-Sufficiency Index (PESI), defined in Equation 27, was employed. The PESI compares the theoretical energy content of syngas produced from the waste biomass produced per capita to the average per capita energy consumption in Mexico, which is approximately 2,425 kWh/year (Secretaría de Energía SENER, 2023). A PESI value greater than 1 indicates that a state could theoretically generate enough energy from solar gasification of agricultural biomass waste to exceed its own demand, whereas values below 1 indicate that local residues are insufficient, and that external energy sources or complementary technologies would be required. By analyzing the results in terms of PESI, it becomes possible to determine which states have potential for energy self-sufficiency, those that might benefit from regional integration, and that where solar gasification may be unsuitable.
Figure 8 shows bar plots of the PESI using (Figure 8a) air and (Figure 8b) steam as gasification agents, while Figures 8c,d show a map of the geographical distribution of the PESI using air and steam, respectively. Finally, Figures 8e,f portray the PESI for both gasification agents as a function of the available waste biomass and the DNI.
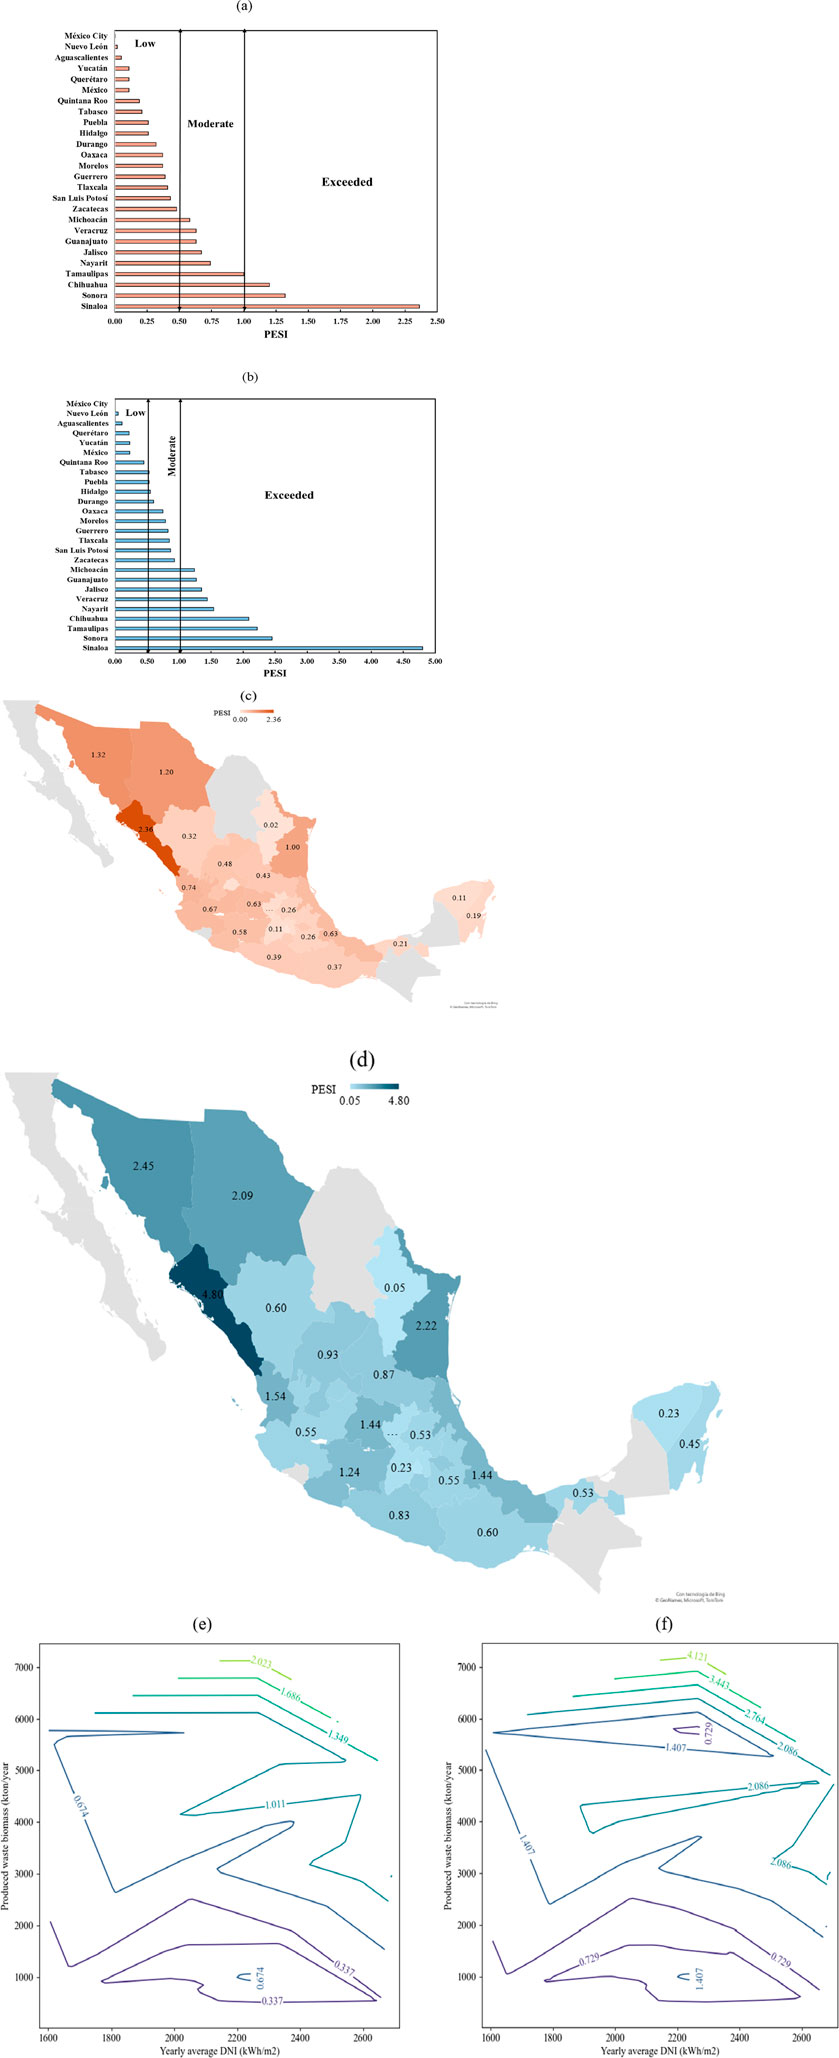
Figure 8. Per capita Energy Self-sufficiency Index (PESI) by state, calculated using (a) air and (b) steam as gasification agent, maps of the PESI using (c) air and (d) steam, and (e) and (f) show the PESI as a function of the available waste biomass and DNI for air and steam, respectively.
From the results found in Figure 8, the states can be grouped into three categories.
1. Exceeded PESI (PESI≥ 100%), where the energy potential surpasses the per capita consumption. These states are suitable for solar gasification, and may benefit from not only energy generation, but the production of compounds such as ammonia from the produced hydrogen:
• Using air: Sinaloa (236%), Sonora (132%), Chihuahua (120%) and Tamaulipas (100%).
• Using steam: Sinaloa (480%), Sonora (245%), Tamaulipas (222%), Chihuahua (209%), Nayarit (154%), Veracruz (144%), Jalisco (135%), Guanajuato (127%) and Michoacán (124%).
2. Moderate PESI (50%<PESI<100%), which may include states with a significant energy production potential, but due to population, may not satisfy the required energy and thus may require synergy from other technologies or support from adjacent states. These states may be suitable for a solar gasification plant:
• Using air: Nayarit (74%) and Michoacán (58%).
• Using steam: Zacatecas (93%) and Tabasco (53%).
3. Low PESI (PESI<50%), where the potential for energy production is low compared to its requirements, due to limitations in the available waste biomass, and therefore, may be questionable for solar gasification unless supported with other technologies:
• Using air: Zacatecas (48%) and Ciudad de México (0.14%).
• Using steam: Quintana Roo (45%) a Ciudad de México (0.31%).
From the results and based on the geographical distribution and on the categories, different actions can be undertaken.
1. Exceeded PESI: The surplus energy could be exported however attention must be paid to the energy consumed (and the associated carbon footprint) during transportation and the associated logistics. Additionally, hydrogen-based refineries and processes can be established to produce chemicals such as methane, methanol or urea (Masjedi et al., 2024; Sinha and Panigrahy, 2024; Alfian and Purwanto, 2019).
Moderate PESI: Moderate PESI states may benefit from solar gasification but will be hardly able to rely on it as the sole source of energy, therefore, are recommended to potentially work in tandem with Exceeded PESI states to satisfy their needs.
2. Low PESI: Low PESI states may benefit more from other technologies such as biodigesters.
Remarkably, a high PESI value does not necessarily mean that the state is suitable for solar gasification, since interest might be in the production of chemicals which require parameters such as a large H2/CO ratio. Moreover, states with a PESI value can be either a hub for chemical production or energy production, to satisfy the demands of other states. For example, Sinaloa (PESI of 2.36 with air and 4.80 with steam) could provide contiguous states with low PESIs (0.60 for steam and 0.32 for air) with chemicals and energy.
With regards to the relationship between the available waste biomass (Figures 8e,f), the DNI and the PESI, it can be seen that the main contributor to the PESI is the available waste biomass. Therefore, the potential use (e.g., as a fuel, or for downstream processing) of the produced syngas can be attributed to the DNI and the average biomass composition, whereas states with a large amount of available agricultural biomass are suitable for energy production.
Regarding the geographical distribution and its relationship with PESI and energy availability, Veracruz is connected to the center of Mexico, where no state has a PESI score larger than 1, and where more than 30% of the overall population (and energy consumption) is found, making it prospect for a solar gasification plant.
3.5 Economic indicators
To evaluate the economic performance of the process,
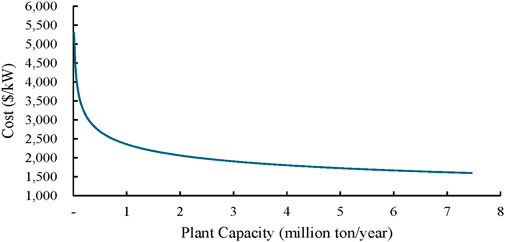
Figure 9. Unitary cost per capacity of power production (
Figure 10 presents the values of
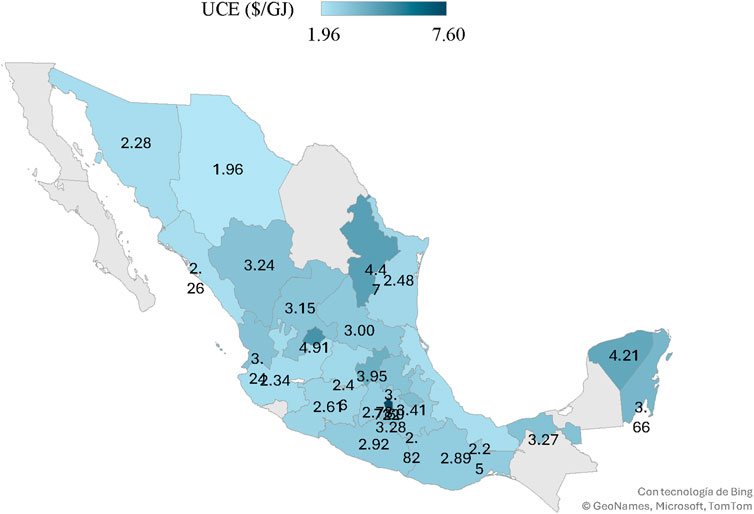
Figure 10. Unitary cost of energy per state (
3.6 Overview of environmental benefits of the technology
The proposed technology can potentially decrease the environmental burden associated to satisfying the country’s energy needs. With respect to land use, the proposed systems relies on existing agricultural and municipal residues as feedstock, rather than dedicated energy crops (first generation biofuels). This reduces pressure on fertile land and avoids negative impacts associated with land-use change (Parthasarathy et al., 2022). It is worth noting that most of these residues are currently disposed of in open-air landfills in Mexico, since this is the most economical and straightforward option; however, such disposal is associated to environmental and health problems due to potential emissions, infiltration of pollutants to groundwater bodies, and particle matter associated to health hazards (Foong et al., 2020). On the other hand, regarding water consumption, solar thermochemical systems generally require less water than conventional plants whose energy is supplied by combustion since do not rely on steam cycles, given that the primary energy input for solar gasification plants is solar radiation coupled with locally available biomass, in addition that no additional water is required to harvest the crops (Eldredge, 2021). In terms of greenhouse gas emissions, solar gasification avoids the use of heat derived from fossil fuels or from the direct burning of biomass, significantly reducing the carbon footprint and greenhouse gas emissions (Maytorena and Buentello-Montoya, 2024; Eldredge, 2021; Nzihou et al., 2012). In addition, the co-production of biochar provides complementary benefits, as this material enables carbon capture and storage while improving soil physical properties such as aeration, workability, and water retention capacity (Parthasarathy et al., 2022), associated to the recognition of biochar as an advanced and sustainable material with the potential to increase soil fertility, improve crop yields, and sequester atmospheric carbon (Qambrani et al., 2017). All in all, have the potential to reduce emissions associated to energy production while fostering circular economy strategies based on waste utilization, to produce valuable chemicals such as Fischer-Tropsch liquids (Li et al., 2017). Nevertheless, it must be acknowledged that a full-fledged life cycle assessment (LCA) is necessary to comprehensively quantify these benefits and impacts. Although such an analysis is beyond the scope of the present work, it is proposed as a future research direction to more fully evaluate the environmental implications of this technology.
4 Summary and conclusions
An analysis of the potential of solar gasification in Mexico was conducted using Gibbs free energy minimization-based simulations to assess the potential of steam-based solar gasification. Air and steam were compared as gasifying agents using average direct normal irradiation to heat the reactor. Results demonstrate that although the syngas quality (in terms of the Lower Heating Value and H2/CO ratio) is affected by direct normal irradiance (where higher irradiation tends to decrease the lower heating value and H2/CO ratio of the produced syngas), the decisive factors for solar gasification as a source of energy are the biomass availability and composition, rather than the solar resource. Moreover, it was found that steam produces better quality syngas than air, highlighting the necessity to find energy sources for steam gasification. A Per Capita Energy Self-Sufficiency Index (PESI) was computed, which shows that states with abundant agricultural residues, such as Sinaloa and Veracruz, could meet or even surpass their local energy demand through solar gasification. Moreover, the economic analysis shows that states with high biomass and energy production can have potential for gasification, since the unitary cost of energy of around 2–2.3 $/GJ is competitive with natural gas, whose cost in Mexico varies between 2.97–6.79 $/GJ.
Overall, the findings highlight solar biomass gasification as a promising strategy for coupling Mexico’s agricultural waste streams with the abundance of solar resources, potentially contributing to decentralized energy supply and to the development of hydrogen-based chemical industries. Future research should extend this analysis by considering seasonal feedstock variability, logistics and supply chain aspects, and the environmental footprint of large-scale implementation. Moreover, a deeper economic analysis focused on the states of Sinaloa, Veracruz and Chihuahua (and possibly Jalisco) may be worthwhile, considering specifics of each state such as land price, loans, taxes, variation in salaries, biomass and utilities costs and energy sale prices.
Data availability statement
The datasets presented in this article are not readily available because The data is confidential, unfortunately. Requests to access the datasets should be directed to David Buentello-Montoya, ZGF2aWQuYnVlbnRlbGxvQHRlYy5teA==.
Author contributions
VM-S: Conceptualization, Formal Analysis, Investigation, Methodology, Writing – original draft, Writing – review and editing. DB-M: Conceptualization, Investigation, Methodology, Software, Supervision, Validation, Writing – original draft, Writing – review and editing. HA: Data curation, Formal Analysis, Funding acquisition, Investigation, Methodology, Project administration, Writing – original draft, Writing – review and editing.
Funding
The authors declare that financial support was received for the research and/or publication of this article. This work was supported by the Instituto Tecnológico y de Estudios Superiores de Monterrey through the Publications Support Fund (FAP, by its initials in Spanish).
Conflict of interest
The authors declare that the research was conducted in the absence of any commercial or financial relationships that could be construed as a potential conflict of interest.
Generative AI statement
The authors declare that no Generative AI was used in the creation of this manuscript.
Any alternative text (alt text) provided alongside figures in this article has been generated by Frontiers with the support of artificial intelligence and reasonable efforts have been made to ensure accuracy, including review by the authors wherever possible. If you identify any issues, please contact us.
Publisher’s note
All claims expressed in this article are solely those of the authors and do not necessarily represent those of their affiliated organizations, or those of the publisher, the editors and the reviewers. Any product that may be evaluated in this article, or claim that may be made by its manufacturer, is not guaranteed or endorsed by the publisher.
References
Abanades, S., Rodat, S., and Boujjat, H. (2021). Solar thermochemical green fuels production: a review of biomass pyro-gasification, solar reactor concepts and modelling methods. Energies (Basel) 14 (5), 1494. doi:10.3390/en14051494
Aldana, H., Lozano, F. J., and Acevedo, J. (2014). Evaluating the potential for producing energy from agricultural residues in México using MILP optimization. Biomass Bioenergy 67, 372–389. doi:10.1016/j.biombioe.2014.05.022
Alfian, M., and Purwanto, W. W. (2019). Multi-objective optimization of green urea production. Energy Sci. Eng. 7 (2), 292–304. doi:10.1002/ese3.281
Arribas, L., Arconada, N., González-Fernández, C., Löhrl, C., González-Aguilar, J., Kaltschmitt, M., et al. (2017). Solar-driven pyrolysis and gasification of low-grade carbonaceous materials. Int. J. Hydrogen Energy 42 (19), 13598–13606. doi:10.1016/j.ijhydene.2017.02.026
Boujjat, H., Rodat, S., Chuayboon, S., and Abanades, S. (2020). Experimental and CFD investigation of inert bed materials effects in a high-temperature conical cavity-type reactor for continuous solar-driven steam gasification of biomass. Chem. Eng. Sci., 228. doi:10.1016/j.ces.2020.115970
Boujjat, H., Rodat, S., and Abanades, S. (2021). Techno-economic assessment of solar-driven steam gasification of biomass for large-scale hydrogen production. Processes 9 (3), 462. doi:10.3390/pr9030462
Buentello-Montoya, D., Zhang, X., Li, J., Ranade, V., Marques, S., and Geron, M. (2020). Performance of biochar as a catalyst for tar steam reforming: effect of the porous structure. Appl. Energy 259, 114176. doi:10.1016/j.apenergy.2019.114176
Buentello-Montoya, D. A., Armenta-Gutiérrez, M. Á., and Maytorena-Soria, V. M. (2023a). Parametric modelling study to determine the feasibility of the Co-Gasification of macroalgae and plastics for the production of hydrogen-rich syngas. Energies (Basel) 16 (19), 6819. doi:10.3390/en16196819
Buentello-Montoya, D. A., Duarte-Ruiz, C. A., and Maldonado-Escalante, J. F. (2023b). Co-gasification of waste PET, PP and biomass for energy recovery: a thermodynamic model to assess the produced syngas quality. Energy, 266. doi:10.1016/j.energy.2022.126510
Buentello-Montoya, D. A., and Maytorena-Soria, V. M. (2025). Feature importance analysis of solar gasification of biomass via machine learning models. Energies (Basel). 18 (16), 4409. doi:10.3390/en18164409
Cho, M. H., Mun, T. Y., Choi, Y. K., and Kim, J. S. (2014). Two-stage air gasification of mixed plastic waste: olivine as the bed material and effects of various additives and a nickel-plated distributor on the tar removal. Energy 70, 128–134. doi:10.1016/j.energy.2014.03.097
Curcio, A., Rodat, S., Vuillerme, V., and Abanades, S. (2021). Experimental assessment of woody biomass gasification in a hybridized solar powered reactor featuring direct and indirect heating modes. Int. J. Hydrogen Energy 46 (75), 37192–37207. doi:10.1016/j.ijhydene.2021.09.008
Duan, W., Yu, Q., Xie, H., Qin, Q., and Zuo, Z. (2014). Thermodynamic analysis of hydrogen-rich gas generation from coal/steam gasification using blast furnace slag as heat carrier. Int. J. Hydrogen Energy 39 (22), 11611–11619. doi:10.1016/j.ijhydene.2014.05.125
El Sol de Hidalgo (2025). Valle del Mezquital: Forage Bales Reach 160 Pesos for Sale. Pachuca, Hidalgo: El Sol de Hidalgo. Available online at: https://oem.com.mx/elsoldehidalgo/local/valle-del-mezquital-pacas-de-forraje-alcanzan-los-160-pesos-a-la-venta-13555882.
Eldredge, T. V. (2021). The feasibility of solar assisted pyrolysis of sewer sludge and its potential for CO2 emissions reductions. Energy 226, 120296. doi:10.1016/j.energy.2021.120296
Fazil, A., Kumar, S., and Mahajani, S. M. (2022). Downdraft co-gasification of high ash biomass and plastics. Energy, 243. doi:10.1016/j.energy.2021.123055
Foong, S. Y., Liew, R. K., Yang, Y., Cheng, Y. W., Yek, P. N. Y., Wan Mahari, W. A., et al. (2020). Valorization of biomass waste to engineered activated biochar by microwave pyrolysis: progress, challenges, and future directions. Chem. Eng. J. 389, 124401. doi:10.1016/j.cej.2020.124401
Freda, C., Tarquini, P., Sharma, V. K., and Braccio, G. (2022). Thermodynamic improvement of solar driven gasification compared to conventional one. Energy, 261. doi:10.1016/j.energy.2022.124953
Frenklach, M. (2002). Reaction mechanism of soot formation in flames. Phys. Chem. Chem. Phys. 4 (11), 2028–2037. doi:10.1039/b110045a
Gai, C., and Dong, Y. (2012). Experimental study on non-woody biomass gasification in a downdraft gasifier. Int. J. Hydrogen Energy 37 (6), 4935–4944. doi:10.1016/j.ijhydene.2011.12.031
Global Solar Atlas (2020). Global Solar Atlas. Sonora, Mexico: Global Solar Atlas. Available online at: https://globalsolaratlas.info/detail?c=28.971803,-110.99762,11&s=29.098177,-110.954361&m=site.
Hathaway, B. J., and Davidson, J. H. (2017). Demonstration of a prototype molten salt solar gasification reactor. Sol. Energy 142, 224–230. doi:10.1016/j.solener.2016.12.032
Hathaway, B. J., and Davidson, J. H. (2021). Autothermal hybridization and controlled production of hydrogen-rich syngas in a molten salt solar gasifier. Int. J. Hydrogen Energy 46 (29), 15257–15267. doi:10.1016/j.ijhydene.2021.02.048
INEGI (2025). Indicator Bank. National Institute of Statistics and Geography. Aguascalientes: INEGI. Available online at: https://www.inegi.org.mx/app/indicadores/?tm=0&t=100005000032#D100005000032#D910491_100005000032
Jayah, T. H., Aye, L., Fuller, R. J., and Stewart, D. F. (2003). Computer simulation of a downdraft wood gasifier for tea drying. Biomass Bioenergy 25 (4), 459–469. doi:10.1016/s0961-9534(03)00037-0
Jess, A. (1996). Mechanisms and kinetics of thermal reactions of aromatic hydrocarbons from pyrolysis of solid fuels. Fuel 75 (12), 1441–1448. doi:10.1016/0016-2361(96)00136-6
Khartchenko, N., and Kharchenko, V. (2014). Advanced energy systems. Second edition. New York, NY: Taylor and Francis Group.
Kodama, T., Gokon, N., Enomoto, S. I., Itoh, S., and Hatamachi, T. (2010). Coal coke gasification in a windowed solar chemical reactor for beam-down optics. J. Sol. Energy Eng. Trans. ASME. 132 (4), 041004. doi:10.1115/1.4002081
Kramb, J., Konttinen, J., Gómez-barea, A., Moilanen, A., and Umeki, K. (2014). Modeling biomass char gasification kinetics for improving prediction of carbon conversion in a fluidized bed gasifier. FUEL 132, 107–115. doi:10.1016/j.fuel.2014.04.014
Kumar, V. A., Singh, S., Kumar Rathore, A., Singh Thakur, L., Shankar, R., and Mondal, P. (2022). Investigation of kinetic and thermodynamic parameters for pyrolysis of peanut shell using thermogravimetric analysis. Biomass Convers. Biorefin 31. doi:10.1007/s13399-020-00972-y
Li, P., Sadhwani, N., Yuan, Z., and Eden, M. R. (2017). Process simulation and economic analysis of producing liquid transportation fuels from biomass. Comput. Aided Chem. Eng. 40, 2515–2520. doi:10.1016/b978-0-444-63965-3.50421-9
Li, J., Qiao, Y., Chen, X., Zong, P., Qin, S., Wu, Y., et al. (2019). Steam gasification of land, coastal zone and marine biomass by thermal gravimetric analyzer and a free-fall tubular gasifier: biochars reactivity and hydrogen-rich syngas production. Bioresour. Technol. 289 (May), 121495. doi:10.1016/j.biortech.2019.121495
Li, X., Shen, Y., Wei, L., He, C., Lapkin, A. A., Lipiński, W., et al. (2020). Hydrogen production of solar-driven steam gasification of sewage sludge in an indirectly irradiated fluidized-bed reactor. Appl. Energy 261, 114229. doi:10.1016/j.apenergy.2019.114229
Li, X., Chen, J., Hu, Q., Chu, P., Dai, Y., and Wang, C. H. (2021). Solar-driven gasification in an indirectly-irradiated thermochemical reactor with a clapboard-type internally-circulating fluidized bed. Energy Convers. Manag. 248, 114795. doi:10.1016/j.enconman.2021.114795
Loha, C., Chatterjee, P. K., and Chattopadhyay, H. (2011). Performance of fluidized bed steam gasification of biomass - modeling and experiment. Energy Convers. Manag. 52 (3), 1583–1588. doi:10.1016/j.enconman.2010.11.003
Lourinho, G., Alves, O., Garcia, B., Rijo, B., Brito, P., and Nobre, C. (2023). Costs of gasification technologies for energy and fuel production: overview, analysis, and numerical estimation. Recycling 8 (3), 49. doi:10.3390/recycling8030049
Loutzenhiser, P. G., and Muroyama, A. P. (2017). A review of the state-of-the-art in solar-driven gasification processes with carbonaceous materials. Sol. Energy 156, 93–100. doi:10.1016/j.solener.2017.05.008
Masjedi, S. K., Kazemi, A., Moeinnadini, M., Khaki, E., and Olsen, S. I. (2024). Urea production: an absolute environmental sustainability assessment. Sci. Total Environ., 908. doi:10.1016/j.scitotenv.2023.168225
Maytorena, V. M., and Buentello-Montoya, D. A. (2022). Multiphase simulation and parametric study of direct vapor generation for a solar organic rankine cycle. Appl. Therm. Eng., 216. doi:10.1016/j.applthermaleng.2022.119096
Maytorena, V. M., and Buentello-Montoya, D. A. (2024). Worldwide developments and challenges for solar pyrolysis. Heliyon, 10, e35464. doi:10.1016/j.heliyon.2024.e35464
Mexican Institute for Competitiveness (IMCO) (2023). The real cost of water in Mexico: an analysis of tariffs and their impacts on society. Miguel Hidalgo: Mexican Institute for Competitiveness.
Ministry of Economy (Secretaría de Economía) (2025). Operators of Machines for Power Generation. Mexico: Ministry of Economy. Available online at: https://www.economia.gob.mx/datamexico/es/profile/occupation/operadores-de-maquinas-para-la-generacion-de-energia.
Molina-Guerrero, C. E., Sanchez, A., and Vázquez-Núñez, E. (2020). Energy potential of agricultural residues generated in Mexico and their use for butanol and electricity production under a biorefinery configuration. Environ. Sci. Pollut. Res. 27 (23), 28607–28622. doi:10.1007/s11356-020-08430-y
Mousavi Rabeti, S. A., Khoshgoftar Manesh, M. H., and Amidpour, M. (2023). Techno-economic and environmental assessment of a novel polygeneration system based on integration of biomass air-steam gasification and solar parabolic trough collector. Sustain. Energy Technol. Assessments 56, 103030. doi:10.1016/j.seta.2023.103030
Müller, F., Poživil, P., van Eyk, P. J., Villarrazo, A., Haueter, P., Wieckert, C., et al. (2017). A pressurized high-flux solar reactor for the efficient thermochemical gasification of carbonaceous feedstock. Fuel 193, 432–443. doi:10.1016/j.fuel.2016.12.036
Muroyama, A. P., Guscetti, I., Schieber, G. L., Haussener, S., and Loutzenhiser, P. G. (2018). Design and demonstration of a prototype 1.5 kWth hybrid solar/autothermal steam gasifier. Fuel 211, 331–340. doi:10.1016/j.fuel.2017.09.059
Nathan, G. J., Dally, B. B., Alwahabi, Z. T., Van Eyk, P. J., Jafarian, M., and Ashman, P. J. (2017). Research challenges in combustion and gasification arising from emerging technologies employing directly irradiated concentrating solar thermal radiation. Proc. Combust. Inst. 36 (2), 2055–2074. doi:10.1016/j.proci.2016.07.044
National Institute of Statistics and Geography (Instituto Nacional de Estadística y Geografía) (2020). Cuéntame México. Aguascaliente: National Institute of Statistics and Geography.
Norinaga, K., Yang, H., Tanaka, R., Appari, S., Iwanaga, K., Takashima, Y., et al. (2014). A mechanistic study on the reaction pathways leading to benzene and naphthalene in cellulose vapor phase cracking. Biomass Bioenergy 69, 144–154. doi:10.1016/j.biombioe.2014.07.008
Nzihou, A., Flamant, G., and Stanmore, B. (2012). Synthetic fuels from biomass using concentrated solar energy – a review. Energy 42 (1), 121–131. doi:10.1016/j.energy.2012.03.077
Parthasarathy, P., Al-Ansari, T., Mackey, H. R., Sheeba Narayanan, K., and McKay, G. (2022). A review on prominent animal and municipal wastes as potential feedstocks for solar pyrolysis for biochar production. Fuel 15, 316. doi:10.1016/j.fuel.2022.123378
Pecchi, M., and Baratieri, M. (2019). Coupling anaerobic digestion with gasification, pyrolysis or hydrothermal carbonization: a review. Renew. Sustain. Energy Rev. 105, 462–475. doi:10.1016/j.rser.2019.02.003
Privat, R., Jaubert, J. N., Berger, E., Coniglio, L., Lemaitre, C., Meimaroglou, D., et al. (2016). Teaching the concept of gibbs energy minimization through its application to phase-equilibrium calculation. J. Chem. Educ. 93 (9), 1569–1577. doi:10.1021/acs.jchemed.6b00205
Puig-Arnavat, M., Bruno, J. C., and Coronas, A. (2010). Review and analysis of biomass gasification models. Renew. Sustain. Energy Rev. 14 (9), 2841–2851. doi:10.1016/j.rser.2010.07.030
Qambrani, N. A., Rahman, M. M., Won, S., Shim, S., and Ra, C. (2017). Biochar properties and eco-friendly applications for climate change mitigation, waste management, and wastewater treatment: a review. Renew. Sustain. Energy Rev. 79, 255–273. doi:10.1016/j.rser.2017.05.057
Rafati, M., Wang, L., Dayton, D. C., Schimmel, K., Kabadi, V., and Shahbazi, A. (2017). Techno-economic analysis of production of fischer-tropsch liquids via biomass gasification: the effects of fischer-tropsch catalysts and natural gas co-feeding. Energy Convers. Manag. 133, 153–166. doi:10.1016/j.enconman.2016.11.051
Sajjadnejad, M., Haghshenas, S. M. S., Targhi, V. T., Zahmatkesh, H. G., and Naeimi, M. (2020). Utilization of sustainable energies for purification of water. Adv. J. Chem. Sect. A. Sami Publ. Co. 3, 493–509. doi:10.33945/SAMI/AJCA.2020.4.11
Samani, N., Khalil, R., Seljeskog, M., Bakken, J., Thapa, R. K., and Eikeland, M. S. (2024). Experimental and simulation studies of oxygen-blown, steam-injected, entrained flow gasification of lignin. Fuel 15, 362. doi:10.1016/j.fuel.2023.130713
Secretaría de Energía (SENER) (2023). Programa de Desarrollo del Sistema Eléctrico Nacional. Mexico: Secretaría de Energía.
Sikarwar, V. S., Zhao, M., Clough, P., Yao, J., Zhong, X., Memon, M. Z., et al. (2016). An overview of advances in biomass gasification. Energy Environ. Sci. 9 (10), 2939–2977. doi:10.1039/c6ee00935b
Silva, J. E., Calixto, G. Q., de Almeida, C. C., Melo, D. M. A., Melo, M. A. F., Freitas, J. C. O., et al. (2019). Energy potential and thermogravimetric study of pyrolysis kinetics of biomass wastes. J. Therm. Anal. Calorim. 137 (5), 1635–1643. doi:10.1007/s10973-019-08048-4
Sinha, M., and Panigrahy, S. R. (2024). Unveiling the urea market of the American continent. J. Exp. Agric. Int. 46 (1), 129–136. doi:10.9734/jeai/2024/v46i12302
Tuomi, S., Kaisalo, N., Simell, P., and Kurkela, E. (2015). Effect of pressure on tar decomposition activity of different bed materials in biomass gasification conditions. Fuel 158, 293–305. doi:10.1016/j.fuel.2015.05.051
Vassilev, S. V., Baxter, D., Andersen, L. K., and Vassileva, C. G. (2010). An overview of the chemical composition of biomass. Fuel 89 (5), 913–933. doi:10.1016/j.fuel.2009.10.022
Wieckert, C., Obrist, A., Zedtwitz, P., Maag, G., and Steinfeld, A. (2013). Syngas production by thermochemical gasification of carbonaceous waste materials in a 150 kWth packed-bed solar reactor. Energy and Fuels 27 (8), 4770–4776. doi:10.1021/ef4008399
Keywords: solar gasification, biomass gasification, thermodynamic modelling, bioenergy, bioenergy in Mexico
Citation: Maytorena-Soria VM, Buentello-Montoya DA and Aldana H (2025) Valorization of agricultural waste biomass via solar-driven gasification in regions with high solar resources: the case of Mexico. Front. Chem. Eng. 7:1648187. doi: 10.3389/fceng.2025.1648187
Received: 16 June 2025; Accepted: 31 October 2025;
Published: 01 December 2025.
Edited by:
Kavitha S, Karpagam Academy of Higher Education, IndiaReviewed by:
Sankar Chakma, Indian Institute of Science Education and Research, Bhopal, IndiaElnaz Sohani, University of Nottingham, United Kingdom
Narendra Sadhwani, Thermo Fisher Scientific, United States
Copyright © 2025 Maytorena-Soria, Buentello-Montoya and Aldana. This is an open-access article distributed under the terms of the Creative Commons Attribution License (CC BY). The use, distribution or reproduction in other forums is permitted, provided the original author(s) and the copyright owner(s) are credited and that the original publication in this journal is cited, in accordance with accepted academic practice. No use, distribution or reproduction is permitted which does not comply with these terms.
*Correspondence: David Antonio Buentello-Montoya, ZGF2aWQuYnVlbnRlbGxvQHRlYy5teA==