 Saptarshi Dey
 Abhishek Sahu1
 Anushree Malik
- 1Applied Microbiology Laboratory, Centre for Rural Development and Technology, Indian Institute of Technology (IIT) Delhi, New Delhi, India
- 2Department of Chemical Engineering, Indian Institute of Technology Delhi, New Delhi, India
The integration of microalgal systems into carbon capture technologies offers a dual advantage; the mitigation of anthropogenic CO2 emissions and the sustainable production of high-value macromolecules. This study presents the engineering and pilot-scale operation of a 200 L microbubble-assisted hybrid photobioreactor for CO2 bio-fixation. Subsequent valorisation into lipids and biopolymers was obtained using an indigenous alga, Poterioochromonas malhamensis. A novel 3D-printed microbubble generator assembly (MBG) was retrofitted to a 1.2 m carbonation column (CC) and integrated with a 200 L high-rate algal pond (HRAP). Sequential high-speed bubble imaging at different column heights (H) under different liquid flow (QL) and gas flow (QG) regimes was processed and interpreted using a MATLAB based bubble analyser. A Gaussian distribution function was used to establish the most probable bubble diameter in the range 400–800 µm while achieving microbubble density of 61%–90% in the carbonation column to support efficient gas–liquid exchange. The hybrid reactor was further automated using a real-time pH feedback loop for CO2 dosing under photoautotrophic conditions with 5% (v/v) CO2 supplementation. The system maintained the culture media bicarbonate buffer in the optimal range (pH 7.2–8.5). The hybrid reactor yielded 0.423 gL−1 of biomass with a carbon content of 43.06% DCW, a CO2 bio-fixation rate of 44.05 mgL−1d−1, and polyhydroxybutyrate (PHB) content of 5.79% DCW. Our findings demonstrate the scalability, automation potential, and bioproduct yield enhancements of the hybrid system, making it a viable model for CCUS (carbon capture, utilization, and storage) through algal valorisation. The approach offers a technically sound, energy-efficient route for transforming inorganic carbon into commercially relevant algal macromolecules.
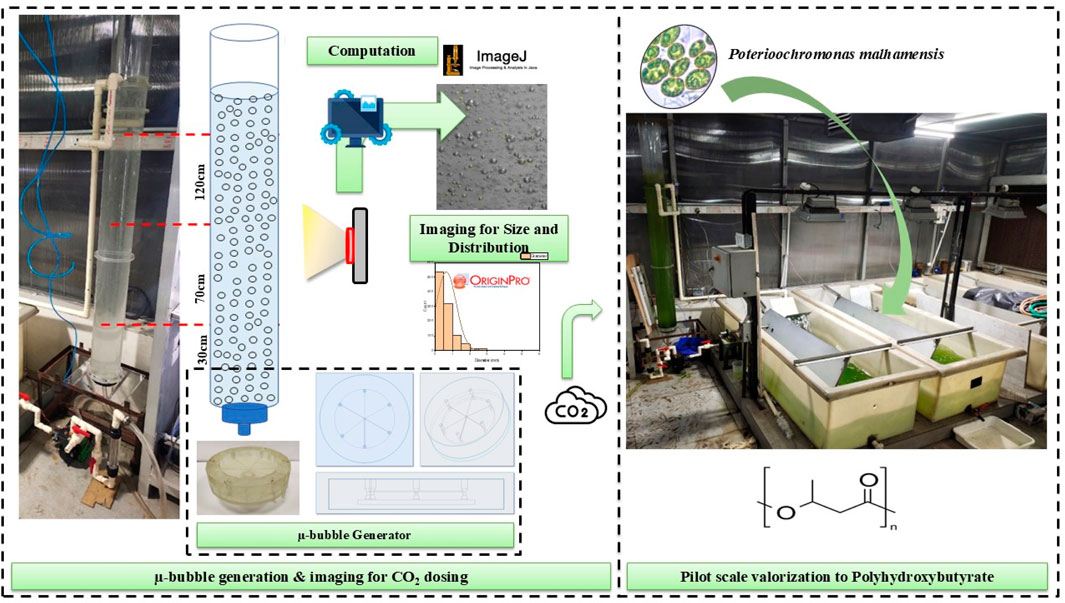
GRAPHICAL ABSTRACT |
1 Introduction
Rising atmospheric carbon dioxide (CO2) concentrations are a primary driver of climate change, with global levels exceeding 419 ppm in 2023—over 50% higher than pre-industrial baselines (Lindsey, 2024). These values are projected to increase up to 60% by 2100 if current trends continue (Kumar et al., 2016). Industrial sectors such as power generation, cement, and steel manufacturing collectively emit several gigatonnes of CO2 annually, necessitating scalable carbon capture, utilization, and storage (CCUS) technologies (Yoro and Daramola, 2020; Ge et al., 2024). Conventional physicochemical capture methods as reported by Dastur Energy Inc., such as amine scrubbing, solid adsorbents, membranes, and direct air capture, are limited by high energy demand and regeneration costs, as the overall value chain of CCUS is beneficial only through the recovery of energy and materials (Mukherjee and Chatterjee, 2023). This highlights the need for sustainable and low-cost alternatives for in situ CO2 sequestration and valorisation that enable the direct conversion of captured CO2 into value-added products with minimal downstream processing, thereby ensuring immediate value realization.
Among the diverse CCUS methods, microalgae-based CO2 capture has emerged as a promising biotechnological route. Through photosynthesis, microalgae have been reported to fix CO2 as high as 1.83–1.88 g CO2 per gram of dry algal biomass (Kong et al., 2024; Song et al., 2024) while generating biomass suitable for biofuels, bioplastics, and other bioproducts. Several studies have reported successful lab-scale CO2 sequestration, with CO2 capture per gram of dry biomass potential at 1.83 g using Chlorella vulgaris (Rosenberg et al., 2011), 1.74 g using Scenedesmus obliquus (Song et al., 2024), and 1.426 g using a STP isolate PA4 strain (Dey et al., 2020). Despite these, the translation to the commercial deployment of economically feasible microalgal CCUS-based value-added products is nearly non-existent due to constraints with mass cultivation systems (Singh and Mallick, 2017). The primary constraints include CO2 concentration, poor gas–liquid mass transfer efficiency, high operational costs, microalgal species, and reactor culture conditions (Morales et al., 2018; Olabi et al., 2022).
The removal of CO2 from industrial flue streams, particularly those with low CO2 concentrations (5%–10% v/v), using aqueous-based liquid phases such as alkaline solutions, amine solutions, and nano emulsions has been the primary challenge (Olabi et al., 2022). The most explored gas–liquid contactor—bubble column reactors along with their conventional ceramic and steel perforated spargers—faces criticism in terms of difficult bubble size regulation and mass transfer efficiency, lack of consistency in bubble–liquid hydrodynamics at scale-up, and bubble–algal cell interactions that affect biomass growth (Rezvani and Rostami, 2023; Uyar et al., 2024). Enhancing CO2 mass transfer efficiency in bubble columns can be achieved by increasing gas holdup and the gas–liquid interfacial area (Salehizadeh et al., 2020). Recent studies have demonstrated that microbubbles (<1,000 µm) significantly improve CO2 delivery efficiency in raceways by providing a larger interfacial area and longer gas residence time with minimal buoyancy (Yin et al., 2015; Cheng et al., 2016; Yang et al., 2016; Li et al., 2019). Among various microbubble generation systems, Venturi-type injectors are particularly practical and find extensive applications in various industrial processes (Bae et al., 2022). Bubble formation through hydrodynamic cavitation at the Venturi throat produces a wide distribution of micron to millimetre sized bubbles, with their size and distribution closely governed by liquid and gas flow rates (Li et al., 2017; Feng et al., 2020; Dey et al., 2020).
Thus, microbubble injection enhances CO2 dissolution and uptake by increasing the gas–liquid interfacial area and reducing bubble rise velocity, thereby improving mass transfer efficiency at low energy input (You et al., 2024). However, very few studies have demonstrated the pilot-scale implementation of Venturi-based continuous CO2 delivery in large-scale microalgal systems (Du et al., 2012; Huang et al., 2020).
On the other hand, polyhydroxyalkanoates (PHAs) encompass a class of semicrystalline microbial biopolymers, which are a type of intracellular carbon storage material, with polyhydroxybutyrate being the most common and widely obtained PHA, having properties such as high hydrophobicity, degradability, processibility, thermoplasticity, and biocompatibility (Costa et al., 2018a; Costa et al., 2018b). Recent studies report several microalgal strains with the potential to produce PHA molecules under autotrophic and mixotrophic conditions. Autotrophic PHA production has been reported in Spirulina LEB-18 with a yield of 9.56% of its dry cell weight as PHA (Costa et al., 2018b), and Nostoc muscorum with a yield of 69% PHB on a dry cell weight basis (Bhati and Mallick, 2015), while Taepucharoen et al. (2017) reported an engineered strain of Oscillatoria okeni TISTR 8549 producing 14.4% PHB-co-PHV (polyhydroxyvalerate) under autotrophic conditions. The key advantage of algal PHA synthesis lies in its utilization of CO2, an identified GHG, as the primary carbon source. This enables the integration of algal reactors with CO2 sparging from concentrated emission streams, serving as a potential route for biological carbon capture and storage through PHA production.
In this study, we report the design, fabrication, and performance evaluation of a 200 L pilot-scale hybrid photobioreactor which integrates a resin-printed microbubble generator assembly (Dey et al., 2023) with a modified raceway pond through a recirculating carbonation loop. The system was tested for the cultivation of the indigenous strain Poterioochromonas malhamensis (genus: Poterioochromonas; family: Ochromonadaceae) under continuous sparging with 5% (v/v) CO2. Reactor hydrodynamics, bubble-size distribution, biomass productivity, CO2 bio-fixation efficiency, and polyhydroxybutyrate (PHB) accumulation were systematically assessed and benchmarked against a 10 L prototype system. This research builds directly on our earlier development of the recirculating media photobioreactor (RMPBR), where we rigorously established the efficacy of a novel recirculation-based design for enhanced mass transfer and biomass productivity (Dey et al., 2020). The present pilot-scale study advances that foundation by scaling the system without compromising yield while providing deeper insights into microbubble generation, retention, and size distribution. It incorporates an automated pH-driven carbonation system for stable operation and the valorisation of carbon into high-value biopolymers such as PHB. Together, these advances demonstrate the feasibility of hybrid microbubble-assisted photobioreactors as a scalable resource for in situ industrial CO2 capture and sustainable bioproduct generation.
2 Materials and research methodologies
2.1 Microorganism and culture medium
The original microalgal consortium PA4 was previously isolated from a sewage treatment plant (STP) (Choudhary et al., 2016) and maintained in sterile algae culture agar slants enriched with BG-11 media (HiMedia) in the laboratory at 4 °C at Applied Microbiology Laboratory-IIT Delhi. The consortium was revived in synthetic BG-11 culture media plates (Supplementary Section 1.1a). The most dominant colonies from each plate were transferred to sterile BG-11 slants and stored for preservation at 4 °C for up to 2 months as well as used for the phylogenetic identification of species.
After enrichment, the algal strain PA4 was genetically identified using 16S rRNA sequencing coupled with the BLAST (Basic Local Alignment Search Tool) algorithm in the NCBI database (See Supplementary Section 1.1b). The analysis revealed a 98% similarity with P. malhamensis.
Throughout the experiments, unless otherwise stated, mature slants of P. malhamensis were used for further upscaling and sub-culturing at an inoculum ratio of 20% (v/v).
2.2 Microalgae cultivation for PHA screening
Shake-flask studies were done using standard BG-11 media (HiMedia) in 250 mL conical flasks in a rotary shaker at a regulated 25 °C ± 0.5 and 24 h illumination of 32 μmol m−2s−1 at 110 RPM. (Orbitek, Scigenics Biotech, India). Furthermore, to assess whether higher concentrations of carbonates (2–3 times higher) influence PHA production or biomass yield, BG-11 cultures were supplemented with three-fold sodium bicarbonate (compared to standard BG-11 media having an Na2CO3 concentration of 0.02 gL−1). The OD680 and chlorophyll-a content were measured to determine the batch growth, and experiments were stopped once a stationary phase was attained and a drop in OD reflected the onset of cell death.
2.3 Algal growth and biomass estimation
Microalgal growth was estimated by monitoring optical density at 680 nm (absorbance at 680 nm), dry cell weight (DCW), and biomass productivity as described below.
For OD680 estimation, 2 mL of cell suspension was sampled and immediately read using a 96 well ELISA plate reader (Eon, BioTek Instruments, USA).
For DCW estimation, a known volume of sample was centrifuged at 9,000 g for 10 min at 4 °C. The microalgal pellet was resuspended in 2 mL of Milli-Q water, and this was put in pre-weighed aluminium pans, dried for 24 h in a hot air oven at 60 °C, and re-weighed until constant mass was achieved. The difference in mass was used to calculate DCW and expressed in gL−1 as per the formula
where Wi and Wf are the initial and final weight of the pans and V is the sample volume in mL.
The biomass productivity “Pmax” was obtained by linear regression of the graph of DCW against time (d), where the gradient represented biomass productivity Pmax is expressed in mgL−1d−1.
2.4 Biochemical characterization of algal biomass
Biochemical and elemental analyses of harvested and lyophilized biomass (Allied Frost FD-3, India) were performed after fine grinding using a mortar pestle as follows.
2.4.1 Volatile solids and ash content
Volatile solids (VS) and ash content were determined by igniting the dried biomass sample in a ceramic crucible at 550 °C in a muffle furnace (U.S. Environmental Protection Agency, 2001). In brief, 0.5 g of dried sample was put in a pre-weighed crucible (both previously placed in a hot air oven at 55 °C overnight) and burnt for 2 h in the muffle furnace. The crucible was weighed again, and VS was estimated thus:
where Wt is weight of the crucible plus dried biomass, Wv is weight of the crucible plus ash, and Wd is weight of the empty crucible. Ash content was reported as the difference between VS and total solid content.
2.4.2 Elemental composition
For elemental composition, the lyophilised biomass was ground in mortar and pestle and dried overnight in an air dryer at 60 °C. Fine powder of biomass (4–5 mg) was packed in airtight tin boats (manufactured by Elementar). The carbon, nitrogen, hydrogen, and oxygen content (% w/w) were determined by CHNO Elemental Analyser (Thermo Finnigan, FlashEA 1112 series, Italy) according to the manufacturer’s recommendations. The composition of the microalgal biomass was then reported in terms of percentage of total solids (TS).
2.5 Identification, extraction, and quantification of intracellular polyhydroxyalkanoates (PHAs)
2.5.1 Verification of PHA accumulation by phase-contrast microscopy
To verify intracellular polyhydroxyalkanoate (PHA) accumulation, a method proposed by Wei et al. (2011) was adopted that included live cell staining using Sudan Black B (Merck). To perform Sudan Black B staining for intracellular PHA identification, 20 µL of mature (15th day) microalgal culture was heat-smeared onto a clean glass slide to fix the cells. The slide was then flooded with 0.3% (w/v) Sudan Black B (Merck) solution (prepared in ethanol) and incubated for 20 min in a chamber maintained at 30 °C to enhance the staining process. After incubation, the slide was rinsed gently with 70% (v/v) ethanol to remove any excess stain. Safranin was added for 30 s to counterstain the background cells. Finally, the smear was observed under oil immersion phase-contrast microscopy at ×100 magnification (Nikon Eclipse Ti-U, Japan), where PHA granules appeared blue-black against a pinkish background. This protocol effectively visualizes intracellular PHA granules in microalgal cells.
2.5.2 Spectrophotometric quantification of polyhydroxybutyrate in algal biomass
The crotonic acid assay originally described by Law and Slepecky (1961) was used to confirm the presence and quantity of polyhydroxybutyrate (PHB) in microbial cells. The assay relies on the thermal conversion of PHB into crotonic acid under acidic conditions.
A 10 mL cell suspension sample from the shake flask was centrifuged, and the pellet was bleached using 4% (v/v) NaOCl (Thermo Fisher Scientific) at 37 °C for 1 h in a water bath. After bleaching, the suspension was cooled, centrifuged at 9,000g for 10 min at 4 °C, and the supernatant was discarded. The cell debris pellet was washed twice with Milli-Q water and re-pelletized under the same centrifuge conditions. Polymer was extracted by resuspending the pellet in boiling HPLC-grade CHCl3 (Thermo Fisher Scientific) and incubating at 60 °C for 2.5 h under reflux. After centrifugation, the organic phase was collected, and PHB granules were obtained by evaporating CHCl3 overnight at 45 °C. The granules were treated with 98% (v/v) AR-grade H2SO4 (Thermo Fisher Scientific) under reflux for 15 min at 100 °C, degrading PHB to crotonic acid. Absorbance at 235 nm was measured using a UV-Vis spectrophotometer (PerkinElmer Lambda 35), and PHB content was quantified from a crotonic acid (Sigma-Aldrich) standard curve in µgmL−1.
2.5.3 Fourier transform infrared-attenuated total reflectance (FTIR-ATR) for PHB functional group identification
For FTIR analysis of polyhydroxybutyrate (PHB) produced from algal biomass, PHB was extracted and converted to granules (as per Section 2.4.2). The granule sample underwent FTIR spectroscopic analysis (Thermo Nicolet iS50), where it was exposed to infrared radiation to identify characteristic functional groups present in the PHB structure.
The resultant spectra were compared with known PHB references for sharp peaks approximately 1,720 cm−1 associated with the C=O stretching vibration from the ester group, which is a significant feature of PHB. Additionally, the C-H bending vibrations approximately 1,375 cm−1 and the C-O stretching vibrations near 1,200 cm−1 and near 2,920 cm−1 corresponding to the C-H stretching vibrations, typical of PHB’s structure, were also analysed (Hagagy et al., 2022). Functional groups were identified and labelled using a freeware IRPal 2.0 (van Heeswijk, 2024).
2.5.4 Gas chromatographic (GC) analysis of extracted PHB
Qualitative and quantitative assessment of PHB was performed using GC analysis by estimating derived volatile hydroxycarboxylic acid methyl esters using an Agilent 8860 GC system equipped with a DB-FATWAX UI column.
Detailed sample preparation and quantification protocol are discussed in Supplementary Section 1.2.
To analyse the chromatograms, a pure PHB standard (Sigma-Aldrich) was used to generate a standard curve. The normalized peak area was plotted against the corresponding concentrations to obtain a linear regression equation.
The PHB content (weight) in the unknown sample was determined using this equation and further expressed as a percentage of dry cell weight (DCW).
2.6 Determination of CO2 bio-fixation rate
The CO2 bio-fixation rate (RCO2) was estimated using the equation given by Ding et al. (2020) and expressed in mgL−1d−1:
where Cc is the carbon content in biomass (% w/w), Pmax is the microalgae productivity (mgL−1d−1), and MCO2 and MC are the molar mass of CO2 and carbon (gmol−1), respectively.
2.7 Components and governing principles of carbonation and cultivation system
2.7.1 Microbubble generator assembly
The Venturi effect utilizes the principle of energy conservation in fluid dynamics, as stated by Bernoulli’s principle: in a streamlined flow, an increase in fluid velocity through a narrow section leads to a corresponding drop in pressure.
The fundamental equations governing the working of a Venturi tube have been summarised based on Bernoulli’s principle (derived from conservation of energy for fluid flow—White, 2021), continuity equations (conservation of mass for incompressible and compressible flows—Munson et al., 2013), and flow through narrow orifices (ideal gas flow equations for isothermal conditions—Pritchard and Mitchell, 2015).
The pressure drop at a Venturi throat as a function of the inlet flow rate of a liquid such as water can be determined using Bernoulli’s equation and the continuity equation.
The continuity equation for an incompressible fluid (such as water and algal culture) is given as
where Q is the volumetric flow rate, A1 and A2 are cross-sectional areas at the inlet and throat, and V1 and V2 are flow velocities at the inlet and throat.
From Equation 2.1, the velocity at throat V2 can be related to the velocity at inlet V1 by
Applying Bernoulli’s equation between the inlet and the throat while assuming negligible elevation difference and ignoring frictional losses:
where P1 and P2 are pressure at the inlet and throat, respectively, ρ is density of the fluid, and V1 and V2 are flow velocities at the inlet and throat, respectively.
We rearrange the equation to find the pressure difference:
From Equation 2.1, we substitute
In line with our previous Venturi injector design (Dey et al., 2020), the throat ratio is maintained at 0.5. QL is the volumetric flow rate of liquid, QG is the volumetric flow rate of gas, and ρl and ρg are the density of liquid and gas, respectively.
For a throat ratio of 0.5, Equation 2.4 modifies thus:
While calculating the flow rate at the suction inlet, assuming the gas behaves as an ideal gas and undergoes isothermal expansion, the volumetric flow rate of the gas can be expressed using the equation for flow through an orifice as
where Cd is discharge coefficient (typically ≈ 0.9 for Venturis), and Ag is the cross-sectional area of the suction inlet.
By substituting Equation 2.5 into Equation 2.6 and simplifying, we obtain
where
This shows that the gas flow rate at the suction inlet is directly proportional to the liquid flow rate at the primary inlet (Equations 2.7a, 2.7b, and 2.8). Furthermore, Equation 2.7a serves as the primary governing relationship for the system design, since the liquid flow rate corresponds to the media recirculation rate of the algal culture, which in turn determines the CO2 injection rate into the carbonation tube. Additionally, this approach facilitates the prediction and adjustment of carbonation conditions owing to the direct one-to-one dependence among the governing parameters.
Keeping all these in consideration, a Venturi injector (henceforth called “microbubble generator”—MBG) was conceptualised (Figure 1a). The primary inlet and outlet each have a diameter of 0.5 cm, while the suction inlet is 0.125 cm in diameter. The throat diameter is 0.25 cm, resulting in a throat ratio of 0.5. The convergence and divergence angles (β and α) were set at 22.5° and 25°, respectively. Furthermore, an assembly of six such MBGs operating under exactly identical hydrodynamic flow conditions was conceptualised. As shown in Figure 1b, six MBGs were placed in parallel such that all six inlets connected to a hollow chamber at the base that was the receiver for liquid from a bottom inlet of 1.28 cm diameter; the chamber itself had a diameter of 10.5 cm and a height of 0.5 cm. Additionally, we designed a fine network of gas passages all interconnected with the suction inlet of each of the six MBGs (Figure 1c) that ultimately connected to a gas inlet at the bottom. The device (henceforth called “microbubble generator assembly”) had an outer diameter of 13.4 cm and a height of 3 cm.
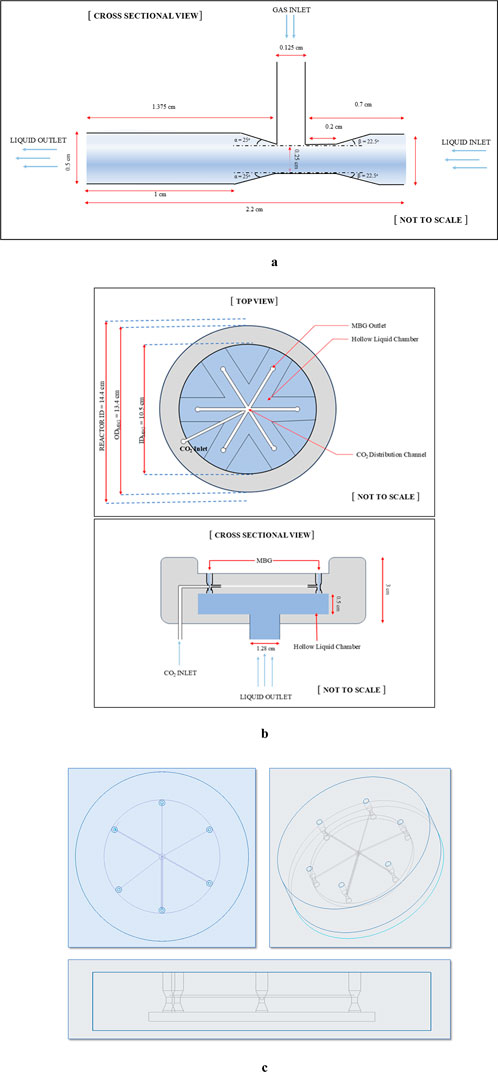
Figure 1. (a) Inner dimensions and measures of the MBG. (b) Schematics of the conceptualised Venturi tube assembly. (c) CAD drawing of the MBG assembly showing the wireframe structure of the inner gas network among six Venturi injectors.
The most favourable method for creating such a complicated integrated liquid–gas network of such small dimensions is the use of stereolithography (SLA) 3D printing which, owing to its precision and smooth surface finish, seems most ideal for creating detailed prototypes such as the MBG assembly in question (Zuchowicz et al., 2022).
The 3D model of the microbubble generator assembly was prepared in Creo 7.0.1.0, exported to PreForm software as a .stl file, and sliced into layers of 100 microns in PreForm, along with the addition of support structures. The printing material, as used in Feng et al. (2020), was a clear liquid photopolymer resin procured from Formlabs software (Clear Resin (RS-F2-GPCL-04)). The 3D model from Formlabs was transferred to the 3D printer Formlabs Form 3. The liquid resin was selectively exposed in the 3D printer to a 250 mW laser and an 85-micron spot size to create the hardened design of the 3D model. The 3D-printed microbubble generator assembly was removed from the build platform and washed in isopropyl alcohol (IPA) for 30 min to remove the uncured excess resin from its parts. After rinsing in the IPA, the 3D-printed microbubble generator assembly was dried using nitrogen and was then post-cured by exposure to 405 nm ultraviolet (UV) light for 30 min at 60 °C to promote crosslinking (Zguris, 2016). The final product after curing is shown in Figure 2.
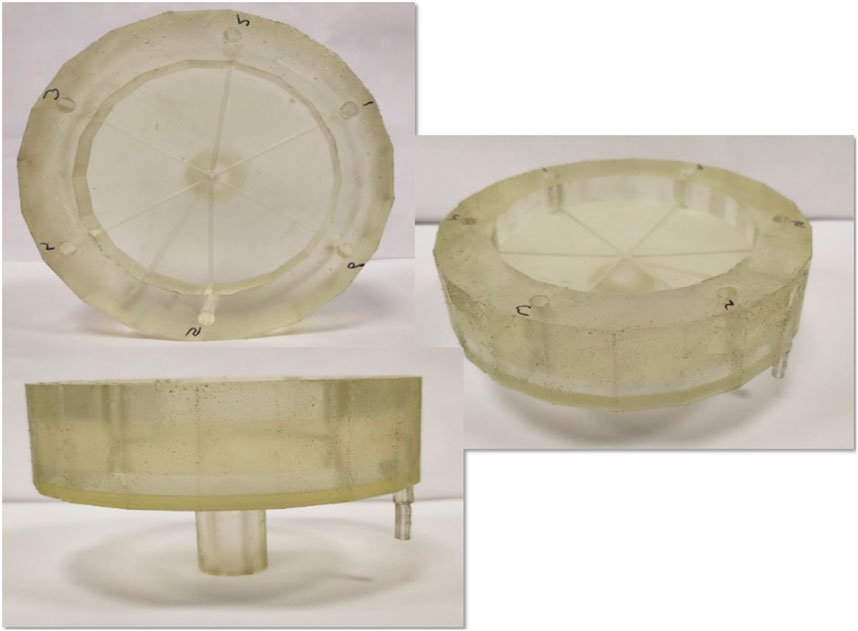
Figure 2. Final SLA 3D-printed microbubble generator assembly (Dey et al., 2023).
We subsequently applied for and were granted a certificate of registration of design vide Design no. 375334–001 issued on 30/11/2023 by the patent office, Government of India (Dey et al., 2023). Table 1 summarises the dimensions of the MBG assembly, including internal channels and orifices.
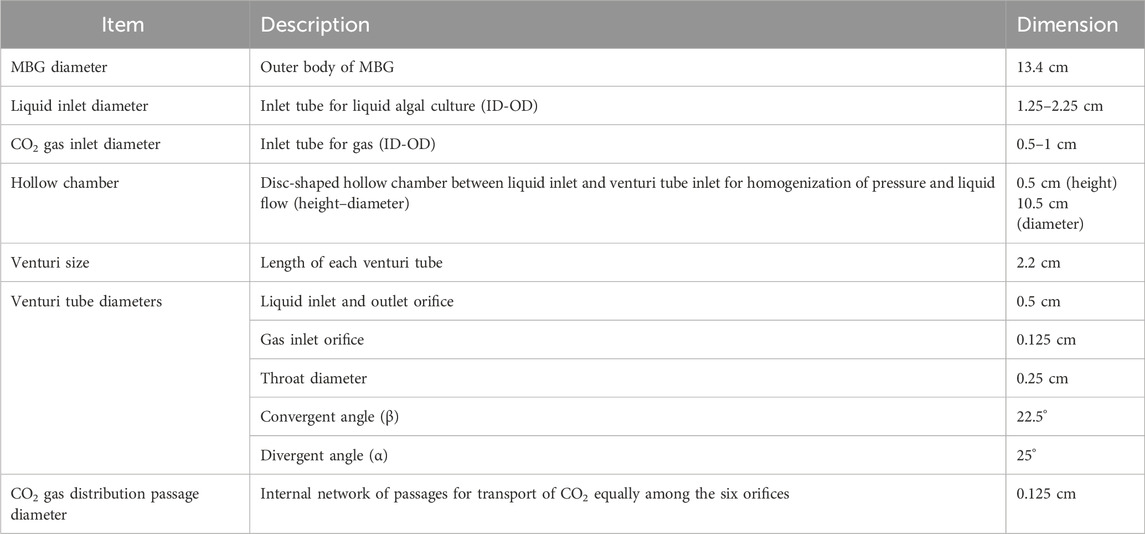
Table 1. Summary of the dimensions of various sections of the MBG assembly.
2.7.2 Carbonation column and media recirculation loop
Following the approach of Dey et al. (2020), the carbonation column was constructed from 3 mm thick transparent polyacrylate, supported at the base by a 10 mm thick polyacrylate sheet of 14.4 cm diameter with an operational volume of 20 L. The recirculation system was configured for a height of 150 cm, wherein the MBG assembly was connected at the base of the carbonation column; liquid introduced through the MBG inlet passed through the Venturi injector assemblies into the column base, while the recirculation outlet at the column top was directed back into the raceway tank. It was equipped with baffles for culture mixing via a pump positioned at the bottom of the raceway opposite the column return, thereby completing the liquid recirculation loop. Supplementary Figure S1 shows the schematics of the carbonation column and recirculation loop, while Figure 3 shows the actual column, raceway, recirculation pump, and liquid pathways.
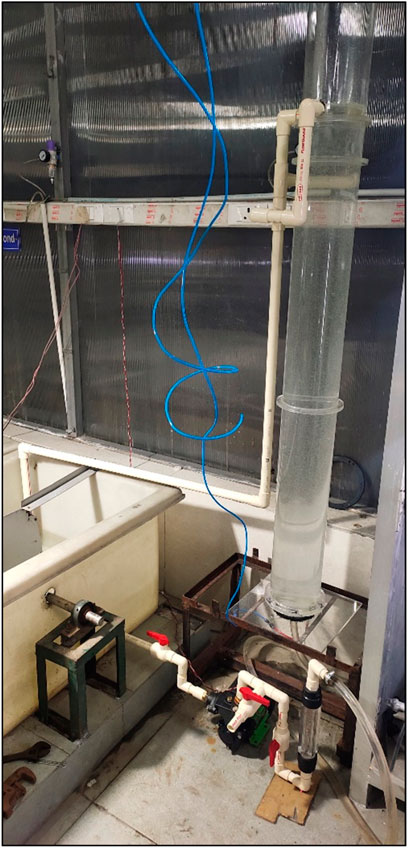
Figure 3. Actual carbonation column, recirculation pump, and raceway constituting the carbonation–recirculation circuit.
2.7.3 Modified raceway
One of the pilot raceway systems reported by Kumar et al. (2017) with a 200 L capacity was modified by adding an outlet at the bottom that connected to the recirculation pump via a ball valve for liquid flow regulation. An inlet pipe from the carbonation column was fixed on the opposite end that drained carbonated culture directly back near the mixing baffles for media homogenization and the even distribution of dissolved inorganic carbon (DIC) in the culture. An adjacent raceway was chosen as the control and operated normally without any modifications. Figure 4 illustrates the hybrid raceway-carbonation reactor system.
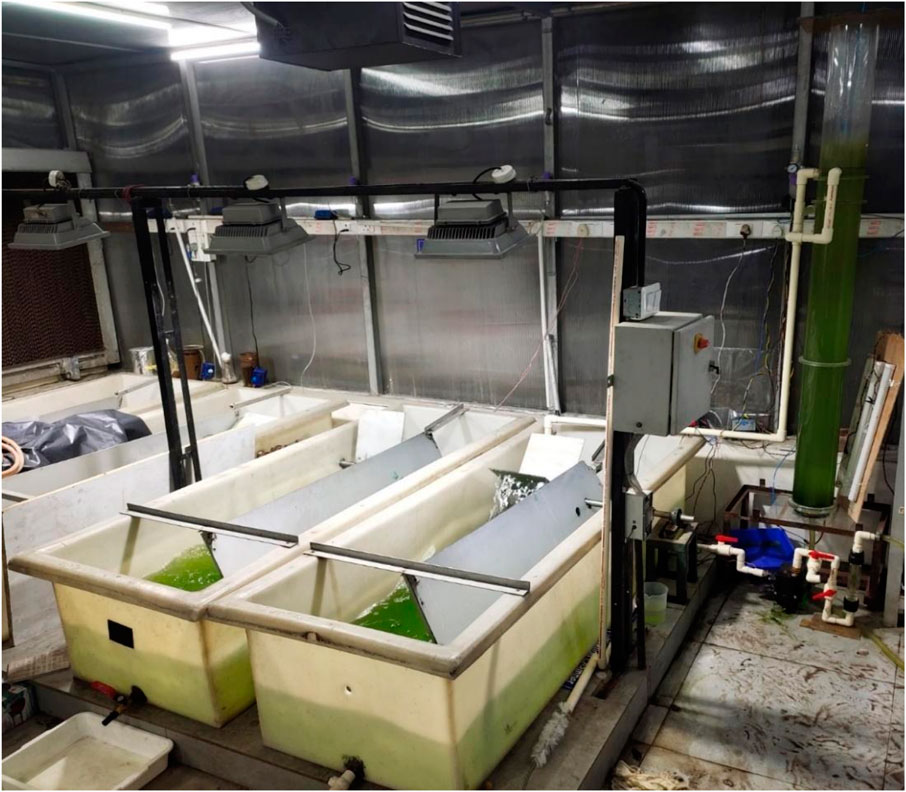
Figure 4. Modified raceway system hybridised with the carbonation column for real-time CO2 assisted Poterioochromonas malhamensis cultivation. The unmodified raceway acted as control.
2.7.4 Automation and feedback
The automation for the carbonation system was achieved using a pH sensor (Countronics, S150C) dipped into the culture media in the raceway. This was connected to a pH controller (Countronics, 112 pH) which was connected parallel to a recirculation pump (Kirloskar, Chotu) with a rated water-flow rate of 30 LPM up to a height of 6 m. In parallel, the pH controller was also connected to a solenoid valve (Janatics, E12614A) which was connected to the CO2 cylinder on one end via a flow control rotameter and to the gas inlet of the MBG assembly on the other end. The recirculation pump was connected on one end to the raceway and on the other end to the liquid inlet of the MBG assembly via a flowmeter to monitor the liquid flow rate (Supplementary Figure S1). A ball valve was placed between the raceway and pump to control the liquid flow rate that was recorded on this flowmeter to regulate the liquid flow rate (QL). The pH controller was further connected to a data logger (Countronics, CT708U) that recorded the change in pH. Supplementary Figure S2 shows the actual instruments used for pH regulated automation for CO2 delivery.
2.8 Operation and carbonation studies
The operation of the hybrid photobioreactor system was similar to that of the RMPBR as reported by Dey et al. (2020) with the following conditions and modifications.
i. For all experiments, tap water (TW) was used.
ii. The 200 L raceway reactor with its own agitation system acted as the recirculation tank. Thus, culture mixing was governed by media recirculation both in the column and mechanically by baffles in the raceway.
iii. While the raceway operated continually, the operations of the recirculation pump and carbonation system were automated using a pH controller with specific operation programming, creating several cycles of automated sparging based on the pH profile of the culture media.
iv. Illumination was provided at the raceway system instead of the carbonation column.
v. Biomass harvesting by auto-settling could now be done in the raceway itself by switching off the carbonation and baffle equipment in situ.
2.8.1 Bubble size imaging at various flow rates and regimes
To determine the real-time bubble size and distribution, high-speed imaging was performed using a Nikon D5200 camera placed 30 cm perpendicular from the carbonation column. The F-stop was kept at f/5.6, exposure time was 1/4,000 s, ISO speed was ISO-1600, focal length was 55 mm, and it was under shutter priority mode. No manual/digital zooming was done. Liquid and gas flow control and conditions as discussed in Supplementary Section 1.3 were established for imaging.
The imaging was performed at three different heights (H) of the column: base (30 cm from bottom plate), middle (70 cm from bottom plate), and top (120 cm from bottom plate). A precise line of 0.5 cm was marked at the centre of each of these heights to mark the centre of the chosen frame of image as well as a later reference for calibration during image processing. At each height, three different liquid flow rates corresponding to three different hydrodynamic flow regimes were evaluated. Liquid flow (QL) rates of 5 Lmin−1, 10 Lmin−1, and 15 Lmin−1 were chosen. Additionally, for each QL, six gas flow rates (QG) were taken: 0.1, 0.3, 0.5, 0.7, 0.9, and 1.1 Lmin−1, respectively. Thus, a total of 54 images corresponding to 54 datasets of bubbles were obtained that were used to visualise and evaluate the bubble profile inside the column under various scenarios of recirculation–carbonation. Figure 5 summarises the conditions chosen for each variable to determine the bubble profile inside the carbonation column.
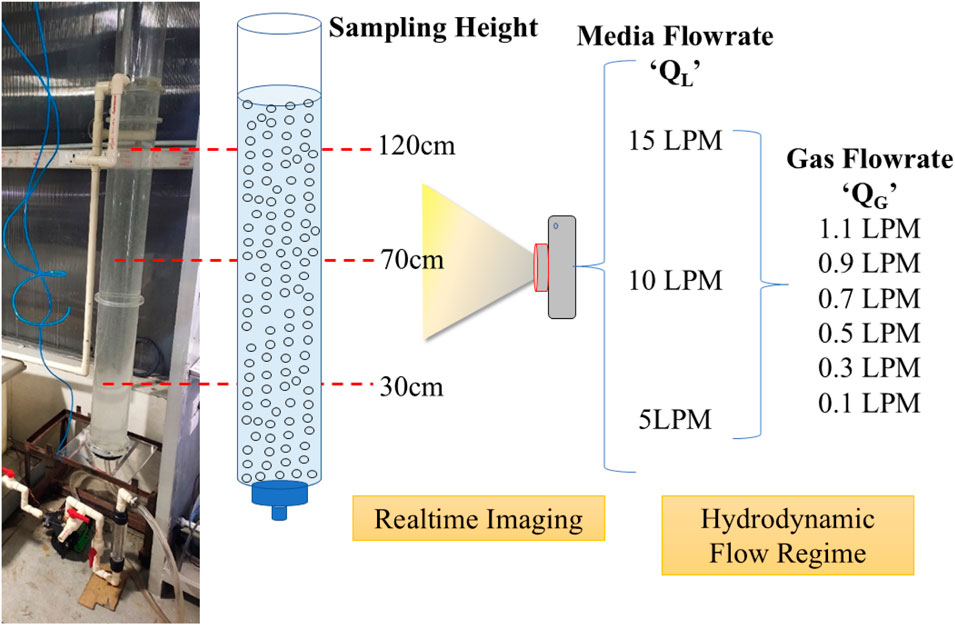
Figure 5. Experimental setup and conditions for bubble profiling inside the carbonation column using water and air as the two phases.
2.8.2 Image processing and computational studies on the bubble size distribution
All raw images were first sorted based on the specific conditions of the variable H, QL, and QG values. In brief, the processing steps involved an eight-bit rasterization using ImageJ (Schneider et al., 2012) followed by analysis for bubble size and distribution using a MATLAB based open-source software Bubble Analyser (Mesa et al., 2022). The output files were exported in .csv format for further processing.
OriginPro 8.5 (OriginLab Corporation, 2010) was used for statistical analysis using a Gaussian distribution function to determine the most probable diameter and bubble shape. A filtered histogram count of the total number of bubbles per image v/s the total number of bubbles <1,000 mm in diameter was obtained to determine the percentage of bubbles occurring as microbubbles at each height and QL and QG value. The secondary data thus obtained were used to plot and analyse the change in bubble size as a function of the three variables and determine the most favourable QL and QG values that would have maximum microbubble density for maximised CO2 mass transfer during carbonation. Figure 6 illustrates the sequential protocol defined herein to process the bubble image data into secondary data for further analysis.
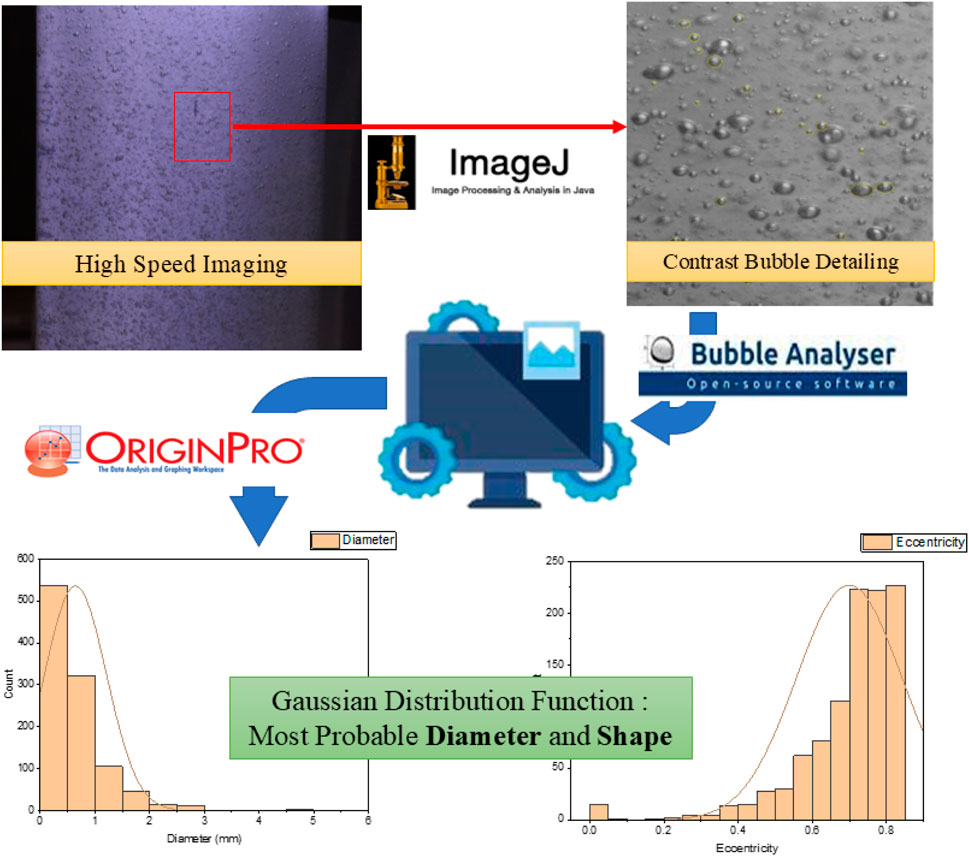
Figure 6. Process flow for determining bubble size, distribution, and overall bubble profile inside the carbonation column at various heights, and QL and QG values.
2.9 Experimental design
2.9.1 Microalgae and culture preparation
Poterioochromonas malhamensis cultivated in RMPBR (Dey et al., 2020) up to day 10 (OD680 ∼ 0.6) under CO2 sparged conditions was used as inoculum for scale-up. Commercial BG-11 culture media was also modified and minimised to the basic three nutrients: NaNO3 (1.5 gL−1), K2HPO4 (0.0314 gL−1), and Na2CO3 (0.02 gL−1) (Merck).
The control raceway was activated with 90 L of modified BG-11 and 10 L of algal culture; it was run for 7 days with baffle agitation at 29 RPM. Continuous illumination (40 μmol−1 m−2) was provided, and the system was housed in a greenhouse at 25 °C ± 0.5. Evaporative losses were compensated with tap water to maintain 100 L.
On day 8, 50 L of culture was transferred to the hybrid raceway, and 150 L fresh modified BG-11 (tap water) was added to each reactor to reach the 200 L operating volume. At the end of the first batch, 50 L of mature culture from each raceway was retained, while biomass from the remaining 150 L was harvested. The 50 L stock was reintroduced as inoculum for the next batch. During the experiments, both raceways were topped up with tap water to offset evaporation.
It may be noted here that both control and hybrid raceway systems had their dedicated illumination halogen lamps rated 60 W each (Figure 4). Nevertheless, since they were placed adjacent and partially illuminating one another, it was nearly impossible to separately determine the role of illumination, if any, on biomass yield variability.
2.9.2 Experimental conditions
The control with its baffle-based agitation represented a batch reactor, while integration and hybridization of the other raceway with a carbonation column for intermittent CO2 supplementation by definition turned the hybrid system into a fed-batch photobioreactor.
A pH-controlled automated carbonation system working on a feedback loop simultaneously recirculated the algal culture and supplied CO2 from a certified 5% v/v CO2 balance air cylinder with a regulated outlet pressure fixed at 0.6 bar. The pH controller signal worked on a parallel circuit between the recirculating pump and solenoid valve. Hence, under the right conditions as programmed, both pump and valve pushed culture media and CO2 gas in the carbonation column. The automated pH control system in the algal reactor was programmed to dynamically regulate the pH to 7.2–8.5 (see Supplementary Section 1.4), ensuring optimal conditions for algal growth and efficient carbon utilisation.
For algal growth experiments, QL and QG were, respectively, fixed using the ball valve and rotameter at 10 Lmin−1 and 0.1 Lmin−1 for laminar flow and the smallest possible bubble size. With the system completely automated, the data logger recorded the pH change during the growth and carbonation cycles on a 24-h basis and was used to monitor performance when unmonitored (night).
2.10 Statistical treatment and data representation
All experiments were performed at least in duplicate unless stated otherwise. Shake-flask cultivation and PHB quantification assays were carried out in duplicate, while 200 L pilot-scale runs were also performed in duplicate to validate reproducibility. The results are presented as mean ± standard deviation, and error bars have been included wherever applicable. Bubble imaging and microbubble-size distribution analyses were performed from single representative datasets obtained under optimized visualization conditions at each sampling height; statistical variation could therefore not be quantified for these parameters. Due to the limited dataset size at the pilot scale, ANOVA and other inferential statistical analyses were not applied.
3 Results and discussion
3.1 Poterioochromonas malhamensis as a potential PHB producer (shake-flask studies)
3.1.1 Algae identification and growth
The axenic nature of the culture through 16S RNA sequencing showed the presence of the single species P. malhamensis in the culture suspension (Supplementary Figure S3). The corresponding phylogenetic tree (Supplementary Figure S4) was constructed using 16S rRNA gene sequences. Bootstrap analysis with values above 75% indicated robust phylogenetic support for clades. P. malhamensis clustered consistently with a high bootstrap support of 97.87%.
As with Choudhary et al. (2016) and Chawla et al. (2020), P. malhamensis was found to have a high growth rate and biomass yield, as evident from the batch growth shake-flask study. While the BG-11 media culture exhibited a peak OD680 of 1.76, the carbonate-spiked media had an OD680 of 1.39 on day 12 of culture, and by day 14, the OD680 seemed to fall for both, suggesting cell death (Figure 7). Thus, an optimum batch cultivation period of 14 days seemed ideal. The results are consistent with Choudhary et al. (2016), where it was reported to have the highest biomass concentration on day 12 of approximately 1.2 gL−1 in BG-11 media. In addition, it was found that P. malhamensis was one of the best strains to grow in rural sector wastewater (RSW), and it showed a dramatic increase in biomass production when standard medium was replaced with low strength wastewater. This might be due to the original isolates being collected from an STP and, as such, they had evolved to sustain and grow rapidly under nutrient stress conditions. Similar reports by Chawla et al. (2020) show P. malhamensis to have the highest biomass yield of 1 gL−1 and 1.16 gL−1 in dairy wastewater and slaughter house wastewater, respectively. To make matters more favourable, P. malhamensis was not only reported to be tolerant of synthetic flue gas with CO2 concentrations up to 10% v/v but also used the dissolved CO2 from sparging as the primary carbon source for autotrophic growth, showing the highest OD680 and Ch-a content (5-day batch) compared to other isolates in the laboratory under similar conditions of cultivation in synthetic BG-11 media (Chawla, 2016). These results confirm P. malhamensis as robust under nutrient-limited and toxic conditions, tolerant to high CO2 levels in flue gas, and capable of carbon fixation, making it an ideal candidate for industrial-scale phycoremediation and CO2 sequestration.
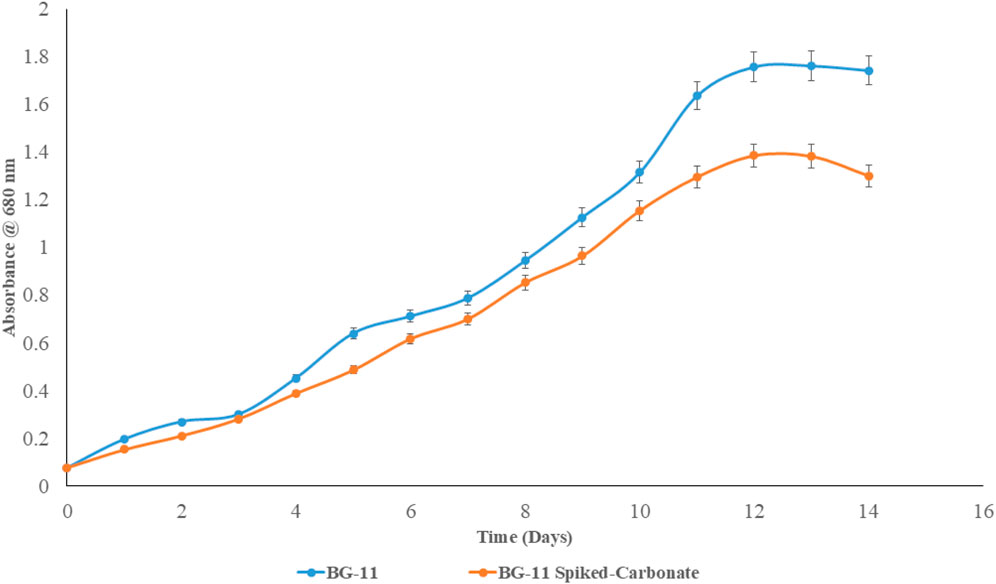
Figure 7. Growth curve of Poterioochromonas malhamensis under shake-flask conditions in BG-11- and Na2CO3-spiked BG-11 media.
Axenic cultures of indigenous microalgae adapted to a particular growth and stress condition are more effective and favourable for nutrient recovery and valorisation in treatment facilities (Mata et al., 2010). This ensures better system optimization and downstream processing of biomass for homogeneous and predictable yields of value-added compounds at large industrial scales of operation.
3.1.2 PHA production potential
Preliminary detection of the occurrence of intracellular storage molecules was confirmed by Sudan Black staining. P. malhamensis cells stained with Sudan Black clearly showed the presence of black dots and regions within the stained algal cells indicating the accumulation of lipid bodies or PHA granules (Figure 8).
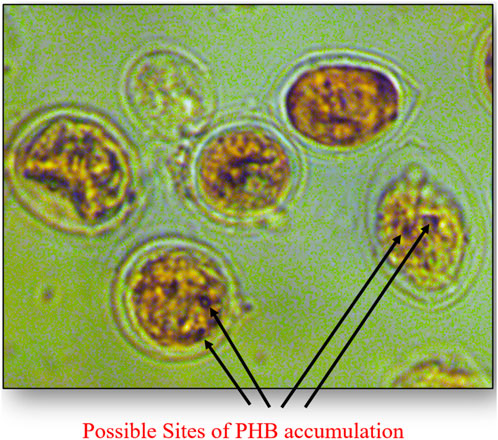
Figure 8. Sudan Black stained intracellular sites for possible PHA accumulation.
Sudan Black B is not entirely specific and may stain other lipid substances and inclusion bodies. Therefore, while the staining provided a preliminary indication of lipid or PHA presence, spectrophotometric estimation of the occurrence of polyhydroxy butyrate molecules (the most commonly occurring PHA) was conducted. Table 2 summarises PHB occurrence in mature 14-day cultures cultivated in synthetic BG-11 media. Na2CO3-spiked BG-11 (three times the Na2CO3 concentration of standard BG-11 media) was also used to determine whether surplus inorganic carbon can affect the production of storage molecules and overall biomass growth.
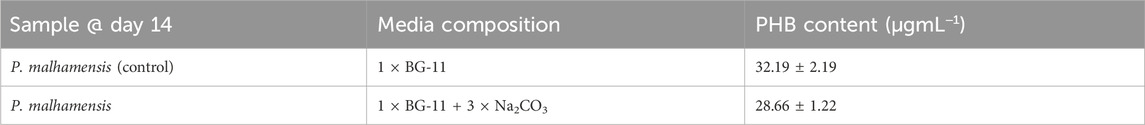
Table 2. Spectrophotometric screening for PHB occurrence in Poterioochromonas malhamensis.
A crotonic acid assay confirmed the occurrence of PHB in P. malhamensis even when cultivated in standard BG-11 media. While the quantity of PHB in both standard and bicarbonate-spiked media was nearly similar, it is to be noted from Figure 7 that the cell growth of bicarbonate spiked media was also lower than that of standard media. This can imply that an excess of inorganic carbonate/bicarbonate salts in culture may actually inhibit and compromise both culture growth and PHB accumulation potential. In microalgae, PHB is produced as a carbon and energy reserve, and its accumulation can be influenced by various environmental factors, including the concentration of sodium carbonate or carbonate species in the culture media. Ratomski et al. (2021) demonstrated that high concentrations of sodium bicarbonate inhibit the accumulation of storage molecules in Chlorella vulgaris, implying a threshold beyond which bicarbonate becomes detrimental to metabolite production. Li et al. (2018) reported that high concentrations of sodium bicarbonate (NaHCO3) inhibit cell growth in C. vulgaris while stimulating lipid accumulation. This suggests that elevated bicarbonate levels can alter metabolic pathways, potentially affecting the synthesis of various intracellular compounds, including PHB. García et al. (2020) corroborated these findings through experiments involving Scenedesmus obliquus. They found that while sodium carbonate can serve as a source of carbon, concentrations exceeding a certain threshold resulted in decreased PHB levels. This decline was attributed to an increase in pH and the formation of ammonium bicarbonate in the culture medium, which altered the carbon assimilation pathways and subsequently led to lower PHB synthesis. Higher pH levels can adversely affect the activity of key enzymes involved in the biosynthesis of PHB, such as β-ketothiolase and acetoacetyl-CoA reductase, thus significantly reducing accumulation rates. Moreover, the increase in ionic strength due to elevated carbonate concentrations can induce stress responses in microalgal cells, prompting microalgae to divert resources towards osmoregulation rather than polymer synthesis. In particular, the increase in Na+ species in water may induce salinity such that P. malhamensis might not be able to tolerate it enough for resource diversion to PHB synthase pathways. Wang et al. (2021) on the effects of different sodium salts and nitrogen sources on PHB production found that increasing NaCl concentration led to increased osmotic pressure, resulting in cell dehydration, which could potentially affect PHB production.
In light of these considerations, P. malhamensis was deemed suitable for cultivation in media where carbonate/bicarbonate concentrations remain close to standard BG-11 levels, while an alternative strategy was sought to maintain optimally high DIC to enhance PHB synthesis and provide sufficient carbon for cellular metabolism. Since P. malhamensis was reported to be tolerant of CO2 concentrations of 10% v/v, carbonation through sparging seemed the most favourable route to high biomass yield and possibly better PHB accumulation.
3.2 Reactor scale design efficiency
3.2.1 Reasons supporting MBG assembly design parameters
The Venturi effect describes the reduction in fluid pressure that occurs when a fluid flows through a constricted section of a pipe (Venturi, 1797). Venturi tubes, specifically designed for gas–liquid interactions, have become pivotal in high-end engineering applications due to their efficiency, simplicity, and versatility; they are designed for optimal energy efficiency and performance.
For a Venturi microbubble generator, bubble size and distribution are key performance indices, mainly governed by geometry and operating conditions. Owing to manufacturing limits, most reported designs use simple single-channel Venturis. A major challenge has been integrating multiple Venturi channels within a single device while minimizing its size and maintaining manufacturing precision (Feng et al., 2020). In this context, 3D printing has evolved as a notable additive manufacturing method to build complex objects through a fast layer-by-layer technique while reducing difficulty in operation and cost of fabrication. Lee et al. (2019) reported the earliest use of 3D printing for manufacturing robust Venturi MBGs to determine the effect of varying the entry and exit angles of the nozzle on the size of the generated microbubbles, air suction rate, and pressure drop, in addition to the use of a high-speed visualization technique during microbubble generation. Feng et al. (2020), who used a miniaturized microbubble generator via 3D printing for potential use in gas–liquid chemical reactions, was a leading motivator and reference in designing the present MBG assembly. This study focuses on four parameters governing the microbubble generation factor: Reynolds number (Re), throat ratio, divergent angle, and configuration (series/parallel) of Venturis.
In terms of configuration, Figures 1a–c clearly show how each of the six Venturi tubes inside the MBG assembly have their inlets at the common hollow liquid chamber and are organised in a parallel configuration inside the assembly. This indicates that the pressure at the inlet and the liquid flow rate is homogeneously distributed between the six Venturi tubes. For example, at the QL of 10 Lmin−1, each of the six inlets of the Venturi tubes has an individual liquid flow rate Qtube of one-sixth of 10 Lmin−1. This makes it easy to maintain the liquid flow in each tube by simply regulating the QL at the assembly inlet. Our design is supported by critical inferences from Feng et al. (2020) as follows.
i. The series configuration consumed more energy than the single Venturi, while the parallel configuration produced smaller sized microbubbles than the single Venturi along with maintaining good energy efficiency.
ii. At a Re value of 2,400, as the QG was raised, the Sauter mean diameter dropped by 15%–50% compared to a single Venturi under same conditions. Moreover, parallel configuration seems to favour lower Re, which is a much needed criterion for us to maintain Laminar flow in the carbonation column.
In terms of internal geometry, Figure 1a shows the convergent and divergent angles β and α at 22.5° and 25°, respectively. These angles play a crucial role in microbubble production by influencing fluid acceleration, pressure distribution, and cavitation phenomena. While the convergent angle facilitates the acceleration of the liquid, reducing pressure at the throat and promoting gas suction and bubble formation, the divergent section allows for pressure recovery and influences bubble detachment and size.
Feng et al. (2020) studied the relationship between divergent angle, turbulence energy dissipation rate, and their impact on bubble size. Divergent angles between 5° and 25° were tested, considering that a higher turbulence energy dissipation rate corresponded to a larger number of smaller daughter bubbles (compared to a single Venturi). They reported the highest turbulence energy dissipation rate for a divergent angle of 25° indicated that a larger divergent angle is recommended in a Venturi microbubble generator. Similar studies by Li et al. (2019) in a 3D-printed Venturi tube involving a host of convergent and divergent angles (5°–19°) reported that a larger divergent angle was associated with a higher cavitation inception velocity, leading to better bubble generation. Similarly, Li et al. (2017) reported that a larger divergent angle significantly decreased the Sauter mean diameter while the bubble profile is more uniformly distributed inside the chamber.
Thus, in light of the above, the MBG assembly was made as a cylindrical geometry encompassing six identical Venturi tubes in parallel, all having the same lengths and identical throat ratios of 0.5, and β and α angles of 22.5° and 25°, respectively.
3.2.2 Justifications for imaging, processing, and microbubble density studies
The application of high-speed imaging, image processing, and the application of distribution functions have been reported in numerous studies for bubble size estimation where Venturi-type microbubble generators are employed (Kulkarni, 2007; Schneider et al., 2012; Yin et al., 2015; Li et al., 2017; Juwana et al., 2018; Lee et al., 2019; Feng et al., 2020; Wang et al., 2020; Roshanti et al., 2023). Filho et al. (2012) used a digital camcorder-coupled stereo microscope to capture videos at 500 fps. The in-house image processing tool LACIT-UTFPR was used to automate bubble diameter measurements using MATLAB. Furthermore, a Gaussian distribution function was employed to validate the occurrence of stable bubbles in the µm dimensions. Yin et al. (2015) used a Phantom v1210 high-speed camera to capture flow pictures at an image rate of 1,428 fps, with images processed manually using the maximal greyscale gradient method. Kulkarni (2007) used bubble size distribution with a Gaussian function to variate the change in most probable size and rise in velocity in terms of distance from the gas sparger in a bubble column. Li et al. (2017) also used a Phantom v1210 high-speed camera to capture images which were processed using the maximal greyscale gradient method. The bubble size distribution was computed using the log-normal distribution function. Juwana et al. (2018), on the other hand, used a Phantom Miro M310 high-speed video camera operating at 4,000 fps to track bubble movement and MATLAB R2015a to produce quantitative data. They used the generalised beta distribution function to compute and describe the bubble size distribution.
In this study, we used the combination of high-speed imaging followed by image processing and quantification using MATLAB. Supplementary Figure S5B shows one such image captured at height (H) 0.3 m at QL = 10 Lmin−1 and QG = 0.1 Lmin−1. The black line in the middle of the frame signifies a 0.5 cm mark used for calibration during quantification. The bubble size quantification data were obtained using MATLAB based Bubble Analyser. Histograms drawn from cleaned .csv files were classified based on the bubble size ranges (Supplementary Figure S5A). The number of bubbles <1,000 µm were counted (marked in red), and total bubbles in the micron range were expressed as a percentage value of the total bubbles counted in the respective frame.
The density of the occurrence of microbubbles as a percentage of total bubble count at each QL, QG, and H is shown in Table 3.
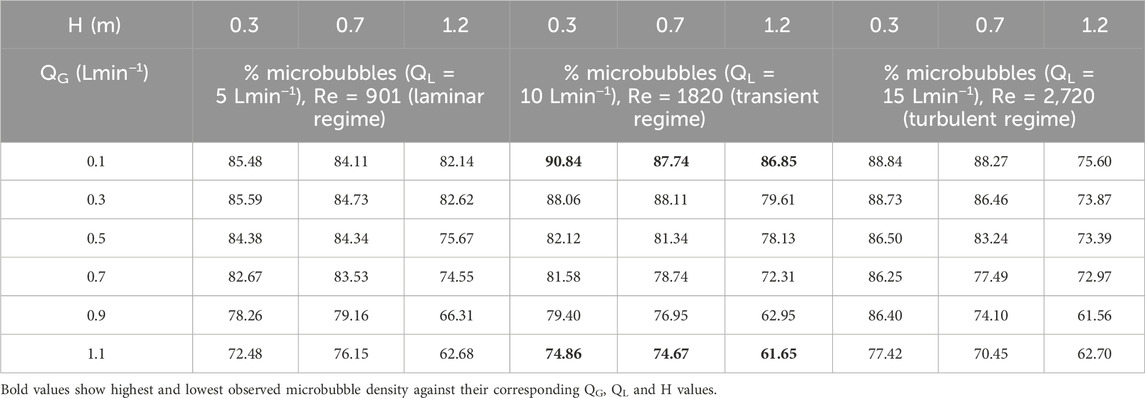
Table 3. Density of microbubble occurrence at various liquid flow rates (QL), gas flow rates (QG), and column heights (H).
Our extensive studies aimed to analyse the phenomenon of bubble coalescence (due to buoyancy effects and surface tension forces) as they move up the column, with the density of microbubbles tending to decrease for a higher column and compromise the overall mass transfer efficiency. Our studies show that even at a height of 1.2 m, the lowest value of microbubble density—the percentage of bubbles in the micron range—are above 60% for all scenarios of the three variables. In fact, microbubble density reached 90.84% at QL = 10 Lmin−1 and QG = 0.1 Lmin−1 at 0.3 m in height and only decreased to 86.85% as they reached 1.2 m up the column—a 0.9 m rise. Similar observations at QL of 5 Lmin−1 and 15 Lmin−1 and with corresponding QGs were observed as the bubbles rose to the top of the column. We explain such high microbubble density and system efficiency as follows.
i. The precise design of the MBG assembly, particularly the micro channels and geometric dimensions of each of the six Venturi tubes, contributes to the perfect formation of bubbles in the micron range, with minimal to no coalescence occurring prior to ejection in the column base. The smallest recorded bubble size was 93 µm.
ii. The hydrodynamic flow regimes at 5, 10, and 15 Lmin−1, although labelled “laminar”, “transient”, and “turbulent” conditions, are fairly gentle and unobstructive at the paths taken by bubbles while rising. A steadily rising velocity (both speed and direction of then three-dimensional motion of suspended microbubble) leads to the retention of the original shape and size during the rise from 0.3 m to 1.2 m. Thus, the minimal physical interaction of bubbles inside the column helps maintain the microbubble density throughout the system. Nevertheless, it was observed that at the respective H values, the decrease for a fixed QG in microbubble density is more as QL increases. This might be due to the occurrence of shear forces on the bubble walls, with rising liquid flow velocity and liquid molecules hindering the smooth rise of the bubbles.
iii. It is evident that lower QG values exhibit higher densities of microbubbles. This can be explained by the fact that while the cavitation inside the MBG assembly is homogeneous, lower volumes of gas injection prevent the overcrowding of bubbles within a fixed volume of liquid. Conversely, at a particular H and QL, the microbubble density for every scenario tends to decrease as QG increases.
iv. Lastly, considering the relative superficial rise in the velocity of the gas bubble, since the liquid is moving co-currently upwards, the effective superficial rising velocity Vs may be expressed as
where, VS, VG, and VL are relative superficial gas velocity, superficial gas velocity, and superficial liquid velocity, respectively. Equation 3.1 shows that under co-current flow, the relative superficial gas velocity is reduced. When the relative superficial gas velocity is low, the likelihood of high-energy bubble–bubble collisions decreases, reducing coalescence because bubbles do not interact with enough force to merge. Low relative velocities promote a more uniform bubble distribution, as bubbles tend to rise more synchronously with the liquid. This stability minimizes clustering and the chance of coalescence. Lower relative velocities minimize shear forces in the liquid, which otherwise lead to uneven bubble distribution and more frequent collisions.
On the other hand, Wang et al. (2020) compared the performance of a conventional and a swirl Venturi bubble generator (both 3D-printed) and reported microbubble densities of 59.2% and 70%, respectively, when QL values were 5–25 Lmin−1 and QG values were 0.06–0.6 Lmin−1. We thus conclude that the best QL and QG values for a sustained homogeneous high microbubble density would be approximately 10 Lmin−1 and 0.1–0.7 Lmin−1, respectively, so that at no point would the density go below 70%. It may be noted here that both these are in close agreement with values reported by Dey et al. (2020).
3.2.3 Bubble size distribution
The bubble size distribution for all QL, QG, and H values was further computed by applying Gaussian distribution. The value at the peak of the bell curve represented the most probable bubble diameter Dm and was used to predict the change in bubble size at various heights and QG values, keeping QL fixed.
At QL = 5 Lmin−1, the hydrodynamic flow regime is defined as perfectly laminar. Figure 9A shows that the Dm value increases from 614 μm to 802 μm at a height of 0.3 m when the QG increases from 0.1 to 1.1 Lmin−1. The trend is similar at 0.7 m, but bubble size drastically increases over 800 µm beyond QG 0.7 Lmin−1, suggesting massive coalescence and bubble–bubble interactions. Figure 9B shows that the increase in bubble size of QG 0.1–0.7 Lmin−1 is nearly linear as the size increases from ∼600 to ∼800 µm. For higher QG, this trend is not observed.
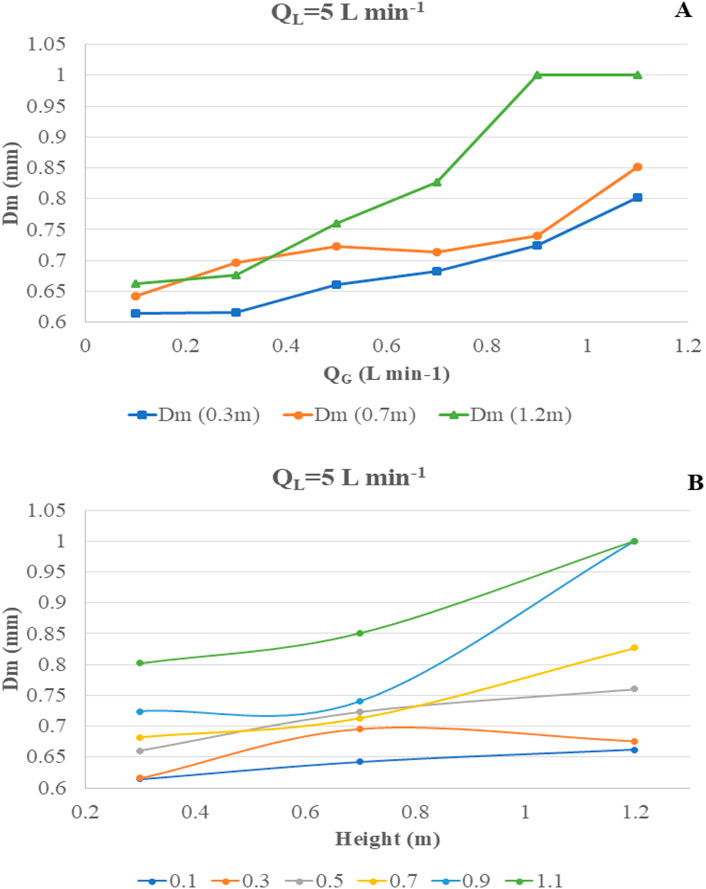
Figure 9. Change in most probable diameter “Dm” at varying QG and H at fixed QL = 5 Lmin−1. (A) Change in Dm vs. QG. (B) Change in Dm vs. H.
At QL = 10 Lmin−1, the hydrodynamic flow regime is defined as boundary or transient flow. Figure 10A shows that the Dm value increases from 482 μm to 779 μm at a height of 0.3 m when QG increases from 0.1 to 1.1 Lmin−1. The trend is similar at 0.7 m, but bubble size drastically increases over 900 µm beyond QG 0.7 Lmin−1, suggesting massive coalescence and bubble–bubble interactions. Figure 10B shows that the increase in bubble size of QG 0.1–0.7 Lmin−1 is nearly linear as the size increases from ∼400 to ∼700 µm. For higher QG, this trend is not observed.
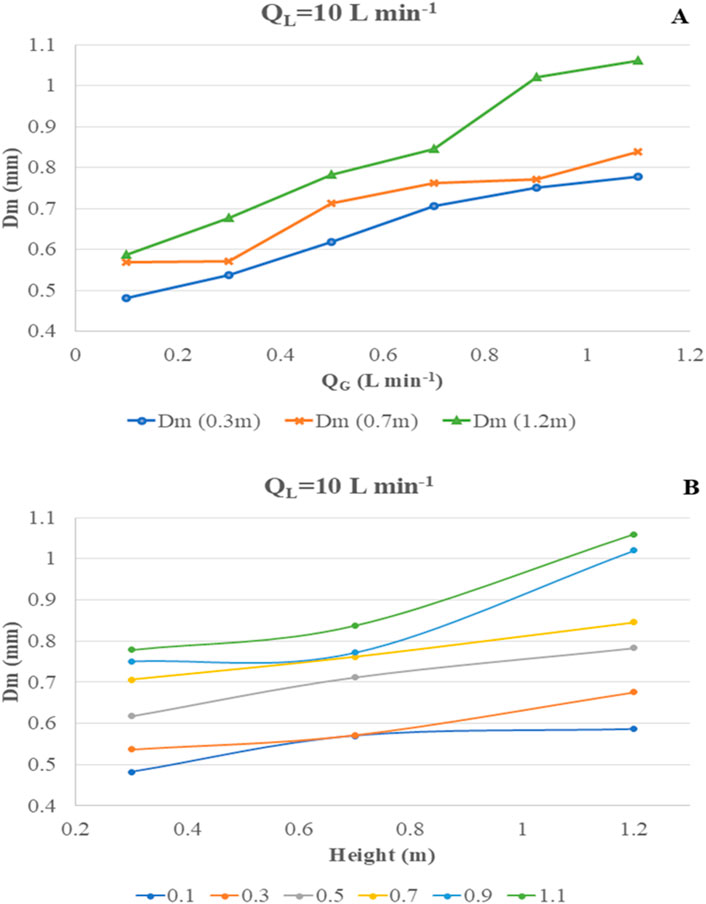
Figure 10. Change in most probable diameter “Dm” at varying QG and H at fixed QL = 10 Lmin−1. (A) Change in Dm vs. QG. (B) Change in Dm vs. H.
At QL = 15 Lmin−1, the hydrodynamic flow regime is defined as turbulent flow. Figure 11A shows that the Dm value fluctuates between 571 μm and 882 μm at a height of 0.3 m when QG increases from 0.1 to 1.1 Lmin−1. The trend is somewhat stable at 0.7 m, but bubble size drastically and unpredictably changes over 800 µm for all QG values, suggesting massive coalescence and bubble–bubble interactions. Additionally, the turbulent flow might be responsible for not only coalescence but also bubble breakage, leading to unpredicted high and low Dm values at 1.2 m. Thus, there is no clear trend or fitting of data when the reactor is operated under a turbulent flow regime. Figure 11B shows that the increase in bubble size at any QG does not show any linear fitting, and the entire scenario is only governed by the chaotic turbulent liquid flow conditions.
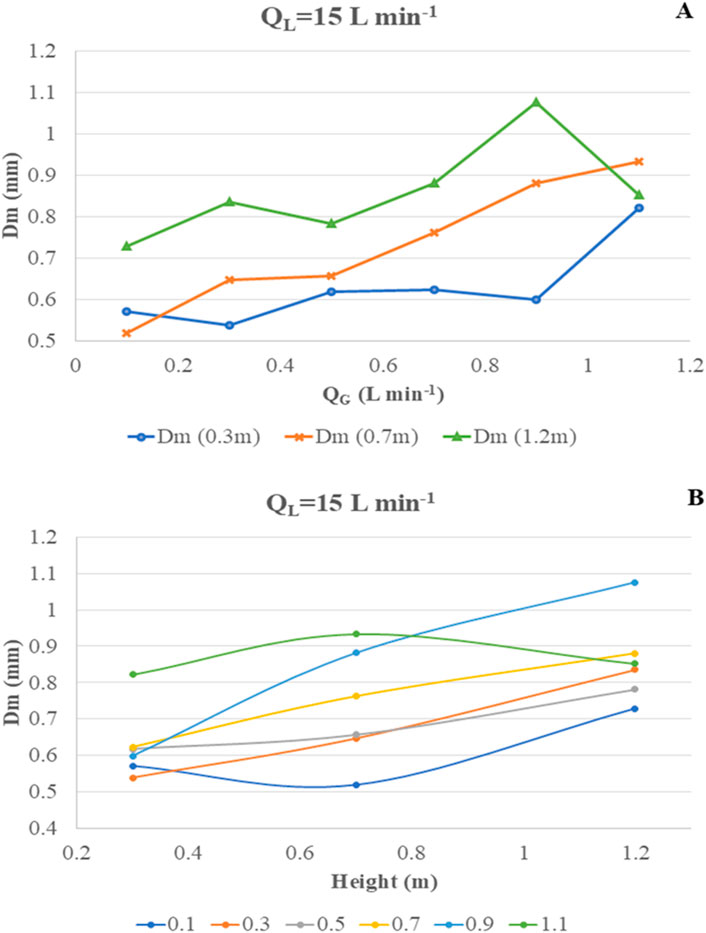
Figure 11. Change in most probable diameter “Dm” at varying QG and H at fixed QL = 15 Lmin−1. (A) Change in Dm vs. QG. (B) Change in Dm vs. H.
From our previous research in Dey et al. (2020), the modelled and predicted Dm for laminar flow conditions (QL = 8.5 Lmin−1) up to a QG of 0.7 Lmin−1 was ∼588 µm. The observed values of Dm in the transient flow condition (QL = 10 Lmin−1) are in close agreement in the range 482 μm–706 µm.
On the other hand, the literature for different algal reactors which require gas–liquid interactions have reported bubble sizes significantly larger than those we found. Uyar et al. (2024) compared the performance of an airlift reactor (ALR), a bubble column reactor (BCR), and a stirred tank reactor (STR). The average bubble size in the ALR was reported to be in the range of 3.6–4.8 mm, while that in the STR at 100 and 200 RPM agitation was in the ranges 3.2–4.3 mm and 3.6–5.6 mm, respectively. The bubble column was reported with the smallest bubble size in the range 1.5–1.7 mm at operating QG of 0.9–1.5 Lmin−1. Rahman et al. (2021) used a novel rectangular bubble column photobioreactor PBR coupled with horizontal baffles, which exhibited a wide range of bubble sizes. While bubbles in the range 200–300 µm occupied a bubble density of 10%–25%, the majority of the reactor volume was dominated by bubbles of 700–1,300 µm. Rahman et al. (2021) reported the mean bubble size at QG 1, 1.5, 2, and 2.5 Lmin−1 to be 750 μm, 878 μm, 974 μm, and 1,095 µm, respectively. A detailed review of the feasibility of bubble column scale-up by Shaikh and Al-Dahhan (2013) discussed bubble size variations during scale-up from 10 L to 200 L, reporting a range of 1–6 mm bubble diameters.
Our studies confirm the trends in bubble size variation and distribution as a function of the QL and QG values, as predicted earlier. At the same time, the change in rising bubble size and the density of microbubble occurrence as a function of column height confirm that the recirculation-MBG system favours the maximum occurrence of microbubbles and minimal bubble coalescence, thus maintaining the optimised possibility of gas–liquid interaction and high-rate CO2 mass transfer. The most ideal scenario from our data suggests a QL of 10 Lmin−1 with corresponding QG of 0.1–0.7 Lmin−1, where the idea bubble size remains 400–700 µm.
3.3 Reactor hybridization and microalgal growth performance
3.3.1 Reactor hybridization and pH-based automation
Novel algal cultivation systems have been a growing area of interest owing to the identified shortcomings of conventional and traditional cultivation systems. One such popular domain involves the hybridization of two or more systems to obtain better results. “Hybrid system” refers to a bioreactor that integrates multiple cultivation methods or technologies to optimize microalgal growth and productivity. These systems combine the advantages of different reactor types to enhance efficiency, scalability, and sustainability.
Structural hybridizations mostly include physical integration and the simultaneous/sequential operation of two algal systems for overall better yield and productivity. Deprá et al. (2019) targeted better hydrodynamic performance and CO2 bioconversion kinetics for Scenedesmus obliquus to achieve high specific growth rates and cell biomass. They integrated a bubble column with an illumination platform consisting of tubular structures arranged in a flat plate array. García-Galán et al. (2018) developed and reported a hybrid tubular horizontal photobioreactor consisting of a high-rate algal pond (HRAP) and closed tubular PBR configuration at a pilot scale of 8.5 m3 working volume using mixed indigenous wastewater algal consortia to process agricultural runoffs for overall reduction in pollutant load.
On the other hand, functional hybridizations tend to be more complicated in design, operation, and overall system output. They are made to address highly specific problems such as selective nutrient recovery from wastewater, targeting the productivity of specific intracellular molecules, or combining two or more entirely different technologies. For example, Granata et al. (2015) hybridised algal technology with photovoltaics by layering transparent facades that acted as algal bioreactors on the surface of PV modules for the effective utilization of solar irradiance to simultaneously produce biomass and electrical energy. Khalekuzzaman et al. (2019), on the other hand, hybridised two separate microbial technologies with the aim of increasing algal lipid synthesis. A hybrid anaerobic baffled reactor (ABR, 36 L) was hybridised with a PBR to pre-treat high strength raw effluent and reduce organic load for feedstock in the PBR. The mixed microalgal consortia of Chlorella vulgaris, C. sorokiniana, and Scenedesmus simris reported high lipid content up to 44.1%, with a dominant fatty acid methyl ester (FAME) composition (C16–C18) of 87.9% in produced biofuels.
Generally, open systems such as raceway ponds and open shallow ponds that offer low cost, high operation volume are hybridised with closed systems such as bubble columns or tubular reactors that offer high control, high biomass yield scenarios (Saad et al., 2019; Paul et al., 2021). Additionally, specific processes such as CO2 sequestration or nutrient recovery from wastewater often involve structural as well as functional hybridization, particularly with bubble column designs (Estrada-Graf et al., 2020; Putt et al., 2011) and algal biofilm systems, respectively (Wood et al., 2022).
The RMPBR reported in Dey et al. (2020) showcased several beneficial factors. First, the mixing and homogenization was independent of the need for continuous air bubbling-based agitation. Nevertheless, it was possible to sparge CO2 in a controlled manner with pH regulation and as microbubbles with 98% mass transfer efficiency. At a 10 L operational volume and a column height of 0.5 m, the algal biomass yield and lipid content were relatively high. Overall, the technology seems promising at CO2 assisted algal cultivation.
However, we also identified several shortcomings to the standalone RMPBR design in terms of scale-up. First, the recirculation itself required a 40 W pump that operated continuously. At the same time, a 20 L carbonation column (as hybridised in the present study) would have needed a 0.5 HP monoblock pump operating continuously for the 14-day batch. This not only would incur the risk of pump failure and the system crashing but also a very high energy footprint (approx. 125 units of electricity). In terms of scale-up, the minimum column height required for a 20 L unit is 1.5 m (to maintain the high CO2 mass transfer from a 5% v/v CO2 flue stream); hence, scale-up beyond this with a bubble column reactor geometry would incur engineering constraints for mounting and risk mechanical and structural failure. If the carbonation column is made with a wider diameter, the operational volume may increase, but structural failure at the base on the 3D-printed MBG (maximum calculated static load capacity of 1.8 psi or 0.12 bar) would occur owing to the increased weight of the culture-filled column. Additionally, the overall microbubble generation and high mass transfer may be compromised with a wider and taller column (due to factors such as localised turbulent zones and flow irregularity at central axis versus near the walls).
The 200 L raceways at the Applied Microbiology Laboratory, previously tested extensively (Kumar et al., 2017), operate with a 1 HP motor driving the baffles to ensure effective culture mixing in both units. Thus, the cumulative energy footprint to run two 200 L raceways for a 14-day batch would be approx. 250 units of electricity. Note that the mechanical agitation vide operation also mixes the culture by recirculation across the raceway channel. Additionally, carbonation systems by gas diffusers in raceways have been reported with very poor efficiency in terms of mass transfer. This has led to different efforts, such as the structural modification of raceways (Craggs et al., 2012), structural integration with carbonation column (Estrada-Graf et al., 2020; Putt et al., 2011), or using different modes of bubble formation for CO2 introduction (Du et al., 2012). Thus, the primary setback of a raceway in the present context is low CO2 mass transfer kinetics (including surface losses), while the benefits include easy and economic operational scale-up. This would also mean a larger yield of PHB from the larger volume biomass that can be further used to synthesise biomaterials.
Thus, structurally it was favourable to integrate a 20 L carbonation column that operates on the principle of the RMPBR (hydrodynamic recirculation-based mixing) to a 200 L raceway (mechanical agitation-based mixing) and create a culture recirculation loop between the two that is controlled using a system of valves and rotameters. Additionally, the outlet of the carbonation column is placed near the baffles such that CO2 rich culture is introduced at the mixing point of the raceway. The inlet for the column is placed at the other end from the baffles, taking into consideration the maximum path available for the CO2 rich culture to homogenise and stabilise the pH in the raceway before being reintroduced into the column.
Functionally, we preserve the microbubble-based carbonation mechanism of RMPBR using the MBG assembly and the controlled QL and QG parameters, but instead of continuous operation of the column, we introduce an on–off control on carbonation cycles using a pH-feedback controller. Thus, the carbonation column utilises the beneficial factors of the RMPBR in terms of co-current liquid flow and microbubble-based CO2 dissolution at laminar flow conditions while the bulk of culture is maintained for growth in the raceway.
As a design synonymity with RMPBR, the 2 L retention tank was replaced with a 200-L raceway (Figure 4) while the carbonation column was scaled from 0.5 m to 1.5 m, thus increasing the operational scale from 10 L to 200 L while preserving the fundamentals of operation and algae cultivation.
Furthermore, the DIC speciation as CO2 (aq) or HCO3− or CO3−2 is dependent on the instantaneous pH of the liquid (Bialkowski, 2004). Supplementary Figure S6 shows the Bjerrum plot and CO2 speciation in water as a function of pH. It is evident that peak concentration of HCO3− occurs near pH 8–8.5 and lasts till pH 10. Thus, for our operational benefit, pH 8.5 was chosen as the upper limit. Whenever the probe recorded pH >8.5 in the raceway, the controller would simultaneously switch on the recirculation pump and solenoid valve to release culture and CO2 into the carbonation column. When the 20 L CO2-rich culture reached back into the raceway, it mixed with the bulk of the 180 L of culture in the raceway, dropping the pH by a small margin. This created a dynamic loop of continuous carbonation and recirculation until the pH of the raceway culture reached 7.2—the near neutral point when the feedback stopped and the controller switched off both pump and solenoid valve, stopping the carbonation cycle. The cycle kept repeating as and when the upper and lower boundary criteria were met (Supplementary Section 1.4). As discussed previously, pH-controlled carbonation has been reported as a beneficial process that maximizes CO2 sequestration and bio-fixation in algal cultures (De Godos et al., 2014; Qiu et al., 2017; Peng et al., 2020).
The present hybrid system is both a structural and a functional hybridization aimed at maximum CO2 mass transfer as well as bio-fixation and bioconversion to value-added molecules such as lipids and PHB. Table 4 summarises the contributive pro-factors of each component in the hybridization.
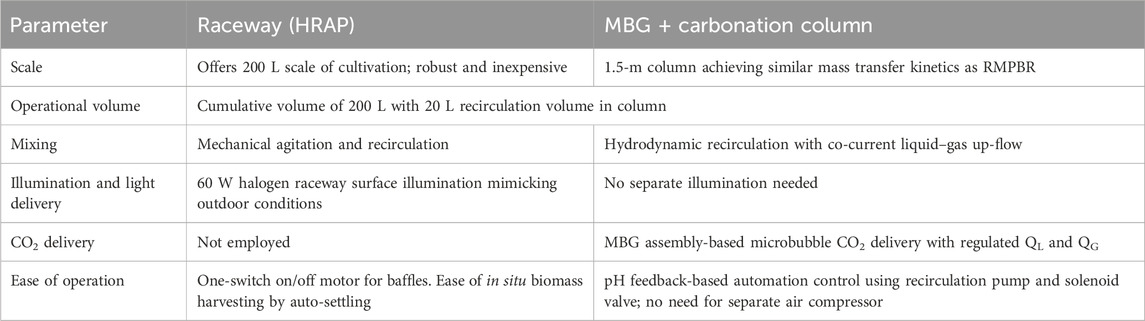
Table 4. Contributing factors of raceway and MBG-CC towards favourable circumstances supporting hybridization.
3.3.2 Biomass growth, yield, productivity, and CO2 bio-fixation
The biomass growth in hybrid and control reactors was quantified by OD680 and DCW. Absorbance was measured daily while DCW was recorded on alternate days. Figure 12 shows the change in OD680 versus time of cultivation. Unlike our studies with RMPBR (Dey et al., 2020), the cell doubling rate was faster and the ultimate absorbance value relative to the day of cultivation was higher with the hybrid system—that is, on day 10, the hybrid system recorded an OD680 of ∼0.7 while the RMPBR OD680 for day 10 was 0.55. At the same time, OD680 on day 10 for the 200 L control showed a much lower value at ∼0.4. This suggests that, like the RMPBR, the hybrid also had accelerated algal growth triggered by the controlled CO2 sparging. It should be noted that the recirculation rate QL and gas inlet rate QG for algal cultivation were maintained at 10 and 0.1 Lmin−1, respectively—similar to 8.5 and 0.1 Lmin−1 in RMPBR. Since the growth in the hybrid system did not seem to be much compromised compared to RMPBR, it can be assumed that the CO2 mass transfer phenomena occurring at these fixed QL and QG values were due to similar bubble size profiling and liquid–gas interactions. Periodic microscopic analysis did not show contamination; thus, it can be assumed that the biomass had become robust in presence of a high DIC, preventing bacterial contamination even at pilot scale and open conditions.
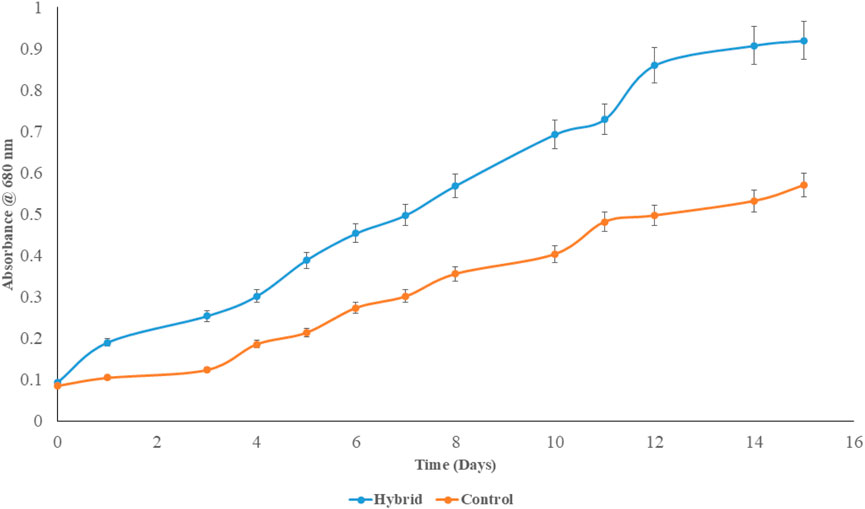
Figure 12. Growth of Poterioochromonas malhamensis in hybrid and control reactors at 200 L scale.
The main concern during scale-up studies is ensuring that critical parameters of yield and CO2 mass transfer are not compromised and that comparable results can be achieved at scale-up. In this context, the scale-up and hybridization performed far better than control (a conventional raceway reactor cultivation setup). Table 5 summarises the biochemical composition in the hybrid and control reactors as well as comparing them with the RMPBR.
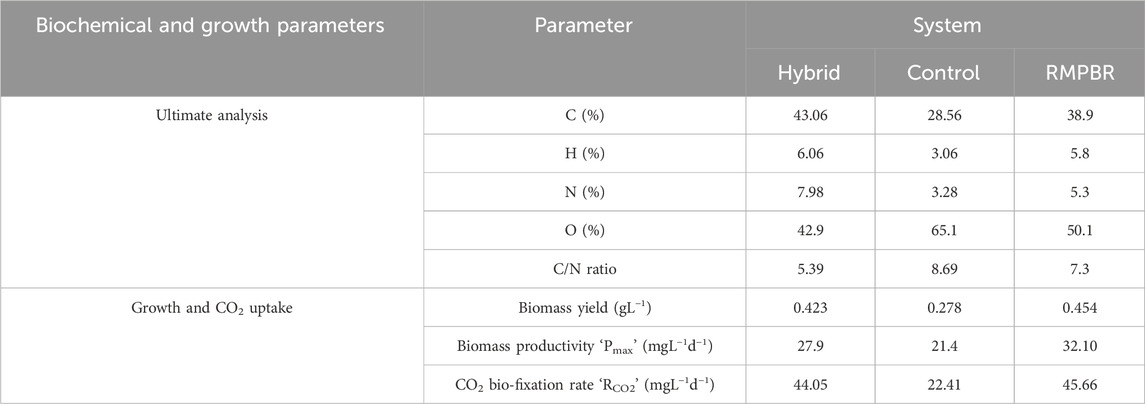
Table 5. Biochemical composition, growth, and CO2 bio-fixation in hybrid photobioreactor at 5% v/v CO2 concentration and gas flow rate QG = 0.1 L min−1 after day 14 (in comparison to RMPBR (Dey et al., 2020)).
In terms of elemental analysis, the carbon (C) content from the hybrid reactor biomass was 43.06%, more than the 38.9% reported in RMPBR and 28.56% observed in the control. Similarly, hydrogen (H) and nitrogen (N) percentages were also higher. Conversely, the oxygen (O) content in the hybrid reactor was lowest of the three at 42.9%. This is, in fact, a favourable scenario, as the literature suggests that biomass with a lower oxygen percentage typically has a higher carbon-to-oxygen ratio, resulting in greater energy density and improved calorific value. This is desirable for applications like biodiesel and bioethanol production (Alper et al., 2020). At the same time, studies have demonstrated that lower oxygen content in algal biomass often correlates with a higher lipid content. This is because lipids, particularly triacylglycerols, have a higher carbon-to-oxygen ratio than carbohydrates and proteins. Therefore, an increase in lipid accumulation within the algal cells leads to a decrease in the overall oxygen percentage of the biomass (Halder and Azad, 2019). In terms of biomass being processed as feedstock for biofuels, lower oxygen in biofuel precursors reduces the formation of oxygenates (which can cause corrosion and instability) during biofuel refining.
For the hybrid reactor, the biomass composition meets these standards, P. malhamensis had already exhibited high lipid yield at 10 L RMPBR, and the C and O content were proportionately higher and lower, respectively, than that of RMPBR. It can be inferred that the lipid content can also be higher or relatively comparable both qualitatively and quantitatively.
In terms of biomass yield and productivity, the hybrid and RMPBR have respective comparable values at 0.423 gL−1 and 0.454 gL−1 and 27.90 mgL−1d−1 and 32.10 mgL−1d−1. On the other hand, the control reactor had much lower values of biomass yield and productivity, suggesting a significant boost in culture growth and quality after reactor hybridisation.
Lastly, in terms of CO2 bio-fixation rate, both hybrid and RMPBR have near identical rates at 44.05 mgL−1d−1 and 45.66 mgL−1d−1, respectively, while the control had a much lower rate at 22.41 mgL−1d−1.
Thus, scale-up and hybridization effectively improved performance over conventional cultivation system without compromising key parameters such as biomass yield, productivity, or CO2 bio-fixation rates. Elemental composition further indicates that the hybrid reactor produced biomass of superior quality and suitability for biofuel applications.
3.4 Qualitative analysis of accumulated PHA
The extraction of polyhydroxyalkanoates (PHAs) from microbial biomass requires effective cell disruption methods that preserve polymer integrity. Sodium hypochlorite (NaOCl) is commonly used for cell disruption; however, its oxidative nature can degrade PHAs and pose environmental hazards due to chlorine compounds. Conversely, alternative methods such as alkaline treatment (Rodrigues et al., 2022), mechanical cell disruption (Bhat et al., 2024), non-ionic surfactants (Colombo et al., 2020), and solvent-based depigmentation (Mongili et al., 2021) offer a gentler alternative that potentially enhances PHA quality. In conjunction with PHA extracted using conventional bleaching, methanol depigmented biomass was also used for hot chloroform extraction to determine discrepancies with respect to degraded functional groups in the extracted PHA.
In order to qualitatively assess the PHA produced, FTIR-ATR was performed. The peaks from the plot were compared with several existing studies assessing cyanobacterial, bacterial, and algal PHAs (Shamala et al., 2009; Shah, 2012; Volova et al., 2013; Anjali et al., 2014; Meixner et al., 2018).
The FTIR spectrum of extracted PHA sample exhibited notable peaks at (Supplementary Figure S7):
• 2,975–2,932 cm−1: attributed to C–H stretching vibrations in methyl groups.
• 1721 cm−1: corresponding to C=O stretching in carboxylic acid groups.
• 1,453 cm−1: linked to C–H bending in methyl groups.
• 1,279–1,229 cm−1 and 1,261–1,180 cm−1: associated with C–O stretching in ester groups.
These absorption bands align with those reported in the literature for PHA materials.
• C–H stretching (methyl groups): peaks at approximately 2,950 cm−1 and 2,920 cm−1 have been observed, indicating asymmetric stretching of methyl and methylene groups.
• C=O stretching (carbonyl groups): a strong absorption band approximately 1723 cm−1 is characteristic of carbonyl (C=O) stretching vibration in PHAs.
• C–H bending (methyl groups): absorption bands near 1,453 cm−1 are indicative of C–H bending vibrations in methyl groups, commonly observed in PHA spectra.
• C–O stretching (ester groups): bands in the regions of 1,279–1,229 cm−1 and 1,261–1,180 cm−1 correspond to C–O stretching vibrations in ester groups, which are integral components of the PHA polymer backbone.
These spectral features corroborate the presence of PHA in the sample. Additionally, characteristic bands at 1,282 cm-1, 1723 cm−1, and 2,934 cm−1 highlight the presence of short-chain-length PHAs.
The FTIR-ATR analysis confirmed the presence of short-chain-length PHAs in P. malhamensis, validating its intrinsic ability to biosynthesize storage polymers under photoautotrophic conditions. The consistency of spectral features with known microbial PHAs further supports the integrity of the extracted polymer using non-oxidative methods. From our perspective, these findings highlight that even unmodified, indigenous microalgal strains, when cultivated under optimized conditions, can effectively channel CO2 into PHAs or other high-value biomolecules. This underscores the largely untapped potential of native wild strains for future CO2 valorisation and bioproduct development.
3.5 Comparative yield of PHB between hybrid and control reactors
The polyhydroxybutyrate (PHB) yield in P. malhamensis was analysed for the hybrid and control systems. Figure 13 shows the comparative PHB yields on a DCW basis at pilot scales of cultivation for hybrid and control, respectively.
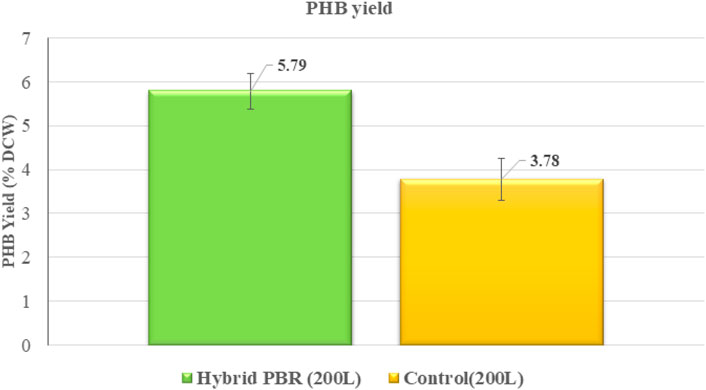
Figure 13. Comparative assessment of PHB yield between Hybrid and Control reactors.
Notably, the PHB yield results exhibited a distinct and remarkable trend, highlighting the unique metabolic response of the system under the applied conditions. First, the control at the pilot 200 L raceway showed a PHB yield of 3.78% w/w on a dry cell weight basis. Although the control acted as a batch reactor, it can be assumed that this value corresponds to the baseline production capacity of P. malhamensis in the absence of CO2 sparging and minimal nutrient media (autotrophic). The true advantage of the hybrid reactor is the controlled introduction of CO2 and optimised hydrodynamic mixing and agitation. Under such conditions, the biomass from the hybrid system had a PHB yield of 5.79% DCW basis. While these values are not high among PHB reported strains, the increase in PHB yield with controlled carbonation at 200 L scale-up indicates the possibility that the advanced microbubble generator, the pH regulated DIC saturation in culture, and the hydrodynamic conditions at laminar flow regime all contributed to this yield boost.
We acknowledge that P. malhamensis is not an ideal microalgal strain for large-scale industrial level PHB production using CO2 as the sole carbon source. Improvement strategies such as genetic engineering and nutrient limitations can be tested in the future to evaluate the maximum potential of the strain. An engineered strain of cyanobacterium Synechococcus elongatus UTEX 2973 by Roh et al. (2021) grown in BG-11 media reported PHB yields of 21.1% DCW basis and 16.7% DCW basis under indoor and outdoor conditions, respectively, with 5% v/v CO2 supplementation. The same engineered strain reported a PHB yield of 10.5% DCW basis in controlled conditions with real flue gas from a CHP plant, having a CO2 concentration of 3%–6% v/v. Bhati et al. (2010) worked with 25 cyanobacterial species across 19 genera. Under complete photoautotrophic conditions in BG-11 media, Nostoc muscorum was reported to have the highest PHB yield of 8.5% DCW basis on the day 21 of batch cultivation. Carpine et al. (2017) reported a PHB yield of 12.4% DCW in an engineered strain of Synechocystis sp. when cultivated using 2% v/v CO2 concentration gas stream as the sole carbon source.
Conversely, although several eukaryotic microalgae belonging to the Chlorophyceae family have been identified as PHB producers, their complete photoautotrophic PHB production potential has been little studied. While Botryococcus braunii has been reported to produce 16.4% PHB content under photoautotrophic conditions (Kavitha et al., 2016), Chlorella fusca LEB 111 was reported as accumulating 17.4% DCW PHB only when supplemented with D-xylose (Cassuriaga et al., 2018). In terms of native strains reporting PHB accumulation, Mourão et al. (2020) reported Amazonian filamentous microalgae Stigeoclonium sp. B23 as producing PHB under mixotrophic acetate–bicarbonate supplementation in BG-11 media.
Thus, our studies allow us to report a new species P. malhamensis, a commonly occurring freshwater CO2 tolerant eukaryotic Chrysophyceae with PHB production potential under photoautotrophic conditions, as well as to develop a hybrid reactor system to enhance intracellular PHB yield using only 5% v/v CO2 concentration.
4 Conclusion
The current study presents a comprehensive investigation of a novel pilot-scale photobioreactor system designed to enhance CO2 sequestration and its bioconversion into high-value intracellular macromolecules, demonstrating for the first time the photoautotrophic potential of the previously unreported algal species P. malhamensis. A novel microbubble generator assembly using SLA 3D printing technology was fabricated. The accuracy of design and efficiency of the MBG assembly was explored by integrating it with a 20 L recirculating column and using high-speed imaging to determine microbubble size and distribution. A combination of three QL values corresponding to three hydrodynamic flow regimes, three H values corresponding to the bubble rising path, and six QG values representing low to high gas flow rates were chosen as the variable function parameters. It was found that a combination of QL = 10 Lmin−1 (transient flow regime) and QG = 0.1 Lmin−1 yielded a microbubble bubble density of 90.84% at 0.3 m high, which reduced to 86.85% at 1.2 m. The worst bubble density scenario was obtained at same QL and QG = 1.1 Lmin−1 where the density was 74.86% at 0.3 m and reduced to 61.65%. The most probable bubble size for QL = 10 Lmin−1 and QG 0.1 Lmin−1 and 1.1 Lmin−1 were at 482 and 706 μm, respectively. At no point did the bubble density fall below 60%, marking the first reported instance of such consistently high performance in Venturi-type microbubble generators operating at this scale.
Structural hybridization of the column with a HRAP for media recirculation with functional hybridization using pH-feedback automated carbonation and recirculation loop was introduced at a 200 L pilot scale. Poterioochromonas malhamensis cultivated in the hybrid system had a biomass yield of 0.423 gL−1 and CO2 bio-fixation rate of 44.05 mgL−1d−1. Higher carbon and lower oxygen content in biomass from the hybrid system indicated that the biomass has better quality and suitability for biofuel feedstock applications. FTIR analysis suggested the occurrence of functional groups (C-H and C=O) commonly associated with PHB-type molecules, while quantitative analysis using GC showed that the PHB yield was approximately 5.79% DCW basis while maintaining 5% v/v CO2 concentration under a transient flow regime. The present system demonstrates the phototrophic production of PHB in indigenous microalgal cells. Downstream processing of PHB for applications in the pharma and food sectors has high commercial value. The real-world use of these algal biopolymer macromolecules is greatly facilitated when developed by re-using sequestered carbon from waste flue sources.
An in-depth quantitative energy balance and adjunct cost–benefit analysis have been kept as the scope of another study to specifically discuss complete energy efficiency in terms of cultivation–extraction–purification for the sustainable route for the bio-valorisation of CO2 to PHB by phototrophic carbon fixation. Additionally, studies specifically aimed to determine extraction efficiency, recovery yield, and the purification of PHB have been kept beyond the scope of this study to be the primary concern of focus for future research to determine different modes and methods of extraction and estimating the techno-economic downstreaming as well as LCA studies of phototrophic PHB production using this novel hybrid cultivation system.
Data availability statement
The original contributions presented in the study are included in the article/Supplementary Material; further inquiries can be directed to the corresponding author.
Author contributions
SD: Conceptualization, Data curation, Formal Analysis, Investigation, Methodology, Resources, Software, Validation, Visualization, Writing – original draft, Writing – review and editing. AS: Data curation, Formal Analysis, Resources, Writing – review and editing. VD: Formal Analysis, Investigation, Methodology, Resources, Visualization, Writing – review and editing. BD: Resources, Software, Visualization, Writing – review and editing. AM: Funding acquisition, Project administration, Supervision, Writing – review and editing.
Funding
The authors declare that financial support was received for the research and/or publication of this article. The authors appreciatively acknowledge the financial support of the Department of Biotechnology, India (grant number BT/PR46019/BCE/8/1800/2023), for the reported work. The authors also thank UGC for a fellowship to Saptarshi (grant no. 3531/(NET-JULY2016)) and the Ministry of Education, Government of India, for awarding the Prime Minister’s Research Fellowship to AS (PMRF-ID 1403185). Additionally, the authors thank the Indian Institute of Technology (IIT) Delhi for endowing the Dr. Rita Duggal Chair grant (IITD/ADFA/2024/293,403) to AM.
Acknowledgements
The authors acknowledge the support for FTIR facilities provided by Central Research Facility (CRF), IIT Delhi. The authors appreciate the assistance provided by Mr Sabal (Project Staff, Applied Microbiology Lab, IIT Delhi).
Conflict of interest
The authors declare that the research was conducted in the absence of any commercial or financial relationships that could be construed as a potential conflict of interest.
Generative AI statement
The authors declare that no Generative AI was used in the creation of this manuscript.
Any alternative text (alt text) provided alongside figures in this article has been generated by Frontiers with the support of artificial intelligence and reasonable efforts have been made to ensure accuracy, including review by the authors wherever possible. If you identify any issues, please contact us.
Publisher’s note
All claims expressed in this article are solely those of the authors and do not necessarily represent those of their affiliated organizations, or those of the publisher, the editors and the reviewers. Any product that may be evaluated in this article, or claim that may be made by its manufacturer, is not guaranteed or endorsed by the publisher.
Supplementary material
The Supplementary Material for this article can be found online at: https://www.frontiersin.org/articles/10.3389/fceng.2025.1701857/full#supplementary-material
References
Alper, K., Tekin, K., Karagöz, S., and Ragauskas, A. J. (2020). Sustainable energy and fuels from biomass: a review focusing on hydrothermal biomass processing. Sustain. Energy Fuels 4 (9), 4390–4414. doi:10.1039/d0se00784f
Anjali, M., Kanakalakshmi, A., Sukuma, C., and Shanthi, K. (2014). Production of polyhydroxyalkanoates (PHA) by Bacillus subtilis ANM1 using bio effluents as substrates and characterization using FTIR analysis. Biotechnol. Indian J. 9 (4), 153–159. Available online at: https://d1wqtxts1xzle7.cloudfront.net/32803369/Biotech-Sastra_ppr-libre.pdf?1391158151=&response-content-disposition=inline%3B+filename%3DProduction_of_Polyhydroxyalkanoates_PHA.pdf&Expires=1764127837&Signature=ZpPuyDJeHtr42UQ∼gwCl3heSMd9YlqS9nOdJFYPFyfEUzbMp5O-7N7PHtSPgCbnZbEjZjzw0fuWlxtc5BuiZuod7my1Wo40DqR-EmyxkWKF∼Pzjlb0z-31iOa-p8VvQXrGSUoN9wYKTZegiCMPDzKhURdWqIL-lChr9GkL1hu5TSwPfDMEdZwZ5zA1rY∼AJ6XFjxGBuXStZGlk2Uyt3qzbGQW2WUlHnRC-jEU1AWq-4mMTOBBWPMkxwisl1oHtU0U-MncUmTC-wcSReSftvPG3qoRfRz8SHExO2li82qnxr7dwqUFX5ueLcZwqA14yzFAkkXCKgDm63dk1-uf∼ApQA__&Key-Pair-Id=APKAJLOHF5GGSLRBV4ZA
Bae, K., Kim, J. Y., Go, K. S., Nho, N. S., Kim, D., Bae, J. W., et al. (2022). Bubble/micro-bubble regime transition in a pressurized bubble column of a low surface tension liquid system. Chem. Eng. Sci. 249, 117191. doi:10.1016/j.ces.2021.117191
Bhat, G. S., Deekshitha, B. K., Thivaharan, V., and Divyashree, M. S. (2024). Physicochemical cell disruption of bacillus sp. for recovery of polyhydroxyalkanoates: future bioplastic for sustainability. 3 Biotech. 14 (2), 59. doi:10.1007/s13205-024-03913-y
Bhati, R., and Mallick, N. (2015). Poly(3-hydroxybutyrate-co-3-hydroxyvalerate) copolymer production by the diazotrophic cyanobacterium Nostoc muscorum Agardh: process optimization and polymer characterization. Algal Res. 7, 78–85. doi:10.1016/j.algal.2014.12.003
Bhati, R., Samantaray, S., Sharma, L., and Mallick, N. (2010). Poly-β-hydroxybutyrate accumulation in Cyanobacteria under photoautotrophy. Biotechnol. J. 5 (11), 1181–1185. doi:10.1002/biot.201000252
Bialkowski, S. (2004). CO2 and carbonate chemistry. Available online at: http://ion.chem.usu.edu/∼sbialkow/Classes/3600/Overheads/Carbonate/CO2.html (Accessed October 15, 2025).
Carpine, R., Du, W., Olivieri, G., Pollio, A., Hellingwerf, K. J., Marzocchella, A., et al. (2017). Genetic engineering of Synechocystis sp. PCC6803 for poly-β-hydroxybutyrate overproduction. Algal Res. 25, 117–127. doi:10.1016/j.algal.2017.05.013
Cassuriaga, A. P. A., Freitas, B. C. B., Morais, M. G., and Costa, J. A. V. (2018). Innovative polyhydroxybutyrate production by Chlorella fusca grown with pentoses. Bioresour. Technol. 265, 456–463. doi:10.1016/j.biortech.2018.06.026
Chawla, P. (2016). Photobioreactor design and development for simultaneous wastewater treatment and CO2 sequestration. doctoral dissertation. Delhi: Indian Institute of Technology Delhi, IIT Delhi. Available online at: https://go.exlibris.link/BXsDM8RC.
Chawla, P., Malik, A., Sreekrishnan, T. R., Dalvi, V., and Gola, D. (2020). Selection of optimum combination via comprehensive comparison of multiple algal cultures for treatment of diverse wastewaters. Environ. Technol. Innovation 18, 100758. doi:10.1016/j.eti.2020.100758
Cheng, J., Yang, Z., Ye, Q., Zhou, J., and Cen, K. (2016). Improving CO2 fixation with microalgae by bubble breakage in raceway ponds with up–down chute baffles. Bioresour. Technol. 201, 174–181. doi:10.1016/j.biortech.2015.11.044
Choudhary, P., Prajapati, S. K., and Malik, A. (2016). Screening native microalgal consortia for biomass production and nutrient removal from rural wastewaters for bioenergy applications. Ecol. Eng. 91, 221–230. doi:10.1016/j.ecoleng.2015.11.056
Colombo, B., Pereira, J., Martins, M., Torres-Acosta, M. A., Dias, A. C., Lemos, P. C., et al. (2020). Recovering PHA from mixed microbial biomass: using non-ionic surfactants as a pretreatment step. Sep. Purif. Technol. 253, 117521. doi:10.1016/j.seppur.2020.117521
Costa, S. S., Miranda, A. L., Andrade, B. B., de Jesus Assis, D., Souza, C. O., de Morais, M. G., et al. (2018a). Influence of nitrogen on growth, biomass composition, production, and properties of polyhydroxyalkanoates (PHAs) by microalgae. Int. J. Biol. Macromol. 116, 552–562. doi:10.1016/j.ijbiomac.2018.05.064
Costa, S. S., Miranda, A. L., de Jesus Assis, D., Souza, C. O., de Morais, M. G., Costa, J. A. V., et al. (2018b). Efficacy of Spirulina sp. polyhydroxyalkanoates extraction methods and influence on polymer properties and composition. Algal Res. 33, 231–238. doi:10.1016/j.algal.2018.05.016
Craggs, R., Sutherland, D., and Campbell, H. (2012). Hectare-scale demonstration of high rate algal ponds for enhanced wastewater treatment and biofuel production. J. Appl. Phycol. 24 (3), 329–337. doi:10.1007/s10811-012-9810-8
De Godos, I., Mendoza, J. L., Acién, F. G., Molina, E., Banks, C. J., Heaven, S., et al. (2014). Evaluation of carbon dioxide mass transfer in raceway reactors for microalgae culture using flue gases. Bioresour. Technol. 153, 307–314. doi:10.1016/j.biortech.2013.11.087
Deprá, M. C., Mérida, L. G., de Menezes, C. R., Zepka, L. Q., and Jacob-Lopes, E. (2019). A new hybrid photobioreactor design for microalgae culture. Chem. Eng. Res. Des. 144, 1–10. doi:10.1016/j.cherd.2019.01.023
Dey, S., Bhattacharya, A., Kumar, P., and Malik, A. (2020). High-rate CO2 sequestration using a novel venturi integrated photobioreactor and subsequent valorization to microalgal lipids. Green Chem. 22 (22), 7962–7973. doi:10.1039/D0GC02552F
Dey, S., Dalvi, V., and Malik, A. (2023). Microbubble generator assembly (Indian Design No. 375334-001). New Delhi, India: Indian Patent Office.
Ding, G. T., Yasin, N. H. M., Takriff, M. S., Kamarudin, K. F., Salihon, J., Yaakob, Z., et al. (2020). Phycoremediation of palm oil mill effluent (POME) and CO2 fixation by locally isolated microalgae: Chlorella sorokiniana UKM2, Coelastrella sp. UKM4 and Chlorella pyrenoidosa UKM7. J. Water Process Eng. 35, 101202. doi:10.1016/j.jwpe.2020.101202
Du, H., Lin, J., and Zuercher, C. (2012). Higher efficiency of CO2 injection into seawater by a venturi than a conventional diffuser system. Bioresour. Technol. 107, 131–134. doi:10.1016/j.biortech.2011.12.060
Estrada-Graf, A., Hernández, S., and Morales, M. (2020). Biomitigation of CO2 from flue gas by Scenedesmus obtusiusculus AT-UAM using a hybrid photobioreactor coupled to a biomass recovery stage by electro-coagulation-flotation. Environ. Sci. Pollut. Res. 27 (23), 28561–28574. doi:10.1007/s11356-020-08240-2
Feng, Y., Mu, H., Liu, X., Huang, Z., Zhang, H., Wang, J., et al. (2020). Leveraging 3D printing for the design of high-performance venturi microbubble generators. Industrial Eng. Chem. Res. 59 (17), 8447–8455. doi:10.1021/acs.iecr.0c01509?ref=pdf
Filho, W. D. A., Schneider, F. K., and Morales, R. E. (2012). Evaluation of stability and size distribution of sunflower oil-coated micro bubbles for localized drug delivery. Biomed. Eng. 11 (1), 71. doi:10.1186/1475-925X-11-71
García, G., Sosa-Hernández, J. E., Rodas-Zuluaga, L. I., Castillo-Zacarías, C., Iqbal, H., and Parra-Saldívar, R. (2020). Accumulation of PHA in the microalgae Scenedesmus sp. under nutrient-deficient conditions. Polymers 13 (1), 131. doi:10.1016/j.biosystemseng.2017.11.016
García-Galán, M. J., Gutiérrez, R., Uggetti, E., Matamoros, V., García, J., and Ferrer, I. (2018). Use of full-scale hybrid horizontal tubular photobioreactors to process agricultural runoff. Biosyst. Eng. 166, 138–149.
Ge, M., Friedrich, J., and Vigna, L. (2024). Where do emissions come from? 4 charts explain greenhouse gas emissions by sector. World Resources Institute. Available online at: https://www.wri.org/insights/4-charts-explain-greenhouse-gas-emissions-countries-and-sectors (Accessed January 20, 2025).
Granata, T., Krehel, M., Wittkopf, S., and Egli, M. (2015). “A hybrid façade that combines an algal bioreactor with photovoltaics,” in Proceedings of the international conference CISBAT (Lausanne, Switzerland: EPFL), 567–572. Available online at: https://infoscience.epfl.ch/server/api/core/bitstreams/7c613727-363e-475c-9314-d9831d104746/content.
Hagagy, N., Saddiq, A. A., Tag, H. M., Selim, S., AbdElgawad, H., and Martínez-Espinosa, R. M. (2022). Characterization of polyhydroxybutyrate, PHB, synthesized by newly isolated haloarchaea Halolamina spp. Molecules 27 (21), 7366. doi:10.3390/molecules27217366
Halder, P., and Azad, A. K. (2019). Recent trends and challenges of algal biofuel conversion technologies. Adv. Biofuels, 167–179. doi:10.1016/B978-0-08-102791-2.00007-6
Huang, J., Sun, L., Liu, H., Mo, Z., Tang, J., Xie, G., et al. (2020). A review on bubble generation and transportation in venturi-type bubble generators. Exp. Comput. Multiph. Flow 2 (3), 123–134. doi:10.1007/s42757-019-0049-3
Juwana, W. E., idyatama, A., Majid, A. I., Wiratni, I., and Deendarlianto, (2018). “The application of digital image analysis to study the characteristic of bubble size distribution produced by orifice type microbubble generator,” AIP Conference Proceedings, 2001, 050004, Yogyakarta, Indonesia: AIP Publishing LLC. doi:10.1063/1.5049995
Kavitha, G., Kurinjimalar, C., Sivakumar, K., Palani, P., and Rengasamy, R. (2016). Biosynthesis, purification and characterization of polyhydroxybutyrate from Botryococcus braunii kütz. Int. J. Biol. Macromol. 89, 700–706. doi:10.1016/j.ijbiomac.2016.04.086
Khalekuzzaman, M., Alamgir, M., Islam, M. B., and Hasan, M. (2019). A simplistic approach of algal biofuels production from wastewater using a hybrid anaerobic baffled reactor and photobioreactor (HABR-PBR) System. PLoS One 14 (12), e0225458. doi:10.1371/journal.pone.0225458
Kong, W., Kong, J., Feng, S., Yang, T., Xu, L., Shen, B., et al. (2024). Cultivation of microalgae–bacteria consortium by waste gas–waste water to achieve CO2 fixation, wastewater purification and bioproducts production. Biotechnol. Biofuels Bioprod. 17 (1), 26. doi:10.1186/s13068-023-02409-w
Kulkarni, A. A. (2007). Mass transfer in bubble column reactors: effect of bubble size distribution. Industrial Eng. Chem. Res. 46 (7), 2205–2211. doi:10.1021/ie061015u
Kumar, M., Gupta, A., and Thakur, I. S. (2016). Carbon dioxide sequestration by chemolithotrophic oleaginous bacteria for production and optimization of polyhydroxyalkanoate. Bioresour. Technol. 213, 249–256. doi:10.1016/j.biortech.2016.02.038
Kumar, P., Prajapati, S. K., Malik, A., and Vijay, V. K. (2017). Cultivation of native algal consortium in semi-continuous pilot scale raceway pond for greywater treatment coupled with potential methane production. J. Environ. Chem. Eng. 5 (6), 5581–5587. doi:10.1016/j.jece.2017.10.044
Law, J. H., and Slepecky, R. A. (1961). Assay of poly-β-hydroxybutyric acid. J. Bacteriol. 82 (1), 33–36. doi:10.1128/jb.82.1.33-36.1961
Lee, C. H., Choi, H., Jerng, D. W., Kim, D. E., Wongwises, S., and Ahn, H. S. (2019). Experimental investigation of microbubble generation in the venturi nozzle. Int. J. Heat Mass Transf. 136, 1127–1138. doi:10.1016/j.ijheatmasstransfer.2019.03.040
Li, J., Song, Y., Yin, J., and Wang, D. (2017). Investigation on the effect of geometrical parameters on the performance of a venturi type bubble generator. Nucl. Eng. Des. 325, 90–96. doi:10.1016/j.nucengdes.2017.10.006
Li, J., Li, C., Lan, C. Q., and Liao, D. (2018). Effects of sodium bicarbonate on cell growth, lipid accumulation, and morphology of Chlorella vulgaris. Microb. Cell factories 17 (1), 111. doi:10.1186/s12934-018-0953-4
Li, M., Bussonnière, A., Bronson, M., Xu, Z., and Liu, Q. (2019). Study of Venturi tube geometry on the hydrodynamic cavitation for the generation of microbubbles. Miner. Eng. 132, 268–274. doi:10.1016/j.mineng.2018.11.001
Lindsey, R. (2024). Climate change: atmospheric carbon dioxide. NOAA Climate.gov. Available online at: https://www.climate.gov/news-features/understanding-climate/climate-change-atmospheric-carbon-dioxide (Accessed September 3, 2025).
Mata, T. M., Martins, A. A., and Caetano, N. S. (2010). Microalgae for biodiesel production and other applications: a review. Renew. Sustain. Energy Rev. 14 (1), 217–232. doi:10.1016/j.rser.2009.07.020
Meixner, K., Kovalcik, A., Sykacek, E., Gruber-Brunhumer, M., Zeilinger, W., Markl, K., et al. (2018). Cyanobacteria biorefinery—production of poly (3-hydroxybutyrate) with Synechocystis salina and utilisation of residual biomass. J. Biotechnol. 265, 46–53. doi:10.1016/j.jbiotec.2017.10.020
Mesa, D., Quintanilla, P., and Reyes, F. (2022). Bubble Analyser—An open-source software for bubble size measurement using image analysis. Miner. Eng. 180, 107497. doi:10.1016/j.mineng.2022.107497
Mongili, B., Abdel Azim, A., Fraterrigo Garofalo, S., Batuecas, E., Re, A., Bocchini, S., et al. (2021). Novel insights in dimethyl carbonate-based extraction of polyhydroxybutyrate (PHB). Biotechnol. Biofuels 14 (1), 13. doi:10.1186/s13068-020-01849-y
Morales, M., Sánchez, L., and Revah, S. (2018). The impact of environmental factors on carbon dioxide fixation by microalgae. FEMS Microbiol. Lett. 365 (3), fnx262. doi:10.1093/femsle/fnx262
Mourão, M. M., Gradíssimo, D. G., Santos, A. V., Schneider, M. P. C., Faustino, S. M. M., Vasconcelos, V., et al. (2020). Optimization of polyhydroxybutyrate production by amazonian microalga Stigeoclonium sp. B23. Biomolecules 10 (12), 1628. doi:10.3390/biom10121628
Mukherjee, A., and Chatterjee, S. (2023). Carbon capture, utilization and storage (CCUS): technology gaps and international collaboration (G20 ETWG Presidency document). Dastur Energy Inc.; Dastur Energy Pvt. Ltd.; Ministry of Power, Government of India. Available online at: https://www.g20.in/content/dam/gtwenty/gtwenty_new/document/etwg_docu/14_G20%20ETWG%20Presidency%20Document%20-Study%20on%20Carbon%20Capture%20Utilization%20_%20Storage%20(CCUS)%20Technology%20Gaps%20_%20International%20Collaboration.pdf[2.] (Accessed August 27, 2025)
Munson, B. R., Young, D. F., Okiishi, T. H., and Huebsch, W. W. (2013). Fundamentals of fluid mechanics. 7th ed. Hoboken, NJ: Wiley, 181–188.
Olabi, A. G., Wilberforce, T., Elsaid, K., Sayed, E. T., Maghrabie, H. M., and Abdelkareem, M. A. (2022). Large scale application of carbon capture to process industries–a review. J. Clean. Prod. 362, 132300. doi:10.1016/j.jclepro.2022.132300
OriginLab Corporation (2010). OriginPro [Software]. Northampton, MA: OriginLab Corporation. Available online at: https://www.originlab.com.
Paul, S., Bera, S., Dasgupta, R., Mondal, S., and Roy, S. (2021). Review on the recent structural advances in open and closed systems for carbon capture through algae. Energy Nexus 4, 100032. doi:10.1016/j.nexus.2021.100032
Peng, X., Meng, F., Wang, Y., Yi, X., and Cui, H. (2020). Effect of pH, temperature, and CO2 concentration on growth and lipid accumulation of Nannochloropsis sp. MASCC 11. J. Ocean Univ. China 19 (5), 1183–1192. doi:10.1007/s11802-020-4302-y
Pritchard, P. J., and Mitchell, J. W. (2015). Fox and McDonald's introduction to fluid mechanics. 9th ed., Ch. 13. Hoboken, NJ: John Wiley and Sons, 728–732.
Putt, R., Singh, M., Chinnasamy, S., and Das, K. C. (2011). An efficient system for carbonation of high-rate algae pond water to enhance CO2 mass transfer. Bioresour. Technol. 102 (3), 3240–3245. doi:10.1016/j.biortech.2010.11.029
Qiu, R., Gao, S., Lopez, P. A., and Ogden, K. L. (2017). Effects of pH on cell growth, lipid production and CO2 addition of microalgae Chlorella sorokiniana. Algal Res. 28, 192–199. doi:10.1016/j.algal.2017.11.004
Rahman, A., Putra, J. D., Prihantini, N. B., Mahlia, T. M. I., Aziz, M., Nasruddin, N., et al. (2021). Cultivation of Synechococcus HS-9 in a novel rectangular bubble column photobioreactor with horizontal baffle. Case Stud. Therm. Eng. 27, 101264. doi:10.1016/j.csite.2021.101264
Ratomski, P., Hawrot-Paw, M., and Koniuszy, A. (2021). Utilisation of CO2 from sodium bicarbonate to produce Chlorella vulgaris biomass in tubular photobioreactors for biofuel purposes. Sustainability 13 (16), 9118. doi:10.3390/su13169118
Rezvani, F., and Rostami, K. (2023). Photobioreactors for utility-scale applications: effect of gas–liquid mass transfer coefficient and other critical parameters. Environ. Sci. Pollut. Res. 30 (31), 76263–76282. doi:10.1007/s11356-023-27644-4
Rodrigues, A. M., Franca, R. D. G., Dionísio, M., Sevrin, C., Grandfils, C., Reis, M. A., et al. (2022). Polyhydroxyalkanoates from a mixed microbial culture: extraction optimization and polymer characterization. Polymers 14 (11), 2155. doi:10.3390/polym14112155
Roh, H., Lee, J. S., Choi, H. I., Sung, Y. J., Choi, S. Y., Woo, H. M., et al. (2021). Improved CO2-derived polyhydroxybutyrate (PHB) production by engineering fast-growing cyanobacterium Synechococcus elongatus UTEX 2973 for potential utilization of flue gas. Bioresour. Technol. 327, 124789. doi:10.1016/j.biortech.2021.124789
Rosenberg, J. N., Mathias, A., Korth, K., Betenbaugh, M. J., and Oyler, G. A. (2011). Microalgal biomass production and carbon dioxide sequestration from an integrated ethanol biorefinery in Iowa: a technical appraisal and economic feasibility evaluation. Biomass Bioenergy 35 (9), 3865–3876. doi:10.1016/j.biombioe.2011.05.014
Roshanti, F., Sidhi, S. D. P., Kamal, S., and Indarto, Indarto (2023). The performance of venturi microbubble generator type with a 60 twisted baffles. Eng. Proc. 37 (1), 116. doi:10.3390/ECP2023-14680
Saad, M. G., Dosoky, N. S., Zoromba, M. S., and Shafik, H. M. (2019). Algal biofuels: current status and key challenges. Energies 12 (10), 1920. doi:10.3390/en12101920
Salehizadeh, H., Yan, N., and Farnood, R. (2020). Recent advances in microbial CO2 fixation and conversion to value-added products. Chem. Eng. J. 390, 124584. doi:10.1016/j.cej.2020.124584
Schneider, C. A., Rasband, W. S., and Eliceiri, K. W. (2012). NIH Image to ImageJ: 25 years of image analysis. Nat. Methods 9 (7), 671–675. doi:10.1038/nmeth.2089
Shah, K. (2012). FTIR analysis of polyhydroxyalkanoates by a locally isolated novel bacillus sp. AS 3-2 from soil of Kadi region, North Gujarat, India. J. Biochem. Technol. 3 (4), 380–383. Available online at: https://d1wqtxts1xzle7.cloudfront.net/49146508/ftir-libre.pdf?1474960151=&response-content-disposition=inline%3B+filename%3DFTIR_analysis_of_polyhydroxyalkanoates_b.pdf&Expires=1764128504&Signature=g6wvOeu43l4k10TJBScgoc8g4PmQ52cug2QzHKwIIX8DfCeVhU67sl7BvApaMllxfx3pvuhxXmH∼wZAm46k02Aqg8Gh9MLEcvqwPHKHYANPiRg3Xo9WP1L∼GoGghWM5FWudYcYAfwoQlwopSwO∼7g6Q3pKFDnCD8MMZHVLOwZY6JxrmS8pplVAa3SeIl1Q6g∼iO6rDVFhJVC4jyKQ9∼HBQV6QKGThJCnKSueNhAv7VK63BCYZxp4EF6Rk79∼3n0AVMt1WTxjlO∼LA3xBLTAuYJ∼-∼lVmvWAnjq1wIZ3S3kgLltKf3W7gaRmldq∼mkv77Xwv7AsJTX5a5iM52JR0hPA__&Key-Pair-Id=APKAJLOHF5GGSLRBV4ZA
Shaikh, A., and Al-Dahhan, M. (2013). Scale-up of bubble column reactors: a review of current state-of-the-art. Industrial Eng. Chem. Res. 52 (24), 8091–8108. doi:10.1021/ie302080m
Shamala, T. R., Divyashree, M. S., Davis, R., Kumari, K. L., Vijayendra, S. V. N., and Raj, B. (2009). Production and characterization of bacterial polyhydroxyalkanoate copolymers and evaluation of their blends by fourier transform infrared spectroscopy and scanning electron microscopy. Indian J. Microbiol. 49 (3), 251–258. doi:10.1007/s12088-009-0031-z
Singh, A. K., and Mallick, N. (2017). Advances in cyanobacterial polyhydroxyalkanoates production. FEMS Microbiol. Lett. 364 (20), fnx189. doi:10.1093/femsle/fnx189
Song, Y., Xie, L., Zhang, X., Hu, Z., Li, S., Zhang, P., et al. (2024). Enhancement of biomass, lipid accumulation, and carbon sequestration potential in microalgae via cultivation with aggregation-induced emission light-conversion films. Chem. Eng. J. 483, 149148. doi:10.1016/j.cej.2024.149148
Taepucharoen, K., Tarawat, S., Puangcharoen, M., Incharoensakdi, A., and Monshupanee, T. (2017). Production of poly (3-hydroxybutyrate-co-3-hydroxyvalerate) under photoautotrophy and heterotrophy by non-heterocystous N2-fixing cyanobacterium. Bioresour. Technol. 239, 523–527. doi:10.1016/j.biortech.2017.05.029
U.S. Environmental Protection Agency (2001). Method 1684: Total, fixed, and volatile solids in water, solids, and biosolids. EPA-821-R-01-015. Available online at: https://www.epa.gov/sites/default/files/2015-10/documents/method_1684_draft_2001.pdf. (Accessed September 12, 2025)
Uyar, B., Ali, M. D., and Uyar, G. E. O. (2024). Design parameters comparison of bubble column, airlift and stirred tank photobioreactors for microalgae production. Bioprocess Biosyst. Eng. 47 (2), 195–209. doi:10.1007/s00449-023-02952-8
van Heeswijk, W. (2024). IRPal 2.0: a software tool for interpreting IR spectra of organic compounds [Software]. Software Informer. Available online at: https://irpal.software.informer.com/2.0/. (Accessed August 31, 2025)
Venturi, G. B. (1797). Recherches expérimentales sur le principe de la communication latérale du mouuement dans les fluides, appliqué à l'explication de différens phénomènes hydrauliques. Modena, Italy: Par. JB Venturi. chez Houel et Ducros.
Volova, T. G., Zhila, N. O., Shishatskaya, E. I., Mironov, P. V., Vasil’Ev, A. D., Sukovatyi, A. G., et al. (2013). The physicochemical properties of polyhydroxyalkanoates with different chemical structures. Polym. Sci. Ser. A 55 (7), 427–437. doi:10.1134/s0965545x13070080
Wang, X., Shuai, Y., Zhou, X., Huang, Z., Yang, Y., Sun, J., et al. (2020). Performance comparison of swirl-venturi bubble generator and conventional venturi bubble generator. Chem. Eng. Processing-Process Intensif. 154, 108022. doi:10.1016/j.cep.2020.108022
Wang, J., Huang, J., Guo, H., Jiang, S., Qiao, J., Chen, X., et al. (2021). Effects of different sodium salts and nitrogen sources on the production of 3-hydroxybutyrate and polyhydroxybutyrate by Burkholderia cepacia. Bioresour. Bioprocess. 8 (1), 64. doi:10.1186/s40643-021-00418-x
Wei, Y. H., Chen, W. C., Huang, C. K., Wu, H. S., Sun, Y. M., Lo, C. W., et al. (2011). Screening and evaluation of polyhydroxybutyrate-producing strains from indigenous isolate Cupriavidus taiwanensis strains. Int. J. Mol. Sci. 12 (1), 252–265. doi:10.3390/ijms12010252
Wood, J. L., Takemoto, J. Y., and Sims, R. C. (2022). Rotating algae biofilm reactor for management and valorization of produced wastewater. Front. Energy Res. 10, 774760. doi:10.3389/fenrg.2022.774760
Yang, Z., Cheng, J., Liu, J., Zhou, J., and Cen, K. (2016). Improving microalgal growth with small bubbles in a raceway pond with swing gas aerators. Bioresour. Technol. 216, 267–272. doi:10.1016/j.biortech.2016.05.076
Yin, J., Li, J., Li, H., Liu, W., and Wang, D. (2015). Experimental study on the bubble generation characteristics for an venturi type bubble generator. Int. J. Heat Mass Transf. 91, 218–224. doi:10.1016/j.ijheatmasstransfer.2015.05.076
Yoro, K. O., and Daramola, M. O. (2020). “CO2 emission sources, greenhouse gases, and the global warming effect,” in Advances in carbon capture (Johannesburg, South Africa: Woodhead Publishing), 3–28. doi:10.1088/&spi1;1748-9326/ab5e6f&spi1
You, X., Yang, L., Chu, H., Zhang, L., Hong, Y., Lin, Y., et al. (2024). Micro-nano-bubbles and their application in microalgae production: wastewater treatment, carbon capture and microalgae separation. Algal Res. 78, 103398. doi:10.1016/j.algal.2024.103398
Zguris, Z. (2016). How mechanical properties of stereolithography 3D prints are affected by UV curing . [White paper]. Formlabs. Available online at: https://www.dynamism.com/download/2016/UV%20Postcure%20white%20paper.pdf. (Accessed September 8, 2025)
Keywords: microbubble photobioreactor, CO2 bio-fixation, polyhydroxybutyrate, algal biopolymer, carbon capture and usage
Citation: Dey S, Sahu A, Dalvi V, De BS and Malik A (2025) Engineering an automated microbubble-assisted hybrid photobioreactor for CO2 capture and valorisation to polyhydroxybutyrate in indigenous algal biomass. Front. Chem. Eng. 7:1701857. doi: 10.3389/fceng.2025.1701857
Received: 09 September 2025; Accepted: 23 October 2025;
Published: 03 December 2025.
Edited by:
Lakhan Kumar, Maulana Azad National Institute of Technology, IndiaReviewed by:
Sanjeev Kumar Prajapati, Indian Institute of Technology Roorkee, IndiaThilini U. Ariyadasa, University of Moratuwa, Sri Lanka
Poonam Choudhary, Indian Institute of Technology Roorkee, India
Copyright © 2025 Dey, Sahu, Dalvi, De and Malik. This is an open-access article distributed under the terms of the Creative Commons Attribution License (CC BY). The use, distribution or reproduction in other forums is permitted, provided the original author(s) and the copyright owner(s) are credited and that the original publication in this journal is cited, in accordance with accepted academic practice. No use, distribution or reproduction is permitted which does not comply with these terms.
*Correspondence: Anushree Malik, YW51c2hyZWVAcmRhdC5paXRkLmFjLmlu, YW51c2hyZWUubWFsaWtAZ21haWwuY29t