 Razan Khawaja
 Tagwa Musa
 Mohamed Sufiyan Challiwala1
 Mahmoud M. El-Halwagi
 Nimir O. Elbashir
- 1Chemical Engineering Program, Texas A&M University at Qatar, Doha, Qatar
- 2Artie McFerrin Chemical Engineering Department, Texas A&M University, College Station, TX, United States
- 3College of Science and Engineering, Hamad Bin Khalifa University, Doha, Qatar
Methanol synthesis is one of the most hydrogen-intensive chemical processes, making its decarbonization a critical step toward climate-aligned chemical production. In this study, Aspen Plus® process simulation and techno-economic assessment (TEA) were applied to evaluate and compare four hydrogen production configurations for natural-gas-based methanol synthesis with capacity of 5,000 tons/day: (i) a conventional partial oxidation (POx)- water-gas shift reaction (WGS) base case, (ii) advanced reforming of methane (ARM) with integrated CO2 utilization and multi-walled carbon nanotube (MWCNT) co-production, (iii) methane pyrolysis coupled with reverse water–gas shift reaction (RWGS), and (iv) POx supplemented with renewable hydrogen and oxygen from alkaline water electrolysis (AWE). Each configuration was assessed for syngas composition, carbon intensity (CI), capital and operating expenditures, net present value (NPV), internal rate of return (IRR), levelized cost of fuel (LCOF), and marginal abatement cost (MAC). Both ARM and Methane Pyrolysis + RWGS achieved net-negative CI (−0.47 and −0.57 kg CO2/kg MeOH, respectively), while AWE + POx reduced CI by 75% compared with the baseline and exhibited the lowest indirect emissions. ARM provided the highest profitability (NPV ≈ $20.2 B, IRR ≈ 118%/year) due to MWCNT revenues, whereas AWE-integrated delivered the lowest LCOF (≈$296/ton) and a negative MAC (≈−$137/ton CO2e), representing a cost-saving “no-regrets” decarbonization pathway. Methane pyrolysis and RWGS offered the deepest CO2 reduction but were more sensitive to natural gas and electricity prices. These results identify clear deployment niches: ARM in regions with robust carbon co-product markets, methane pyrolysis + RWGS where CO2 supply is abundant and valorization is feasible, and AWE-integrated where low-cost renewable electricity is accessible. Two-way sensitivity maps further delineate viability domains as a function of gas and methanol prices, providing a compact decision-support tool for investors.
1 Introduction
The global drive toward net-zero emissions and sustainable energy systems has placed low-carbon hydrogen at the forefront of scientific, industrial, and policy discussions. Hydrogen production currently contributes nearly 900 million tons of CO2 annually, representing approximately 2% of global anthropogenic emissions, as most H2 is derived from fossil fuels without carbon capture (Ullah et al., 2023). Conventional production routes such as steam methane reforming (SMR), partial oxidation (POx), and autothermal reforming (ATR) yield “grey” or “blue” hydrogen depending on the extent of CO2 capture, but remain associated with high carbon intensity (CI) and significant economic and technical challenges in scaling up carbon capture and storage infrastructure (Khojasteh-Salkuyeh et al., 2023; Usman and Daud, 2015). Concurrently, definitions and standards for “green methanol” have tightened; recent EU and Green Hydrogen Organization (GH2) guidance, including the updated ISCC EU 205-1 (ISCC, 2024) and the EU RFNBO methodology (Tovar et al., 2025), allow non-biogenic CO2 sources provided the full life-cycle emissions are <28.2 g CO2/MJ, establishing a transparent threshold for “green” classification (ISCC, 2024; Tovar et al., 2025; Zhang et al., 2025).
Demand for hydrogen continues to increase, not only as a feedstock for chemical manufacturing but also as a vector for energy storage, transportation, and industrial heat. Methanol synthesis represents one of the largest hydrogen sinks, with global production of ∼110 million tons per year and an installed capacity of around 170 million tons in 2023. More than 200 renewable-methanol projects are being tracked, with projected green-methanol capacity expected to reach ∼19.3 Mt by 2027 and 24.2 Mt by 2029, underscoring the importance of credible techno-economic analysis (TEA) and life-cycle assessment (LCA) baselines (Zhang et al., 2025). The global methanol market is projected to grow from $30.9 billion in 2023 to roughly $38 billion by 2028 (Deka et al., 2022; Markets and Markets, 2023; MI Manifesto, 2024) Because methanol synthesis is inherently hydrogen-intensive, reducing the CI of its hydrogen supply is central to achieving climate-aligned production (Pérez-Fortes et al., 2016; Rafiq et al., 2024).
Conventional natural gas–based methanol production typically has a carbon footprint of 100–110 g CO2-eq/MJ, whereas coal-based methanol exceeds 300 g CO2-eq/MJ (Hamelinck and Bunse, 2022). Several research activities have been recently undertaken to explore the impact of enhancing methanol production through catalyst and process optimization, as well as the prospects for electrification (Al-Aboosi et al., 2025; Alsuhaibani et al., 2020; Hernández-Pérez et al., 2022; Mion et al., 2022; Scomazzon et al., 2024). Although strategies such as CO2 recycle in the synthesis loop, renewable hydrogen integration, and electrified reforming can mitigate these emissions, commercial deployment remains limited due to economic and operational barriers (Irena, 2021; Olah et al., 2018). In parallel, new evaluation metrics such as the CO2Fix model have been proposed to quantify the net fixation potential of carbon utilization pathways by balancing CO2 consumed in reactions with process energy emissions, offering a complementary perspective to conventional LCA approaches (Ibrahim et al., 2023). Recent techno-economic studies show that achieving cost parity for renewable methanol will likely require a combination of low-cost renewable electricity, carbon pricing, and co-product valorization (Fasihi and Breyer, 2024; Liu et al., 2024). Current literature estimates the cost of green-methanol production to be in the range of roughly $600–$800/ton, compared with $195–$313/ton for natural-gas routes and $215–$330/ton for coal-based routes (Zhang et al., 2025). However, recent market data reported by the Methanol Institute indicate that actual traded prices can be significantly higher in some regions; for example, in December 2024, coal-based methanol in China was priced at around $300/ton, while in the U.S. Gulf region, where methanol is primarily produced from shale gas, prices ranged from a low of about $500/ton to above $800/ton (Methanol Institute, 2024). In electrolysis-intensive routes, electricity is the primary process-cost driver; for example, a 30% increase in power prices can lead to a nearly 22% rise in methanol costs (Zhang et al., 2025).
Several emerging technologies demonstrate low-carbon hydrogen production. Dual-reactor advanced reforming processes (e.g., CARGEN®) co-produce syngas and solid carbon materials, inherently sequestering carbon while utilizing CO2 as a reactant (Challiwala et al., 2024; Challiwala et al., 2021). Techno-economic evaluations have shown that such processes can achieve lower CI while adding value through multi-walled carbon nanotube (MWCNT) co-products (ARPA-E, 2022). Methane pyrolysis, when combined with the reverse water-gas shift (RWGS) reaction, enables hydrogen generation with near-zero direct CO2 emissions while producing syngas with an optimal H2/CO ratio (Sánchez-Bastardo et al., 2021). Recent reviews highlight advances in electrified methane pyrolysis, molten-salt reactors, and carbon market opportunities that could make this route economically competitive with blue hydrogen (C2ES, 2024; Moghaddam et al., 2025; Rohani et al., 2025). Similarly, integrating renewable hydrogen from alkaline water electrolysis (AWE) with POX can partially replace fossil-derived hydrogen and oxygen, reducing CI where renewable electricity is available (Fasihi and Breyer, 2024; IEA, 2020; Tejeda and El-Halwagi, 2025). Consistent with current accounting practice, renewable electricity used for AWE is treated with a zero-emission factor in the base case, while non-AWE electricity follows the stated grid-mix emission factor in sensitivity analyses.
This study applies Aspen Plus® simulation to evaluate four distinct hydrogen production configurations for natural gas-based methanol synthesis: a conventional POx reforming route (baseline), advanced methane reforming with integrated CO2 utilization and solid carbon recovery, methane pyrolysis coupled with RWGS, and POx supplemented with renewable hydrogen and oxygen from AWE. Each configuration is analyzed in terms of syngas composition, hydrogen yield, methanol productivity, energy consumption, and direct and indirect CO2 emissions. A techno-economic assessment further compares capital investment, operating costs, carbon credit valuation, and potential co-product revenues. The results aim to identify feasible pathways for achieving low-carbon methanol production and to provide insight into the deployment of technology within the broader context of industrial hydrogen applications.
Unlike most previous methanol decarbonization schemes, the present study reconfigures the hydrogen-generation section itself rather than relying on post-reforming CO2 recycle or external hydrogen blending.
2 Methodology
2.1 Overview
All process simulations were performed in Aspen Plus® V12.1 under steady-state conditions. The Peng–Robinson equation of state (PR-EOS) was selected as the thermodynamic property package due to its proven accuracy in predicting vapor–liquid equilibria and compressibility for high-pressure syngas mixtures and alcohol–water systems (Poling et al., 2020; Towler and Sinnott, 2021). The model boundary covered all major process steps from the inlet of pre-treated natural gas to the production of crude methanol, adopting a gate-to-gate system boundary consistent with ISO 14040 principles (ISO, 2006). Upstream natural gas extraction and treatment, as well as downstream methanol refining and end-use, were excluded.
Design-specification blocks were applied to adjust oxygen feed rate and steam-to-carbon ratio, ensuring the desired H2:CO ratio at the methanol synthesis reactor inlet and a constant methanol production capacity of 5,000 tons/day across all scenarios. Heat integration was incorporated to represent typical industrial practice, with exchanger duties and utilities (steam, cooling water, and electricity) tracked for subsequent energy and emissions analysis. Fired-heater and reboiler duties were converted to equivalent natural gas consumption (assuming 90% efficiency) to enable direct CO2 emissions estimation (Aasberg-Petersen et al., 2008). For consistency, the study assumed the same methanol purity across all scenarios. Although differences in by-product water generation could influence crude methanol composition, the synthesis loop and separation section were kept fixed, as purity optimization was outside the scope of this comparative assessment.
The base-case model was benchmarked against the process configuration and performance data reported by Ehlinger et al. (2014), with syngas composition, H2:CO ratio, CO conversion in the water-gas shift (WGS) reactor, and per-pass methanol conversion tuned to match industrial ranges (Aasberg-Petersen et al., 2008).
2.2 Base case simulation
2.2.1 Feed composition and pre-treatment
Natural gas was assumed to meet pipeline specifications (sulfur-free and free of heavy hydrocarbons). The feed composition is shown in Table 1, with a total flow of 9,013 kmol/h (corresponding to an LHV of 48.5 MJ/kg). The gas entered at 26 °C and 26 bar, while oxygen was preheated to 200 °C. Upstream acid-gas removal, dehydration, and natural gas liquid (NGL) recovery were represented as a single pre-treated feed stream.
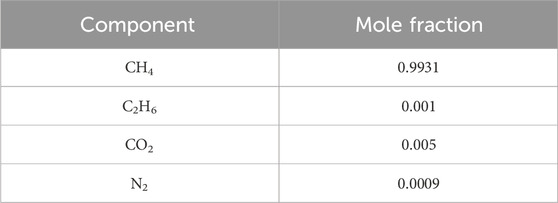
Table 1. Natural gas feed composition.
2.2.2 Syngas generation via POx
The feed and oxygen were mixed and sent to a non-catalytic POx reformer modeled as an RGibbs reactor at 25 bar and 1270 °C. The resulting syngas had an H2:CO ratio of ≈1.8:1. The hot effluent was cooled to 40 °C in a waste-heat boiler and then compressed to 39.5 bar.
2.2.3 Water-gas shift adjustment
The cooled syngas passed through a flash separator, was reheated to 300 °C, and fed to a water-gas shift (WGS) reactor (RStoic). The reactor operated at 323 °C and 39.5 bar, achieving 86.5% CO conversion with a steam-to-CO feed ratio of 1.5 (Aasberg-Petersen et al., 2008) through the reaction represented in Equation 1:
2.2.4 CO2 removal and compression
The shifted gas was cooled, water was separated, and CO2 was removed in a 50 wt% MDEA absorber (90% stage efficiency). CO2 content was reduced from 3.98 mol% to 0.80 mol%, and the sweet gas was compressed to 76 bar.
2.2.5 Methanol synthesis and purification
Methanol synthesis was modeled using a REquil reactor at 240 °C and 76 bar, including CO and CO2 hydrogenation and the reverse WGS (RWGS) reaction. This equilibrium-based approach provides a robust pathway-level comparison while avoiding uncertainties inherent in detailed kinetic modeling, which are known to strongly influence reactor-loop performance and optimization (Bisotti et al., 2022). Per-pass conversion was tuned to 25%–28%, consistent with commercial Lurgi-type loops (Aasberg-Petersen et al., 2008). The reactor effluent was cooled and recycled, with a small purge (approximately 0.35%) to prevent inert buildup. Crude methanol separation was modeled via a flash drum at 45 °C and 75 bar. A schematic process flowsheet for the base case is presented in Figure 1.
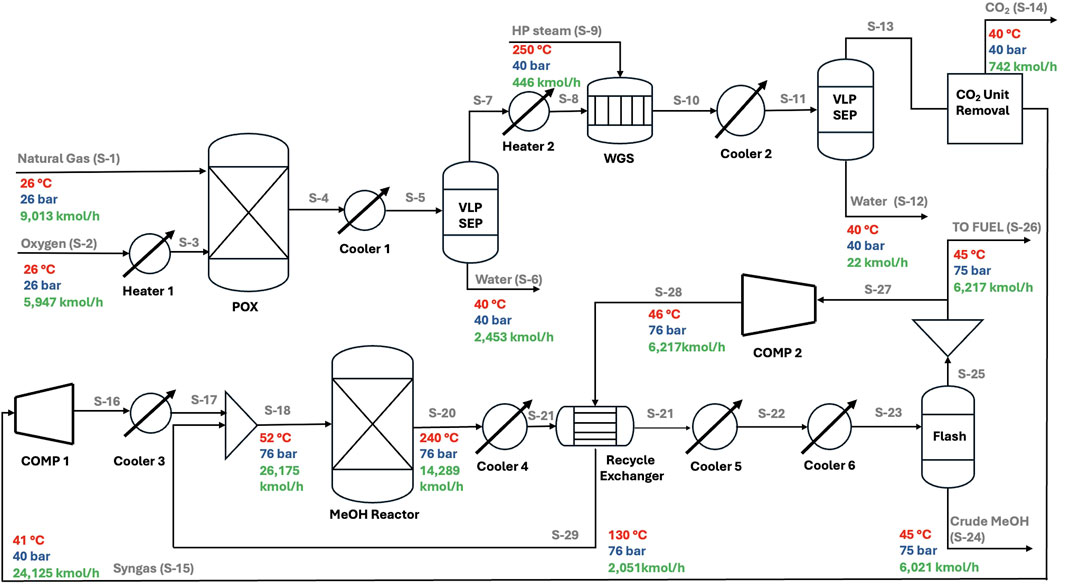
Figure 1. Process flowsheet of the base-case POx-based methanol plant.
2.3 Alternative low-carbon pathway scenarios
Three retrofit scenarios were evaluated, each replacing the POx–WGS section with a lower-carbon hydrogen route, including (i) Methane Pyrolysis + RWGS, (ii) Advanced reforming of methane (ARM), and (iii) AWE-integrated POx, while keeping the methanol loop unchanged. Figures 2–4 present the corresponding process flowsheets.
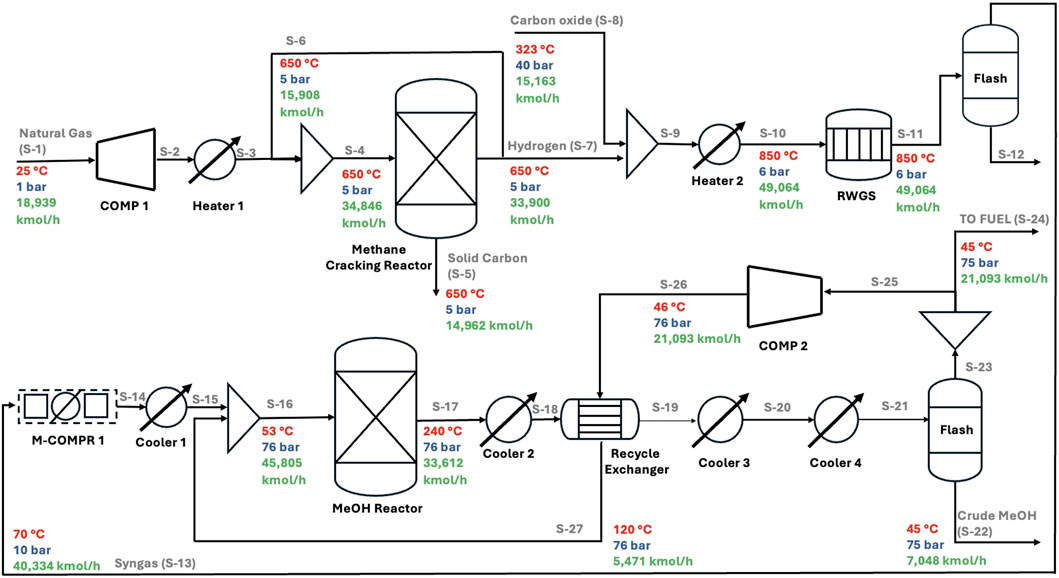
Figure 2. Process flowsheet for the methane pyrolysis + RWGS retrofit scenario.
2.3.1 Methane pyrolysis + RWGS
POx and WGS were replaced with a methane pyrolysis reactor and an RWGS reactor. Natural gas at 1 bar was compressed to 5 bars, preheated to 650 °C, and fed to an RGibbs pyrolysis reactor:
Unconverted methane was recycled to achieve >60% conversion (Parkinson et al., 2019). Separated H2 was mixed with preheated CO2 and fed to an RWGS reactor operating at 850 °C and 6 bar (≈65% conversion) the reaction as shown in Equation 3:
Heat duty (≈2.5 GJ/t H2) was assumed to be supplied electrically (Parkinson et al., 2019). Solid carbon was treated as a marketable co-product and credited at $1,870/ton based on recent carbon black price indices (BusinessAnalytiq, 2025). A zero-by-product-value sensitivity case was also included to evaluate the economic viability of the pyrolysis scenario under unfavorable market conditions.
The detailed process flowsheet for this configuration is presented in Figure 2.
2.3.2 Advanced reforming of methane (ARM)
In this scenario, the conventional POx and WGS units were replaced with a two-stage advanced reforming configuration. The first reactor was fed with natural gas, oxygen, and CO2 at a molar ratio of CH4:O2:CO2 = 1:0.1:0.6 and modeled as an RGibbs reactor at 25 bars (Challiwala et al., 2024). This mildly oxidative, catalytic environment simultaneously converted CH4 to syngas and deposited solid carbon in the form of multi-walled carbon nanotubes (MWCNTs) as a valuable co-product. The hot reactor effluent was used for feed preheating through heat recovery, thereby reducing the external firing duty.
The syngas then enters a tri-reforming reactor (RGibbs) operating at 820 °C and 20 bar, where steam, CO2, and O2 are co-fed to adjust the overall stoichiometry and maximize CO2 utilization. The resulting syngas achieves an H2:CO ratio of 1.8:1, which was tuned via design-spec blocks to reach 2.0:1 at the methanol loop inlet. The conditioned syngas was compressed to 76 bar (M-COMPR 2) before entering the methanol synthesis loop (Figure 3).
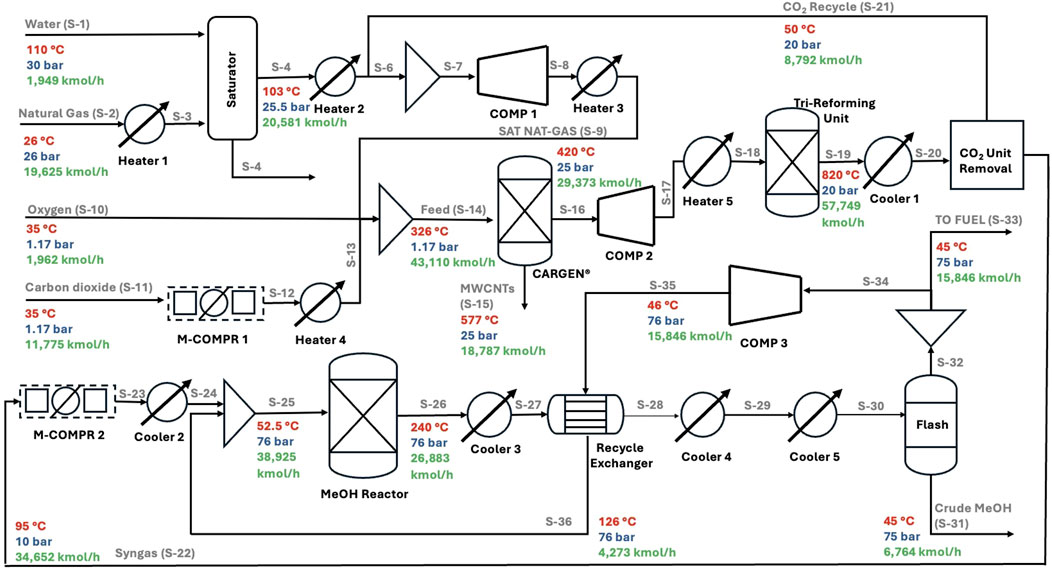
Figure 3. Process flowsheet for the advanced methane reforming retrofit scenario.
In the techno-economic analysis, MWCNTs were treated as a monetizable by-product, with revenue accounted for in the base-case economics and sensitivity cases exploring a zero-value scenario to assess economic robustness.
2.3.3 AWE-integrated POx
In the third scenario, an alkaline water electrolyzer (AWE) unit was integrated to provide hydrogen for ratio adjustment, eliminating the WGS reactor entirely. The AWE was modeled based on literature data for a large-scale 20-MW system operating at 138 °C and 37 bar with a 30 wt% KOH electrolyte. The unit produced 232 kmol/h of H2 (20% water conversion) (IRENA, 2021), which was then compressed and fed to the methanol loop to achieve the target H2:CO ratio. Co-produced O2 (126 kmol/h) was blended with external O2 to partially offset POx oxidant demand, reducing external O2 consumption (Figure 4).
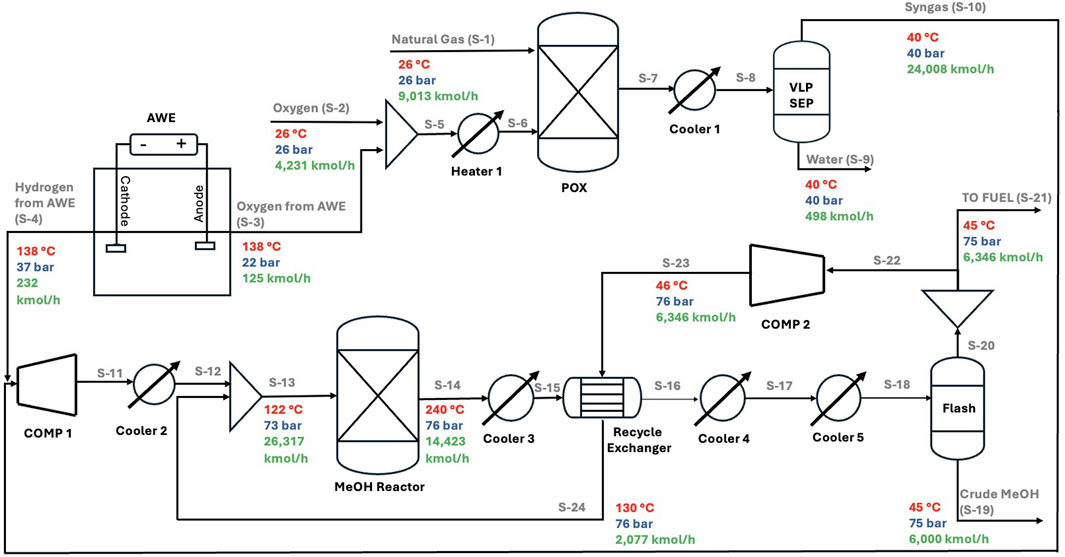
Figure 4. Process flowsheet for the AWE-integrated POx retrofit scenario.
2.3.4 Comparative summary
Table 2 summarizes the key technical differences among the four process configurations, highlighting the reforming technology, CO2 handling approach, additional units, primary energy input, and co-products considered in each case.
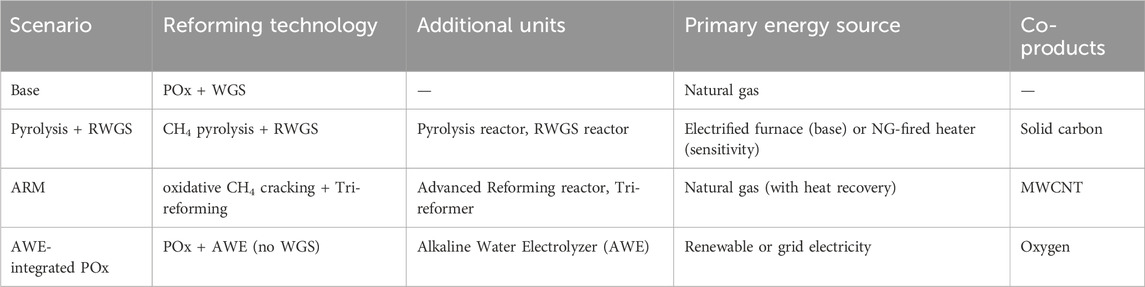
Table 2. Summary of key differences between scenarios.
2.4 CO2 emissions calculation
The CI of each methanol production configuration was evaluated on a gate-to-gate basis, including all major process steps from the inlet of pre-treated natural gas to the production of crude methanol. Results are reported as kg CO2-eq per kg of crude methanol, allowing for a normalized comparison across scenarios. This boundary aligns conceptually with recent CO2 fixation metrics that balance CO2 consumed in reactions against emissions induced by process energy requirements (Ibrahim et al., 2023).
Using Equation 4, direct emissions were obtained by summing all CO2-containing outlet streams (purge gas, CO2-rich amine absorber streams, RWGS vents).
where
Indirect emissions were calculated from energy use (kWh/h) multiplied by the grid emission factor as shown in Equation 5:
where
Heat Duty Treatment: Fired-heater and reboiler duties were converted to equivalent natural-gas combustion rates, assuming a 90% thermal efficiency, before applying the appropriate CO2 emission factor. This ensures that indirect emissions reflect the primary energy required to meet the thermal load.
Fired-heater duties were converted to an NG combustion basis (90% efficiency). Total CI based on Equation 6 was:
where
2.5 Techno-economic analysis
TEA was conducted to evaluate the financial viability of the base case and three low-carbon retrofit scenarios under consistent design and operating assumptions. The analysis comprised three steps: (i) capital cost estimation (CAPEX), (ii) operating cost estimation (OPEX), and (iii) calculation of financial and decarbonization metrics, including Net Present Value (NPV), Internal Rate of Return (IRR), Levelized Cost of Fuel (LCOF), and cost of CO2 reduction.
2.5.1 Capital expenditure
2.5.1.1 Reference plant scaling
The capital cost for the base case was estimated by scaling the reported cost of Methanex’s Geismar 3 methanol plant (Methanex, 2023) (1.8 Mt/y, CAPEX = $1.30 B in 2023) using Equation 7:
where C1 and C2 represent the reference and scaled costs, respectively, and Q1 and Q2 denote the corresponding capacities, and n is the scaling factor (Towler and Sinnott, 2021).
CEPCI-adjusted from 2023 to 2024 (Chemical Engineering, 2024). Scenario CAPEX adjusted per reactor replacements (Turton et al., 2012).
Scenario-specific adjustments were made as follows:
- Methane Pyrolysis + RWGS: POx and WGS costs were removed; CAPEX was adjusted by adding pyrolysis and RWGS reactor costs estimated via Aspen Process Economic Analyzer (APEA) and literature (Parkinson et al., 2017).
- ARM: Base-case CAPEX was increased by 50% to reflect the dual-reactor system, consistent with literature guidelines (Abdelkarim et al., 2025; Ataya et al., 2023).
- AWE-integrated POx: WGS cost was subtracted, and AWE cost was added, calculated using the Cameli et al. (2024) cost correlation (reported in Equation 8):
where
2.5.1.2 Equipment cost estimation
For POX, WGS, and RWGS reactors, equipment costs were estimated using either Towler and Sinnott (2021) correlations, Khallaghi et al.’s (2024) scaling factors, or Turton’s et al. (2012) bare-module costing equations, with installation factors applied to obtain the total installed cost. Aspen Process Economic Analyzer (APEA) estimates were used for cross-validation.
2.5.2 Operating expenditure
Feedstock, utilities, maintenance (3% CAPEX), labor (10% OPEX), and catalyst costs are included. Market prices were sourced from the U.S. EIA (2023) and Grand View Research (2023). Electricity was priced at 0.036 $/kWh for all non-electrolyzer loads across scenarios. For the AWE-integrated POx scenario, the total electrolyzer electricity demand (including stack and balance-of-plant loads) was assumed to be supplied via a third-party solar power purchase agreement (PPA) at 0.044 $/kWh, consistent with the global average levelized cost of electricity (LCOE) for utility-scale solar PV reported by IRENA (2021). Other key economic assumptions are summarized in Table 3.
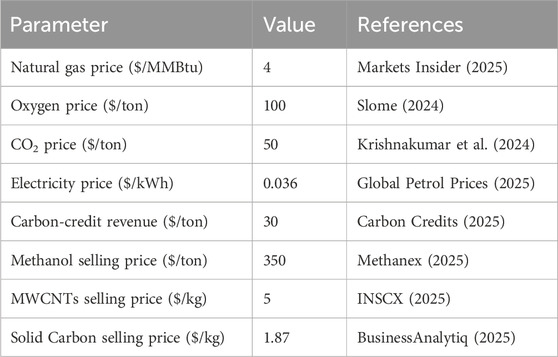
Table 3. The “Base” economic assumptions for OPEX calculations.
2.5.3 Financial and decarbonization metrics
NPV and IRR calculated per discounted cash flow (Turton et al., 2012) using Equation 9:
where Ct is net cash flow in year t, C0 is initial CAPEX, r is the discount rate (8% real), and n is project lifetime (25 years).
The IRR was determined as the discount rate at which NPV = 0, using Excel’s IRR function.
LCOF calculated via capital recovery factor (Towler and Sinnott, 2021) represented as Equation 10:
where CRF is the capital recovery factor calculated for the 25 years project life at an 8% discount rate.
The marginal abatement cost (MAC) was evaluated for each low-carbon retrofit scenario relative to the POX-based baseline using annualized total cost and CO2-equivalent emission reductions (IEA, 2020) as shown in Equation 11.
where Emissions is annual CO2 emissions (tCO2e/yr). This metric quantifies the marginal cost of CO2 mitigation, allowing for benchmarking against published decarbonization pathways.
Escalation rates were applied to reflect market trends:
- OPEX escalation: 2.5%/year
- Methanol price escalation: 2%/year
2.5.4 Sensitivity analysis
One-way sensitivity performed on the methanol price (
Two-way sensitivity surfaces: Interaction maps were constructed from one-way sensitivity curves using a first-order separable approximation as reported in Equation 12:
where x and y are the two varied parameters and NPV0 is the base case. This approach preserves each one-way curve exactly and provides an overview of interactions without re-optimizing the full flowsheet at every grid point. Ranges used were NG = 0.5–8 $/MMBtu; methanol = 210–560 $/ton; MWCNT = 0–10 $/kg, noting that this lower range represents a conservative worst-case assumption. In practice, a realistic fair value is between 10 to thousands $/kg (Su et al., 2022; Sisco Research Laboratory, 2025), while the studied 5$/kg may reflect a highly subsidized conditions), solid carbon = 0–3 $/kg, electricity = 0.02–0.1 $/kWh, and electricity from renewable for AWE-integrated POx = 0.2–0.1 $/kWh—all other assumptions held at base values.
3 Results and discussion
3.1 Base case performance and model validation
The base-case simulation of the conventional POX-based methanol plant was first validated against existing literature data to ensure model reliability before being used as a benchmark for subsequent scenarios. Selected inlet and outlet stream data were compared with the reference model reported by Ehlinger et al. (2014), and the percentage deviations are presented in Table 4. The discrepancies ranged from 0% to 17.3%, which is considered acceptable for process simulation studies, particularly when plant data are partially unavailable.
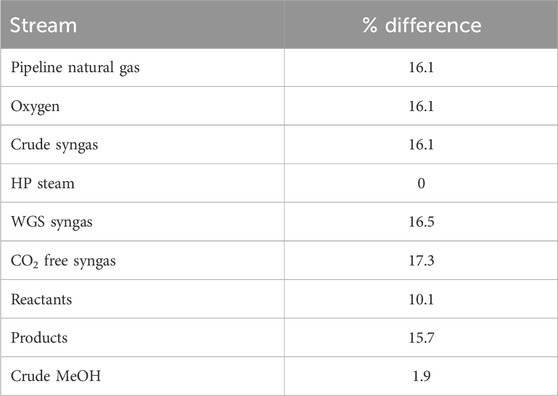
Table 4. Validation of base-case simulation against literature data (Ehlinger et al., 2014).
The largest deviations were observed in the syngas streams and CO2-free syngas, primarily due to process assumptions and the lack of detailed specifications for the CO2 removal section in the reference study. Extensive sensitivity analyses and iterative adjustments were conducted to tune the simulation parameters, including oxygen feed rate, steam-to-carbon ratio, and absorber efficiency, until a reasonable match was obtained. Challenges to convergence were encountered and systematically addressed, resulting in a robust and reproducible process model suitable for comparative analysis.
In addition to stream-by-stream validation, the total CO2 emissions were cross-checked against GREET® model data for natural gas-to-methanol synthesis without by-products. The developed model yielded a CI of 0.40 kg CO2/kg MeOH, closely matching the GREET value of 0.4145 kg CO2/kg MeOH, corresponding to a deviation of just 3.5%. This close agreement provides further confidence in the fidelity of the base-case model and its suitability as a reference scenario for techno-economic comparisons.
Overall, the base-case model establishes a solid foundation for evaluating the potential of advanced low-carbon hydrogen production pathways.
3.2 Process performance of low-carbon scenarios
Each low-carbon pathway was simulated to maintain a constant methanol production rate of 5,000 tons per day and an H2:CO ratio of approximately 2:1 at the methanol synthesis loop inlet. The results indicate that while all three scenarios successfully achieved the target methanol output, their resource requirements and by-product profiles varied significantly (Table 5).
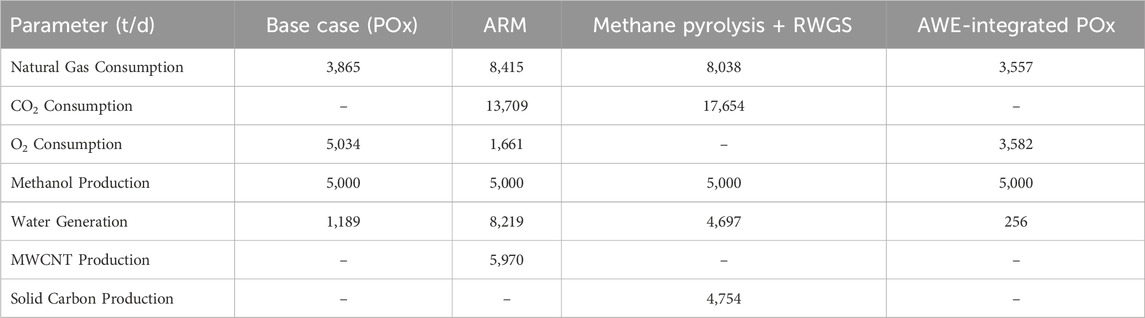
Table 5. Comparison of process parameters across scenarios.
3.2.1 Advanced reforming of methane
Natural gas consumption increased to 8,415 tons/day, approximately 2.2 times higher than the base case, as additional methane was required to supply both syngas and carbon for the formation of MWCNTs. The process also co-fed 13,709 tons/day of CO2 as a reactant, effectively enabling the utilization of CO2. A significant benefit of this configuration is its ability to produce 5,970 tons per day of high-quality MWCNTs, representing a potential revenue stream (only 25% of which was used to calculate the economic metrics) (Abdelkarim et al., 2025). Oxygen demand decreased by 67% relative to the base case due to partial oxidative cracking replacing full POx reforming. In addition, the ARM pathway generated 8,219 tons/day of water, significantly higher than the other scenarios, reflecting the extensive CO2 and steam co-feeding strategy.
3.2.2 Methane pyrolysis + RWGS
This scenario exhibited the highest CO2 demand (17,654 tons/day), approximately 29% greater than in ARM, because additional CO2 was required for the RWGS reaction to achieve the target syngas composition. Natural gas consumption (8,038 tons/day) was slightly lower than in ARM, but this configuration generated 4,754 tons/day of solid carbon, which could potentially be valorized as carbon black or graphite.
3.2.3 AWE-integrated POx
The integration of AWE reduced both natural gas and oxygen demand (3,557 tons/day and 3,582 tons/day, respectively), as part of the H2 and O2 requirements were supplied by the electrolyzer. No carbonaceous by-products were formed in this case, which simplifies downstream handling but eliminates co-product revenue opportunities.
These results highlight the trade-offs inherent in each configuration: ARM provides a unique opportunity for carbon monetization through MWCNT sales, while pyrolysis + RWGS offers deeper CO2 utilization potential. In contrast, the AWE pathway achieves resource efficiency but relies on access to low-cost renewable electricity for economic viability.
3.3 Carbon intensity comparison
The CI of methanol production was evaluated for the base case and each low-carbon scenario, accounting for both direct and indirect CO2 emissions on a gate-to-gate basis. Results are reported as kg CO2 per kg crude MeOH.
3.3.1 ARM
Integration of ARM led to a total CI of −0.47 kg CO2/kg MeOH, representing a 217% reduction relative to the base case (0.40 kg CO2/kg MeOH). Direct emissions became negative (−0.86 kg CO2/kg MeOH), reflecting the significant CO2 consumption as a reactant in the first reforming stage. This benefit was partially offset by an increase in indirect emissions compared with the base case, owing to higher heating and compression loads associated with the dual-reactor system. Nevertheless, the net-negative CI demonstrates the strong carbon-mitigation potential of advanced reforming when CO2 utilization is fully valorized.
3.3.2 Methane pyrolysis + RWGS
Replacing POx and WGS with a methane pyrolysis reactor and RWGS yielded the lowest CI among all cases (−0.57 kg CO2/kg MeOH), a 242% reduction versus the base case. Direct emissions decreased dramatically to −1.07 kg CO2/kg MeOH, driven by the large CO2 demand of the RWGS reaction. However, this configuration also exhibited the largest rise in indirect emissions (approximately 163% above the base case) due to its higher energy intensity for gas compression and heating.
3.3.3 AWE-integrated POx
Integrating an AWE, powered by renewable electricity, resulted in a total CI of 0.10 kg CO2/kg MeOH, corresponding to a 75% reduction compared to the base case. Direct emissions fell sharply because the WGS reactor, a major source of CO2, was removed entirely. Indirect emissions were the lowest of all scenarios due to the zero-carbon electricity supply for the AWE unit.
3.3.4 Comparative insights
Figure 5 summarizes direct, indirect, and total emissions across all configurations. Both ARM and methane pyrolysis + RWGS achieved net-negative carbon intensities, highlighting their potential for enabling carbon-neutral or carbon-negative methanol production. In contrast, the AWE pathway achieved a significant reduction in CI while offering the advantage of lower energy-related emissions. These results illustrate the trade-offs between CO2 utilization intensity, energy efficiency, and renewable integration, providing a foundation for subsequent techno-economic evaluation. In the terminology of (Ibrahim et al., 2023), the net-negative CI values observed for ARM and Methane Pyrolysis + RWGS correspond to CO2Fix >1, confirming that these pathways fix more CO2 than they emit when both reaction consumption and process energy requirements are considered.
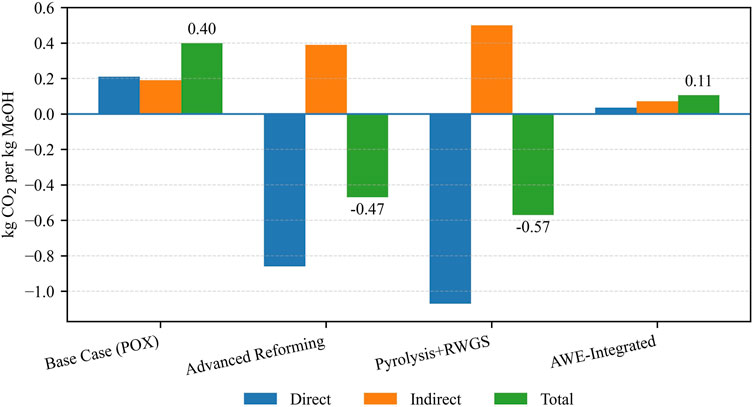
Figure 5. Comparison of direct, indirect, and total CO2 emissions (kg CO2/kg MeOH) for the base case and low-carbon methanol production scenarios.
These gate-to-gate results align with the broader ranges reported in recent meta-analyses of low-carbon methanol LCAs, which show similar variation across boundary definitions and energy sources (Savva et al., 2025), while the present work uniquely isolates reactor-level process-intensification effects.
3.4 Economic evaluation
3.4.1 CAPEX
The total investment cost for the base case POx configuration was estimated at $1.23 billion, which serves as the reference for evaluating retrofit scenarios. Among the low-carbon pathways, the methane pyrolysis + RWGS configuration required approximately $1.17 billion, slightly lower than the base case, as the cost of installing the pyrolysis and RWGS units was offset by the removal of the POx and WGS units. The AWE-integrated POx configuration had a CAPEX of $1.19 billion, which was very close to the base case. Although electrolyzer procurement incurs a significant capital cost, this is partially offset by the elimination of the WGS unit and its auxiliaries.
In contrast, ARM required the highest investment ($1.84 billion), reflecting the additional costs of the dual-reactor system, carbon capture and handling infrastructure, and expanded utility capacity (Ataya et al., 2023). These results highlight the capital-intensive nature of deep-decarbonization retrofits, which involve significant process reconfigurations.
3.4.2 OPEX
Under the base economic assumptions, the base case exhibited an annual OPEX of $441.9 million. The ARM pathway had the highest annual OPEX ($905.6 million), driven by over twice the natural gas consumption, substantial CO2 co-feed requirements, and increased utility demands. The methane pyrolysis + RWGS pathway was closely followed, with an annual cost of $880.9 million, reflecting the significant energy and compression requirements associated with processing large CO2 flows.
Despite its high electricity consumption compared to the POx, the AWE-integrated case achieved the lowest OPEX ($376.6 million/year), largely attributable to reduced natural gas and oxygen requirements, as well as the removal of the WGS section. Overall, OPEX was the dominant cost driver for all advanced pathways, particularly those handling large CO2 volumes, whereas the AWE pathway achieved superior operational efficiency. Similar to observations in gasification techno-economic analyses, the ability to offset high feedstock and utility costs through co-product valorization and CO2 utilization has a significant impact on overall viability (Ibrahim et al., 2024).
A consolidated summary of absolute CAPEX and annual OPEX values for all scenarios is presented in Table 6, facilitating direct comparison of capital intensity and operating cost drivers across the decarbonization pathways.
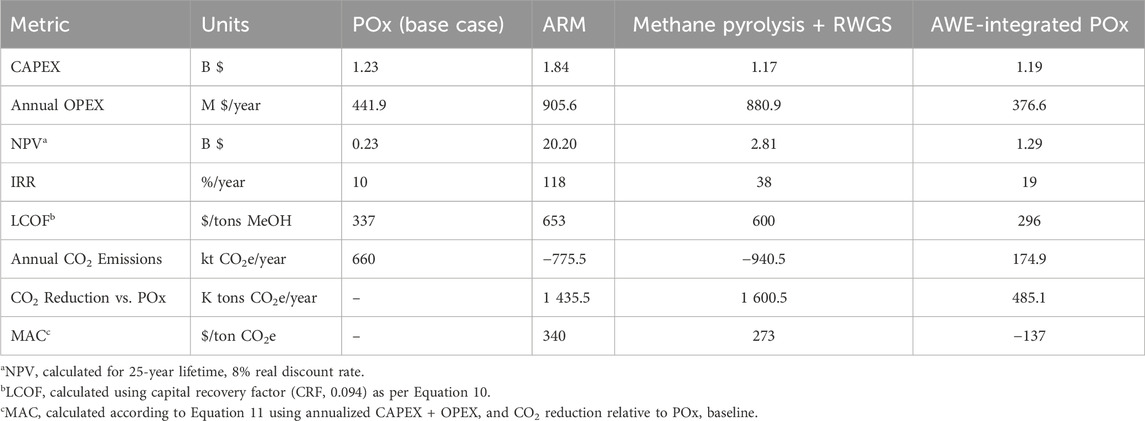
Table 6. Summary of economic and decarbonization metrics for the base case and low-carbon scenarios.
3.5 Profitability and financial indicators
Project profitability was assessed using NPV, IRR, and LCOF over a 25-year plant lifetime at an 8% real discount rate. The base case yielded a modest IRR of 10%/year and an NPV of $0.23 billion, consistent with its balanced CAPEX-OPEX profile. Its LCOF was calculated at 337 $/ton MeOH, which serves as the benchmark for scenario comparison.
The ARM demonstrated the highest profitability, achieving an NPV exceeding $20 billion and an IRR of 118%/year. Although its LCOF increased by 94% relative to the base case, this was more than offset by revenues from MWCNT sales and carbon credit, resulting in highly favorable cash flows. This pattern is consistent with economic insights from gasification studies, where profitability hinges less on baseline process costs and more on whether co-product markets (e.g., solid carbon or specialty chemicals) can be effectively developed (Ibrahim et al., 2024).
The methane pyrolysis + RWGS pathway produced the second-highest NPV and IRR, supported by revenues from solid carbon and carbon credits despite its elevated operating costs. Its LCOF was 78% higher than the base case but remained economically attractive given the depth of CI reduction achieved.
The AWE-integrated configuration delivered a positive NPV and an IRR of approximately 19%/year, with the lowest LCOF of all scenarios, highlighting its operational cost advantage. The key financial indicators are consolidated in Table 6 to provide a single reference point for comparing economic performance.
3.6 Cost of CO2 reduction
The MAC was computed for each low-carbon pathway relative to the POx baseline using Equation 11. A CRF of 0.094 was applied, corresponding to a 25-year project life at an 8% discount rate. As summarized in Table 6 and shown in Figure 6, ARM exhibited a MAC of 340 $/ton CO2e, while the methane pyrolysis + RWGS pathway offered a lower MAC of 273 $/ton CO2e, indicating superior cost-effectiveness per ton of CO2 mitigated.
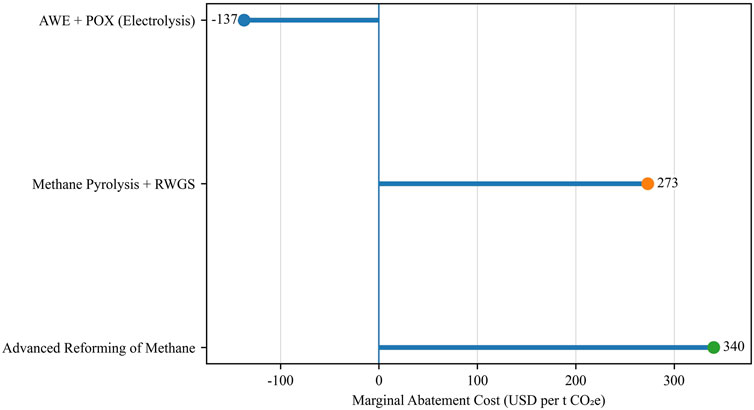
Figure 6. Marginal Abatement Cost by Scenario (relative to POx baseline).
Remarkably, the AWE-integrated case yielded a negative MAC of −137 $/ton CO2e, implying that this configuration simultaneously reduces annualized cost and achieves substantial emissions reductions (485 kt CO2e/year). Negative abatement costs represent highly attractive “no-regret” options for decarbonization, particularly in regions with access to low-cost renewable electricity (IPCC, 2001; Taylor, 2012).
Collectively, these findings highlight that while all three low-carbon scenarios achieve deep emissions reduction, their cost-effectiveness is strongly influenced by capital intensity and operating expenditure profiles. The results position water electrolysis as the most economically advantageous option under the assumed cost and price conditions.
3.7 Sensitivity analysis
A comprehensive one-way sensitivity analysis was conducted to quantify the influence of key economic parameters on the project’s NPV and IRR across all scenarios. The parameters included the methanol selling price (±40% around the base value of 350 $/ton), natural gas price (0.5–13 $/MMBtu), total CAPEX (−20% to +30%), and carbon credit revenue (30–100 $/ton CO2). Results are summarized in Figures 7–9 and discussed below.
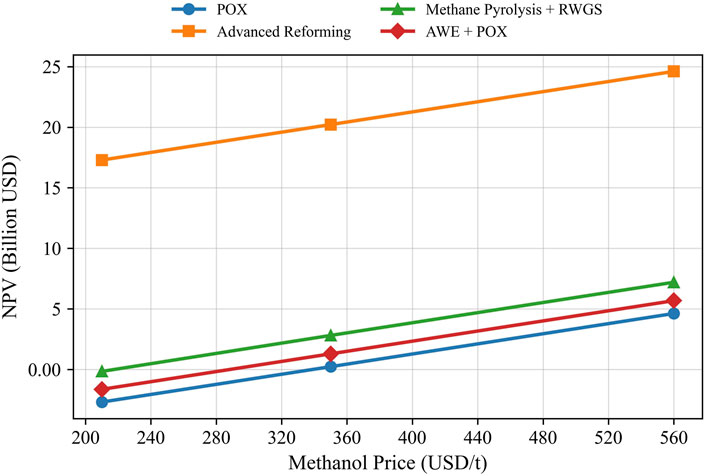
Figure 7. The effect of Methanol price on NPV for all scenarios (NG price = 4 $/MMBTU, and carbon credit price is 30$/ton, and medium CAPEX).
3.7.1 Methanol price sensitivity
NPV was highly responsive to the methanol price, particularly for scenarios with high product revenue contribution.
- ARM: Remained profitable across the entire price range, with NPV varying between $17.3–$24.6 B and IRR between 90% and 137%/year.
- Methane Pyrolysis + RWGS: Exhibited moderate sensitivity, with NPV crossing zero slightly below 250 $/ton methanol.
- POx and AWE-integrated: Both pathways turned economically unattractive at 210 $/ton (NPV <0) but became profitable at prices above 300 $/ton.
Figure 7 illustrates the strong positive correlation between methanol price and NPV, emphasizing price risk as a critical factor for investment decisions.
3.7.2 Natural gas price sensitivity
Natural gas prices were the dominant cost driver for POx, with NPV falling sharply to prices above 4 $/MMBtu and becoming negative at prices above 6 $/MMBtu.
ARM and Pyrolysis + RWGS: Showed more resilience due to carbon co-product revenues, though NPV declined by 60%–70% as natural gas prices increased from 0.5 to 8 $/MMBtu.
AWE-integrated: Exhibited the least sensitivity since natural gas contributes less to total OPEX due to partial displacement of fossil hydrogen by electrolytic hydrogen.
Figure 8 presents NPV and IRR as functions of natural gas price.
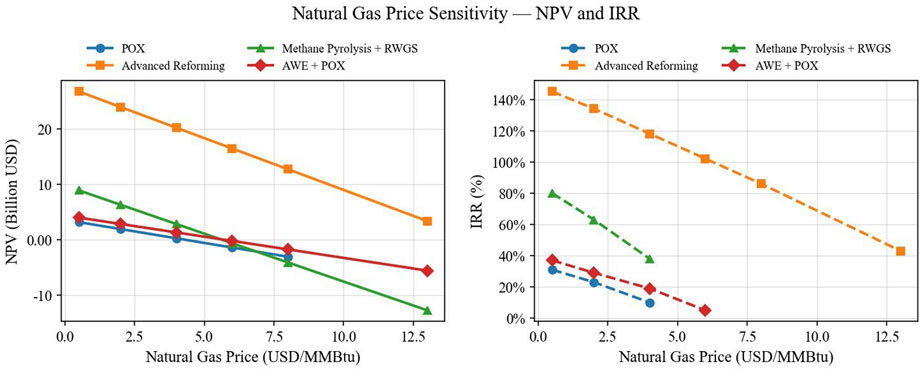
Figure 8. The effect of Natural Gas Price on NPV and IRR for all scenarios (Methanol price = 350 $/ton, carbon credit price is 30$/ton, and medium CAPEX).
3.7.3 CAPEX sensitivity
The impact of CAPEX uncertainty was explored by varying the total investment between −20% and +30%.
- ARM: NPV decreased from $20.5 B (−20% CAPEX) to $19.6 B (+30% CAPEX), but IRR remained comfortably above 90%/year.
- POx: Was most sensitive to CAPEX overruns, with NPV dropping to negative at +30% CAPEX.
- Pyrolysis + RWGS and AWE-integrated: Showed moderate sensitivity but remained marginally profitable even under high-CAPEX scenarios.
Figure 9 illustrates the relationships between CAPEX and NPV, highlighting the importance of cost containment for capital-intensive retrofits.
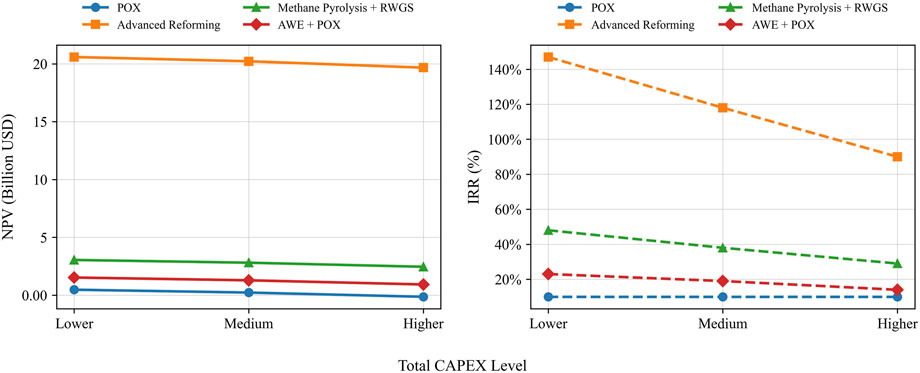
Figure 9. The effect of CAPEX on NPV and IRR for all the scenarios (NG price = 4 $/MMBTU, carbon credit price is 30 $/ton, and methanol price = 350 $/ton).
3.7.4 Credit price sensitivity
Figure 10 illustrates the effect of carbon-credit price (30–100 $/ton CO2e) on project NPV for the three low-carbon configurations. Although NPV increases approximately linearly across this range, the magnitude of change is much smaller than that observed for methanol price, natural-gas price, or CAPEX variations.
- ARM: NPV increases from 20.18 B$ → 20.27 B$, with a slope of +12.9 M$ per +10 $/ton (+0.45% relative to the base NPV). IRR increases from 118%/year at 30 $/ton to 123%/year at 100 $/ton (+5 percentage points, +4.2% relative improvement).
- Methane Pyrolysis + RWGS: NPV improves from 2.77 B$ to 2.87 B$ (slope ≈ +14.3 M$ per +10 $/ton, +3.6%), while IRR strengthens from 38%/year to 49%/year (+11 points, +29% relative gain).
- AWE-integrated: Shows the smallest response, with NPV increasing by +0.03 B$ (+2.4%) and IRR rising from 19%/year to 22%/year (+3 points, +16% relative increase).
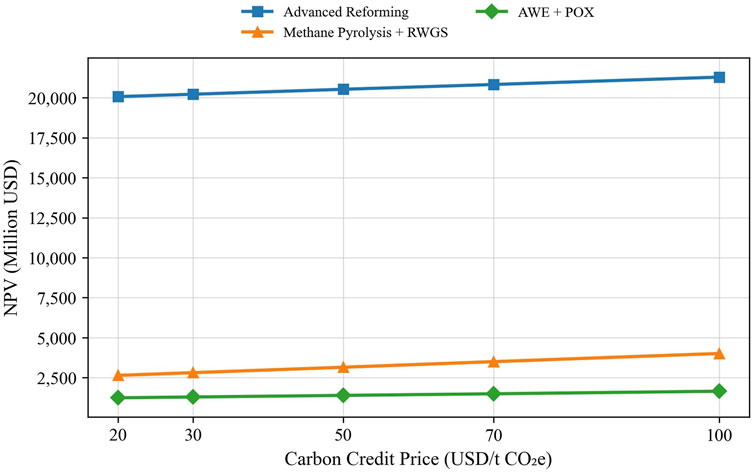
Figure 10. The effect of Carbon Credit Price on NPV for all the scenarios (NG price = 4 $/MMBTU, CAPEX = medium, and methanol price = 350 $/ton).
While these IRR improvements, particularly for Pyrolysis + RWGS, are non-trivial, they remain secondary effects compared with methanol or natural-gas price sensitivities. Carbon-credit monetization should therefore be viewed as a supplementary upside rather than a primary economic driver and does not alter the overall ranking of the scenarios.
3.7.5 Tornado plot and ranking of parameters
To provide an integrated perspective on the relative importance of the economic drivers discussed in Sections 3.7.1–3.7.4, a Tornado plot was developed for the ARM scenario (Figure 11). This chart consolidates the one-way sensitivity results for MWCNT selling price, natural gas price, methanol price, and carbon-credit price, ranking them by their impact on NPV.
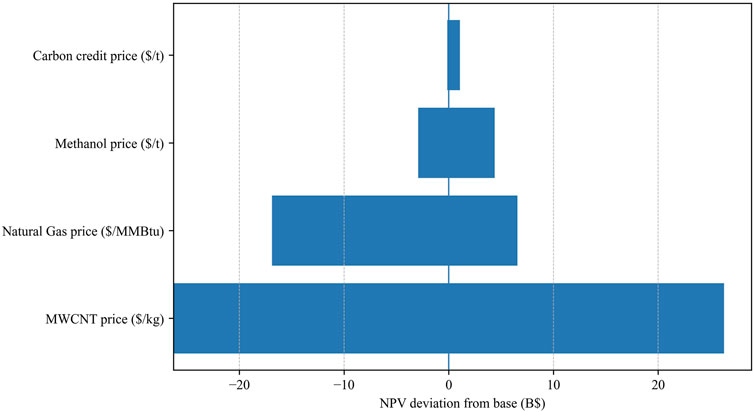
Figure 11. Tornado plot of NPV sensitivity for advanced reforming of methane.
The results clearly show that MWCNT selling price is the dominant value lever, with NPV varying by ≈ ± $25 B over the range of 0–50 $/kg. The natural gas price is the next most influential factor, shifting NPV by approximately ± $13 B across a 0.5–8 $/MMBtu range, confirming its role as the largest operational risk driver. Methanol price ranks third, producing a more moderate NPV swing of ± $3.6 B across 210–560 $/ton, while carbon-credit price exhibits only a marginal effect, changing NPV by <$0.1 B between 30 and 100 $/ton CO2e.
By consolidating these sensitivities in a single visual, the Tornado plot highlights where risk management and value-capture strategies should focus: (i) maximizing MWCNT co-product valorization through quality improvement and secure off-take agreements, and (ii) stabilizing natural gas supply costs through long-term contracts or hedging mechanisms. Methanol price and carbon-credit revenues, while not negligible, play secondary roles in overall project profitability.
A Tornado plot was generated for the methane pyrolysis + RWGS configuration to compare the influence of natural gas price, methanol price, solid-carbon price, and electricity price on NPV (Figure 12).
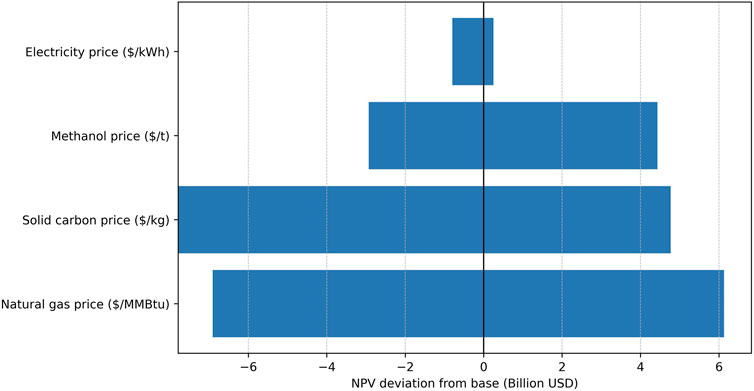
Figure 12. Tornado plot of NPV sensitivity for methane pyrolysis + RWGS scenario.
The results show that natural gas price is the single most influential parameter, shifting NPV by approximately ± $6 B across the 0.5–8 $/MMBtu range. Solid-carbon prices rank second, contributing approximately ± $4.5 B over 0–3 $/Kg, highlighting the importance of co-product valorization for improving project resilience. The methanol price exerts a somewhat lower but still significant effect, with NPV varying by approximately ± $3.6 B between 210 and 560 $/ton. The electricity price has the smallest impact, producing an NPV swing of only approximately ± $0.6 B across 0.02–0.10 $/kWh.
This ranking confirms that the economic performance of the methane pyrolysis route is primarily governed by feedstock cost and methanol market conditions, with carbon by-product revenues providing a meaningful secondary buffer and electricity costs exerting only a minor effect on overall project profitability.
For the AWE-integrated POx configuration, the Tornado plot (Figure 13) ranks the key economic drivers around the base-case NPV ($1.27 B). The methanol price is the most influential parameter, followed by the natural gas price, both of which exhibit substantial swings that define the project’s profitability envelope. The carbon-credit price has only a minor effect, and the AWE electricity price is the least impactful, shifting the NPV only slightly within the tested range.
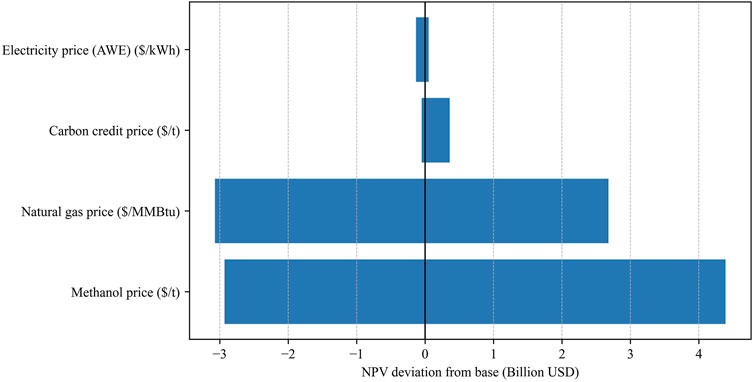
Figure 13. Tornado plot of NPV sensitivity for AWE-integrated POx scenario.
These results confirm that the economics of the AWE + POx pathway are dominated by product and feedstock markets, making methanol offtake agreements and long-term gas supply contracts the highest-priority levers for risk management. Electricity-related improvements, while beneficial, are more effectively pursued through efficiency gains and higher electrolyzer capacity utilization rather than relying solely on price reductions.
Recent techno-economic assessments that couple methane pyrolysis with electrolytic hydrogen production have demonstrated additional flexibility and carbon-conversion benefits under hybrid configurations (Nogueira Nakashima et al., 2025), supporting the potential extension of the present framework to such integrated systems.
3.8 Integrated techno-economic and environmental insights
Across the four pathways, environmental performance and economics diverge, defining clear deployment niches. The ARM and Methane Pyrolysis + RWGS routes achieve net-negative CI (≈−0.47 and −0.57 kg CO2/kg MeOH, respectively), while AWE-integrated POx lowers CI to ∼0.10 kg CO2/kg MeOH versus ∼0.40 kg CO2/kg MeOH for the POx baseline. These outcomes reflect, respectively, (i) CO2 utilization with solid-carbon formation in ARM, (ii) high CO2 demand in RWGS following methane pyrolysis, and (iii) elimination of WGS plus renewable H2/O2 supplementation in AWE-integrated POx.
From a profitability perspective, ARM dominates due to MWCNT co-product revenues (NPV ≈ $20.18 B, IRR ∼118%/year), followed by Methane Pyrolysis + RWGS (NPV ≈ $2.77 B, IRR ∼38%/year) and AWE-integrated POx (NPV ≈ $1.27 B, IRR ∼19%/year); the POx baseline is marginally positive (NPV ≈ $0.23 B). Notably, AWE-integrated also delivers the lowest LCOF (∼296 $/ton) under base assumptions, indicating strong operational cost efficiency when low-cost renewables are available.
Considering the cost of CO2 reduction (MAC), AWE-integrated exhibits a negative abatement cost (−137 $/ton CO2e)—a “no-regrets” option—while Methane Pyrolysis + RWGS is lower-cost than ARM (273 vs. ∼340 $/ton CO2e). Thus, while ARM offers the highest absolute returns, the AWE-integrated pathway is the most economically attractive per-ton abatement option.
The sensitivity synthesis (Section 3.7.5) clarifies where risk management matters. For ARM, economics are primarily driven by natural gas and MWCNT prices, with the methanol price secondary and carbon credit effects negligible over the tested range. Methane Pyrolysis + RWGS is most exposed to natural gas and methanol prices; electricity is a smaller lever. AWE-integrated POx is governed by methanol and natural gas prices, while electrolyzer electricity price is a second-order driver within 0.02–0.08 $/kWh. These patterns are consistent with the one-way sensitivities in Sections 3.7.1–3.7.4.
3.8.1 Implications for strategy
- Regions with cheap, reliable renewables (and bankable PPAs) should prioritize AWE-integrated POx to capture negative MAC and low LCOF benefits.
- Sites with robust specialty-carbon markets (credible MWCNT monetization) can unlock ARM’s superior NPV, provided natural gas price risk is hedged and MWCNT offtakes/quality are secured.
- Methane Pyrolysis + RWGS suits contexts with abundant CO2 supply and the ability to valorize or manage solid carbon; economics remain sensitive to natural gas and methanol markets.
Risk-mitigation priorities from the Tornado rankings are: (i) long-term gas supply contracts or hedges, (ii) methanol offtake agreements or price floors, (iii) for ARM, MWCNT offtake and quality assurance to stabilize co-product revenue, and (iv) for AWE, strengthening PPA terms and improving electrolyzer efficiency and capacity factor (stack performance, availability), which can outweigh modest power-price swings within the tested range.
To visualize interactions and breakeven regions, two-way sensitivity surfaces complement the one-way analyses and Tornado rankings. Figure 14 presents an AWE-integrated POx market map (NPV versus natural gas (0.5–8 $/MMBtu) and methanol (210–560 $/ton)), with the NPV = 0 isocline delineating viability domains: positive NPV is achieved at lower gas prices and/or higher methanol prices, reinforcing that product and feedstock markets dominate this pathway. Together, these surfaces provide a compact deployment guide, indicating where each pathway is economically favored and which market conditions most threaten value.
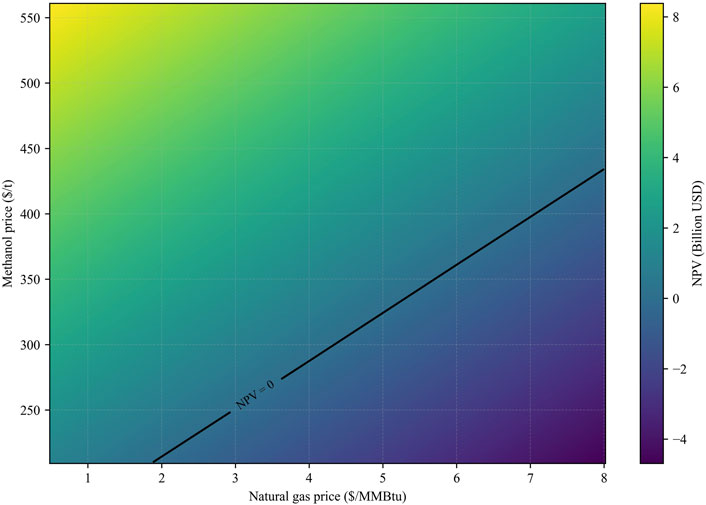
Figure 14. NPV Surface for AWE-integrated scenario as a Function of Natural Gas and Methanol Prices.
Finally, to strengthen decision confidence, we recommend complementing the one-way sensitivities with two-way (interaction) sweeps among dominant drivers (e.g., NG × methanol, MWCNT × NG, AWE electricity × capacity factor) and a Monte Carlo analysis to quantify probability distributions for NPV and MAC under market uncertainty, aligning the assessment with standard investment-risk practice while preserving the clear qualitative rankings established here.
Overall, the comparative assessment reveals that all three decarbonization pathways (ARM, methane pyrolysis + RWGS, and AWE-integrated POx) achieve significant emission reductions relative to the baseline POx case but differ markedly in economic resilience. ARM delivers the highest profitability through MWCNTs co-product valorization, methane pyrolysis + RWGS achieves the deepest CO2 mitigation, and AWE integration provides the most cost-stable decarbonization route when renewable electricity is available. These results collectively emphasize that the most suitable pathway depends on regional energy costs, carbon market conditions, and alignment with technology readiness.
4 Conclusion
This study presents a comprehensive comparative assessment of four hydrogen production pathways for natural gas–based methanol synthesis, incorporating process simulations, techno-economic evaluations, and sensitivity analyses. The findings demonstrate that deep decarbonization of methanol production is technically feasible, with two of the pathways (ARM and Methane Pyrolysis + RWGS) achieving net-negative carbon intensity and AWE-integrated reducing CI by 75% relative to the POx baseline.
ARM offers the highest economic potential, driven by the monetization of MWCNT co-products and CO2 utilization, achieving a net-negative carbon intensity and attractive financial returns (NPV ≈ $20.2 B, IRR >100%/year). The methane pyrolysis + RWGS configuration achieves the deepest CO2 reduction (approximately −0.57 kg CO2/kg MeOH), but it is more susceptible to fluctuations in natural gas and electricity prices. AWE-integrated POx, while less capital-intensive, offers the lowest LCOE (∼296 $/ton) and a negative MAC (≈−137 $/ton CO2e), making it a cost-saving “no-regrets” decarbonization pathway when low-cost renewable electricity is available.
Collectively, these results indicate that technology selection should be guided by local energy costs, CO2 availability, and co-product market conditions. ARM is favored where specialty-carbon markets exist, and natural gas costs can be hedged; Methane Pyrolysis + RWGS is suited to sites with abundant low-cost CO2 and the ability to valorize or safely manage solid carbon; AWE-integrated should be prioritized in regions with cheap, reliable renewables and bankable PPAs.
Risk-management priorities, as revealed by Tornado and interaction analyses, include (i) long-term gas procurement strategies or hedges, (ii) methanol offtake agreements or price floors, (iii) MWCNT offtake, and quality assurance to stabilize ARM revenues, and (iv) optimization of electrolyzer efficiency and capacity factor for AWE deployment. Although catalyst costs were included in the OPEX calculations, ARM may incur additional expenses associated with sacrificial catalyst turnover and solid-carbon separation, which could moderate the very high NPV estimated for this pathway. Two-way sensitivity surfaces further delineate breakeven regions for NPV as a function of gas and methanol prices, offering a compact decision-support tool for investors.
Future work should investigate the impact of varying methanol purity across the different scenarios. In this study, the methanol synthesis loop was fixed for comparability, which resulted in differences in water generation and thus product purity. Incorporating optimized separation units (e.g., additional distillation or adjusted flash conditions) would enable quantification of purity effects on process performance, product quality, and economic outcomes. Beyond purity optimization, further extensions should include full LCA, stochastic market simulations, and Monte Carlo analysis to capture uncertainty and provide more robust investment guidance.
Data availability statement
The original contributions presented in the study are included in the article/Supplementary Material, further inquiries can be directed to the corresponding author.
Author contributions
RK: Conceptualization, Formal Analysis, Data curation, Investigation, Methodology, Writing – original draft. TM: Conceptualization, Data curation, Formal Analysis, Methodology, Writing – original draft, Visualization. MC: Methodology, Investigation, Writing – review and editing. ME-H: Methodology, Writing – review and editing. NE: Writing – review and editing, Conceptualization, Formal Analysis, Funding acquisition, Project administration, Resources, Supervision.
Funding
The authors declare that financial support was received for the research and/or publication of this article. This work was made possible by Hamad bin Khalifa University (HBKU) and Qatar Foundation Bridge Funding for CARGEN Technology.
Conflict of interest
The authors have a patent related to CARGEN technology.
Generative AI statement
The authors declare that no Generative AI was used in the creation of this manuscript.
Any alternative text (alt text) provided alongside figures in this article has been generated by Frontiers with the support of artificial intelligence and reasonable efforts have been made to ensure accuracy, including review by the authors wherever possible. If you identify any issues, please contact us.
Publisher’s note
All claims expressed in this article are solely those of the authors and do not necessarily represent those of their affiliated organizations, or those of the publisher, the editors and the reviewers. Any product that may be evaluated in this article, or claim that may be made by its manufacturer, is not guaranteed or endorsed by the publisher.
References
Aasberg-Petersen, K., Nielsen, C. S., Dybkjaer, I., and Perregaard, J. (2008). Large scale methanol production from natural gas.
Abdelkarim, Y., Musa, T., Challiwala, M. S., Katbeh, T., Choudhury, H., El-Halwagi, M., et al. (2025). Retrofitting low carbon aviation fuels processes from natural gas to renewables energy-based systems. Greenh. Gases Sci. Technol. 15, 601–614. doi:10.1002/ghg.2340
Al-Aboosi, A. F., Al-Aboosi, F. Y., El-Halwagi, M., and Zhan, W. (2025). Low carbon methanol production through electrification and decarbonization. Gas Sci. Eng. 136, 205562. doi:10.1016/j.jgsce.2025.205562
Alsuhaibani, A. S., Afzal, S., Challiwala, M., Elbashir, N. O., and El-Halwagi, M. M. (2020). The impact of the development of catalyst and reaction system of the methanol synthesis stage on the overall profitability of the entire plant: a techno-economic study. Catal. Today 343, 191–198. doi:10.1016/j.cattod.2019.03.070
ARPA-E (2022). Co-synthesis of hydrogen and high-value carbon products from methane pyrolysis: annual merit review presentation. Adv. Res. Proj. Agency – Energy (ARPA-E).
Ataya, Z., Challiwala, M., Ibrahim, G., Choudhury, H. A., El-Halwagi, M. M., and Elbashir, N. O. (2023). Decarbonizing the gas-to-liquid (GTL) process using an advanced reforming of methane process. ACS Eng. Au 4, 99–111. doi:10.1021/acsengineeringau.3c00025
Bisotti, F., Fedeli, M., Prifti, K., Galeazzi, A., Dell’Angelo, A., and Manenti, F. (2022). Impact of kinetic models on methanol synthesis reactor predictions: in silico assessment and comparison with industrial data. Ind. Eng. Chem. Res. 61, 2206–2226. doi:10.1021/acs.iecr.1c04476
BusinessAnalytiq (2025). Carbon black price index. Available online at: https://businessanalytiq.com/procurementanalytics/index/carbon-black-price-index/?utm (accessed September 12, 25).
C2ES (2024). Methane pyrolysis: the case for cleaner hydrogen with existing infrastructure. Cent. Clim. Energy Solutions.
Cameli, F., Delikonstantis, E., Kourou, A., Rosa, V., Van Geem, K. M., and Stefanidis, G. D. (2024). Conceptual process design and technoeconomic analysis of an e-Methanol plant with direct air-captured CO2 and electrolytic H2. Energy Fuels 38, 3251–3261. doi:10.1021/acs.energyfuels.3c04147
Carbon Credits (2025). A guide to compliance carbon credit markets. Available online at: https://carboncredits.com/a-guide-to-compliance-carbon-credit-markets/ (accessed September 12, 2025).
Challiwala, M. S., Choudhury, H. A., Wang, D., El-Halwagi, M. M., Weitz, E., and Elbashir, N. O. (2021). A novel CO2 utilization technology for the synergistic co-production of multi-walled carbon nanotubes and syngas. Sci. Rep. 11, 1417. doi:10.1038/s41598-021-80986-2
Challiwala, M. S., Ibrahim, G., Choudhury, H. A., and Elbashir, N. O. (2024). Scaling up the advanced dry reforming of methane (DRM) reactor system for multi-walled carbon nanotubes and syngas production: an experimental and modeling study. Chem. Eng. Process. - Process Intensif. 197, 109693. doi:10.1016/j.cep.2024.109693
Deka, T. J., Osman, A. I., Baruah, D. C., and Rooney, D. W. (2022). Methanol fuel production, utilization, and techno-economy: a review. Environ. Chem. Lett. doi:10.1007/s10311-022-01485-y
Ehlinger, V. M., Gabriel, K. J., Noureldin, M. M. B., and El-Halwagi, M. M. (2014). Process design and integration of shale gas to methanol. ACS Sustain Chem. Eng. 2, 30–37. doi:10.1021/sc400185b
Fasihi, M., and Breyer, C. (2024). Global production potential of green methanol based on variable renewable electricity. Energy Environ. Sci. 17, 3503–3522. doi:10.1039/d3ee02951d
GlobalPetrolPrices (2025). Qatar electricity prices. Available online at: https://www.globalpetrolprices.com/Qatar/electricity_prices/?utm_.
Hernández-Pérez, L. G., Villicaña-García, E., Cansino-Loeza, B., Alsuhaibani, A. S., El-Halwagi, M. M., and Ponce-Ortega, J. M. (2022). Incorporating the occupational health in the optimization for the methanol process. J. Loss Prev. Process Ind. 74, 104660. doi:10.1016/j.jlp.2021.104660
Ibrahim, G., Challiwala, M. S., Choudhury, H. A., Zang, G., El-Halwagi, M. M., and Elbashir, N. O. (2023). CO2Fix: an approach to assess CO2 fixation potential of CCU reaction pathways. Comput. Chem. Eng. 178, 108398. doi:10.1016/j.compchemeng.2023.108398
Ibrahim, G., Challiwala, M. S., Zang, G., El-Halwagi, M. M., and Elbashir, N. O. (2024). A novel framework for the economic and sustainability assessment of carbon capture and utilization technologies. Gas Sci. Eng. 131, 205462. doi:10.1016/j.jgsce.2024.205462
IEA (2020). Energy technology perspectives 2020: special report on carbon capture utilization and storage.
INSCX (2025). Multi-walled carbon nanotubes (MWCNTs). Available online at: https://inscx.com/shop/product-category/carbons/mwcnt/ (accessed September 12, 2025).
IPCC (2001). Climate change 2001: mitigation. Contribution of working group III to the third assessment report of the intergovernmental panel on climate change. Cambridge University Press.
ISCC (2024). ISCC EU 205-1 renewable fuels of non-biological origin (RFNBO) and recycled carbon fuels (RCF) greenhouse gas emissions.
ISO (2006). ISO 14040:2006: environmental management — life cycle assessment — principles and framework.
Khallaghi, N., Ghiami, S., Jeswani, H., Nabavi, S. A., and Anthony, E. J. (2024). Blue hydrogen production through partial oxidation: a techno-economic and life cycle assessment. Int. J. Energy Res. 2024, 3249514. doi:10.1155/er/3249514
Khojasteh-Salkuyeh, Y., Ashrafi, O., Mostafavi, E., and Navarri, P. (2023). CO2 utilization for methanol production; Optimal pathways with minimum GHG reduction cost. Can. J. Chem. Eng. 101, 5446–5459. doi:10.1002/cjce.24975
Krishnakumar, A., Singh, H., Cangelose, B., and Vinson, V. (2024). From waste to value: how carbon dioxide can be transformed into modern life’s essential products.
Liu, J., Zhao, J., Wei, H., Zhu, Q., and Li, Y. (2024). Comparative environmental assessment of methanol production technologies: a cradle-to-gate life cycle analysis. Energy Convers. Manag. 302, 118128. doi:10.1016/j.enconman.2024.118128
Markets Insider (2025). Natural gas price today | Natural gas spot price chart | Live price of natural gas per ounce Available online at: https://markets.businessinsider.com/commodities/natural-gas-price (accessed September 12, 25).
Markets and Markets (2023). Methanol Market by Feedstock (Natural Gas, Coal), Derivative (Formaldehyde, MTO/MTP, Gasoline, MTBE, MMA, Acetic Acid, DME, Biodiesel), Sub-Derivative, End-use Industry (Automotive, Construction, Electronics), and Region - Global Forecasts to 2030. Available online at: https://www.marketsandmarkets.com/Market-Reports/methanol-market-425.html. (Accessed September 12, 2023)
Methanex (2025). Pricing. Methanex. Available online at: https://www.methanex.com/our-products/about-methanol/pricing/ (accessed September 9, 2025).
Mion, A., Galli, F., Mocellin, P., Guffanti, S., and Pauletto, G. (2022). Electrified methane reforming decarbonises methanol synthesis. J. CO2 Util. 58, 101911. doi:10.1016/j.jcou.2022.101911
Moghaddam, A. L., Hejazi, S., Fattahi, M., Kibria, M. G., Thomson, M. J., AlEisa, R., et al. (2025). Methane pyrolysis for hydrogen production: navigating the path to a net zero future. Energy Environ. Sci. 18, 2747–2790. doi:10.1039/D4EE06191H
Nogueira Nakashima, R., Nami, H., Nemati, A., Butera, G., de Oliveira Junior, S., Vang Hendriksen, P., et al. (2025). Techno-economic evaluation of pyrolysis and electrolysis integration for methanol and char production. Renew. Energy 242, 122388. doi:10.1016/j.renene.2025.122388
Parkinson, B., Matthews, J. W., McConnaughy, T. B., Upham, D. C., and McFarland, E. W. (2017). Techno-economic analysis of methane pyrolysis in molten metals: decarbonizing natural gas. Chem. Eng. Technol. 40, 1022–1030. doi:10.1002/ceat.201600414
Parkinson, B., Balcombe, P., Speirs, J. F., Hawkes, A. D., and Hellgardt, K. (2019). Levelized cost of CO2 mitigation from hydrogen production routes. Energy Environ. Sci. 12, 19–40. doi:10.1039/C8EE02079E
Pérez-Fortes, M., Schöneberger, J. C., Boulamanti, A., and Tzimas, E. (2016). Methanol synthesis using captured CO2 as raw material: techno-economic and environmental assessment. Appl. Energy 161, 718–732. doi:10.1016/j.apenergy.2015.07.067
Poling, B. E., Prausnitz, J. M., and O’Connell, J. P. (2020). Properties of gases and liquids. Fifth Edition. McGraw-Hill Education.
Rafiq, A., Farooq, A., and Gheewala, S. H. (2024). Life cycle assessment of CO2-Based and conventional methanol production pathways in Thailand. Processes 12, 1868. doi:10.3390/pr12091868
Rohani, H., Sudiiarova, G., Lyth, S. M., and Badakhsh, A. (2025). Recent advances in electrified methane pyrolysis technologies for turquoise hydrogen production. Energies (Basel) 18, 2393. doi:10.3390/en18092393
Sánchez-Bastardo, N., Schlögl, R., and Ruland, H. (2021). Methane pyrolysis for zero-emission hydrogen production: a potential bridge technology from fossil fuels to a renewable and sustainable hydrogen economy. Ind. Eng. Chem. Res. 60, 11855–11881. doi:10.1021/acs.iecr.1c01679
Savva, C., Michailidou, A. V., Tournaviti, M., Vlachokostas, C., and Makris, D. O. (2025). Closing the loop between life cycle assessment and low-carbon methanol: a critical review for a sustainable energy alternative. Fuel 390, 134633. doi:10.1016/j.fuel.2025.134633
Schlömer, S., Bruckner, T., Fulton, L., Hertwich Austria, E., McKinnon, A. U., Perczyk, D., et al. (2014). III ANNEX technology-specific cost and performance parameters editor: lead authors: contributing authors: to the fifth assessment report of the intergovernmental panel on climate change edenhofer technology-specific cost and performance parameters annex III AIII contents.
Scomazzon, M., Barbera, E., and Bezzo, F. (2024). Alternative sustainable routes to methanol production: techno-economic and environmental assessment. J. Environ. Chem. Eng. 12, 112674. doi:10.1016/j.jece.2024.112674
Slome, S. (2024). Making money out of thin air: valorizing the oxygen byproduct of green hydrogen production Available online at: https://www.nexanteca.com/blog/making-money-out-thin-air-valorizing-oxygen-byproduct-green-hydrogen-production (accessed September 12, 25).
Sisco Research Laboratories (2025). MWCNT Type 13 – Carbon Nanotubes, Multi-walled, Length 10–30 µm, OD 30–50 nm, 95%. Available online at: https://www.srlchem.com/product/details/4164/28658/mwcnt-type-13-carbon-nanotubes-multi-walled-length-10-30m-od-30-50nm-95. (Accessed September 12, 2025)
Su, X., Wang, R., Li, X., Araby, S., Kuan, H.-C., Naeem, M., et al. (2022). A comparative study of polymer nanocomposites containing multi-walled carbon nanotubes and graphene nanoplatelets. Nano Mater. Sci. 4, 185–204. doi:10.1016/j.nanoms.2021.08.003
Taylor, S. (2012). The ranking of negative-cost emissions reduction measures. Energy Policy 46, 152–163. doi:10.1016/j.enpol.2012.05.071
Tejeda, V. A., and El-Halwagi, M. (2025). “Federal regulations at the interface of hydrogen production pathways: economic analysis of gray,” in Blue, and green hydrogen. 2025 spring meeting and 21st global congress on process safety.
Tovar, M., Ruschhaupt, P., Lazenby, J., Schubert, F., Koen, A., Siméon, M., et al. (2025). Methodology for assessing greenhouse gas emissions savings from low-carbon fuels.
Towler, G., and Sinnott, R. (2021). Chemical engineering design. Elsevier. doi:10.1016/C2019-0-02025-0
Turton, R., Bailie, R., Whiting, W., Shaeiwitz, J., and Bhattacharyya, D. (2012). Analysis, synthesis, and design of chemical processes. Upper Saddle River, NJ: Prentice Hall.
Ullah, A., Hashim, N. A., Rabuni, M. F., and Mohd Junaidi, M. U. (2023). A review on methanol as a clean energy carrier: roles of zeolite in improving production efficiency. Energies (Basel) 16, 1482. doi:10.3390/en16031482
U.S. EIA (2023). Natural gas prices and trends. Washington, D.C. U.S: Energy Information Administration.
Usman, M., and Daud, W. M. A. W. (2015). Recent advances in the methanol synthesis via methane reforming processes. RSC Adv. 5, 21945–21972. doi:10.1039/C4RA15625K
Keywords: methanol synthesis, low-carbon hydrogen, techno-economic analysis, CO2 utilization, methane pyrolysis, advanced reforming, electrolytic hydrogen, syngas production
Citation: Khawaja R, Musa T, Challiwala MS, El-Halwagi MM and Elbashir NO (2025) Decarbonizing methanol synthesis via low-carbon hydrogen: process simulation and techno-economic insights. Front. Chem. Eng. 7:1717905. doi: 10.3389/fceng.2025.1717905
Received: 02 October 2025; Accepted: 03 November 2025;
Published: 02 December 2025.
Edited by:
Fengqi You, Cornell University, United StatesReviewed by:
José María Ponce-Ortega, Michoacana University of San Nicolás de Hidalgo, MexicoJuan Gabriel Segovia Hernandez, University of Guanajuato, Mexico
Copyright © 2025 Khawaja, Musa, Challiwala, El-Halwagi and Elbashir. This is an open-access article distributed under the terms of the Creative Commons Attribution License (CC BY). The use, distribution or reproduction in other forums is permitted, provided the original author(s) and the copyright owner(s) are credited and that the original publication in this journal is cited, in accordance with accepted academic practice. No use, distribution or reproduction is permitted which does not comply with these terms.
*Correspondence: Nimir O. Elbashir, bmVsYWJzaGlyQGhia3UuZWR1LnFh