 Luis Isern
 Sue Impey1
 Danijela Milosevic
 Jose Luis Endrino
- 1School of Aerospace, Transport and Manufacturing (SATM), Cranfield University, Cranfield, Bedfordshire, United Kingdom
- 2SIFCO ASC, Independence, OH, United States
- 3Universidad Loyola Andalucia, Dos Hermanas, Sevilla, Spain
This work evaluates the influence of plating variables on the morphology, composition homogeneity, and abrasive wear resistance of metal matrix composite coatings. A set of Ni/Cr3C2 coatings were brush plated onto steel coupons modifying two key variables: particle size and brush material. Compositional maps of unprecedented detail have been produced and analysed statistically to enhance understanding of composition distribution. The use of Abbott-Firestone curves to analyse surface morphology enabled the evaluation of valley and peak features. The coating differences highlighted by previous analyses have been compared with their behaviour in abrasive environments, simulated using Taber testing. Moreover, coupling Taber testing with partial compositional maps at different wear stages enabled monitoring of coating wear evolution. This methodology has revealed the importance of particle sedimentation during plating, which increased particle incorporation in the composite coating but also increased composition heterogeneity. The smaller 1.7 μm carbides and abrasive brushes produced coatings with more homogeneous morphologies, higher particle content, and increased resistance against abrasive wear, with a 60% reduction in material loss in comparison to the standard nickel coatings.
1 Introduction
Metal matrix composite (MMC) coatings are composed of two phases: a continuous metallic phase (matrix), and a dispersed phase made up of particles of any material, from ceramics to metals and polymers. MMC coatings are successfully deposited by many processes, including thermal spraying (cold spray (Lee et al., 2017), plasma (Venkatesh et al., 2017), high-velocity oxy-fuel (Tillmann et al., 2017)), chemical vapour deposition (Abidin et al., 2015), laser cladding (Weng et al., 2015), and electroplating. From these, electroplating stands out due to its relative simplicity and low cost. In this technique, the metal to be deposited is dissolved in an aqueous solution in ionic form and the particles are added in suspension. The reduction of the metal is triggered by the application of a potential difference between the part to be coated (the cathode) and the anode. Metal reduction traps the solid particles suspended in the solution, forcing the co-deposition of the dispersed phase. The deposition of MMC coatings using different electroplating variants have been recently reported, including tank electroplating (Garcia, Fransaer, and Celis, 2001; Gül et al., 2012) and electroless (Spyrellis et al., 2009), jet electroplating (Wang et al., 2012) and brush electroplating (Xiao and Clouser, 2010; Isern et al., 2017; Isern et al., 2018). The use of brush electroplating allows for portability, making it possible to perform on-site repairs and selective deposition on large parts, avoiding disassembly. Portability stems from the use of a brush, an anode wrapped in a non-conductive fabric that holds both the plating solution and prevents direct contact between electrodes when the brush is in contact with the cathode, allowing for ion exchange and electric circulation. By bringing the solution and anode to the part to be plated, there is no need to disassemble and submerge the part in a tank. In general, the current density used in brush plating is higher, it requires smaller solution quantities and deposition rates can be faster (x10) than in tank electroplating (Clarke, 1999; Vanek, 2010; Vanek, 2002).
For any electroplating variant used, the properties of the composite coating are a combination of the properties of the materials that constitute the two phases. Different combinations of materials can increase wear resistance (Isern et al., 2018), hardness (Boonyongmaneerat et al., 2009), and corrosion protection (Ghanbari and Mahboubi, 2011); decrease friction (Wang et al., 2012); and produce hydrophobicity (Iacovetta et al., 2015), among other effects. As expected, the use of diverse carbides can produce coatings with improved mechanical properties. The most commonly researched carbide in MMC coatings is silicon carbide (SiC), usually combined with a nickel matrix. Several studies have compared the properties of a SiC-based composite coating with the properties of the matrix and found improved hardness and wear resistance (Garcia et al., 2001; Aal et al., 2006; Gül et al., 2012). Tungsten carbide (WC) is also a widely researched option for MMCs and has been shown to improve coating hardness (Boonyongmaneerat et al., 2009) and wear resistance (Surender et al., 2004; Benea et al., 2015; Isern et al., 2018). The study of chromium carbide (Cr3C2) is much more limited, but it has also been reported to produce similar effects: harder (Zheng et al., 2017), more wear-resistant coatings (Xiao and Clouser, 2010).
The size of particles used is also an important factor for the final properties of the coating. The published literature covers a wide range of particle sizes spanning three orders of magnitude, from a particle diameter of 21 nm (Spyrellis et al., 2009) up to 15 μm (Aal et al., 2006). The lower end of this range is composed of nano-powders and sub-micron powders (<1,000 nm), whose small particle size presents both advantages and inconveniences. On the positive side, the size is small enough to produce colloidal suspensions (Lu and Kessler, 2006). Therefore, to produce an effective suspension, flocculants and surfactants can be used instead of relying on mechanical stirring, although this can have a negative impact on the chemistry of the plating solution and hinder deposition. The main negative aspect of nano-powders is the health risk they may present, as preliminary results point to the adverse effects of nano-powders to human health when they are released into the environment. When the particles are inhaled, they can produce moderate toxicity and inflammatory responses in epithelium lining airways (Geiser et al., 2017). Moving up in size, most MMC coating research concentrates on the range of 0.1–10 μm. Within this range, there are not many studies that report the effects of different particle sizes MMC coatings, although initial results indicate that smaller particle size can increase particle content (Garcia et al., 2001; Boonyongmaneerat et al., 2009), hardness (Boonyongmaneerat et al., 2009), and wear resistance (Garcia et al., 2001) of the composites.
The purpose of this article is threefold: i) to demonstrate the feasibility of depositing Ni/Cr3C2 composite coatings by brush electroplating and ii) to study the influence of using different brush materials and iii) to stablish a correlation between different particle sizes, the composition, morphology and wear resistance of the composite coating. The particle sizes studied are kept above the micron level to minimise health risks. Compositional mapping and statistical analysis are used to explain the distribution of particles in the coating. The coating morphology is quantified by the measurement of the surface roughness using traditional parameters and Abbott-Firestone curves. The wear resistance is quantified by applying the Taber abrasive test (based on material weight loss), and the evolution of the coating composition is monitored during the test. Figure 1.
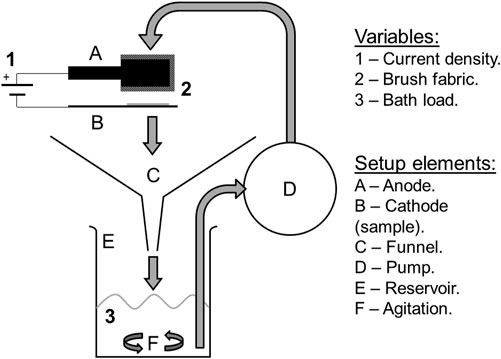
FIGURE 1. Diagram of the plating setup designed to circulate particles. The traditional design lacks the funnel (C) and the agitation (F), and the reservoir (E) is usually a shallow tray. Originally published in (Isern et al., 2017).
2 Experimental methods
2.1 Equipment for brush electroplating
Three pieces of equipment are needed for brush electroplating:
• Rectifier. A Plating Electronic pe 2010 (Germany) was used to produce and control a potential differential.
• Brush, or fabric-covered anode. Inert anodes made of an iridium-oxide-coated titanium mesh and graphite blocks were covered by different fabrics described in section 2.2.
• Solution collection and circulation system. A setup designed to improve MMC plating performance originally described and tested elsewhere (Isern et al., 2017) was used. It incorporates a funnel to collect solution spills, a reservoir that uses magnetic stirring to keep the particles in suspension, and a peristaltic pump for circulation, as illustrated in Figure 1
2.2 Materials and conditions of brush electroplating
Mild steel S275JR (from BS EN 10025–2: 2011) coupons were used as substrates. The brush fabrics are three different 3M Scotch-Brite™ grades, which will be referred through the paper by their colours: two abrasive ones, red (type 7,447) and purple (2,565) (Industrial abrasives: 3M United States, 2022a; Industrial Abrasives: 3M United States, 2022b); and one non-abrasive, white (7,445) (3M). Ni and Ni/Cr3C2 coatings were deposited onto the substrates following the SIFCO Process® for nickel deposition detailed in Table 1, which includes three stages: i) surface preparation to remove surface defects and improve coating adhesion, which consists of surface cleaning, etching and desmutting and all using white 3M fabric; ii) pre-plating, which involves depositing a 2 μm-thick nickel strike layer to improve adhesion using white 3 M fabric; and iii) plating of the final Nickel High Speed coating, with samples produced with all three different fabrics to evaluate their impact on material structure and properties. The composite coating was produced using the Nickel High-Speed plating solution with suspended Cr3C2 in powder form in a concentration of 50 g/L (average diameter 1.7 and 6 μm, supplied by Advanced Materials, US, morphology can be seen in Figure 2). Coating thickness was controlled by measuring the total current applied with the rectifier’s Ampere-hour counter at a current density of 75 A/dm2. For the as-deposited characterisation, coatings 100 µm-thick were deposited on an area of 50 × 50 mm2 and coatings 50 µm-thick were deposited on an area of 75 × 50 mm2. For Taber abrasive testing, coatings 50 µm-thick were deposited on an area of 100 × 100 mm2.
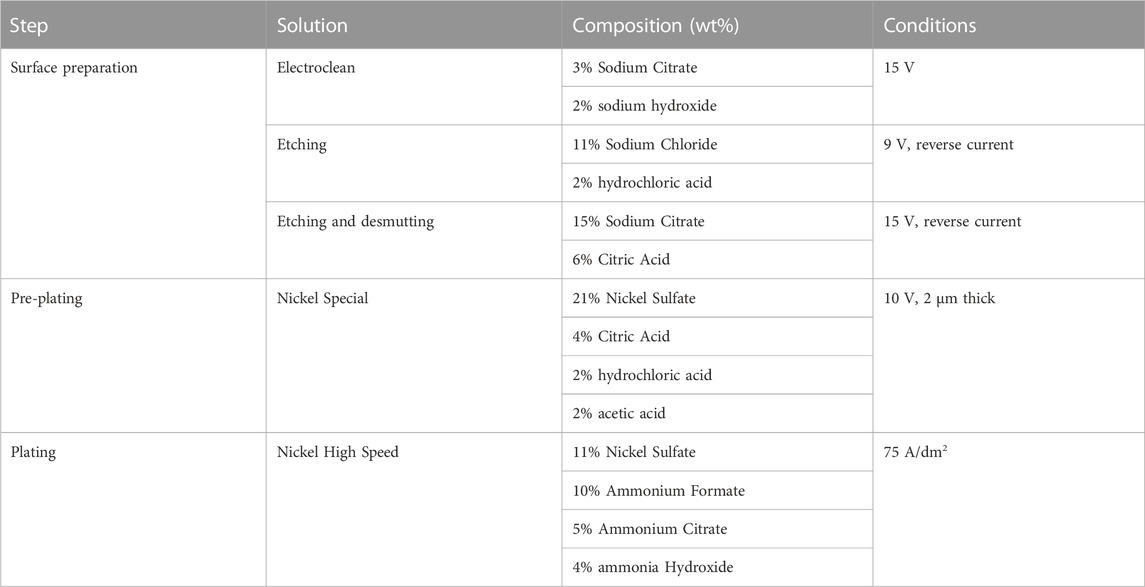
TABLE 1. Solutions and plating conditions used in the brush plating process and manufactured by SIFCO ASC (US). All products are commercially available under the stated name.
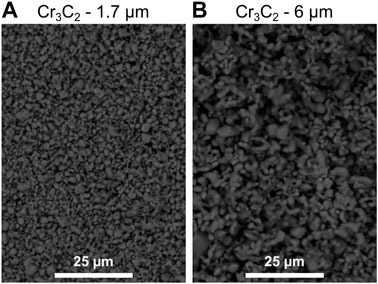
FIGURE 2. SEM images using back-scattered detector of as-received angular Cr2C3 particles used as dispersed phase in two average diameter sizes: (A) of 1.7 μm, and (B) 6 μm.
Samples have been named according to the particle size and brush material used during deposition, as follows: pB-n; e.g.,: 1P-2.
• The first character (p) is a number that corresponds to the particle size, 1 for 1.7 μm average diameter and 6 for 6 μm.
• The second character (B) is a letter that corresponds to the fabric material of the brush: P for purple, R for red and W for white.
• The last character (n) is a number that identifies the individual sample within that combination of plating parameters, either 1 or 2.
2.3 Coating characterisation
Coating morphology was observed using secondary and back-scattered electrons detectors (20 kV, working distance 8–18 mm) in an FEI XL30 ESEM scanning electron microscope; surface images were also taken with an optical digital microscope Keyence VHX5000, and complemented with optical microscopy of cross-sections captured using an ME600 Eclipse Nikon reflective optical microscope and Leica Application Suite software.
Compositional maps of the entire 100 × 100 mm2 coating surfaces were performed by X-ray fluorescence (XRF) using a Fischer instrument model XDL-Z; the composition values given are in chromium atomic percentage (at% of Cr), with the remainder corresponding to nickel. For each sample, a compositional map of the plated surface was built from 32 randomly selected points measured with XRF, including 8 points on the future wear track location. The locations were selected at least 10 mm away from the edge of the samples to avoid the edge effect of the coating, and the measurements took place before the abrasive wear test.
The crystalline structure of the coatings was determined on a Philips D5005 X-ray diffractometer (XRD) using with Cu Kα radiation at 20 kV. Obtained XRD patterns were compared with the PDF-2 database of the International Centre for Diffraction Data (ICDD).
Roughness was evaluated from 3D mapping areas of 640x480 µm2 from the coatings surface using an Olympus Lext OLS3100 confocal laser scanning microscope. The profiles of the 3D reconstructed area were used to calculate the average roughness Ra parameter and to produce Abbott-Firestone (A-F) curves. A-F curves are defined as the cumulative probability density function of the height of each profile and were constructed and analysed according to BS EN ISO 13565-2-1998. The standard defines 6 parameters that characterise the curve: material portion of the peaks (Mr1), reduced peak height (Rpk), area of the peaks (A1), material portion of the valleys (Mr2), reduced valley height (Rvk), area of the valleys (A2). Those parameters quantify and allow comparing the abundance and relative size of peak and valley areas of the profiles.
A Taber Abraser Model 5134 (ASTM D4060-10, 2010) was used for Taber testing to quantify the wear resistance of the coatings. The samples were attached to a rotating disk and abraded by two CS 17 abrasive wheels, each under a 1 kg load. Samples were weighed every 1,000 cycles (full rotations of the disk) and the abrasive wheels re-ground with abrasive silicon carbide paper grade 150 for 100 cycles. The partial Taber Wear Index (TWI) can be calculated as the average weight difference in mg before (wi) and after (wf) abrasion over 1,000 cycles and dividing it by the number of cycles (n = 1,000), as described in Eq. (1).
The total duration of the test was 15,000 cycles, and the final TWI of each sample was calculated by averaging the partial TWI between cycles 7,000 to 15,000, as the partial TWIs of the initial cycles is strongly affected by the surface roughness.
3 Results
This section is split into three parts corresponding to composition, morphology, and abrasive wear resistance of the coatings. The samples evaluated are the same in all tests.
3.1 Compositional mapping
X-ray fluorescence (XRF) composition measurements (spot diameter ≈1 mm) were taken in 32 points across the surface of the sample (100 x 100 mm2) to produce compositional maps. The maps revealed a particle distribution with radial symmetry, with chromium content gradually increasing from the centre outwards (see examples in Figure 3). This was attributed to solution pooling, which was noticed on chromium-rich areas on all samples during plating. Pooling is a natural effect derived from plating areas much larger than the anode surface area, as the solution flow slows down as it travels away from the outlet, eventually stopping and pooling up. A statistical analysis of the composition measurements (Table 2) show that only 4 samples follow a normal distribution (R2 value >0.90), all of which present a gradual change in composition as illustrated by (Figure 3B). Most samples, 8 of 12, do not follow a normal distribution and display abrupt changes in composition as illustrated by Figures 3A,C,D. Those 8 samples fit a bimodal distribution instead, i.e., the measurements from each sample can be split into two distinct normal populations with different averages and coefficients of variation. The locations of the measurements belonging to the population with higher average Cr content are all localised on the areas where pooling was observed, indicating that solution pooling and particle sedimentation have a significant effect on the coating composition. The statistical analysis also shows that the split between the two populations is not even. The Cr-rich population has fewer number of points for all samples, with half of them having less than 6 points out of 32.
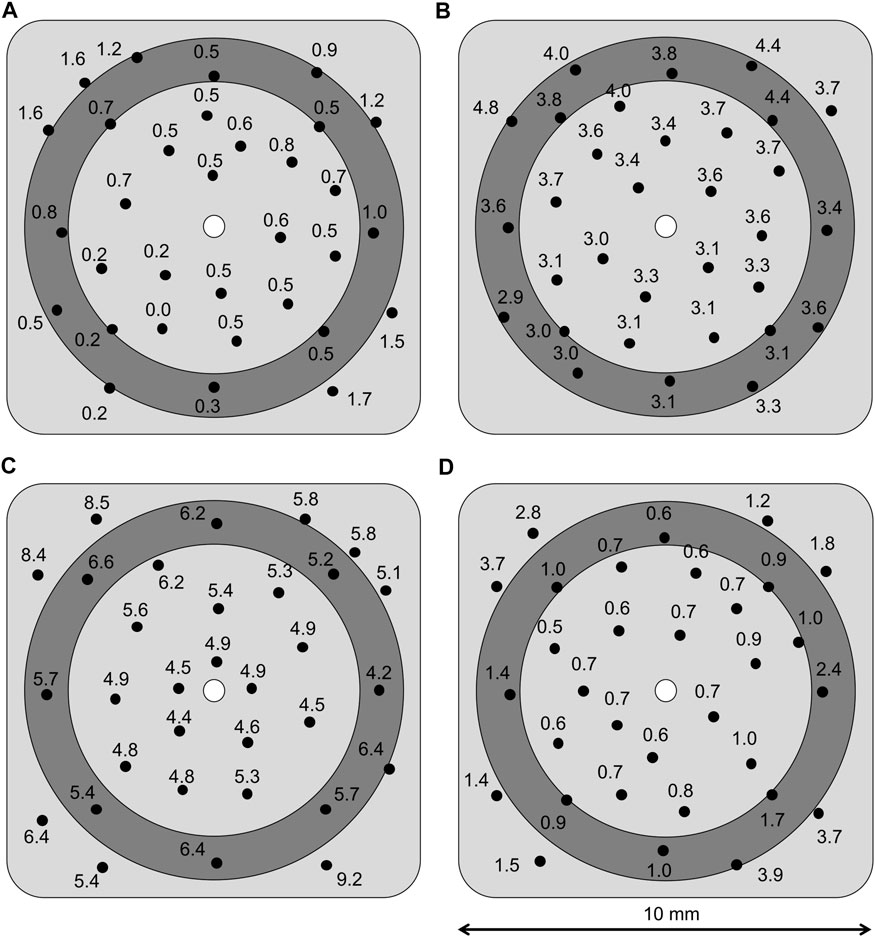
FIGURE 3. Compositional maps of coatings produced with different brush materials and particle size: (A) red brush and 6 μm particles, (B) white brush and 1.7 μm particles, (C) purple brush and 1.7 μm particles, and (D) purple brush and 6 μm particles. The dark grey ring represents the area worn during the Taber abrasive test. Values are at% of Cr, assuming the rest Ni.
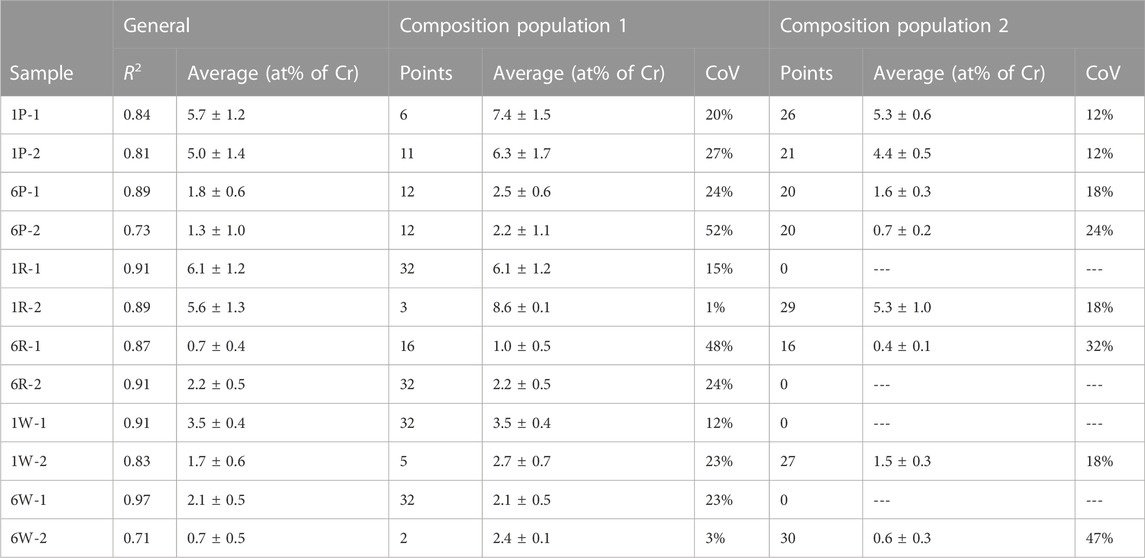
TABLE 2. Average chromium composition and coefficient of variation (CoV) of the produced composite coatings. For each sample, the general average is given together with the R2 of the fitted curve of the inverse of the standard normal cumulative distribution (if R2 > 0.90 it is considered a normal distribution), as well as the details of the two normal populations that compose the measurements.
Regarding the particle size, composite coatings that incorporate the smaller carbide particles have significantly higher Cr content (Figure 3C) than in the case of the larger carbide size (Figure 3D), as can be seen in Table 2. Regarding the brush material, both abrasive fabrics (red and purple) incorporate similar quantities of particles, whereas the white, non-abrasive fabric shows significantly less chromium content than the abrasive ones. Nonetheless, white fabric produced less variation in particle distribution and its coatings either followed a normal distribution or had very few points (<6) belonging to the highest Cr-content population.
Finally, X-ray diffraction (XRD) analysis was performed on the as-received powders and nickel and composite samples to confirm the crystalline structure of the deposits (Figure 4). The pure nickel coatings show three main peaks at 44.6°, 51.9°, 76.5°, corresponding to planes (1,1,1), (2,0,0) and (2,2,0) from a face-centered cubic (FCC) nickel structure (PDF 04–0850 from ICDD database). In contrast, the patterns corresponding to the as-received carbide powders are more complex. For both carbide sizes, the final microstructure appears to be a mix of orthorhombic Cr3C2 (PDF 35–0804) and body-centred cubic (BCC) chromium (PDF 06–0694), with a predominance of the carbide on the 6 μm-sized powder, but more abundance of chromium for the smaller-sized powder. No other chemical composition of chromium carbide was detected. The patterns obtained from the composite coatings show the combination of the Ni and Cr3C2 structures. The dominant microstructure is nickel most probably because of its larger presence; no changes in relative intensity or full-width at half-maximum (FWHM) of peaks were registered. Additionally, small 39.0° and 40.2° peaks were detected, corresponding to the orthorhombic Cr3C2, slightly shifted towards smaller angle values in the case of the larger carbide particles.
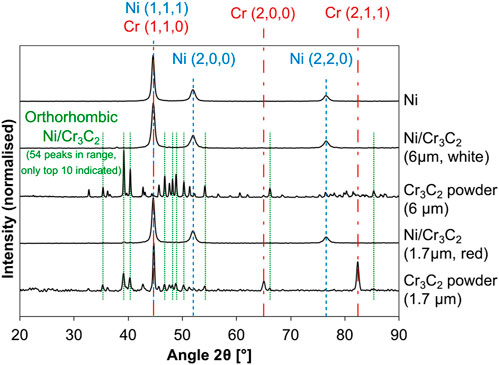
FIGURE 4. XRD patterns of Ni and Ni/Cr3C2 coatings corresponding to Ni and Ni/Cr3C2 coatings, and as-received Cr3C2 particles of different diameters. Coloured lines highlight peaks corresponding FCC Ni in blue, and BCC Cr in green from ICDD database; orthorhombic Cr3C2 is not included as it presents dozens of peaks (PDF 04–0850, 06–0694, 35–0804 respectively).
3.2 Coating morphology
The morphology of the coatings was observed by scanning electron microscopy (SEM) images of the surface and optical images of the cross-sections, while roughness was quantified using confocal laser scanning microscopy (CLSM) to obtain the roughness parameter corresponding to the arithmetical mean deviation of the profile (Ra) and Abbott-Firestone (A-F) curves. Surface SEM images are grouped by fabric material: purple (Figure 5), red (Figure 6), and white (Figure 7). Each set is subdivided according to the size of the particles incorporated and is compared with pure nickel coatings deposited with the same conditions when possible. It can be seen that: i) nickel globular structure is present in all surfaces, ii) no carbide particles are distinguishable on the surface, iii) the effect of the fabric material is similar for both Ni and Ni/Cr3C2 coatings, and iv) particle size has a great influence on surface morphology.
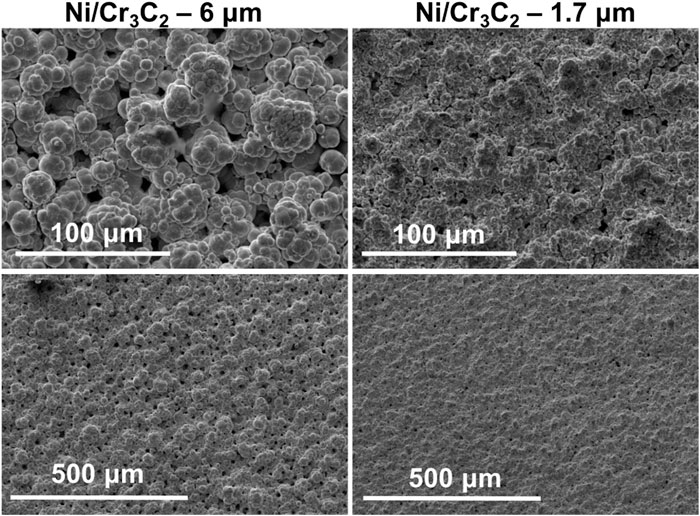
FIGURE 5. Surface of Ni/Cr3C2 coatings produced with purple abrasive brush and current density of 75 A/dm2. SEM secondary electrons detector images, each column corresponding to two different magnifications of the same sample. Samples have been produced with a particle size of 6 μm (left) and 1.7 μm (right).
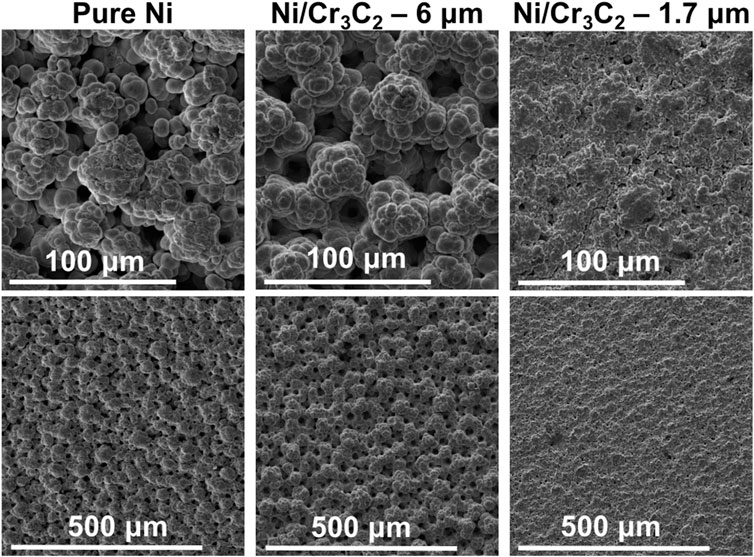
FIGURE 6. Surface of coatings produced with red abrasive brush and a current density of 75 A/dm2. SEM secondary electrons detector images, each column corresponds to two different magnifications of the same sample. Samples are Ni (left), and Ni/Cr3C2 produced with carbide particles of diameter 6 μm (centre) and 1.7 μm (right).
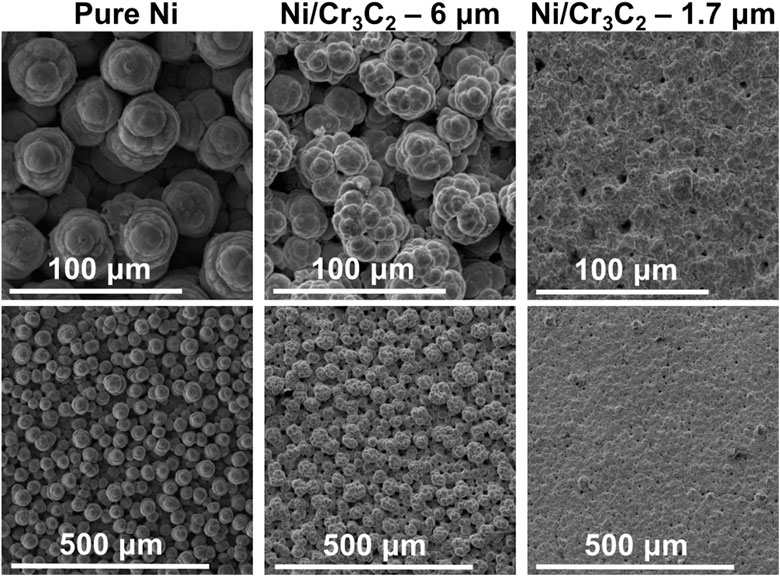
FIGURE 7. Surface of coatings produced with white non-abrasive brush and a current density of 75 A/dm2. SEM secondary electrons detector images, each column corresponding to two different magnifications of the same sample. Samples are Ni (left), and Ni/Cr3C2 produced with carbide particles of diameter 6 μm (centre) and 1.7 μm (right).
The general effect of fabric material depends on the particle size used in the composite deposition. For large particles (6 μm), the effect of fabric material in composite coatings is the same than for Ni coatings: non-abrasive fabrics produce rougher surfaces with more defined and spherical globules, whereas abrasive brush materials produce a smoother surface finishing with smaller globules. Also, the morphology of both nickel and composite coatings is similar, especially in the case of abrasive brushes. For small particles (1.7 μm), the morphology of composite coatings does not depend on the fabric material: all coatings are smoother and have smaller and less defined globules than Ni/Cr3C2 coatings that incorporate 6 μm particles, and do not resemble the texture of pure nickel coatings.
Cross-section images reveal the carbide particles entrapped by the metal matrix. Most particles seem to be coated with a thin film of nickel, although this is difficult to confirm for the smaller particle size, which explains why the surface images were not identifying any particles. The coatings that include the 1.7 μm carbide particles have a visibly larger density of particles than coatings with 6 μm particles (Figure 8). The quantification of the surface roughness is in good agreement with the observations made using SEM surface images (Table 3). Among the coatings deposited using large-sized particles, Ra measurements back up both the similarity in morphology within coatings produced with abrasive brushes and also the difference with non-abrasive fabrics, which look rougher and also have higher Ra values than the previous ones. The presence of pores in relatively smooth coatings (produced with 1.7 μm particles) is reflected by the A-F curves having A2 values (area of valleys) slightly larger than A1 (area of peaks). However, in general, the variation in the calculated A-F parameters is large, which makes its analysis challenging.
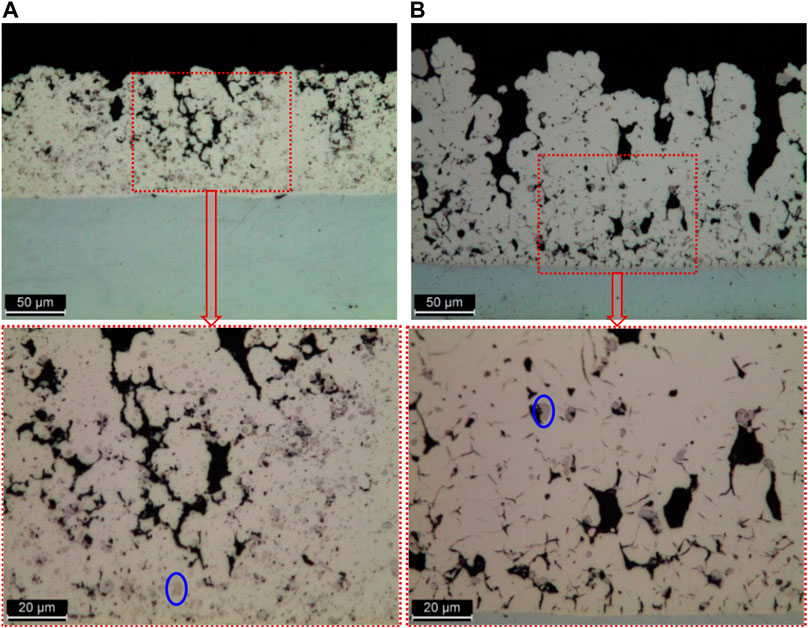
FIGURE 8. Optical microscopy images from Ni/Cr3C2 coatings cross-section with zoomed-in detail (below). The coatings were produced using: (A) purple brush and 1.7 μm particles, (B) purple brush and 6 μm particles. Carbide particles are visible, an example has been circled in blue on both zoomed-in sections.
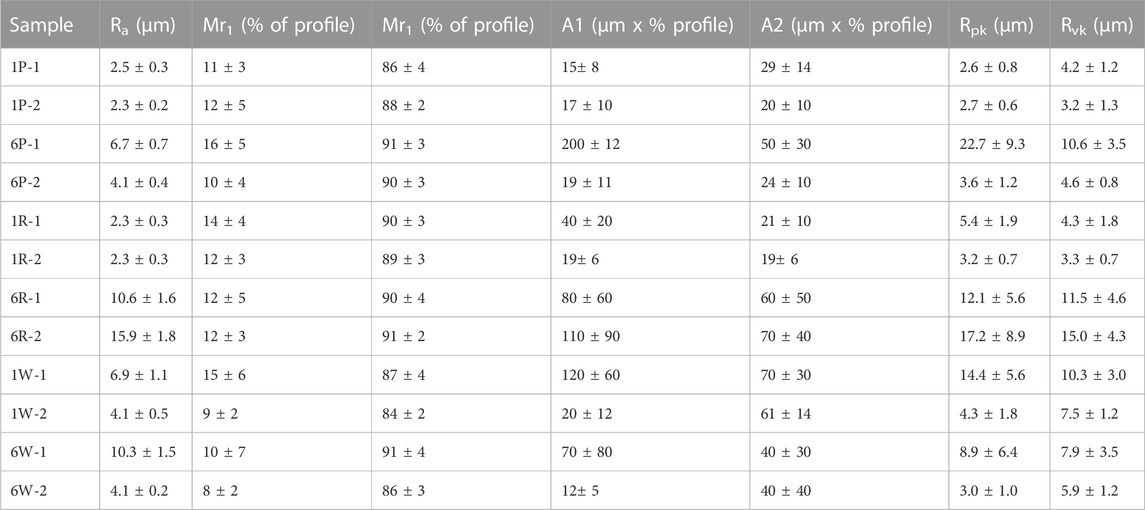
TABLE 3. Topographical characterisation of surface roughness of Ni/Cr3C2 composite coatings using the arithmetical mean deviation of the profile (Ra) and Abbott-Firestone curves.
3.3 Abrasive wear
The Taber abrasive test was performed on all samples for 15,000 cycles, and the Taber Wear Index (TWI) was calculated. The TWI is a measure of material loss, thus lower TWI values correspond to materials with higher wear resistance. Results can be found in Table 4 and are compared with other reference systems. None of the samples presented signs of coating failure or delamination. A typical coating surface after Taber testing is much smoother than as-deposited (Figure 9), having lost the higher points and kept the valleys. Initially, the surfaces did not show any carbides as corroborated in previous SEM images (Figure 5; Figures 6, 7), but the worn track exposes some carbides (Figure 9).
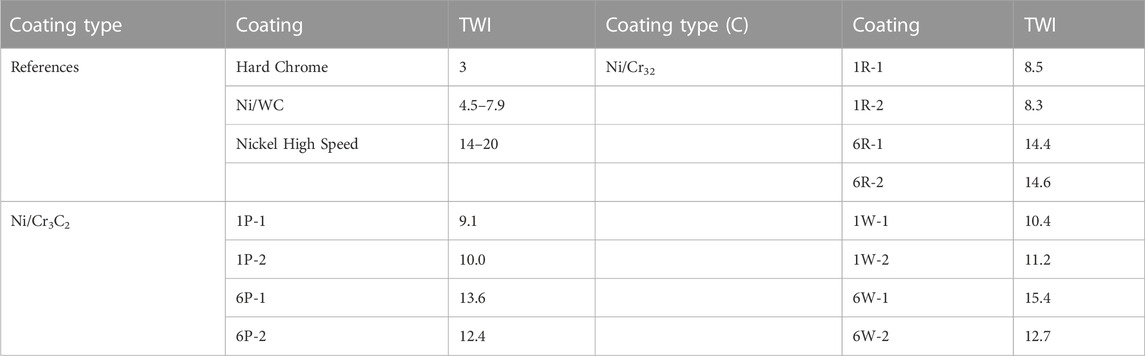
TABLE 4. Taber Wear Index (TWI) obtained for diverse samples: reference coatings, such as tank plated hard chrome and brush plated SIFCO products, and Ni/Cr3C2 coatings.
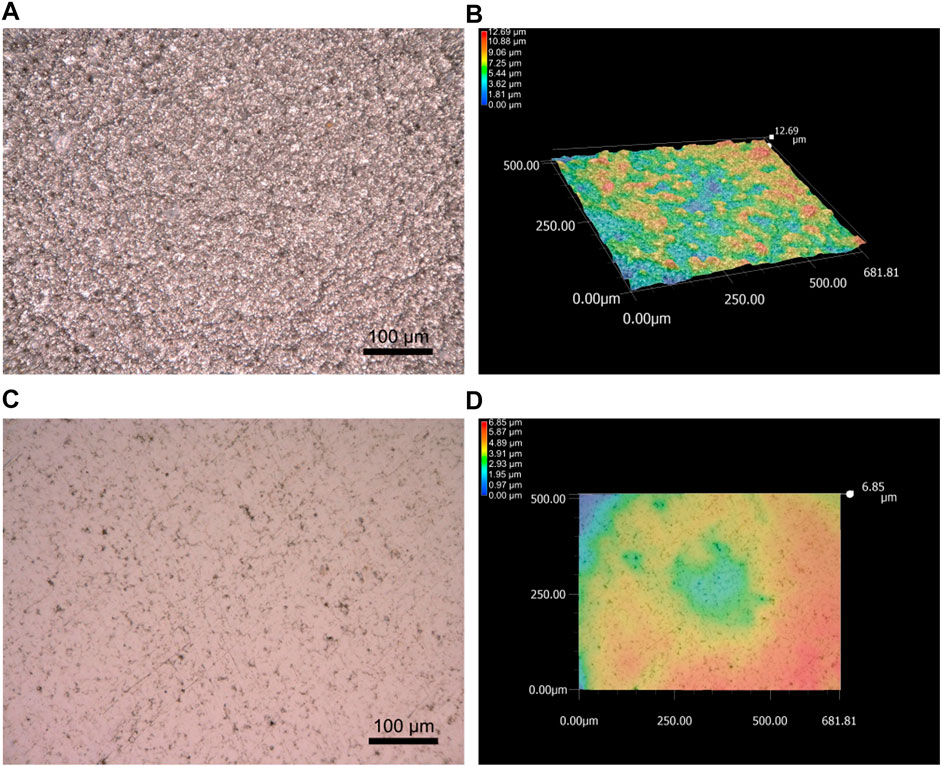
FIGURE 9. Digital optical image (merge of several optical images at different focal points) of the surface of sample 1R-2 as deposited (A), with corresponding surface topography (B). Digital optical image of sample 1R-2 after 15,000 cycles of Taber wear testing (C), with corresponding surface topography (D).
The addition of chromium carbide improves the wear resistance of the coatings, as Cr3C2 composite coatings have a lower TWI range (8–15) than the Nickel High-Speed coatings (14–20). The effect of fabric material is not entirely clear due to the small number of sample repetitions and some overlap between the TWI range of abrasive (8.3–14.6) and non-abrasive brushes (10.4–15.4), but the abrasive fabrics show potential to produce the most wear resistant coatings on account of showing the 4 lowest TWI results. The particle size of the carbides plays a significant role in wear resistance: the material loss of 1.7 μm carbides is 12–42 wt% lower than for the 6 μm carbides. Regarding the composition of the coatings, Figure 10 shows that lower TWI values (higher wear resistance) generally (R2 ∼ 0.70) correspond to samples with increased particle content.
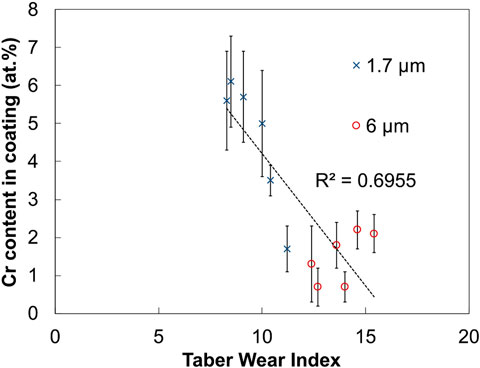
FIGURE 10. Plot of the chromium content of Ni/Cr3C2 samples against Taber Wear Index. The two particle sizes used are distinguished.
For each sample, the composition of four locations within the worn ring was monitored during the abrasive wear test every 5,000 cycles. The results showed a continuous increase in chromium content with the number of cycles in all cases. Table 5 compiles the average composition per sample before and after the whole test (15,000 cycles). The amount chromium present on the worn surfaces increased between 21% and 67% at the end of the test, with the higher increases corresponding to samples with lower chromium contents. The only exception is sample 6W-2, which has the lowest chromium content and registered a decrease in Cr content that lies within the measuring error.
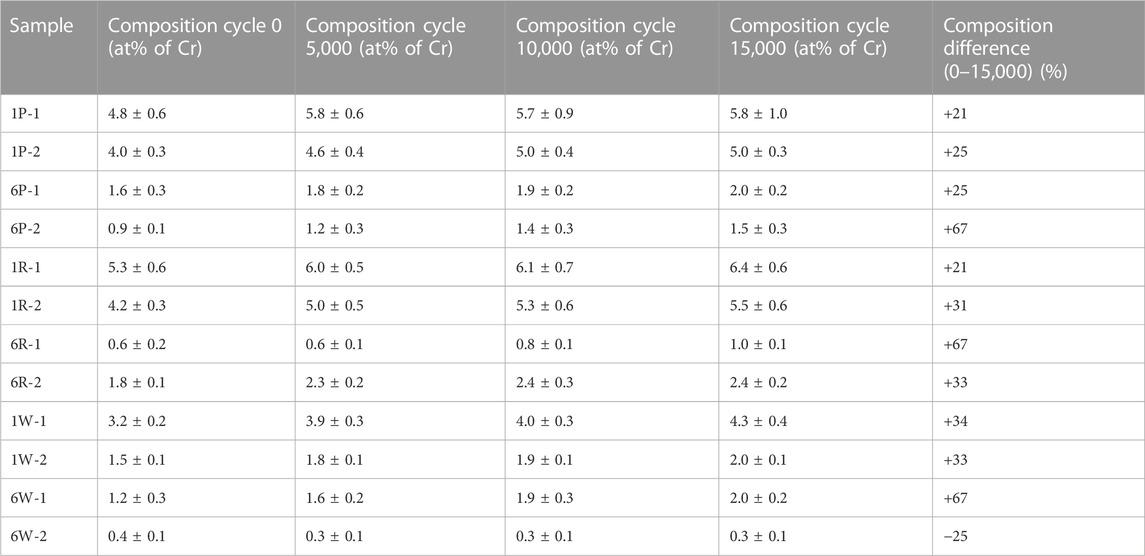
TABLE 5. Average chromium content in four positions of the worn area before and after the Taber test.
4 Discussion
The composition homogeneity of the coatings has been studied by combining statistical analysis with mappings. The distribution of Cr3C2 particles was tracked by analysing the chromium content on different locations and creating maps, which show radial symmetry and a Cr content increase from the centre to the edges of the samples. The increase is abrupt in the outer areas of some samples, so much that the composition of two-thirds of the samples failed to pass the normality test. Those samples follow bimodal distributions, with two different populations following normal distributions with different averages and standard deviations. The population with lower average Cr content correspond to central areas of the sample surface, subject to fast solution flow. The population with higher average Cr content is located on the edges of the samples, where solution flow is slower and pooling was observed during brush plating. Normal distributions are associated with natural processes and random variables, so the presence of a bimodal distribution on a sample indicates the presence of two simultaneous processes: regular particle incorporation and particle incorporation aided by sedimentation. We postulate that particle sedimentation in areas that experience pooling is modifying the particle incorporation mechanisms, given that there are more carbides on the sample surface ready to be incorporated into the composite. Sedimentation increases the number of particles incorporated, but is difficult to control and creates a larger variance on composition values; this can be seen on the higher coefficients of variation of the higher-average population. The same radial composition distribution was reported in a previous work on Ni/WC (Isern et al., 2018), which also observed bimodal distributions within each sample, and described the same effects of higher particle content, higher variance due to sedimentation on the sample edges. No other reports on composition distribution have been found for electroplated metal matrix composite (MMC) coatings on the literature.
A common feature observed in all Ni/Cr3C2 coatings from this work is the deposition of a thin nickel film that envelopes the Cr3C2 particles. This was noticed in SEM and optical surface images, where no carbides are visible despite the use of a back-scattered electrons detector, whereas particles are in the matrix as confirmed by cross-section images; likewise, a film is visible between most particles and pores/voids in cross-section. The same behaviour was previously reported in two previous articles for conductive particles. In the first study, Stappers & Fransaer (Stappers and Fransaer, 2006) proved that a thin nickel layer was developed over graphite particles as soon as they touched the cathode surface, but this did not happen in non-conductive particles. They postulated that conductive particles acquire the cathode potential and are suitable to be coated on their exposed surface, but non-conductive particles need to be engulfed by the matrix growing around them. The observations of WC from a second independent study (Isern et al., 2018) and of Cr3C2 from the present work confirm Stappers & Fransaer’s postulation, as both carbides are relatively good electrical conductors. Moreover, the immediate creation of a nickel film on top of the Cr3C2 particles can partly explain the changes in composition and morphology observed in the Ni/Cr3C2 coatings.
The composition of the Ni/Cr3C2 coatings is much richer in Cr3C2 when smaller-sized particles are incorporated. The same trend has been previously observed for electrically conductive particles like in Ni/WC coatings (Jugovic, Stevanovic, and Maksimovic, 2004; Boonyongmaneerat et al., 2009), whereas studies using non-electrically conductive particles report the opposite trend, for instance when incorporating SiC (Garcia, Fransaer, and Celis, 2001; Garcia et al., 2003), diamond (Zhang et al., 2016), Al2O3 (Sadeghi, 2016), TiO2 (Lampke et al., 2006; Lampke et al., 2006), and PTFE (Matsuda et al., 1994) particles. Therefore, it seems that the conductivity of Cr3C2 is the reason for the preferential incorporation of smaller-sized particles, as the film formation might be favoured by a high surface-to-volume ratio, a smaller surface to cover, and smaller particles are hold in place by thinner films.
The composition of Ni/Cr3C2 coatings was affected by the brush material used, but only for the smaller particle size (1.7 μm). For this particular case, the use of abrasive fabrics produced more carbide-rich composites than non-abrasive fabrics. This behaviour is the opposite of previous findings with Ni/Al (Isern et al., 2017) and Ni/WC (Isern et al., 2018). The difference might be partly explained by the difference in particle size, as both previous reports used particles of diameter 5 and 6 μm. Also, for Ni/Al there are no changes in morphology due to the presence of particles so rough surfaces produced by non-abrasive brushes showed more particle incorporation. Regarding the microstructure of the composites, XRD spectra reveal a mix of the matrix and particle microstructures, in agreement with several previous studies (Boonyongmaneerat et al., 2009; Li et al., 2009; Gül et al., 2012; Isern et al., 2017; Isern et al., 2018; Zheng et al., 2017). The XRD spectrum from the Cr3C2 powders reveals an amount of metallic BCC chromium that ranges from noticeable for the bigger particles to dominating for the smaller-sized powder, which has not been previously reported.
The morphology of the Ni/Cr3C2 coatings is affected by the size of incorporated particles. Both particle sizes produce a globular nickel structure, but smaller particles produce smaller globules, smoother surfaces, and more compacted coatings than larger particles. The film formation over particles mentioned earlier can explain this difference; for the same weight of incorporated particles, smaller size means a larger number of particles and thus more, smaller nickel protuberances, explaining the smaller globular size and the smoother surfaces. Moreover, coatings incorporating smaller particles are richer in Cr3C2, further increasing this effect, whereas the larger-sized Cr3C2 particles would produce a coating morphology half-way between the original nickel and the smoother, smaller-sized Cr3C2-based coatings. The morphology of all Ni/Cr3C2 coatings is less dependent on the brush material used than previous studies on Ni and Ni/Al coatings (Isern et al., 2017) that included a structure zone diagram (SZD) to describe the coating morphology depending on abrasiveness of the brush and current density. For Ni/Cr3C2 coatings, all morphologies seem to be shifted towards the SZD abrasive spectrum, probably due to the loose Cr3C2 particles acting as abrasive particles; the same behaviour was described and explained in the previous Ni/WC report (Isern et al., 2018). The effect is more obvious for the coatings incorporating 1.7 μm Cr3C2 particles (no dependency of morphology with fabric material) than 6 μm, given that for the same weight of Cr3C2 suspended in solution, the quantity of particles abrading the surface is smaller than for 1.7 μm particles, but this effect is still observed when comparing to pure nickel coatings.
The addition of Cr3C2 particles has increased the wear resistance of the coating. The wear mechanism of this composite is the same as the described for Ni/WC in (Isern et al., 2018), where is presented in detail. The smallest-sized particles show the best performance, with a Taber Wear Index (TWI) up to 41% lower than the lowest TWI for pure nickel. This agrees with other studies that compared the mechanical properties of coatings incorporating different particle sizes, such as the electroplated Ni/SiC coatings by Garcia, Fransaer and Celis (Garcia et al., 2001). For the Ni/Cr3C2, the data also points out a correlation between wear resistance and chromium carbide content, which may explain why coatings incorporating smaller particles have better wear resistance, as they are also richer in particles. Other studies on MMCs also found a correlation between particle content and wear resistance (Aal et al., 2006; Li et al., 2009; Gül et al., 2012). The difference on the methods used to assess wear resistance makes any comparisons difficult, except for studies that use the Taber Abrasive test such as the Ni/WC study mentioned before (Isern et al., 2018), as well as a Co/Cr3C2 study by Xiao & Clouser (Xiao and Clouser, 2010). The Ni/WC and Co/Cr3C2 coatings have TWIs of 4.5–7.9 and ∼5, respectively, hence showing slightly better performance than Ni/Cr3C2 coatings with TWI of 8.3 or higher. It is also worth mentioning that the coating with the best performance for both Ni/WC and Ni/Cr3C2 systems was deposited using red abrasive fabric. In the case of Ni/WC, excessive amounts of carbides were detrimental to the performance of the coating and areas with concentrations higher than 21.3 at% of W showed coating failure. This has not occurred in the case of Ni/Cr3C2, as such high concentrations have not been produced. Ni/WC failure was caused by the formation of a coating structure rich in voids and poor in nickel. Based on the knowledge gained in the present paper, the use of ∼1 μm-diameter WC particles may be suggested; in the case of Cr3C2, the structures generated by smaller-sized particles were both richer in carbides and with a smoother, more compact structure, as can be seen in Figure 8. During the Taber abrasive test, four locations of the wear track were monitored per sample, and its composition measured, which has not been reported before to the best of the authors’ knowledge. Most samples showed a significant and continuous increase of the carbide proportion on the coating during the wear test, indicating that nickel is preferentially removed during wear and that carbide particles are incrusted, pushed deeper into the matrix, or else the carbide proportion would either reach a maximum or fluctuate rather than increasing continuously. Evidence of the carbide incrustation was also found in the Ni/WC study (Isern et al., 2018), where images of the worn track show fractured carbides scattered and pressed against the matrix. Because of selective nickel removal and carbide incrustation, the composite coating increases its wear resistance over time, as the exposed surface increases its carbide proportion. This is also reflected when comparing partial TWIs, as partial TWIs of cycles 14,000 to 15,000 are lower than of cycles 7,000 to 8,000 for all samples tested.
5 Conclusion
Ni/Cr3C2 composite coatings were successfully deposited by brush plating. The composition of the coatings presented a radial symmetry, with carbide content increasing from the centre to the edges. The solution experienced slow flow and pooling in the sample edges, leading to particle sedimentation. Therefore, sedimentation influenced particle incorporation mechanisms, increasing the average carbide content by 40%–300% and the coefficient of variation by 28%–125%.
The incorporation of different particle sizes changed the morphology and composition of the coating. The use of smaller-sized particles (1.7 μm) resulted in denser coatings with smoother surfaces and a carbide content up to four times higher than coatings obtained using larger particle sizes (6 µm). The morphology of all coatings incorporating 1.7 μm particles was very similar regardless of the brush material used. For larger carbides, the effect of brush material was more noticeable, as abrasive brushes produced smoother coating surfaces, with higher carbide-content and variability than the non-abrasive brush.
A larger carbide content of the samples significantly increased their wear resistance. Taber testing revealed that the abrasive wear resistance of the composites was up to 41% higher in comparison to Nickel High-Speed coatings. The maximum wear resistance corresponded to coatings produced using an abrasive brush and smaller-sized Cr3C2 particles. Consecutive composition measurements during Taber testing every 5,000 cycles revealed preferential removal of the nickel and incrustation of the remaining carbides on the softer matrix, thus increases in the carbide content resulted in an increased wear resistance.
Data availability statement
The original contributions presented in the study are included in the article/Supplementary Material, further inquiries can be directed to the corresponding author.
Author contributions
LI: Conceptualization, Data curation, Formal Analysis, Investigation, Methodology, Resources, Visualization, Writing–original draft. SI: Conceptualization, Supervision, Writing–review and editing. DM: Data curation, Formal Analysis, Investigation, Methodology, Writing–review and editing. SC: Formal Analysis, Methodology, Supervision, Writing–review and editing. JLE: Conceptualization, Funding acquisition, Resources, Supervision, Writing–review and editing.
Funding
The author(s) declare financial support was received for the research, authorship, and/or publication of this article. The study was performed on the framework of the United Kingdom Industrial Doctorate Scheme between Cranfield and SIFCO ASC. JLE gratefully acknowledges funding from Spanish Ministry of Science (Projects PID2021-128727OB-I00 and TED2021-132752B-I00).
Acknowledgments
The authors appreciate the assistance of Teri Zarnesky from SIFCO ASC in conducting Taber wear tests and monitoring the composition of the worn track. The authors also thank Prof John Nicholls form Cranfield University for his useful suggestions on statistical analysis.
Conflict of interest
The authors declare that the research was conducted in the absence of any commercial or financial relationships that could be construed as a potential conflict of interest.
The author(s) declared that they were an editorial board member of Frontiers, at the time of submission. This had no impact on the peer review process and the final decision.
Publisher’s note
All claims expressed in this article are solely those of the authors and do not necessarily represent those of their affiliated organizations, or those of the publisher, the editors and the reviewers. Any product that may be evaluated in this article, or claim that may be made by its manufacturer, is not guaranteed or endorsed by the publisher.
References
Aal, A. A., Ibrahim, K. M., and Hamid, Z. A. (2006). Enhancement of wear resistance of ductile cast iron by Ni–SiC composite coating. Wear 260 (9–10), 1070–1075. doi:10.1016/j.wear.2005.07.022
Abidin, A. Z., Kozera, R., Höhn, M., Endler, I., Knaut, M., Boczkowska, A., et al. (2015). Preparation and characterization of CVD-TiN-coated carbon fibers for applications in metal matrix composites. Thin Solid Films 589 (August), 479–486. doi:10.1016/j.tsf.2015.06.022
ASTM D4060-10 (2010). Standard test method for abrasion resistance of organic coatings by the taber abraser. West Conshohocken, PA: ASTM International.
Benea, L., Başa, S. B., Dănăilă, E., Caron, N., Raquet, O., Ponthiaux, P., et al. (2015). Fretting and wear behaviors of Ni/Nano-WC composite coatings in dry and wet conditions. Mater. Des. (1980-2015) 65, 550–558. doi:10.1016/j.matdes.2014.09.050
Boonyongmaneerat, Y., Saengkiettiyut, K., Saenapitak, S., and Sangsuk, S. (2009). Effects of WC addition on structure and hardness of electrodeposited Ni–W. Surf. Coatings Technol. 203 (23), 3590–3594. doi:10.1016/j.surfcoat.2009.05.027
Clarke, R. D. (1999). DALIC selective brush plating and anodising. Int. J. Adhesion Adhesives 19 (2–3), 205–207. doi:10.1016/S0143-7496(98)00036-0
Garcia, I., Conde, A., Langelaan, G., Fransaer, J., and Celis, J. P. (2003). Improved corrosion resistance through microstructural modifications induced by codepositing SiC-particles with electrolytic nickel. Corros. Sci. 45 (6), 1173–1189. doi:10.1016/S0010-938X(02)00220-2
Garcia, I., Fransaer, J., and Celis, J. P. (2001). Electrodeposition and sliding wear resistance of nickel composite coatings containing micron and submicron SiC particles. Surf. Coatings Technol. 148 (2–3), 171–178. doi:10.1016/S0257-8972(01)01336-6
Geiser, M., Jeannet, N., Fierz, M., and Burtscher, H. (2017). Evaluating adverse effects of inhaled nanoparticles by realistic in vitro Technology. Nanomaterials 7 (3), 49. doi:10.3390/nano7020049
Ghanbari, S., and Mahboubi, F. (2011). Corrosion resistance of electrodeposited Ni-Al composite coatings on the aluminum substrate. Mater. Des. 32 (4), 1859–1864. doi:10.1016/j.matdes.2010.12.020
Gül, H., Kılıç, F., Uysal, M., Aslan, S., Alp, A., and Akbulut, H. (2012). Effect of particle concentration on the structure and tribological properties of submicron particle SiC reinforced Ni metal matrix composite (MMC) coatings produced by electrodeposition. Appl. Surf. Sci. 258 (10), 4260–4267. doi:10.1016/j.apsusc.2011.12.069
Iacovetta, D., Tam, J., and Erb, U. (2015). Synthesis, structure, and properties of superhydrophobic nickel-PTFE nanocomposite coatings made by electrodeposition. Surf. Coatings Technol. 279, 134–141. doi:10.1016/j.surfcoat.2015.08.022
Industrial Abrasives: 3M United States (2022a). Scotch-BriteTM hand pad 7445. Avaliable at: https://www.3m.com/3M/en_US/p/d/b40066283/ (Accessed April 17, 2022).
Industrial Abrasives: 3M United States (2022b). Scotch-BriteTM hand pad 7447. Avaliable at: https://www.3m.com/3M/en_US/p/d/b40071750/ (Accessed April 17, 2022).
Isern, L., Impey, S., Almond, H., Clouser, S. J., and Endrino, J. L. (2017). Structure zone diagram and particle incorporation of nickel brush plated composite coatings. Sci. Rep. 7, 44561. doi:10.1038/srep44561
Isern, L., Impey, S., Clouser, S. J., Milosevic, D., and Endrino, J. L. (2018). Particle distribution, film formation and wear performance of brush plated Ni/WC. J. Electrochem. Soc. 165 (165), D402–D410. doi:10.1149/2.1161809jes
Jugović, B., Stevanović, J., and Maksimović, M. (2004). Electrochemically deposited Ni + WC composite coatings obtained under constant and pulsating current regimes. J. Appl. Electrochem. 34, 175–179. doi:10.1023/b:jach.0000009955.53325.ad
Lampke, Th., Leopold, A., Dietrich, D., Alisch, G., and Wielage, B. (2006a). Correlation between structure and corrosion behaviour of nickel dispersion coatings containing ceramic particles of different sizes. Surf. Coatings Technol. 201 (6), 3510–3517. doi:10.1016/j.surfcoat.2006.08.073
Lampke, T., Wielage, B., Dietrich, D., and Leopold, A. (2006b). Details of crystalline growth in Co-deposited electroplated nickel films with hard (Nano)Particles. Appl. Surf. Sci. 253 (5), 2399–2408. doi:10.1016/j.apsusc.2006.04.060
Lee, Y. T. R., Ashrafizadeh, H., Fisher, G., and McDonald, A. (2017). Effect of type of reinforcing particles on the deposition efficiency and wear resistance of low-pressure cold-sprayed metal matrix composite coatings. Surf. Coatings Technol. 324, 190–200. doi:10.1016/j.surfcoat.2017.05.057
Li, W. H., Zhou, X. Y., Xu, Z., and Yan, M. J. (2009). Effect of bath temperature on nanocrystalline Ni-polytetrafluoroethylene composite coatings prepared by brush electroplating. Surf. Eng. 25 (5), 353–360. doi:10.1179/174329408X282622
Lu, K., and Kessler, C. S. (2006). “Nanoparticle colloidal suspension optimization and freeze-cast forming,” in Synthesis and processing of nanostructured materials: ceramic engineering and science proceedings, volume 27 (Wiley). doi:10.1002/9780470291375.ch1
Matsuda, H., Kiyono, Y., Nishira, M., and Takano, O. (1994). Effect of cationic surfactant on deposition behaviour in electroless Ni-P-PTFE composite plating. Trans. IMF 72 (pt 2), 55–57. doi:10.1080/00202967.1994.11871023
Sadeghi, A. (2016). Microstructure evolution and strengthening mechanism in Ni-based composite coatings. Technische Universität Chemnitz. Available at: https://nbn-resolving.org/urn:nbn:de:bsz:ch1-qucosa-211837.
Spyrellis, N., Pavlatou, E. A., Spanou, S., and Zoikis-Karathanasis, A. (2009). Nickel and nickel-phosphorous matrix composite electrocoatings. Trans. Nonferrous Metals Soc. China 19 (4), 800–804. doi:10.1016/S1003-6326(08)60353-2
Stappers, L., and Fransaer, J. (2006). Growth of metal around particles during electrodeposition. J. Electrochem. Soc. 153 (7), C472–C482. doi:10.1149/1.2198090
Surender, M., Basu, B., and Balasubramaniam, R. (2004). Wear characterization of electrodeposited Ni–WC composite coatings. Tribol. Int. 37 (9), 743–749. doi:10.1016/j.triboint.2004.04.003
Tillmann, W., Brinkhoff, A., Schaak, C., and Zajaczkowski, J. (2017). Self-sharpening-effect of nickel-diamond coatings sprayed by HVOF. IOP Conf. Ser. Mater. Sci. Eng. 181, 012016. doi:10.1088/1757-899X/181/1/012016
Vanek, D. (2002). An update on brush plating. Metal. Finish. 100 (7), 18–20. doi:10.1016/s0026-0576(02)80571-2
Vanek, D. (2010). An in-depth look at selective plating processes: brush, anodizing, and electropolishing. Metal. Finish. 108 (9), 25–32. doi:10.1016/S0026-0576(10)80185-0
Venkatesh, L., Pitchuka, S. B., Sivakumar, G., Gundakaram, R. C., Joshi, S. V., and Samajdar, I. (2017). Microstructural response of various chromium carbide based coatings to erosion and nano impact testing. Wear 386-387, 72–79. doi:10.1016/j.wear.2017.06.002
Wang, W., Qian, S., and Zhou, X. (2012). Microstructure and corrosion resistance properties of jet electroplated nickel coatings containing PTFE particles. J. Electrochem. Soc. 159 (12), D756–D759. doi:10.1149/2.018301jes
Weng, F., Yu, H., Chen, C., and Dai, J. (2015). Microstructures and wear properties of laser cladding Co-based composite coatings on Ti-6Al-4V. Mater. Des. 80, 174–181. doi:10.1016/j.matdes.2015.05.005
Xiao, H., and Clouser, S. (2010). “Brush plating a metal matrix composite, cobalt-chromium carbide,” in National association for surface finishing annual conference and trade show 2010 SUR/FIN (Ohio, USA: Plating & Surface Finishing), 95–106.
Zhang, X., Qin, J., Das, M. K., Hao, R., Zhong, H., Thueploy, A., et al. (2016). Co-electrodeposition of hard Ni-W/diamond nanocomposite coatings. Sci. Rep. 6, 22285. doi:10.1038/srep22285
Keywords: brush electroplating, metal matrix composites, Cr3Cr2, wear resistance, particle distribution
Citation: Isern L, Impey S, Milosevic D, Clouser SJ and Endrino JL (2024) Wear-resistant nickel-matrix composite coatings incorporating hard chromium carbide particles. Front. Coat. Dye In. 1:1278575. doi: 10.3389/frcdi.2023.1278575
Received: 16 August 2023; Accepted: 13 December 2023;
Published: 08 January 2024.
Edited by:
Nadimul Haque Faisal, Robert Gordon University, United KingdomReviewed by:
Huatang Cao, Huazhong University of Science and Technology, ChinaShuo Yin, Trinity College Dublin, Ireland
Copyright © 2024 Isern, Impey, Milosevic, Clouser and Endrino. This is an open-access article distributed under the terms of the Creative Commons Attribution License (CC BY). The use, distribution or reproduction in other forums is permitted, provided the original author(s) and the copyright owner(s) are credited and that the original publication in this journal is cited, in accordance with accepted academic practice. No use, distribution or reproduction is permitted which does not comply with these terms.
*Correspondence: Luis Isern, bC5pc2VybmFycm9tQGNyYW5maWVsZC5hYy51aw==