 Leonardo Castro-Gonzalez1*†
 Rodrigo Leal-Cervantes
 Ekkehard Ernst
- 1Public Policy Programme, The Alan Turing Institute, London, United Kingdom
- 2International Labour Organization, Geneva, Switzerland
Economic cooperation is inherently dynamic, with agents adjusting the frequency, mechanisms, and intensity of their interactions over time. When scaling this behaviour to a large number of agents, we obtain a complex cooperation network where interaction dynamics influence the system’s macro-state. This study looks into how network topologies impact the survival of economic cooperation. Specifically, we explore the effect of topologies in sustaining cooperation through the survival of a “saving trait”, a feature that promotes cooperative interactions among agents. In our model, similar to a Stag Hunt (SH) game with memory, agents adapt their saving traits based on the profitability of past interactions with others. We simulate the game on seven distinct network structures sourced from the public repository Netzschleuder and analyse the robustness of the saving trait under topological shocks. From the seven studied networks, we recover the two equilibria dynamics from the SH game for four of them. For the remaining three, we obtain stable mixed states. These findings show that network topology affects the survival of the saving trait and its vulnerability to widespread topological shocks (over 25% of edges shifted or added). This work contributes to the interdisciplinary effort to understand economic cooperation by integrating insights from network science, game theory, and the social sciences.
1 Introduction
The scale and magnitude of human cooperation—particularly compared with other mammals—has contributed to our species being labelled as an “ultra-social” species (Henrich and Muthukrishna, 2021; Turchin, 2013). Cooperating with someone does not necessarily fall into the traditional idea of rationalism given its different origins (Henrich and Muthukrishna, 2021). To help another human at a personal cost and without direct personal benefit has been recorded in many cases (Curry et al., 2019). However, there exists a trade-off between being and not being cooperative. In very cooperative groups, individuals who decide not to cooperate can do better, while at a larger scale, more cooperative groups do better than less cooperative groups (Efferson et al., 2024). This raises different questions: why do we see cooperation at all? What are the mechanisms that regulate the presence of cooperation?
A similar matter happens with economic cooperation. In this case, interactions tend to be more rational, focusing on mutual economic profit for both parties. The scales of economic interactions can also go from small groups (Read, 1954) to international trade (De Domenico et al., 2015), where the cooperation’s mechanisms, beneficiaries and products can vary over time. This mutability of economic cooperation, widely seen nowadays in the world (Liu et al., 2022) can be seen as a sign that there are economic and behavioural mechanisms that regulate the presence of cooperation.
Cooperation is thought of as a long-term relationship, where connections between beneficiaries can intensify or fade but are thought to last long (Hagen and Hammerstein, 2006). Although this was studied for small-scale cooperation, it remains true as we move towards a larger scale. Indeed, one only needs to think of the time and processes that free trade agreements need in order to see the light (Bank, 2008; Arthur, 2021; Krist, 2025).
In this study, we are interested in studying the presence of cooperation between economic agents and the survival of cooperation given different network structures. We take inspiration from the model presented in (Ernst, 2004), where the author considers a “savings trait” which fosters and benefits the cooperation between two savers while penalizing savers when interacting with non-savers.
We modify and simplify the model so (a) it resembles the Stag Hunt game from Game Theory (Skyrms, 2001) and (b) it includes a network structure. By doing the former, the conception of cooperation also aligns with the one stemming from this kind of game (Battalio et al., 2001; Belloc et al., 2019; Starnini et al., 2011). We are interested in answering two principal questions: (i) Has the structure (topology) of the network an effect on the overall survival of the trait when we let the game evolve? and (ii) how much do topological shocks (changes to the network structure) affect the presence of the saving trait? In other words, how robust is the saving trait to topological shocks?
Resilience and robustness are understood in this case from the biology/evolutionary perspective, where resilience is seen as the capacity of the system to absorb and mitigate shocks (Holling, 1973; Nisioti et al., 2023).
We use a set of networks from the Netzschleuder repository (Peixoto, 2020) as the base topologies for our simulations. In this sense, we use interaction structures of social systems from already published studies.
This study contributes to the literature on economic cooperation to better understand different mechanisms that could make beneficial traits survive or disappear. Our research focuses on how the topology of the interaction network affects the evolution of economically beneficial traits.
In Section 2, we delve into the literature on collaboration and resilience. We also present the original model that served as inspiration, we outline our hypotheses and expand on the above research questions. In Section 3 we present the technical details of our own modifications to the original model. We describe the empirical design and the simulations in Section 4, and we present and discuss our results in Section 5 to finally conclude in Section 6.
2 Resilience and survival of economically beneficial traits
2.1 Motivation
Although the neoclassical paradigm of economics has dominated the landscapes of research and political institutions, there is a longstanding open question on how to integrate other schools of thought outside the “orthodoxy” (Wilson and Snower, 2024) into it. Other disciplines such as complex systems (Arthur, 2021) and evolutionary theory (Wilson and Gowdy, 2013) have studied different paradigms and ideas covering various aspects of economics and behavioural sciences. These two disciplines in particular can shed light on how to integrate a more fallible model of humans in opposition to the outdated super-rational Homo Economicus.
In Henrich and Muthukrishna (2021), the authors look into the sociological and anthropological rise of the cooperation between humans and between groups of humans. The different aspects of cooperation—sometimes falling out of the orthodox rational scope—is what has led our species to be labelled an ultra-social species (Turchin, 2013).
However, mutual collaboration between individuals or groups is not homogeneous nor static over time, as the strength, the mechanisms and the beneficiaries of collaboration are subject to mutations. Individuals can choose to behave selfishly and not look for the benefit of others. Nevertheless, the reason why cooperation still exists despite selfish people sometimes doing better than cooperative individuals, is that cooperative groups will do better than selfish groups (groups with more selfish people than cooperative people) (Efferson et al., 2024).
Furthermore, collaboration structures might not always have a beneficial impact on the entirety of the population, as different structures can have different effects, sometimes leading to an increase in inequality (Melamed et al., 2022; Yu et al., 2024; Musso and Helbing, 2024).
The study of beneficial economic collaboration thus helps us understand how micro-interactions affect the macro-states of a particular system. In this study, we research the survival of an economic individual trait that fosters beneficial economic collaboration in different scenarios, further understanding the best conditions for the trait’s survival or disappearance.
2.2 The model
To study the survival of beneficial economic collaboration we take the model first introduced in (Ernst, 2004). The model consists of a game between economic agents which can have a “saving trait”. This trait is made in such a way that benefits savers (those having the trait) cooperating between them, by reducing the risk of losing money and increasing their mutual profit. On the other hand, savers are penalised when interacting with a non-saver, increasing the risk of the interaction and making it more profitable (on average) for the non-saver.
Given the disparity in outcomes depending on the nature of the pairing of players, the original model considers the ability of agents to change their current attitude towards saving (to change their saving trait). In the original model, the shift of a saver to a non-saver, or vice versa, happens when their profit is lower than the average profit of the whole population. This however has two main issues: first, this mechanism supposes that each agent will know the average profit of the universe of agents. Although this assumption does not require a complete information game, to assume that the average profit is known to all agents every round is far from realistic. Second, the fact that the agent considers only one round of games to change their trait makes the system very sensible to random fluctuations (stochasticity). In the same way, the fact that agents compare their profit with respect to the average profit makes agents respond equally to risk. These two last elements are again not realistic as the profile of risk-aversion in economic agents is not homogeneous regarding losses and regarding times (Campbell and Cochrane, 1999; de Vries, 2022; Guidolin et al., 2025). Economic agents can have higher or lower tolerances to losses and time periods for their investments to pay out.
To sort out the problems delimited above, we change the mechanism that agents use to update their saving trait. Agents do not compare their profit with respect to the average profit, but instead compare their own results with respect to their story of past interactions. In that sense, we introduce a memory (a list of their last wins and losses) and a memory sensitivity. The latter dictates the attitude towards risk-aversion of the agents. The more sensible, the fewer games need to be lost before the agent decides to shift their trait.
To support the modification and make the change of trait an individual decision, we turn our attention to the study in (Sjöberg, 2007) where the author states how risk perception, is—although not only—correlated to the emotions experienced by the individuals themselves. In that sense, risk perception is correlated to both positive and negative emotions, as well as to individual attitudes.1 Risk aversion and risk perception have been also studied as varying in time (de Vries, 2022; Guidolin et al., 2025) but also as part of a habit creation (Campbell and Cochrane, 1999). Different studies studying cooperation games in networks have used memory to take into account risk on their models (Dong et al., 2019; Shu et al., 2019).
Encounters in the original model are made uniformly at random by defining an encounter probability between two agents. However, interactions and collaborations have been studied and thought of as long-term relationships between two collaborating agents (Hagen and Hammerstein, 2006; Efferson et al., 2024). This kind of more static, less volatile interaction between agents is the main argument to change the random encounter from the original model for a network structure in which the agents interact with their neighbours. The study of social and interaction networks in economy and game theory is fairly extended, allowing us to research the survival of beneficial economic traits at different scales (del Rio-Chanona et al., 2020a; Aguirre-López, 2024). The authors in Henrich and Muthukrishna (2021) expose how cooperation in societies can specialise over time, span different domains, or simply disappear (Curry et al., 2019; De Domenico et al., 2015). This myriad of specialisations and scales makes us turn to study particular networks. In that sense, the Netzschleuder repository of networks (Peixoto, 2020) is of immense help for our endeavour, as many examples of economic and social studies using networks can be found, from cooperation of students in university (Fire et al., 2012) to the total FAO trade network (De Domenico et al., 2015).
2.3 Cooperation games
Cooperation is often studied through two key models from Game Theory: the Prisoner’s Dilemma (PD) (Axelrod and Hamilton, 1981) and the Stag Hunt (SH) game (Skyrms, 2001). In the PD, mutual cooperation is beneficial, but each agent has a strong incentive to defect, leading to a dominant strategy where both defect. In contrast, the SH game presents two stable equilibria: one where both agents cooperate (hunt the stag) and another where both defect (hunt the hare), making coordination essential. Our savers model aligns with the Stag Hunt framework, as it exhibits two stable equilibria: one where all agents save (cooperate) and another where none do (defect). The saving trait represents delayed gratification (Mischel and Ebbesen, 1970), reinforcing long-term benefits over short-term gains, much like the trust-based cooperation seen in SH (Battalio et al., 2001; Starnini et al., 2011; Belloc et al., 2019). Unlike PD, where defection dominates, in our model, risk arises from failing to align with the other players. The SH game has been extensively studied in network structures (Starnini et al., 2011; Dong et al., 2019; Luo et al., 2021; Madeo and Mocenni, 2021) and memory-based adaptations (Dong et al., 2019), similar to the research on PD in evolving networks (Hatzopoulos and Jensen, 2008; Tanimoto, 2014; Stewart and Plotkin, 2014).
2.4 Resilience and robustness
Although the interactions between economic agents can be thought of as a long-term relationship, giving rise to a social network structure of interactions, this does not mean that structures stay static over time. As cooperation links can vanish and disappear, the social network of agents changes. However, is the survival of the saving trait sensitive to these changes over time?
In this sense, we are also interested in understanding the global resilience of the system and the robustness of the saving trait.
The study and definition of resilience vary from discipline to discipline (Nisioti et al., 2023). In our case, we take the evolutionary/biological approach in which resilience is seen as the capacity of the system to absorb and mitigate shocks (Holling, 1973). Given how the model is constructed, we are only considering shocks as a change in the network structure, which we call topological shocks. Such studies considering a network structure have already been done in economic literature (Del Rio-Chanona et al., 2020b).
As such, we distance ourselves from the definition of resilience in economics, where the system is expected to “bounce back” towards the previous state (Nisioti et al., 2023). Although we are interested in looking for stable or stationary states that the system tends to, we do not expect the system to recover to a prior state, but rather to absorb and move (or not) towards a new stable state.
While we are interested in the system’s resilience, we are also interested in the robustness and evolution of the saving trait. Robustness is defined in this context as the persistence of the trait (Waddington, 1942) to the topological shocks. In other words, a high robustness of the saving trait can be thought of as the difficulty, or “stubbornness”, of the trait to disappear.
2.5 Hypotheses and research questions
From (Melamed et al., 2022; Yu et al., 2024; Musso and Helbing, 2024), the network structure where economic interactions between agents take place can lead to different macro states of the system. Given the different kinds of reported cooperation and their evolution (Curry et al., 2019), we formulate the following hypothesis:
Hypothesis 1. The topology of the network affects the survival of the saving trait.
Risk aversion can vary over time given the changing attitudes and emotions of agents (Campbell and Cochrane, 1999; Sjöberg, 2001; Sjöberg, 2007; de Vries, 2022; Guidolin et al., 2025). This literature allows us to formulate a correlation between risk aversion and cooperation. Given that our objective is to study the survival and robustness of the saving trait, we formulate a hypothesis for risk aversion:
Hypothesis 2. The risk aversion of agents affects the robustness of the saving trait.
The literature has shown a trade-off between cooperation and selfishness between humans, keeping cooperation existing among us, even if it is not always the most rational or beneficial of traits. Nevertheless, we are interested in researching if, given a mutual benefit of cooperating. Hence, there are other, more hidden mechanisms or network structures that allow a beneficial trait to survive or be eliminated. As such.
1. Is the survival of beneficial traits that promote collaboration determined by the structure of interactions (the topology of the network) and the sensitivity to loss (risk aversion)?
The literature has also shown how cooperation between individuals or groups changes over time. If a small number of agents change their neighbours, deleting existing links or adding new links with other agents, the system overall might be resilient by absorbing the changes. However, if a large enough number of links is changed, modifying considerably the structure of the social network, the new exposures can bring important changes to the global state of the system. In that sense,
2. How resilient is the system to shocks in the structure of the social network? What is the robustness of the trait to these shocks?
3 Methods
In the first step, we consider the emergence of a ‘saving’ trait which helps agents in a population to plan and save for the future. The system is modelled as an undirected network where nodes represent agents and interactions take place along the edges between them. We are mainly interested in analysing the survival of the ‘saving’ trait in different particular setups where the population faces different economic shocks.
3.1 Segmentation and selection
3.1.1 Distribution of traits and encounter probabilities
We consider that an agent can have a saving trait to plan for future horizons. Whenever an individual
The possibility of an interaction between two agents is represented by an edge in the network. We suppose that an agent can only interact with another agent at a time, thus making the probability of an agent
Given these definitions, the payoffs can be constructed using the following considerations.
3.1.2 Technological selection
Each agent disposes of income
with
By denoting
In the case where a saver interacts with a non-saver agent, we assume the interaction as non-optimal to the saver, thus making the optimal individual investment,
On the other hand, when one or more additional agents with the same trait are present, a saver
Note that saver
In other words, diversification is efficient and yields higher returns than simply keeping the initial endowment. In our case, we will also assume that the minimum specialisation
Given that the return of non-savers does not depend on the strategy of other players, it will simply be the initial endowment. Therefore, the final strategic payoffs
where subscript
Hence, the non-saver agent is indifferent to the strategy of their opponent. In contrast, the opponent’s strategy does make a difference whenever a saver is investing in a specialized technology.
3.2 Set-up for the log-normal distribution
Given that the individual payoffs of savers are determined by Equation 1, thus depending on a random variable, we turn our attention to the random variable
By taking from the properties of the log-normal distribution, we have that
By taking
Thus, from Equation 1,
3.2.1 Bias on inefficient games
Supposing a game between a saver and a non-saver, the total gains after a round, following Equations 8–13 is
Although in the original model, savers are more prone to lose when interacting with a non-saver, in our case we want to have an even probability for the saver to earn more than the non-saver after an undetermined number of games. This is to ensure again that we capture the effect of the topology and the memory sensibility in the game. We thus need the probability
3.2.2 Link with the stag hunt game
We summarise the modifications to the game in the following way:
• If two non-savers interact, both will have a pay-off of
• If two savers interact, both will have a pay-off of
• If a saver and a non-saver interact, the non-saver will have as payoff
Given that we are only interested in the outcome of the game (agent 1 earns more than agent 2 or not), we thus obtain a game analogous to the Stag Hunt Game (Skyrms, 2001).
The Stag Hunt Game was originally imagined by Rousseau in the 18th century but was then formalised in Game Theory. In it, two players are supposed to be out on a hunt. If and only if they both collaborate, they could hunt a stag and earn a big reward. However, there is also the opportunity to individually hunt a hare, thus earning a smaller reward without collaborating.
In the same way, our saving agents obtain a greater reward if they both collaborate because they are able to invest in a more specialised technology, with a higher payoff. Non-savers do not collaborate, thus earning a smaller reward.
Collaboration in the Stag Hunt is seen as the capacity for players to coordinate their work in order to obtain higher rewards. The idea of coordination and collaboration is different to, e. g., the Prisoner’s Dilemma game in which agents tend to defer (betray) their opponent, given that non-collaboration is a stable pure Nash equilibrium. In the case of the Stag Hunt game, we obtain two stable pure Nash equilibria: one where both agents cooperate and another where both do not cooperate.
3.3 Memory rules
We expand the model in (Ernst, 2004) to equip individuals with memory, each recording the outcomes of their last
After
If, for example,
3.4 Shocks
Studying the resilience of our model in a given network means creating a perturbation in any of the model’s parameters and observing how the system adapts to it.
Changes in the topology of the network could lead to different trajectories in the evolution of the game, as the interactions that were possible between a set of agents could be disturbed. Also, by potentially changing the degree distribution and/or other network metrics, like the local and global clustering index, the system could evolve differently. To try all the different topologies of networks would be an impossible task, so instead we take a set of networks as our baseline (see Section 4.1) and we impose changes to the network’s topology as shocks.
We perform two different kinds of shock by following the condition to always keep a single connected component. The applied shocks into the system are:
• Random Edge Swap: Choosing a random agent, we disconnect them from one of their neighbours at random and then we draw an edge to a new agent that was not part of their neighbourhood before.
• Random Edge Addition: Choosing a random pair of not-connected agents in the network, we add a link between them.
There is a natural third topological shock that we do not apply: random edge deletion. We apply shocks as an ensemble of a given number of individual disturbances. Given that we want to keep a single connected component at all times, the number of deleted edges in a network has a “best-case scenario” limit of
4 Empirical design
Having described the original model, we turn our attention to the design of our experiments. We discuss the real-world networks that were used in our study, and we describe how we simplify the parameter space to focus only on two parameters.
4.1 Used networks: the Netzschleuder repository
We study the resilience of our model in real-world networks from Social Sciences. To do so, we compile a set of networks from the database in Netzschleuder (Peixoto, 2020). The networks were collected by filtering the database with the ‘Social’, ‘Economic’ and ‘Transportation’ tags. Because of computational power restrictions, networks with less than
The chosen networks are presented in Table 1 along with their general description and properties2.
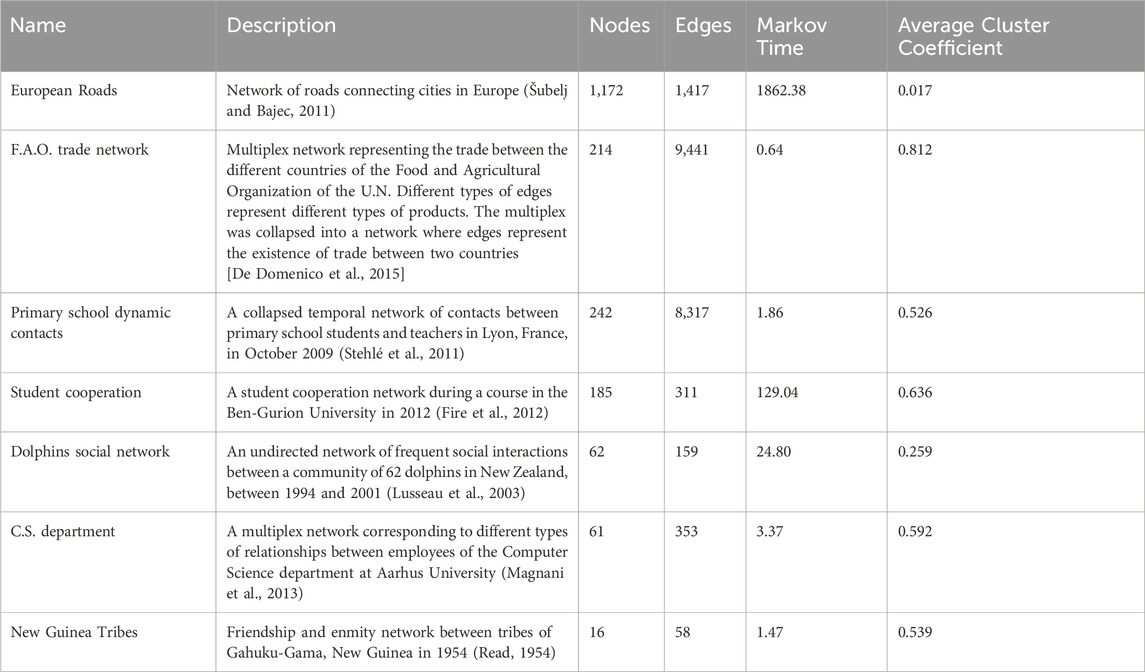
Table 1. General properties of the networks compiled from Netzschleuder (Peixoto, 2020) and used in this study. The number of edges does not match those on the website because multiplex networks were flattened to a simple undirected network.
4.2 Dimensionality reduction
Given a network with
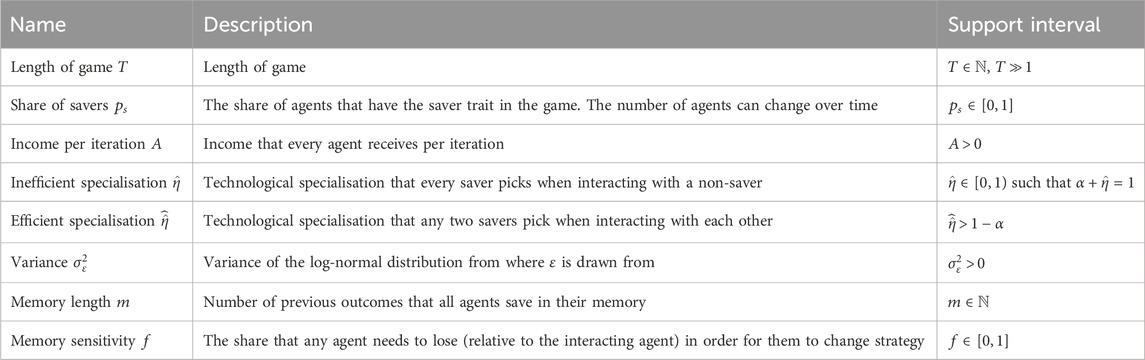
Table 2. Table of the free parameters that can be controlled when studying the evolution of the model.
To study the resilience of the system to perturbations to any of the parameters in Table 2 is equal to studying the evolution of the system over time with respect to each free parameter. In this subsection, we refer to the different free parameters that we can ignore given their lack of interest in the scope of this work and discuss those that, in return, are the most interesting to study.
We use the length of the game
We are ultimately interested in the survival of the saving trait by studying the relative outcomes of the interactions between agents. This means, that rather than the absolute profit each one of them earns after any interaction, we are interested in knowing who earned more or if they earned the same. This recording of outcomes is crucial to keep track of the evolution of the number of savers, and thus to keep track of the survival of the saving trait. As such, given how the model is constructed and how we tuned it in Section 3.2, we can discard the analysis of the parameters related to the interactions. Namely, we can ignore the inefficient specialisation
Regarding the memory parameters, no matter the memory length
We are thus left with only two free parameters to study: the share of savers
4.3 Application of shocks
As seen in Section 3.4, we focus on two types of topological shocks to the network: random edge addition and random edge swap. Since the networks under study differ in size and density, applying the same number of shocks to different networks may not produce comparable effects. An easier way to compare across networks, we quantify shocks relative to the original proportions of edges.
To isolate and distinguish the effect of shocks in the network, we apply an ensemble of simultaneous shocks to the system at a given time. This allows us to measure the shocks’ impact while controlling the overall magnitude of the shocks acting as a whole.
For both random additions and random swaps of edges, the size of the ensemble is determined as a percentage of the network’s initial number of edges. For instance, in a network with 100 edges, a batch size of 40% corresponds to adding 40 random edges.
5 Results
As stated in Section 2, we aim not only to understand what is the effect of the structure of the network in the development of the game, but also to know how much the structure plays a role in the system’s resilience to topological shocks.
Given a “stable” behaviour of the game over time (fixed points, oscillatory state or stationary states), we understand resilience to a topological shock as the capacity of the game to come back or not move from its observed state, or move to a different stable state. However, before studying the game’s resilience, we need to understand if such “stable” behaviours exist and which form they take.
In that sense, this section is divided into 3 parts. In Section 5.1 we perform different experiments to understand the effect of the topologies in the share of savers by fixing the memory effects and excluding shocks. By knowing the different behaviours that topologies can lead agents to have, we then vary the memory sensitivity in Section 5.2 to understand the role of risk adversity in the game. Finally, with the results in Section 5.3 we study the resilience of the game by controlling the known behaviour of the agents in a given set-up and introducing random topological shocks.
5.1 Effect of the topologies in the game
Our first experiment will help us understand the effect of the structure of the networks in the game. To do so, we set the memory length to 20, the memory sensitivity to 0.5 (change of strategy when half of the games are lost), and we do not introduce any shocks. Given an initial random distribution of agents with a fixed number of agents, we let the game evolve in the networks obtained from the Netzschleuder repository and described in Section 4.1.
For each studied network, we set a given initial share of savers
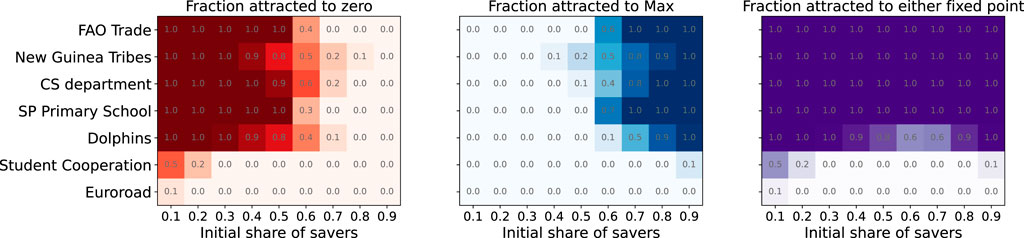
Figure 1. Heatmaps of the proportion of simulations where agents are attracted to one or both of the found fixed points for the studied Netzschleuder networks with respect to different initial share of savers
Figure 1 shows two stable fixed points observed in most of the studied networks. The first one, depicted in the left heatmap of Figure 1, represents the disappearance of the saving trait, meaning that all agents in the network become non-savers. The attraction to the “zero” stable fixed point can be seen for a low initial share of savers, being interpreted as an insufficient number of saver agents for the trait to survive. In opposition to this, in the middle heatmap of Figure 1 we observe the second stable fixed point where every agent in the network becomes a saver. This fixed point is mostly observed where there is a high initial share of savers.
Finally, the right heatmap of Figure 1 is the sum of the two proportions shown in the left and centre heatmaps. We note four key elements from this latter heatmap: (i) for most of the networks, no matter the initial share of savers, agents tend to one of the two fixed points; (ii) the transition between one fixed point and the other is different for each one of these networks (“FAO trade”, “New Guinea Tribes”, “CS Department” and “SP Primary School”); (iii) only three networks do not follow the same pattern as the others. These are “Dolphins”, “Student Cooperation” and “Euroroad”. The latter two seem to have a similar behaviour where agents do not reach any of the two fixed points for any of the initial shares of savers, (iv) the “Dolphins” network seems to tend to each of the fixed points when there is a low or high initial share of savers. It is only for values of
Transitions between the two fixed points are studied in two different ways. First, in Figure 2 we observe how long it takes agents to stabilise in any of two fixed points. Time in this case is normalised by the number of nodes in the network thus being able to compare it between networks. As can be seen, the “CS department” network is the one taking more time. We take this network in particular and, in addition to the “Dolphins”, the “Student Cooperation” and the “Euroroad” networks, we show the box plots on the final share of savers by the initial share of savers in Figure 3.
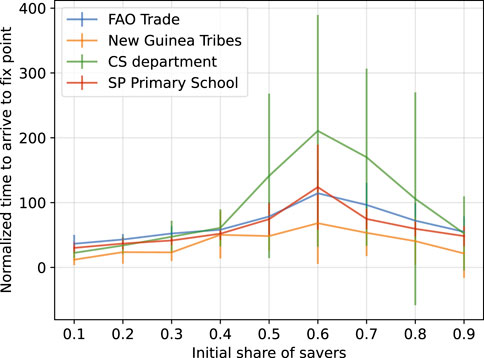
Figure 2. Normalised time that agents take to arrive at one of the fixed points. The “Dolphins” and “student cooperation” networks are not included as there are values of initial share of savers where agents do not converge.
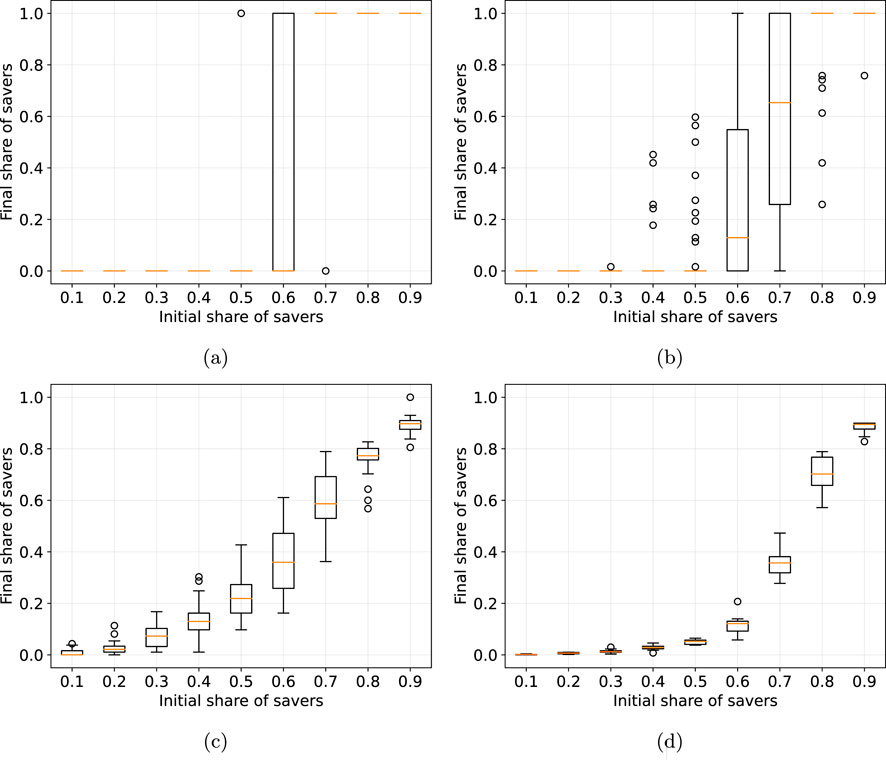
Figure 3. Boxplots of three different networks showing the distribution of the final share of savers with respect to the initial share of savers in the game. (a) CS department (b) Dolphins (c) Student Cooperation (d) Euroroad.
Figure 3 shows the transitions between one fixed point and the other with respect to the initial share of savers. In Figure 3A we observe the case of the CS department network. We note how even if in this case the mean normalized time and its variance are the highest (Figure 2), the spread of final states in Figure 3A does not show any particular complex behaviour, showing us a divide between the fixed points for any
This is in contrast with the “Dolphins” network, observed in Figure 3B. The network breaks the dichotomy between the two fixed points and we observe final shares of savers outside the two boundaries (0 or 1). For values of
The “Student Cooperation” (Figure 3C) and “Euroroad” (Figure 3D) show a completely different behaviour with respect to the other networks, observing mixed states for any initial share of savers other than 0 and 1. For both cases, we see a “softer” sub-linear transition from one fixed point to the other. The “Euroroad” network structure drowns the final share of savers to the 0 fixed point, thus making the presence of the saving trait more prone to diminish with respect to the “Student Cooperation” structure.
The topology of the network affects how the game develops. For the topologies of “FAO trade”, “New Guinea Tribes” and “SP Primary School” networks (Supplementary Material S.1) we observe similar behaviours, agents tending to one of both found fixed points at a similar normalized time. The stability of the two fixed points reveals how the game is supported on the Stag Hunt game where there are two stable equilibria. The “CS department” topology diverges from the latter set as the time it takes for the game to stabilize increases considerably, but still keeping the tendency to one of the two fixed points. In the same way, the “Dolphins” topology diverges in a different way, breaking with the dichotomy between the two fixed points, allowing mixed states. Finally, the “Student Cooperation” and “Euroroads” networks present a completely different behaviour than the rest, avoiding the two fixed points showing stable mixed states for any given initial share of savers
5.2 Effect of risk aversion in the game
To study the effect of memory on the game, we fix the initial share of savers at a value where we know what to expect following results from Section 5.1. Following Figure 1, we fix the initial share of savers to
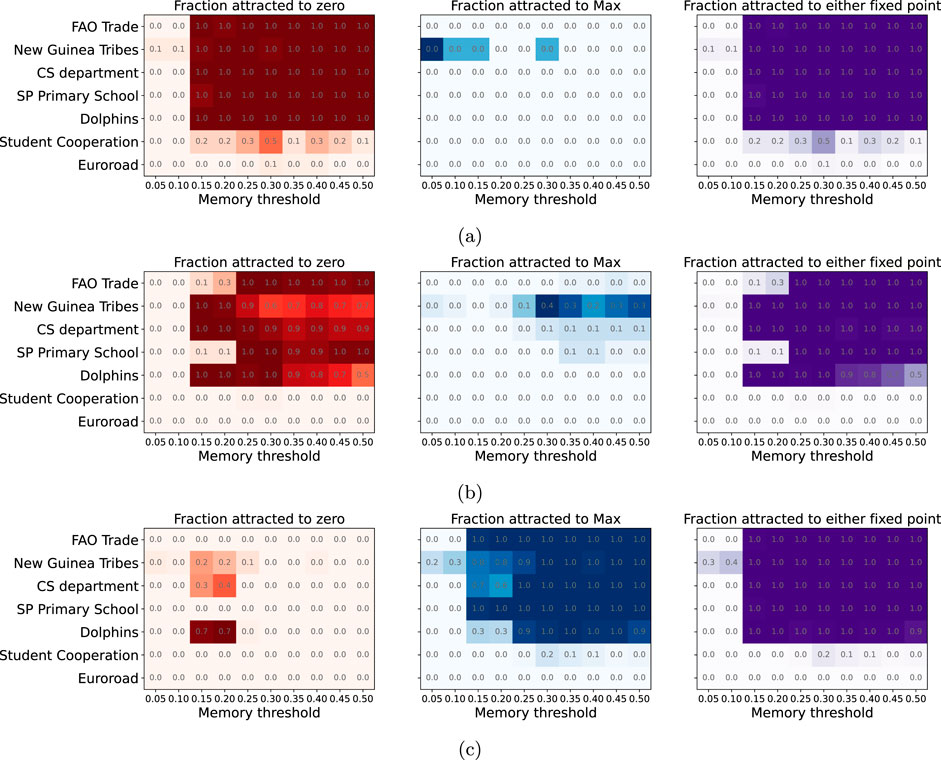
Figure 4. Heatmaps showing the fraction of simulations where agents go to one or both fixed points when memory is introduced for different memory thresholds and different initial share of savers. In all cases, the memory length is 20, thus a memory threshold of 0.05 means that an agent needs to lose 1 game to shift its strategy. In that sense, the lower the memory threshold, the more risk-averse agents are. (A) heatmaps when the initial share of savers is 0.2; (B) heatmaps when the initial share of savers is 0.5; (C) heatmaps when the initial share of savers is 0.9.
In this case, the lower the memory threshold, the higher the risk aversion. This means that by setting the memory length to 20, a memory sensitivity of 0.05 represents the case where if 1 of the 20 past games is lost, this is enough for an agent to change its strategy from saver (non-saver) to non-saver (saver).
It is interesting to notice how there is a critical value of the memory sensitivity at
In Figure 4B we observe the heatmaps when the initial share of savers is 0.5 as a mid-step between Figures 4A, C. The transition between one fixed point and the other is not homogeneous for all structures, observing pockets where the “0” fixed point seems to resist, like for the memory thresholds 0.15 and 0.2 in the “Dolphins” structure, or where the Max fixed point appears sooner for other structures like the “New Guinea Tribes”.
We are interested in better understanding the critical point observed in Figure 4. To do so, we repeat the experiments with an updated memory length of 32 games. We show in Figure 5 the results for the initial share of savers
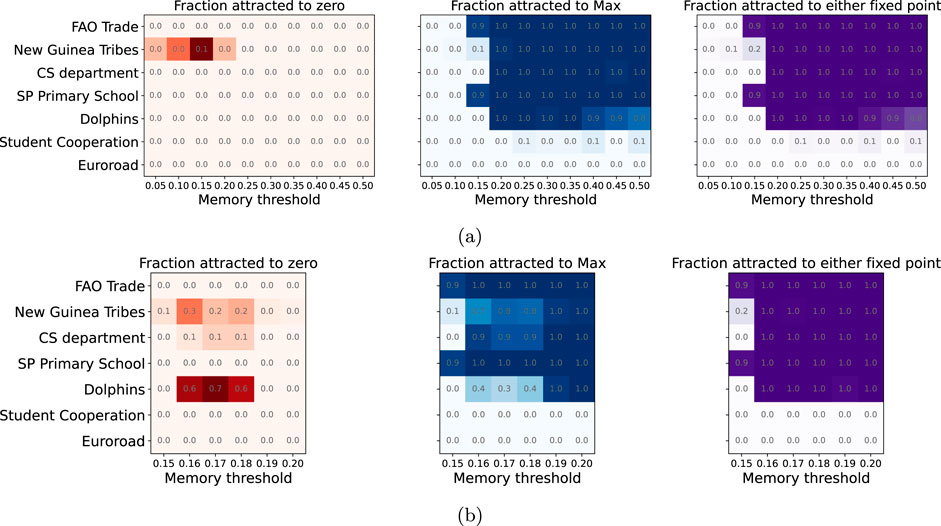
Figure 5. Heatmaps showing the fraction of simulations where agents go to one or both fixed points when memory is introduced for different memory thresholds and different initial share of savers. In this case, the memory length is 21. (A) heatmaps when the initial share of savers is 0.9; (B) Zoom of Figure 5A.
Comparing the results obtained in Figures 4C, 5A, we do not observe any particular qualitative change, observing a critical value of between
As more clearly seen in the right heatmap of Figure 5B, the critical value for the “Dolphins”, “CS Department” and “New Guinea Tribes” is at
We can then say that not only the risk aversion has an effect on how the game evolves, but also that the topology of the network affects the consequences of risk aversion. Criticality can appear depending on the topology (no appearing in “Student Cooperation” and “SP Primary School”), and a system can accept one or more critical values depending on the initial share of savers (Supplementary Figures S2b, c in the Supplementary Material S.2).
5.3 Effect of topological shocks in the game
Shocks are introduced into the system as an addition of random links between two unconnected nodes or as a swap of links pivoting from a random node.
Two questions are intended to be answered by the study of these topological shocks: (i) How do fixed points react to them? and (ii) does the system tend to a fixed point after the application of shocks in case it was not already in one?
The first question can be answered in two parts, one for each fixed point. On the one hand, the “0” fixed point where the saving trait disappears is stable to topological shocks. This is because the payoffs between two non-savers are equal, as seen in Equation 1. On the other hand, the same thing happens for the “Max” fixed point, where the saving trait is present in all agents in the network. The payoff for an interaction between two savers is stochastic, but remains the same for both players. Given how the model and the individual payoffs are structured, topological shocks do not affect the fixed points and are thus stable to these.
To answer the second question, we turn our attention to the “Student Cooperation” system, the latter being one of the two systems that do not tend to any of the two fixed points for any initial share of savers
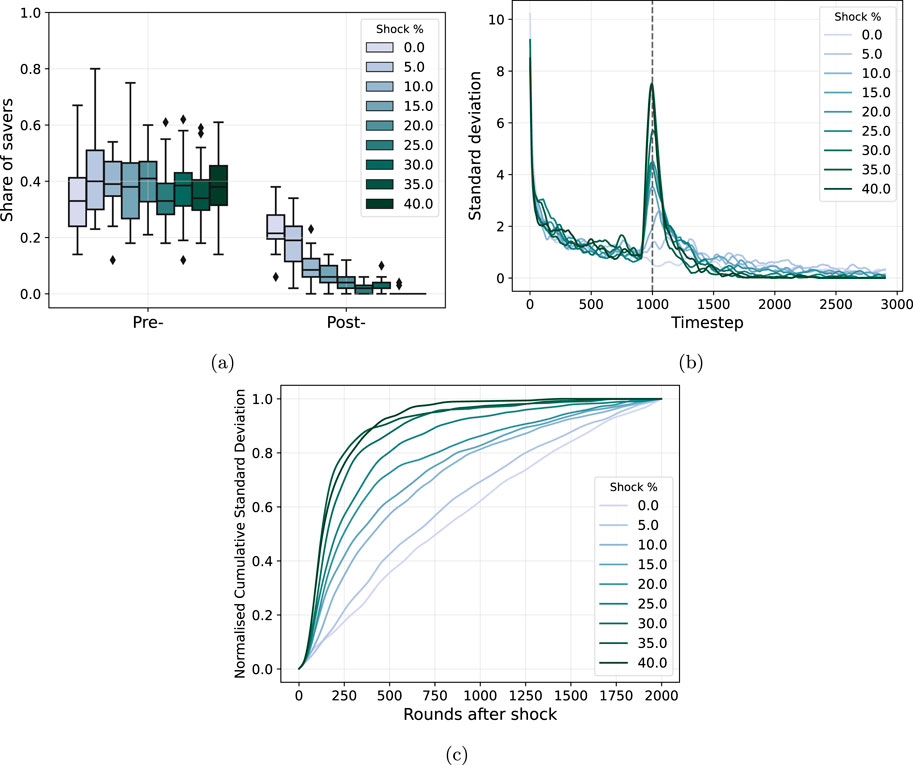
Figure 6. Shock study for the “Student Cooperation” network. For every subplot, the shock percentage means the number of edges added, measured as the percentage of original edges in the network. In the case of “student cooperation”, the original number of edges is 360. (A) the mean share of savers in the previous 100 steps before the shock and in the last 100 steps of the studied time frame (1900 steps after the shock). (B) temporal evolution of the standard deviation of the share of savers. The shock is applied at the time step = 1,000. (C) The standardised area under the curve of the time series in (B) after the shock.
We apply shocks of different magnitudes, measured as a percentage of the edges in the original network. The shocks are introduced at time
We move to analyse the post-shock distributions. First, when no shock is applied, the mean share of savers has compacted and decreased with respect to the pre-shock status. We interpret this as the system stabilising around a stationary state. This idea is supported by the fact that when shocks are applied, the mean share of savers decreases in the post-shock analysis, arriving at the “0” fixed point when the spread of the shock is 40%. Figure 6A shows how the application of a larger spread of shocks makes the system tend towards different states, finally arriving at the “0”fixed point. In this sense, we can observe how a large enough spread of shocks makes the saving trait disappear. At a spread of 10% of added edges, we observe random realisations hitting the “0” fixed point as seen for the error bars. At 25%, the lower quartile of the distribution goes to 0. Finally, at 40% we see a total disappearance of the saving trait.
The standard deviation (calculated as a rolling average with window size 100) skyrockets when the shocks are applied (t = 1,000 in Figure 6B). The cooling down after the shock is different depending on the spread of the shock. The higher the shock percentage, the quicker the cooling down. This implies two things: on the one hand, the standard deviation will decrease as the spread of the shock increases, making the system to tend to a more stable final state. This result complements the one from Figure 6A, where the “0” fixed point is reached as the shock spread increases. On the other hand, the larger the spread of shocks, the quicker the system stabilises. This is demonstrated in Figure 6C where we observe the numerical integral underneath the curves in 6b, after the shock, which we standardised by dividing the values by the total sum. The larger the spread of the shock, the more pronounced the integral curve indicating that the system stabilises faster, with the standard deviation settling to values closer to zero.
We further analyse the effect of shocks in our system by studying the behaviour of the standard deviation once the shock has occurred. To do so, we take the time series of the standard deviation shown in Figure 6B at time
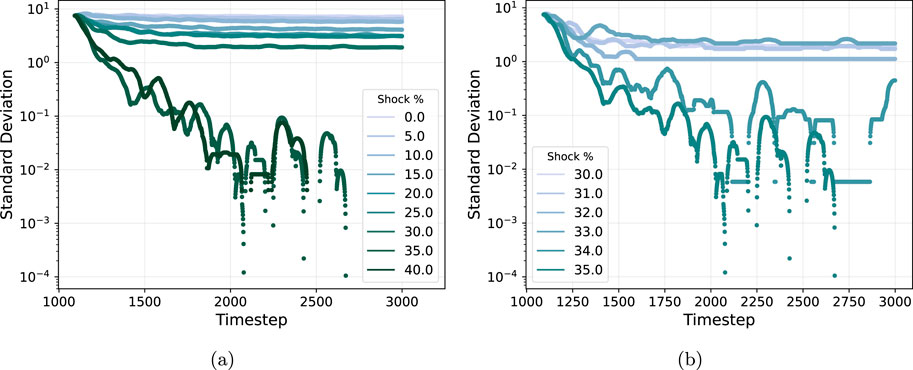
Figure 7. Shock study for the “Student Cooperation” network. For every subplot, the shock percentage refers to the number of edges added, measured as the percentage of original edges in the network. In the case of “student cooperation”, the original number of edges is 360. (A) The standard deviation of the share of savers for the different magnitudes of shocks. The time series are offset so they start at the value and are easier to compare. (B) A zoom on Figure 7A to better understand the transition from one regime to another.
We can observe two clear regimes for the standard deviation with respect to the magnitude of the shock. First, for shock magnitudes
The transition between these two regimes is further investigated in Figure 7B, where we observed the time series of the standard deviation for shock magnitudes between 30% and 35%. While for a magnitude
In summary, shocks can change the system’s overall behaviour depending on its magnitude. In the case of the “Student Cooperation” network, where we observe mixed states, if the magnitude is below a certain threshold (
6 Conclusion
In the present work, we study the effect of the structure of an interaction network on the survival and robustness of an economically beneficial trait.
We modify the model presented in (Ernst, 2004) where agents can have a saving trait which fosters and benefits the interactions between those having the trait. We modify the model so it is analogous to the Stag Hunt game (Skyrms, 2001) from Game Theory. We also modify it by superposing it on a network structure where nodes represent agents and links represent possible interactions. Agents can activate or deactivate the saving trait by assessing the outcome of their last games. We suppose a risk aversion profile that makes agents more or less sensitive to negative outcomes.
Games are played over networks obtained from the Netzschleuder repository (Peixoto, 2020), making sure that the topologies used come from studied social systems. We then apply topological shocks (changes in the structure of the network) and see how the saving trait evolves in the system.
Our objectives are triple: (i) to know if the topology of the network has a direct effect on the survival and evolution of the saving trait in the game; (ii) to know if given a topology, the risk aversion profile of agents also affects the presence of the saving trait; (iii) and finally, if the modification of the network via topological shocks has an effect on the survival of the trait. In other words, how robust is the trait to topological shocks?
Based on our experiments, we can conclude that, regardless of the network’s scale, differences in the network’s topologies affect the evolution of the saving trait (and thus the presence of cooperation). Of the 7 different studied topologies, 54 make the saving trait universally present or disappear completely, recovering the two stable equilibria from the Stag Hunt game. These two limits are stable fixed points that are not altered by topological shocks or risk aversion. The other 23 topologies (“Dolphins”, “Student Cooperation” and “Euroroad”). Present stable mixed states in which both kinds of agents coexist. The evolution of the trait is thus affected by topological shocks. We also find that, in the case of the “Student Cooperation” system, the larger the magnitude of the shock, the quicker the trait disappears completely. This latter result is particularly interesting because, given a stationary survival of the saving trait, and thus a stationary presence of cooperation, its survival is partially robust to changes in the network structure. If a rewiring of the network of at least
The evolution of the trait is also affected by the risk aversion profile. We find that for certain topologies, a critical threshold (or several) can appear, thus making the risk aversion of the system sensible to the network structure.
There is a clear follow-up question concerning the results above: Which particularities of the “Student Cooperation” and “Euroroad” networks make the saving trait not become universal or disappear completely? What is the particularity of “Dolphins” to allow mixed states for a particular set of initial shares of savers? What makes the “CS department” system stabilize later than the others? These questions are treated from our side as a cornerstone for future work, thus delving in the measures and parameters of a network that influence the elements mentioned above.
With this work, we contribute to the multidisciplinary endeavour to better understand economics and economic cooperation in particular using ideas from psychology (Henrich and Muthukrishna, 2021) and evolutionary theory (Wilson and Gowdy, 2013; Wilson and Snower, 2024). In this sense, the evolution and survival of beneficial economic traits are not secured by the simple fact that they are rationally profitable when every agent secures them. Far from that, the structure of the interaction network plays an important role in how the trait survives or not, being able to tend to stationary states that are sensitive to changes in the topology of the interaction network.
Data availability statement
The code has been made available as a Python library which can be found at https://github.com/rodrigolece/kala-econ-games. The results which are plotted in Section 5 are available at: https://github.com/rodrigolece/econ-simulations/tree/experiments/params.
Author contributions
LC-G: Conceptualization, Data curation, Formal Analysis, Investigation, Methodology, Project administration, Resources, Validation, Visualization, Writing – original draft, Writing – review and editing. RL-C: Conceptualization, Data curation, Formal Analysis, Investigation, Methodology, Project administration, Resources, Software, Validation, Visualization, Writing – review and editing. EE: Conceptualization, Funding acquisition, Methodology, Supervision, Writing – review and editing.
Funding
The author(s) declare that financial support was received for the research and/or publication of this article. The International Labour Organization has funded the three authors and kindly funded the publication of this work.
Conflict of interest
The authors declare that the research was conducted in the absence of any commercial or financial relationships that could be construed as a potential conflict of interest.
Generative AI statement
The author(s) declare that no Generative AI was used in the creation of this manuscript.
Publisher’s note
All claims expressed in this article are solely those of the authors and do not necessarily represent those of their affiliated organizations, or those of the publisher, the editors and the reviewers. Any product that may be evaluated in this article, or claim that may be made by its manufacturer, is not guaranteed or endorsed by the publisher.
Supplementary material
The Supplementary Material for this article can be found online at: https://www.frontiersin.org/articles/10.3389/fcpxs.2025.1569364/full#supplementary-material
Footnotes
1The author in (Sjöberg, 2007) describes an attitude as an evaluation of a given object. In our case, this would translate as the attitude towards cooperation being correlated to the perceived risk of initiating it.
2the “F.A.O. trade network” in Table 1 is a multiplex network in the original study (De Domenico et al., 2015). However, when obtained from the Netzschleuder API, the network is only a single layer. We keep this collapsed form of the network, as our model does not envision different network layers. For more information, refer to the documentation of the Netzschleuder repository.
3And all other structures not shown here which the reader can review in Supplementary Figure S1 of the Supplementary Material S.1.
References
Aguirre-López, F. (2024). Heterogeneous mean-field analysis of the generalized Lotka–Volterra model on a network. J. Phys. A Math. Theor. 57 (34), 345002. doi:10.1088/1751-8121/ad6ab2
Arthur, W. B. (2021). Foundations of complexity economics. Nat. Rev. Phys. 3 (2), 136–145. doi:10.1038/s42254-020-00273-3
Axelrod, R., and Hamilton, W. D. (1981). The evolution of cooperation. Science 211 (4489), 1390–1396. Publisher: American Association for the Advancement of Science. doi:10.1126/science.7466396
Bank, A. D. (2008). How to design, negotiate, and implement a free trade agreement in asia. Metro Manila, Philippines: Asian Development Bank. Accepted: 2008-04-01 Last Modified: 2017-11-16T01:01+08:00.
Battalio, R., Samuelson, L., and Van Huyck, J. (2001). Optimization incentives and coordination failure in laboratory stag hunt games. Econometrica 69 (3), 749–764. doi:10.1111/1468-0262.00212
Belloc, M., Bilancini, E., Boncinelli, L., and D’Alessandro, S. (2019). Intuition and deliberation in the stag hunt game. Sci. Rep. 9 (1), 14833. doi:10.1038/s41598-019-50556-8
Campbell, J. Y., and Cochrane, J. H. (1999). By force of habit: a consumption-based explanation of aggregate stock market behavior. J. Political Econ. 107 (2), 205–251. doi:10.1086/250059
Curry, O. S., Mullins, D. A., and Whitehouse, H. (2019). Is it good to cooperate? Testing the theory of morality-as-cooperation in 60 societies. Curr. Anthropol. 60 (1), 47–69. doi:10.1086/701478
De Domenico, M., Nicosia, V., Arenas, A., and Latora, V. (2015). Structural reducibility of multilayer networks. Nat. Commun. 6 (1), 6864. doi:10.1038/ncomms7864
del Rio-Chanona, R. M., Korniyenko, Y., Patnam, M., and Porter, M. A. (2020a). The multiplex nature of global financial contagions. Appl. Netw. Sci. 5 (1), 74. doi:10.1007/s41109-020-00301-2
Del Rio-Chanona, R. M., Mealy, P., Pichler, A., Lafond, F., and Farmer, J. D. (2020b). Supply and demand shocks in the COVID-19 pandemic: an industry and occupation perspective. Oxf. Rev. Econ. Policy 36 (Suppl. ment_1), S94–S137. doi:10.1093/oxrep/graa033
Dong, Y., Xu, H., and Fan, S. (2019). Memory-based stag hunt game on regular lattices. Phys. A Stat. Mech. its Appl. 519, 247–255. doi:10.1016/j.physa.2018.12.025
Efferson, C., Bernhard, H., Fischbacher, U., and Fehr, E. (2024). Super-additive cooperation. Nature 626 (8001), 1034–1041. doi:10.1038/s41586-024-07077-w
Fire, M., Katz, G., Elovici, Y., Shapira, B., and Rokach, L. (2012). “Predicting student exam’s scores by analyzing social network data,” in Active media technology. Editors R. Huang, A. A. Ghorbani, G. Pasi, T. Yamaguchi, N. Y. Yen, and B. Jin (Berlin, Heidelberg: Springer), 584–595.
Guidolin, M., Hansen, E., and Cabrera, G. (2025). Time-varying risk aversion and international stock returns. SSRN. doi:10.1016/j.najef.2024.102271
Hagen, E. H., and Hammerstein, P. (2006). Game theory and human evolution: a critique of some recent interpretations of experimental games. Theor. Popul. Biol. 69 (3), 339–348. doi:10.1016/j.tpb.2005.09.005
Hatzopoulos, V., and Jensen, H. J. (2008). Prisoner’s dilemma on a stochastic nongrowth network evolution model. Phys. Rev. E 78 (1), 011904. doi:10.1103/physreve.78.011904
Henrich, J., and Muthukrishna, M. (2021). The origins and psychology of human cooperation. Annu. Rev. Psychol. 72, 207–240. doi:10.1146/annurev-psych-081920-042106
Holling, C. S. (1973). Resilience and stability of ecological systems. Annu. Rev. Ecol. Syst. 4, 1–23. doi:10.1146/annurev.es.04.110173.000245
Liu, L., Shen, M., Sun, D., Yan, X., and Hu, S. (2022). Preferential attachment, R&D expenditure and the evolution of international trade networks from the perspective of complex networks. Phys. A Stat. Mech. its Appl. 603, 127579. doi:10.1016/j.physa.2022.127579
Luo, Q., Liu, L., and Chen, X. (2021). Evolutionary dynamics of cooperation in the N-person stag hunt game. Phys. D. Nonlinear Phenom. 424, 132943. doi:10.1016/j.physd.2021.132943
Lusseau, D., Schneider, K., Boisseau, O. J., Haase, P., Slooten, E., and Dawson, S. M. (2003). The bottlenose dolphin community of Doubtful Sound features a large proportion of long-lasting associations. Behav. Ecol. Sociobiol. 54 (4), 396–405. doi:10.1007/s00265-003-0651-y
Madeo, D., and Mocenni, C. (2021). Consensus towards partially cooperative strategies in self-regulated evolutionary games on networks. Games, 12(3):60: doi:10.3390/g12030060
Magnani, M., Micenkova, B., and Rossi, L. (2013). Combinatorial analysis of multiple networks. arXiv:1303.4986.
Melamed, D., Simpson, B., Montgomery, B., and Patel, V. (2022). Inequality and cooperation in social networks. Sci. Rep. 12 (1), 6789. doi:10.1038/s41598-022-10733-8
Mischel, W., and Ebbesen, E. B. (1970). Attention in delay of gratification. J. Personality Soc. Psychol. 16 (2), 329–337. doi:10.1037/h0029815
Musso, A., and Helbing, D. (2024). How networks shape diversity for better or worse. R. Soc. Open Sci. 11 (5), 230505. doi:10.1098/rsos.230505
Nisioti, E., Clark, C., Das, K. K., Ernst, E., Friedenberg, N. A., Gates, E., et al. (2023). Resilience—towards an interdisciplinary definition using information theory. Front. Complex Syst. 1. doi:10.3389/fcpxs.2023.1236406
Read, K. E. (1954). Cultures of the central highlands, new Guinea. Southwest. J. Anthropol. 10 (1), 1–43. doi:10.1086/soutjanth.10.1.3629074
Shu, F., Liu, Y., Liu, X., and Zhou, X. (2019). Memory-based conformity enhances cooperation in social dilemmas. Appl. Math. Comput. 346, 480–490. doi:10.1016/j.amc.2018.10.055
Sjöberg, L. (2001). “Risk perceptions: taking on societal salience,” in Threat politics (Routledge), 17.
Sjöberg, L. (2007). Emotions and risk perception. Risk Manag. 9 (4), 223–237. doi:10.1057/palgrave.rm.8250038
Skyrms, B. (2001). The stag hunt. Proc. Addresses Am. Philosophical Assoc. 75 (2), 31–41. doi:10.2307/3218711
Starnini, M., Sánchez, A., Poncela, J., and Moreno, Y. (2011). Coordination and growth: the Stag Hunt game on evolutionary networks. J. Stat. Mech. Theory Exp. 2011 (05), P05008. doi:10.1088/1742-5468/2011/05/p05008
Stehlé, J., Voirin, N., Barrat, A., Cattuto, C., Isella, L., Pinton, J.-F., et al. (2011). High-resolution measurements of face-to-face contact patterns in a primary school. PLOS ONE 6 (8), e23176. doi:10.1371/journal.pone.0023176
Stewart, A. J., and Plotkin, J. B. (2014). Collapse of cooperation in evolving games. Proc. Natl. Acad. Sci. 111 (49), 17558–17563. doi:10.1073/pnas.1408618111
Šubelj, L., and Bajec, M. (2011). Robust network community detection using balanced propagation. Eur. Phys. J. B 81 (3), 353–362. doi:10.1140/epjb/e2011-10979-2
Tanimoto, J. (2014). Impact of deterministic and stochastic updates on network reciprocity in the prisoner’s dilemma game. Phys. Rev. E 90 (2), 022105. doi:10.1103/physreve.90.022105
Turchin, P. (2013). “The puzzle of human ultrasociality: how did large-scale complex societies evolve?,” in Cultural evolution: society, technology, language, and religion. Editors P. J. Richerson, and M. H. Christiansen (The MIT Press).
Waddington, C. H. (1942). Canalization of development and the inheritance of acquired characters. Nature 150 (3811), 563–565. doi:10.1038/150563a0
Wilson, D. S., and Gowdy, J. M. (2013). Evolution as a general theoretical framework for economics and public policy. J. Econ. Behav. and Organ. 90, S3–S10. doi:10.1016/j.jebo.2012.12.008
Wilson, D. S., and Snower, D. J. (2024). Rethinking the theoretical foundation of economics I: the multilevel paradigm. Economics 18 (1). doi:10.1515/econ-2022-0070
Keywords: economic cooperation, networks, shocks, resilience, Netzschleuder, complex systems, stag hunt game
Citation: Castro-Gonzalez L, Leal-Cervantes R and Ernst E (2025) Conflict and cooperation: a systematic exploration. Front. Complex Syst. 3:1569364. doi: 10.3389/fcpxs.2025.1569364
Received: 31 January 2025; Accepted: 21 March 2025;
Published: 16 April 2025.
Edited by:
Marco Villani, University of Modena and Reggio Emilia, ItalyReviewed by:
Elka Korutcheva, National University of Distance Education (UNED), SpainGuido Fioretti, University of Bologna, Italy
Yunya Xie, Tianjin University of Finance and Economics, China
Copyright © 2025 Castro-Gonzalez, Leal-Cervantes and Ernst. This is an open-access article distributed under the terms of the Creative Commons Attribution License (CC BY). The use, distribution or reproduction in other forums is permitted, provided the original author(s) and the copyright owner(s) are credited and that the original publication in this journal is cited, in accordance with accepted academic practice. No use, distribution or reproduction is permitted which does not comply with these terms.
*Correspondence: Leonardo Castro-Gonzalez, bG1jYXN0cm9nb256YWxlekB0dXJpbmcuYWMudWs=; Rodrigo Leal-Cervantes, cm9kcmlnb0BwaWtrbGEubWU=
†Present addresses: Leonardo Castro-Gonzalez, Geography Department, University of Bristol, Bristol, United Kingdom