 Chris Gaiteri1,2 and Jonathan E. Rubin2,3*
- 1Department of Psychiatry, University of Pittsburgh, Pittsburgh, PA, USA
- 2Center for Neuroscience, University of Pittsburgh, Pittsburgh, PA, USA
- 3Department of Mathematics, University of Pittsburgh, Pittsburgh, PA, USA
The pre-Bötzinger complex (pre-BötC), within the mammalian respiratory brainstem, represents an ideal system for investigating the synchronization properties of complex neuronal circuits via the interaction of cell-type heterogeneity and network connectivity. In isolation, individual respiratory neurons from the pre-BötC may be tonically active, rhythmically bursting, or quiescent. Despite this intrinsic heterogeneity, coupled networks of pre-BötC neurons en bloc engage in synchronized bursting that can drive inspiratory motor neuron activation. The region’s connection topology has been recently characterized and features dense clusters of cells with occasional connections between clusters. We investigate how the dynamics of individual neurons (quiescent/bursting/tonic) and the betweenness centrality of neurons’ positions within the network connectivity graph interact to govern network burst synchrony, by simulating heterogeneous networks of computational model pre-BötC neurons. Furthermore, we compare the prevalence and synchrony of bursting across networks constructed with a variety of connection topologies, analyzing the same collection of heterogeneous neurons in small-world, scale-free, random, and regularly structured networks. We find that several measures of network burst synchronization are determined by interactions of network topology with the intrinsic dynamics of neurons at central network positions and by the strengths of synaptic connections between neurons. Surprisingly, despite the functional role of synchronized bursting within the pre-BötC, we find that synchronized network bursting is generally weakest when we use its specific connection topology, which leads to synchrony within clusters but poor coordination across clusters. Overall, our results highlight the relevance of interactions between topology and intrinsic dynamics in shaping the activity of networks and the concerted effects of connectivity patterns and dynamic heterogeneities.
Introduction
Synchronized activity in the pre-Bötzinger complex (pre-BötC) in the mammalian respiratory brainstem occurs during the inspiratory phase of respiration and drives motoneurons responsible for inspiratory muscle movements (Feldman and Del Negro, 2006). The pre-BötC generates synchronized bursting oscillations when isolated from other elements of the respiratory network in slice (Smith et al., 1991), en bloc spinal cord (Feldman and Smith, 1989; Brockhaus and Ballanyi, 1998), or in situ perfused rat brainstem–spinal cord preparations (Rybak et al., 2007; Smith et al., 2007). Individual neurons within the pre-BötC exhibit varied intrinsic activity patterns and multiple burst-supporting currents, but the question of how synchronized activity emerges from this heterogeneous population remains unsolved (Butera et al., 1999b; Rubin and Terman, 2002; Feldman and Del Negro, 2006; Rubin, 2006; Purvis et al., 2007; Dunmyre and Rubin, 2010). Recently, using a combination of neuron-specific staining and calcium imaging, Hartelt et al. (2008) identified a highly structured topology of synaptic connections among cells in slice preparations derived from the pre-BötC. In this network, cells were spatially grouped into local clusters with a high prevalence of intra-cluster connections. In turn, these clusters had a defined membership size distribution and were connected via relatively rare inter-cluster links. Given that this brain region is known to exhibit synchronized bursting, despite heterogeneity in intrinsic neuronal properties, it is quite plausible that this distinctive, highly non-random topology plays a significant role in facilitating network bursting. The main goal of this paper is to computationally explore particular aspects of this hypothesis.
To achieve this goal, we computationally generated a large collection of networks with various topologies, namely the topology detailed by Hartelt et al. (2008) and a range of other commonly utilized coupling architectures. These networks are populated with biophysically accurate models of pre-BötC neurons with a representative distribution of intrinsic firing patterns. To understand the impact of a particular coupling configuration on burst synchrony in such networks, we contrast the activity of specific heterogeneous sets of pre-BötC neurons coupled under that topology vs. the activity of the same collections of model neurons connected by the same total number of links, but in a variety of other topologies. For each fixed network topology and set of neurons, we also determine how “cell-type hierarchies” – the relative positions of specific cell types in the network – can influence synchrony. That is, it is possible that the heterogeneity in intrinsic dynamics across pre-BötC neurons allows neurons with particular dynamic properties to play specific roles in shaping network activity and that these roles depend on the nature of these neurons’ links to the rest of the network. To investigate this idea, we compare burst synchrony across networks with random neuron placement and a variety of networks in which the placement of intrinsically quiescent, bursting, and tonically spiking neurons is linked with a measure of centrality of the nodes in the network. We additionally consider how these two major variables, network topology and cell-type hierarchy, interact – if a particular network topology or cell-type placement can universally dictate synchrony or if these factors are mutually dependent, such that synchrony is sensitive to specific combinations of topological and dynamic factors.
Random networks and regular lattice networks represent two extremes of interaction ranges that are, respectively, extensive and restricted. These networks are frequently selected for network simulations based on practical, ease-of-use considerations, and therefore we include them in our comparison of synchronization properties. We also include small-world (SW) architectures, as they are a prevalent topology for neuronal networks, thought to promote a balance of modularity and integration/feature-binding (Watts and Strogatz, 1998; Bullmore and Sporns, 2009). SW architectures combine the local connectivity of lattice networks with a small number of connections that span the network, as may arise in random networks, and greatly reduce the path-lengths between nodes. Besides the common occurrence of this topology in brain networks, there are indications that it serves a functional role in information processing (Bassett et al., 2006). When this topology breaks down, affected brain systems may exhibit pathological function, shown by selective disease targeting of long-range synchronization in Alzheimer’s disease (Stam et al., 2007), decreased clustering coefficients after excitotoxicity in the hippocampus in a model of epilepsy (Srinivas et al., 2007) and the progressive breakdown in cortical and subcortical resting state networks in schizophrenia (Liu et al., 2008).
In addition to lattice, SW, and random networks, we consider scale-free networks to ensure that we achieve a thorough assessment of how topological features interact with the dynamics of network elements to determine the emergent behavior of these networks. In scale-free networks, as in SW networks, a small number of nodes are important in directing and controlling information flow. Scale-free networks, however, achieve low path-length through degree heterogeneity; they contain a small number of “hub” nodes that have many connections to the more common “provincial” nodes, which have far fewer connections (an example is shown in Figure 1B). The exact degree distribution for these networks follows a power-law distribution (or truncated power-law due to finite network size). While it is debated if individual neurons have SW, scale-free, or both types of connectivity (Srinivas et al., 2007; Bonifazi et al., 2009), large-scale brain networks tend to show both scale-free and SW characteristics (Achard et al., 2006; van den Heuvel et al., 2008; Wang et al., 2009a).
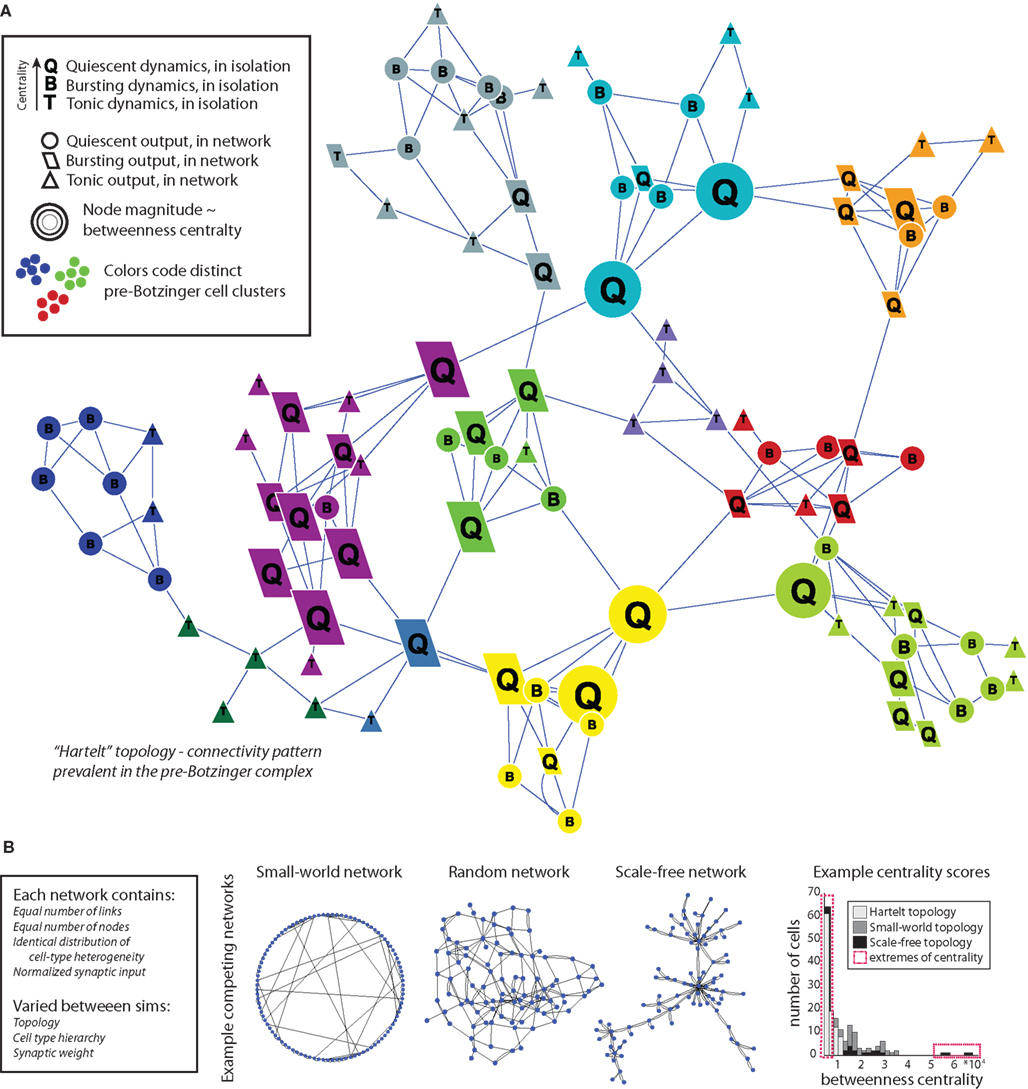
Figure 1. Schematic of integrating dynamics into topology using cell-type heterogeneity. (A) Example network with “Hartelt” topology found in the pre-BötC (Hartelt et al., 2008), consisting of densely connected clusters (color-coded) with rare inter-cluster links. In our simulations, we place cells with different intrinsic dynamics at select nodes in the topology based on each node’s betweenness centrality (magnitude indicated by node size). The specific ordering of cell types in the hierarchy of betweenness centrality can be manipulated to generate potentially different network behaviors. In the example shown here, cells with quiescent dynamics are located most centrally, intrinsically bursting cells are located at the middle tier of centrality, and intrinsically tonic cells are located at the lowest centrality nodes. The cells interact with each other via excitatory synapses, sometimes taking on new activity characteristics when so linked (indicated by the node shape). (B) Other network structures may produce different combined output while using the same distribution of cellular heterogeneity, as a pure function of their topology. For comparative purposes we test the synchrony properties of seven additional topologies (examples shown here) commonly employed in network studies or found in brain networks. The total number of connections, number of cells, and cell-type heterogeneity in these networks were exactly matched to those of the pre-BötC networks. However, graph properties differ substantially between topologies as shown by histogram of betweenness scores for three tested networks (far right).
Both the SW and scale-free topologies in biological systems are especially sensitive to alterations and manipulations of nodes that form shortcuts across the network (SW) or hub nodes (scale-free networks; Jeong et al., 2001; Morgan and Soltesz, 2008; Wang et al., 2009b). The Hartelt topology of the pre-BötC naturally highlights the strategic position of certain select nodes as well, namely those nodes located on paths between local clusters (Hartelt et al., 2008). Since the pre-BötC has cell types with distinct activity patterns (quiescent, bursting, or tonically active cells), we investigated if it was possible to control the level of synchrony in a network by controlling which dynamical cell types were located at these strategic nodes. As noted above, we refer to each one of the possible arrangements of cell types at central network nodes as a cell-type hierarchy, since in each case different cell types are placed at distinct levels of centrality in the network (Figure 1A shows a hierarchy with intrinsically quiescent cells placed at high centrality nodes and tonically active cells placed at low centrality nodes).
Thus, for each connection topology, we can test the extent to which synchronous bursting emerges within a network populated by a realistically heterogeneous distribution of cell types and also how the propensity for synchrony varies depending on how the exact same distribution of cell types is arranged in specific cell-type hierarchies. Based on these experiments, we observe that network topology does strongly affect the emergence of burst synchronization. Cell-type hierarchy also contributes to synchrony characteristics, yet the extent of its influence depends on the choice of topology, with the strongest dependence arising in scale-free networks. Surprisingly, the Hartelt network yields the weakest network burst synchronization, favoring instead synchronization within clusters without coordination across clusters.
Materials and Methods
Simulation Overview
We simulated network activity across distinct network topologies (n = 8), cell-type hierarchies (n = 7), and synaptic weights (n = 3). For each network, the total number of links between cells was set by generating a corresponding network with a pre-BötC topology (Hartelt et al., 2008) and setting the number of links equal to the number present in the pre-BötC network. The process of iterating through all combinations of these features to set up a simulation is illustrated in Figure 2A. To facilitate comparisons between-networks, we computed replicate simulations (n = 20 networks) for each possible combination of these three features (Figure 2A illustrates the specification of a single simulation). Within each set of replicate simulations, all network characteristics were identical except that different values of a particular model parameter (Eleak, see below) were drawn for each neuron, in a way that preserved the cell-type hierarchy, and the particular set of connections between neurons was regenerated, in a way that preserved topology. We performed direct comparisons of activity, accumulated over the 20 replicate simulations, between each pair of networks that differed in one feature (network topology, cell-type hierarchy, or synaptic weight), and shared the same other features. Each simulation ran for 1,000,000 time steps of size 0.1 ms, using a fourth order Runga–Kutta method in MATLAB (for the equivalent of 100 s of real neuronal time per simulation). The first 10 real-time seconds were discarded as transient.
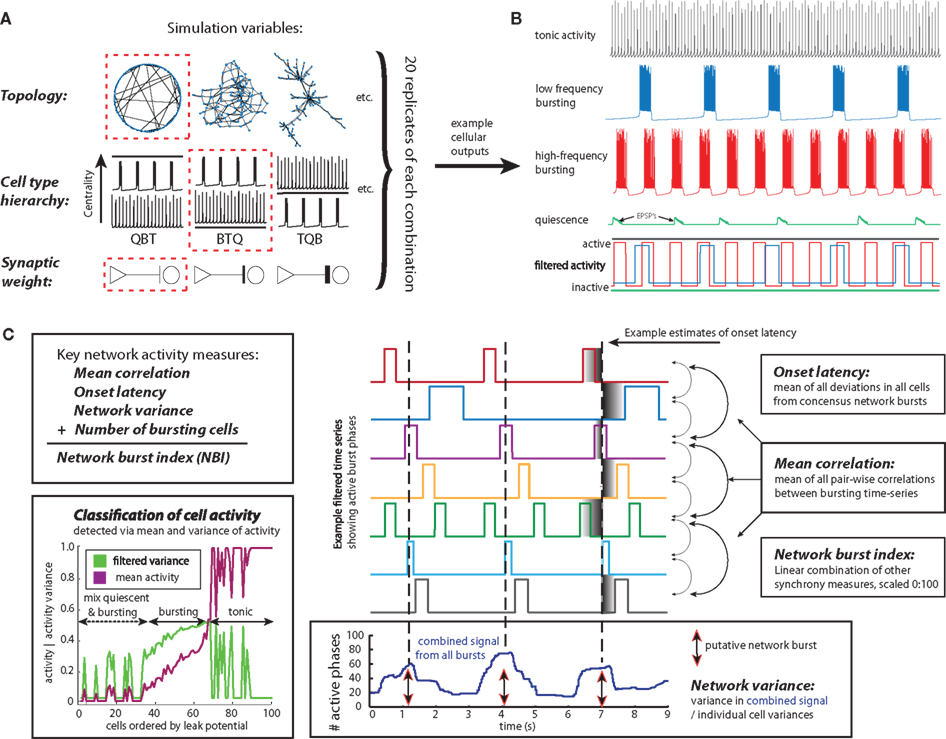
Figure 2. Schematic of key simulation variables, network output patterns and synchrony measures. (A) Each network simulation is specified by the selection of a topology, a cell-type hierarchy and a synaptic weight. In the example shown (indicated by dashed red borders), a small-world network would be simulated with intrinsically bursting cells at the highest centrality nodes, using a low synaptic weight. Replicate simulations vary in the particular leak reversal potential values selected to generate the intrinsic dynamics and the particular network architecture used. (B) A series of filters detects active burst phases in the spiking output of cells in the network. These filtered time series are the basis of all synchrony measures. (C) For each simulation, several synchrony measures are computed and, to facilitate comparisons between topologies and cell-type hierarchies, combined into a single “network burst index” value. Each synchrony measure assesses a different aspect of concerted bursting activity. The output of each cell is classified as quiescent, bursting or tonic using the combination of mean and variance in activity (lower left), and the number of bursting cells in the network is counted. “Network variance” increases with large temporal fluctuations in the combined output of all bursting cells in the network, generated by time-coherent bursting (lower right). “Onset latency” uses estimates of network bursts to assess the jitter in the burst onset times of participating cells, relative to the time of a network burst (right). “Mean correlation” is a more stringent measure of synchrony between pairs of bursting cells that depends on the onset and offset times of activity bursts (right).
Neuron Model
Our neurons are modeled using the “Butera model 1,” a well- established, single-compartment biophysical model of pre-BötC cells that is capable of reproducing quiescent, square-wave bursting, and tonic activity observed in these cells experimentally (Butera et al., 1999a). Model output may be shifted between activity patterns by altering parameters such as the conductance of tonic synaptic input, the persistent sodium current conductance, or the leak current reversal potential, Eleak. We considered networks of 100 coupled neurons and we used Eleak to set the intrinsic dynamics of each cell. Specifically, since the distribution of intrinsic dynamics within the pre-BötC has not been fully characterized, we specified that approximately one-third of the model neurons would be quiescent, one-third bursting, and one-third tonically active, in the absence of synaptic input, and, given a neuron’s designation, we selected its Eleak value randomly from a uniform distribution over the range corresponding to that form of dynamics (Butera et al., 1999a). Neurons’ Eleak values were refreshed for each new simulation, while all other model parameters were held constant across all simulations. Our only modification to the basic model was that the maximal conductance of each synaptic input to each cell was scaled by the total number of inputs the cell received, such that the maximum possible input to all cells was identical.
Mechanisms behind the full range of possible spiking behaviors in individual model cells and networks of these cells are complex and have been the topic of past dynamical systems analysis (Best et al., 2005; Butera et al., 2005; Rubin, 2006). Our focus here is the collective behavior of large groups of these neurons, rather than the biophysical model details. Within a coupled network, synaptic input may shift a cell’s behavior into a pattern that differs from its intrinsic activity (Figure 1A). While it is possible to ramp up a cell’s activity from quiescence, to bursting, to a tonically firing regime with increasing synaptic input, there are many other less straightforward transitions that have been elucidated in small networks of synaptically coupled model cells. For instance, it is not necessary to have intrinsically bursting cells present for network bursting to occur (Butera et al., 1999b; Best et al., 2005; Rubin, 2006; Purvis et al., 2007; Dunmyre and Rubin, 2010). Also, with certain levels of tonic input, it is possible to switch cell output from tonic to bursting via synaptic input, and then back to tonic again with further input (Butera et al., 1999b; Best et al., 2005). In the present simulations, in contrast to most previous studies, we only control the global network topology, so each simulated network contains many different coupling patterns involving various combinations of cell types. Based on the diverse transitions between activity patterns found in small networks, it is not clear how coherent network activity can emerge from such disparate interactions. Furthermore, given the complexity of activity-type transitions, we expect that the influence of neurons at central nodes on network dynamics will depend on the global network topology and associated local microcircuitry.
Topologies
All links between cells provide directed excitatory input. Simulations were performed using eight different network topologies: (1) nearest neighbor (NN), in which neurons were arranged in a ring (i.e., a one-dimensional chain with ends linked) and were coupled to their n nearest neighbors; (2) classic SW, in which the targets of a randomly selected set of 5% of the connections in an NN topology were altered, with a new target for each selected at random from all other cells in the network except, the cell from which the connection originated; (3) hub SW, in which all connections of 5% of nodes in the NN topology were rewired at random; (4) random, in which the source and target of each connection were selected at random with equal probabilities assigned to all nodes, which produces a Poisson degree distribution; (5) Hartelt, consisting of linked clusters of cells, with the numbers of cells within each cluster, the number of connections between cells within each cluster, and number of connections between clusters matching the experimentally derived distributions shown in Figure 5 of Hartelt et al. (2008); (6) lattice, in which cells were placed on a cylinder (i.e., a two-dimensional, 10 × 10 square lattice with two opposite sides linked) and were coupled to n of their immediate neighbors; (7) lattice SW, in which the targets of a randomly selected set of 5% of the connections in a lattice topology were altered, with a new target for each selected at random from all other cells in the network except the cell from which the connection originated; (8) scale-free, in which the networks were generated through preferential attachment and the degree distribution follows a power-law.
For comparative purposes, for each simulation in each non-Hartelt topology, a Hartelt network was generated and the total number of links in the non-Hartelt topology was set to match the total number of links in that particular Hartelt network. Since we normalize the input to each cell based on the number of inputs, in our simulations, topologies differ mainly in their organizational structure, and this step creates a fair comparative basis on which to evaluate activity in the Hartelt topology.
Cell-Type Hierarchies
Once a connection network and a set of model cells were generated, we placed the cells at nodes within the network. We followed certain rules for how particular forms of intrinsic dynamics were matched with particular nodes. In the random case, we placed model cells randomly. In all other cases, we computed the centrality of each node in the network. We then specified an ordering of cells, choosing one type of intrinsic dynamics to be assigned to the most central one-third of the nodes, another type of be placed at the one-third of the nodes of intermediate centrality, and a final type to occupy the least central one-third of the nodes. We call the resulting configurations “cell-type hierarchies” because each cell type is located at a specific point in the hierarchy (ranked list) of centrality in a given network.
We employed two methods of determining node centrality in the network. Because of the importance of rewired nodes in SW architectures (hereafter called “hubs,” as this usage is standard in the literature), we used rewiring as a representation of centrality; that is, nodes connected to rewired links were considered as central. For non-SW networks, we used betweenness centrality to quantify the centrality of nodes. The betweenness centrality of a given node is defined as the number of times that a node participates in a shortest path between two other nodes, normalized by the number of nodes in the network (Freeman, 1977). This measure was selected to guide cell-type placement because high centrality nodes are analogous to rewired nodes in SW topologies in the sense that nodes that participate in rewiring in the formation of SW networks also rank highly in betweenness centrality, but the betweenness criterion may be applied to the entire range of network topologies that we considered (Figure 1B far right shows contrasting betweenness distributions for different topologies).
Classification of Spiking Activity as Quiescent, Bursting, or Tonic
We used a moving average filter to transform spiking/non-spiking voltage time courses of individual cells into blocks of activity/non-activity (see spike trains in Figure 2B, transformed into block activity signals at bottom). We defined a burst active phase as a time interval in which spikes occurred with ISIs not greater than 20 ms between successive spikes, occurring between two silent phases of at least 200 ms each. Each such active phase was represented as an activity block. This definition avoided misclassification of irregular spike trains, although cell outputs were generally stationary, with few observed instances of abrupt changes such as a cell transitioning from bursting to tonic activity midway through a simulation, after the initial transient period that was discarded.
Transforming spiking activity into step-like filtered output enables automatic classification of individual time series as quiescent, bursting, or tonic (Figure 2C, bottom left), based on the mean and variance of the entire time course of a given cell’s filtered signal. Cells with small variance in their filtered output, but either high mean activity or low mean activity, are classified as tonic or quiescent, respectively. Cells in the middle ground, exhibiting a non-zero level of mean activity and also an elevated variance, which corresponds to the switching between silence and activity characteristic of bursting, were classified as bursting. This method quickly and robustly detects different patterns of cell output.
Synchrony Measures: Relevance and Calculation
We used multiple measures of synchrony to form a comprehensive estimate of network bursting in different networks and cell-type hierarchies. Each measure focuses on a particular aspect of burst synchrony. The most general measure for identifying synchronous burst onset and offset we use is “mean correlation.” Since each network simulation generates 100 spiking time series, we use the mean of the Pearson correlation between all pairs of time series as a general marker for agreement in activity periods (Figure 2C, right). Because burst synchrony, rather than spike synchrony, is of interest here, we assess these correlations using the filtered (burst/non-burst) time series (Figure 2C, center).
We define the temporal dispersion of the onset times of individual cell bursts, relative to the onset time of a network burst, as “onset latency.” Low onset latency indicates the generation of a robust network burst with little lag in recruitment of cells. To accurately estimate burst latency in noisy networks, we first smooth the summated spike trains with a moving average filter. Next, we find the local minima of the smoothed signal, and for each pair of minima, we define a corresponding “network fluctuation” as the largest value of the smoothed signal on the time interval between them. We subsequently select the n largest magnitude network fluctuations in the combined network output as estimated times of putative network bursts, since these represent relatively large depolarizations across all cells (Figure 2C center column on the bottom shows the summated network activity and the peaks of “network fluctuations”). The number n of fluctuations was chosen to equal the median number of bursts across all cells (Figure 2C, center column). Values for onset latencies are calculated as the standard deviation in the nearest individual cell burst onset times, relative to the time of the network burst. This process ensures that the majority of estimated onset latencies (across all cells) are indeed related to the current network burst.
“Network variance” is the least stringent measure of network bursting that we use, as it does not rely on the precise timing of burst onset and offset, but rather on the peak coherence between bursting cells (Figure 2C bottom). Multiple synchronously bursting cells will generate greater voltage fluctuations in the summed network output than will asynchronously bursting cells. Thus, wide swings in the cumulative signal produce high network variance scores, indicative of roughly synchronized bursts.
These synchrony measures are only calculated between bursting cells and do not reflect the number of participating cells. However, while a network may have a small number of highly synchronous bursting cells and achieve a high mean correlation score, a larger number of slightly less synchronous bursting cells in a comparable network may be more biologically relevant. Therefore, we also consider the number of bursting cells in tandem with all synchrony measures. Finally, we compute the “network burst index” (NBI) as a combination of all three synchrony measures and the number of bursting nodes, normalized on a scale of 0 to 100, with 100 representing perfect synchrony in all cells, with every cell bursting. The NBI increases with mean correlation, network variance, and number of bursting cells and decreases as onset latency increases, with all four factors weighted equally. The NBI is useful as a comprehensive, compact estimate of the prevalence of network burst synchrony in a given simulation.
Permutation Testing for Local Synchrony in Hartelt Topology
In addition to network-level measures of burst synchrony, we compute “local synchrony” as a measure of burst synchrony within isolated cell communities, such as clusters in the Hartelt network. To assess if synchrony is higher than expected in these local communities, we measure mean time series correlation within each cluster. For each cluster of size n, we repeatedly select groups of n cells in the network at random and compute their mean time series correlations. We then find where the actual level of synchrony within the n cell cluster falls in the distribution of synchrony scores that was generated by the randomly selected groups of cells. Repeated comparisons to non-clustered groups of cells produces a p-value on the likelihood that synchrony within a local cluster is greater than that expected at random in groups of cells drawn from the network at large.
Hierarchal Clustering of Synchrony Results to Find Families of Networks
Because we examine the behavior of multiple topologies, as well as multiple cell-type hierarchies, via several complementary synchrony measures, there are hundreds of possible pairwise comparisons between simulations. While we highlight many of these with bar graphs, to efficiently identify possible families of topologies or cell-type hierarchies with generally similar behavior, we use complete linkage hierarchical clustering to generate a dendrogram that groups similar topologies/cell-type hierarchies. This technique computes the distance between all topologies (or all cell-type hierarchies) over all of the synchrony measures and then groups the topologies/cell-type hierarchies into clusters of minimal distance. The lengths of arms in the dendrogram correspond to the distances between pairs of objects; short arms between two objects or groups indicate similarity and longer arms signify dissimilarity. The purpose of using this technique was to identify collective large-scale similarities between topologies or cell-type hierarchies, as exact p-values for differences in specific synchrony measures are explored elsewhere.
Results
Our overarching goal was to determine how network topology and intrinsic cell dynamics affect a network’s capacity to generate synchronized bursting activity. To address this broad question, we present results based on which topologies, cell-type hierarchies, and synaptic coupling levels generated network bursts most successfully and how these three main factors interact. When possible, we comment on mechanisms underlying observed outcomes and on unifying characteristics related to network propensity for bursting and synchrony.
Because we assessed six measures of bursting activity while varying network architecture, cell-type hierarchy, and maximal synaptic conductance, we performed a MANOVA test to determine if these independent variables had a significant interaction with our dependent collection of synchrony measures. Significant effects were found for topology, cell-type arrangement, and synaptic coupling strength on the bursting measures (Wilks’ lambda, p < 0.001), and we also found significant interactions among all pairwise combinations of the independent variables (p < 0.001). Because Levene’s test indicated the variance of many burst measures was non-normally distributed (p < 0.05), we followed up the global analysis with separate ANOVA’s as an extra step to confirm the significant main effects found for topology, cell-type hierarchy, and synaptic coupling, even through MANOVA’s are theoretically robust to non-normality. ANOVA results uniformly indicate that each of these three independent variables had a significant effect on the bursting and synchrony measures (p < 0.001). There were hundreds of pairwise comparisons between all pairs of topologies and all pairs of cell-type hierarchies spread over multiple measures of synchrony. The majority of these were also significant (at level of p < 0.05, corrected for multiple testing with the conservative Tamhane’s test). Further analysis and description of trends in how these synchrony measures differ across various topologies, cell-type hierarchies, and synaptic strengths are found below.
Effects of Network Topology on Bursting
Different networks implemented with an identical number of links, number of nodes, strength of synapses, and degree of cellular heterogeneity showed widely varying levels of synchronized bursting as a direct function of their global topologies. Our measures of bursting activity can be divided into structural measures (burst length and frequency) and correlation measures (such as latency in burst onset across many cells). Both categories of bursting activity showed significant modulation by topology (Wilks’ lambda and Kruskal–Wallis, p < 0.001).
Our most general measure of synchrony, “mean correlation,” showed significant modulation by topology, with many distinctions in pairwise topology comparisons (post hoc Tamhane’s test, p < 0.001). NN and Hartelt topologies yielded significantly lower mean correlations than all other topologies (p < 0.001; Figure 3A). Scale-free networks showed much higher variability in mean correlation than all other networks (p < 0.001), due to a dynamics–topology interaction (see next section).
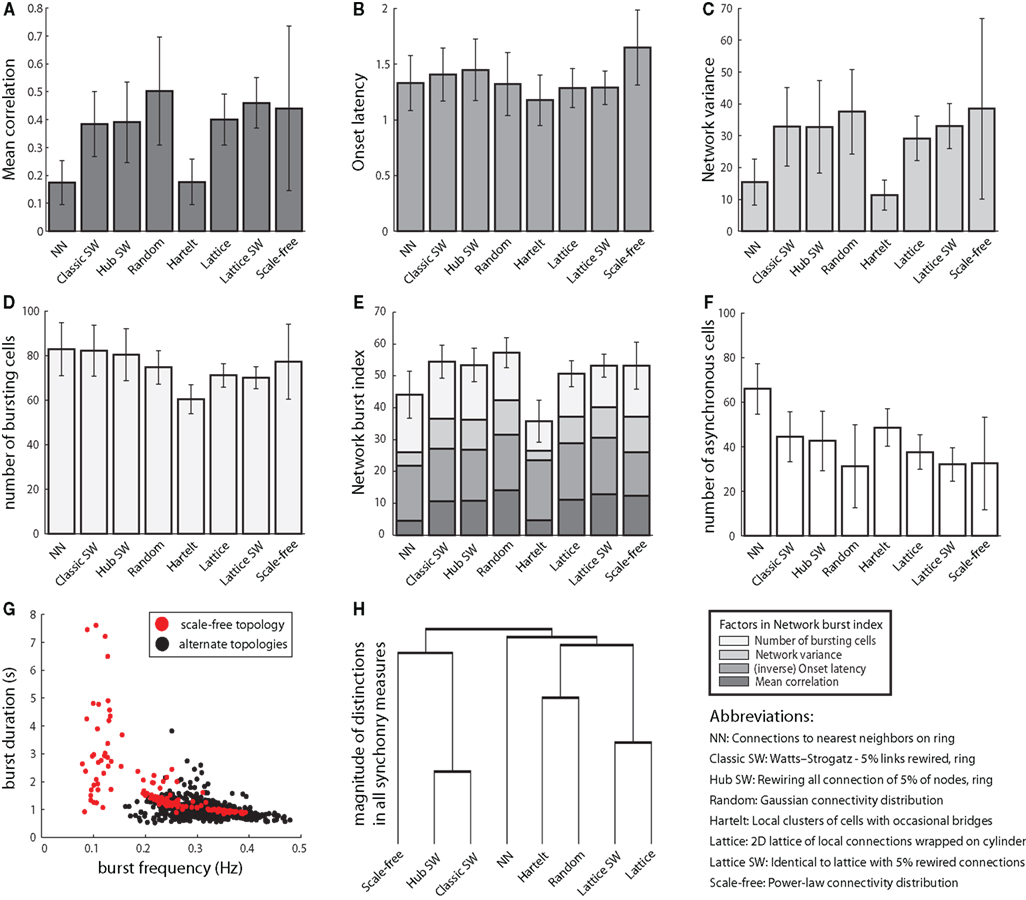
Figure 3. Network connection topology influences burst synchronization. (A) Mean correlation, a stringent measure of burst synchrony, varies significantly as a function of network structure. All results shown were produced with synaptic conductance gsyn = 5, the highest synaptic weight examined. All error bars represent ±1 SD. (B) Onset latency uses the temporal jitter in burst initiation around a network burst to assess synchrony. Lower variability in burst onset is associated with higher synchrony. In contrast to other synchrony measures it is relatively constant across topologies. (C) Network variance is the least specific measure of synchrony, corresponding to peak network activation, but not the precise burst onset and offset times. It depends on topology similarly to mean correlation. (D) The number of bursting neurons in most networks is similar, despite the distinctions in synchrony between-networks. (E) The network burst index (NBI) normalizes all of the above measures of synchrony into a single estimate of the quality of network bursting. (F) The number of asynchronous cells was calculated as the number of bursting cells that were not actively bursting during a putative network burst, averaged over all bursts. Networks with scant synchrony may still contain a large number of bursting cells. (G) Topological structure contributes to burst frequency and active phase duration. While each topology exhibits a range of burst frequencies and active phase durations, the most extreme values are all generated by the scale-free topology. (H) The vertical heights of bars in the dendrogram correspond to the magnitudes of distinctions between-networks and groups of networks as determined by MANOVA. For instance, based on the dendrogram, it can be seen that nearest neighbor and scale-free networks have distinct synchrony behavior compared to all other networks. Conversely, classic and hub small-world networks exhibit similar burst synchronization properties.
Burst onset latency showed a weaker dependence on topology that was not correlated with other synchrony measures (Figure 3B). In particular, the Hartelt network exhibited the lowest burst onset latency (low onset latency is associated with high synchrony) despite showing the least synchrony according to our other measures and the lowest number of bursting cells (Figures 3A–E; see also below).
Approximately synchronous bursts may not have exactly matching onset times but still have overlapping active burst phases that generate a strong population signal. “Network variance” quantifies the peak fluctuations in population signals, and NN and Hartelt topologies performed worse than all other topologies in this measure of synchronous bursting (p < 0.001; Figure 3C). In fact, this measure yielded results that were very similar to those from mean correlation (Figure 3A).
The “NBI” is a composite score of the three synchrony measures and the total number of bursting cells. The results of this combined synchrony assay reflect the general agreement between the individual measures other than onset latency, with the Hartelt topology and NN topologies yielding less synchronous bursting than all other networks (Figure 3E).
We had expected the level of synchrony and the number of bursting cells to covary, reasoning that a group of synchronous bursting cells within a network would achieve effective recruitment of quiescent cells due to concerted activation. Comparing the number of bursting cells to network burst synchrony in each topology (Figures 3C,D), however, illustrates that these properties may vary independently. For instance, the NN topology had the second-lowest overall mean synchrony yet the greatest number of bursting cells (Figure 3D), corresponding to a high number of asynchronously bursting cells (Figure 3F).
The average burst frequency among all simulations was 0.3–0.4 Hz, but a subset of time series yielded mean burst frequencies of approximately 0.1 Hz (Figure 3G). The long, very low frequency bursts that characterized these simulations were exclusively a product of scale-free networks, arising specifically when cells with quiescent dynamics (in isolation) were placed at hub nodes. Thus, dramatic variations in burst frequency are linked to a specific topology, in conjunction with cell dynamics. This finding agrees with previous analysis, which highlighted the role of intrinsically quiescent cells in expanding the range of possible burst frequencies in small networks (Dunmyre and Rubin, 2010).
As noted above, evaluating the burst characteristics across eight topologies, with six output measures computed for each, generated hundreds of individual comparisons. To extract a compact and coherent representation of the propensity for synchronized network bursts from all of these comparisons, we clustered the topologies, using (inverse) p-values for differences in burst synchrony as a proxy for distance (Figure 3H). The structure emerging from this clustering takes into account similarity between networks across multiple measures and also the consistency of their similarity. The adjacency of lattice networks and lattice SW networks found with this clustering affirms that these topological organizations have consistent synchrony characteristics. Also, the scale-free and NN topologies feature burst synchronization profiles that differ from those of other topologies. While Hartelt and random topologies are adjacent in the dendrogram, the vertical height of their connection indicates that they share relatively little in common; the association is simply the closest match between Hartelt and any other topology.
Cell-Type Placement in Microcircuits Affects Network Bursting
As noted above, in certain special cases, the placement of select cell types within a network can affect network dynamics. More generally, just as topology can modulate network synchrony without regard to cell-type hierarchies, cell-type hierarchies can also modulate network synchrony in a consistent fashion across different topologies. For instance, we found that locating intrinsically tonic and bursting neurons at central neuron locations was sufficient to increase correlation regardless of the specific topology, although there is a high degree of variability across simulations within each cell-type hierarchy (Figures 4A,B). As noted previously in small networks (Rubin, 2006; Dunmyre and Rubin, 2010), tonically active cells can recruit other cells. Once other cells are recruited, the resulting inputs to the intrinsically tonic cells can drive up their firing rates and inactivate their inward currents. When the cells responsible for these inputs pause, the intrinsically tonic cells cannot sustain their firing and also fall silent, but their relatively high excitability allows them to recover and resume spiking, yielding an overall network bursting pattern. Nonetheless, compared to the influence of topology on bursting, cell-type hierarchies produced smaller distinctions in burst synchrony measures (variability in Figure 4B compared to Figure 3E), indicating that cell hierarchies have a generally smaller effect on synchrony than does topology (at this level of synaptic coupling). Contrasting the effects of cell-type hierarchies by using all possible post hoc pairwise results for all synchrony measures to perform clustering showed that cell-type hierarchies with the same cell type at key positions for the most part yielded similar behaviors regardless of the subsequent ordering of cells in the hierarchy of centrality (Figure 4C).
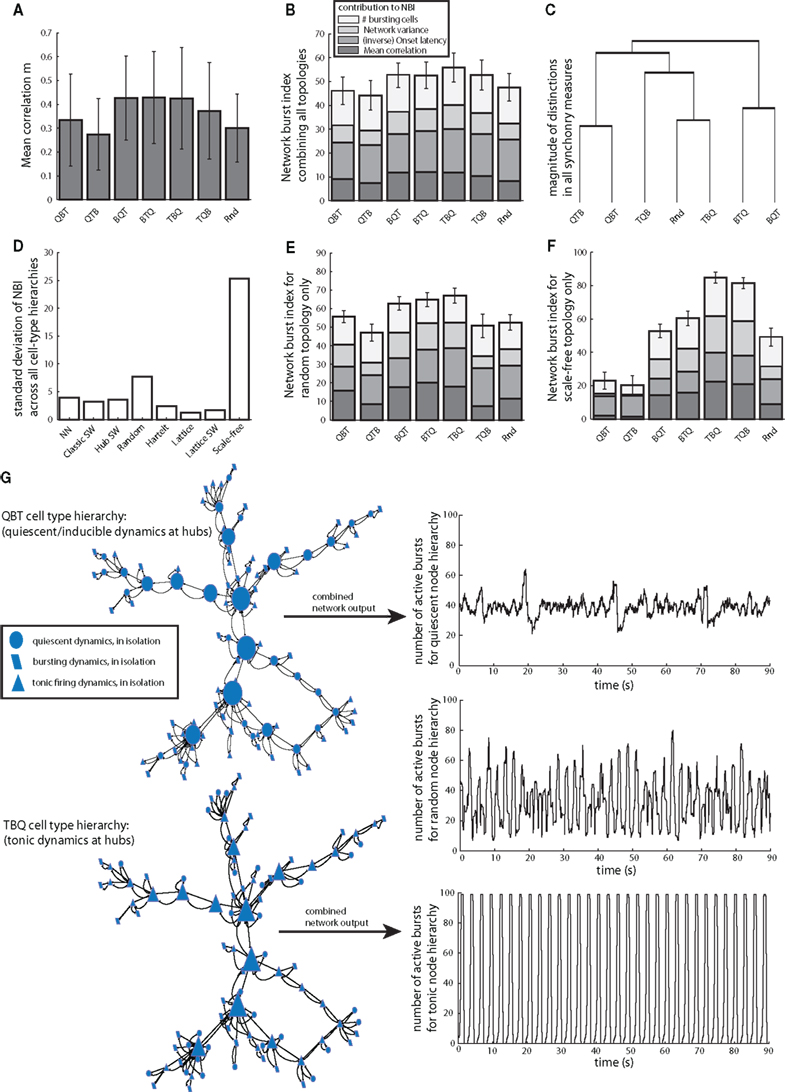
Figure 4. Cell-type hierarchies influence burst synchronization, but effects depend on topology. (A) Example of the dependence of mean synchronization on cell-type hierarchies, incorporating results collected across all topologies and cell-type hierarchies. Bar labels refer to ordering of cells in the hierarchy of betweenness centrality, for instance “QBT” has quiescent cells at the most central positions and tonic cells at the least central position (Figure 1). (B) Cell-type hierarchy affects each measure of burst synchrony, but the overall variability in estimates of network synchrony from the combination of all topologies is less than that observed when comparing topologies (Figure 3). (C) Vertical heights of bars in the dendrogram correspond to differences between cell-type hierarchies and groups of hierarchies as determined by MANOVA. Topologies with the same cell type at central positions are most similar in their synchrony measures. (D) Large SD in NBI between different cell-type hierarchies identifies network types in which the effects of cell-type hierarchies on synchrony are particularly strong. (E) Within random networks, magnitude of NBI it is greatest when cells with intrinsically bursting dynamics are located at nodes with the moderate or large betweenness. (F) Within scale-free networks, NBI is greatest when cells with intrinsically tonic activity are located at nodes with greatest betweenness. (G) Changes in NBI represent tangible changes in network synchrony. Example scale-free networks and simulation outputs, tracking the number of actively bursting cells, only rearranging the locations of cells to locate specific cell types at hub nodes. Note that in this figure, node shapes only represent intrinsic dynamics, not final dynamics in the network.
However, the effects of cell-type hierarchies are more salient within select network types. Random and especially scale-free networks showed large variations in burst synchrony as a function of cell-type hierarchy (Figures 4D–F). It may seem contradictory that cell-type arrangement could matter in random networks; however, for every random network, we evaluated the betweenness centrality and arranged cell types accordingly, just as in all other networks. Random topology networks generated greatest global synchrony when bursting cells were located at central network positions (Figure 4E) while placement of nominally tonic firing cells at the most central locations was most effective in promoting network bursts in scale-free networks (Figures 4F,G). In both cases, locating quiescent nodes (which can be induced to burst in a network) at high centrality locations resulted in low NBI values. In the case of scale-free networks, the topology/cell-type interaction was so strong that its synchrony could be either the highest or lowest of any topology, based on the specific cell-type hierarchy used (Figure 4G).
Local Synchrony, but not Global Synchrony, in the Hartelt Topology
Since SW networks have produced strong synchronization results in related systems (Netoff et al., 2004; Olfati-Saber, 2005; Shao et al., 2006), and the Hartelt topology shares the SW characteristics of relatively dense local connections complemented by occasional global links, it might be expected that the Hartelt topology would lead to robust network bursting. However, Figures 3E and 4B indicate that burst synchrony within networks with the Hartelt topology was consistently low relative to other architectures, regardless of cell-type arrangement. We tested the hypothesis that Hartelt networks might in fact generate high degrees of synchrony, but only within local clusters. Using a permutation test (see Materials and Methods), we quantified mean correlation across cells in the same cluster, compared to randomly chosen groups of equal numbers of cells. For every simulation of the Hartelt topology, across different levels of synaptic coupling and different cell-type hierarchies, this test indicated that within clusters, there was a significantly higher level of synchrony than would be expected at random (p < 0.001). Thus, a likely explanation for the low network synchrony of the Hartelt networks is that the high within cluster connectivity generated robust localized rhythms, with tightly controlled burst onsets (Figure 3C), which so entrained the cluster members that they became immune to signals from other clusters.
Relative Influence of Topology and Dynamics on Bursting Shifts with Synaptic Coupling
With no synaptic coupling, each topology consists of a collection of cells in which approximately one-third are quiescent, one-third are bursting, and one-third are tonically active. Increasing synapse weights changed the network activity and resulted in a significant increase in synchrony (p < 0.001, Figure 5A). This was accompanied by a significant increase in the number of bursting cells from the baseline 33 cells to an average of 75 cells among all topologies at the highest synapse weights.
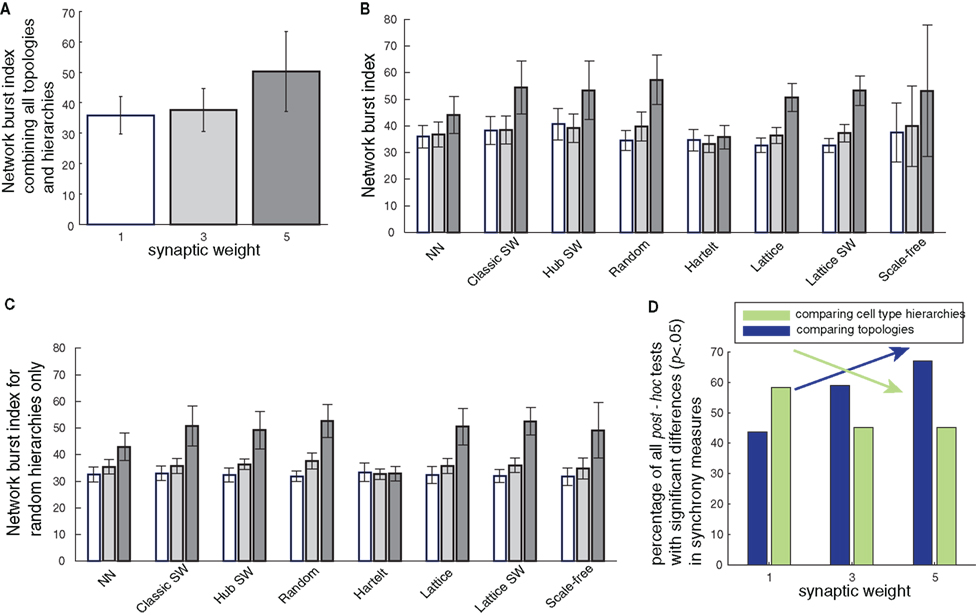
Figure 5. Interactions of synaptic coupling strength with topology and cell-type hierarchies. (A) Network synchrony (NBI) increases with increasing synaptic weight across topologies and cell-type hierarchies. (B) Increases in synchrony for different topologies under increasing synaptic weight. Each group of bars shows the NBI of different topologies for a sequence of increasing synaptic weights. (C) Demonstration that variability in NBI (indicated by error bars) is driven by cell hierarchies and not random fluctuations. Calculating the NBI for different networks based solely on simulations that used a random placement of cell types shows significantly smaller variation in network bursting than seen across all cell-type hierarchies in (B). (D) Within the broad increase in synchrony with increasing coupling, topology, and dynamics play divergent rolls. Green bars represent the number of significant differences between cell-type hierarchies for increasing levels of synaptic coupling. The trend in cell-type hierarchies shows the importance of cell-type placement on network activity declines with increasing synaptic weight. Conversely, the trend for distinctions between topologies (blue bars) shows that network architecture is responsible for a larger portion of variance in network synchrony at higher synaptic weights.
The general increase in synchrony was not evenly distributed over all topologies. However, NN and Hartelt topologies did not show statistically significant graded increases in synchrony with increasing synaptic weight, as occurred in other topologies (Figure 5B). Variance in NBI values for each synaptic weight was greatest when all topologies and cell-type hierarchies were combined, compared to the variance in NBI calculated using only a specific topology or cell-type hierarchy. This indicates that cell-type hierarchy contributes to the effects of synaptic weight on the NBI within certain fixed topologies and vice versa. Collectively, these effects suggest that there is a three-way interaction of synaptic weight with topology and cell-type hierarchies in determining network synchrony as quantified by NBI levels. For example, the variance in NBI across repeated simulations of a particular network type for the random cell-type hierarchy, which produced the most variable results of any hierarchy, was still lower than the variance found when combining results from all cell-type hierarchies (comparing height of error bars in Figure 5C vs. 5B) and specifically decreased in random and scale-free topologies at high synaptic coupling.
Within the general finding that burst synchrony increases with synaptic weight, we further examined the question of whether topology or cell-type hierarchies were stronger determinants of which simulations show extremes of synchrony, at each synaptic weight. To quantify these influences categorically over all synchrony measures at each synaptic weight, we compared the number of pairwise differences between topologies against the number of pairwise differences between cell-type hierarchies. As expected, we found that while dynamics and topology frequently interacted to influence synchrony, the relative contributions of these factors shifted depending on the synaptic weights. When a network was coupled with low synaptic weights, cell-type hierarchies were more influential in determining which networks would be synchronous, as evidenced by the percent of significant pairwise comparisons between cell-type hierarchies (Figure 5D). In contrast, the relative and absolute contributions of topology on synchrony increased with increasing synaptic weight, reflecting the increased impact of stronger connections on network dynamics.
Discussion
Principles of Network Bursting
The brain may harness interactions between the topology of connections within neuronal networks and the dynamics of individual network elements to tune local and global activity patterns and synchrony. Important questions arise about the relative importance of particular features of neuronal networks in sculpting network outputs and about how networks may synchronize despite cell-type heterogeneities. Through a sequence of comparisons across network topologies, several key factors emerge as minimal principles of burst synchronization.
Nearest neighbor ring vs. small-world
The only distinction between these topologies is that 5% of links in the NN topology are randomly rewired to different nodes in the network to form a SW topology. This decrease in average path-length produces a substantial increase in synchrony. However, this increase is not accompanied by an increase in the number of cells engaging in bursting in the coupled networks. A similar, but less dramatic, shift toward increased synchrony with decreased incidence of bursting arises with the shift from lattice to lattice SW networks. Therefore, decreasing path-length within a specific topology appears to be associated with an increase in the synchrony of bursting cells, but not in the overall prevalence of bursting. In other words, a small number of long-range connections can enhance the synchrony of bursting cells but are not more effective than local connections at recruiting additional cells to burst.
Spatial constraints on coupling: NN vs. lattice vs. random topologies
The classic transition from ring networks to SW networks to random networks (Watts and Strogatz, 1998) features changes not only in path-lengths and clustering coefficients, but also in the level of recurrence within the network. Specifically, we define recurrent connections as length-2 paths from a given source node, out to a target node, and back to the source node. As we have checked numerically in our networks and is clear intuitively, NN networks have high recurrence, while the breaking and global rewiring of local links yields lower recurrence in SW networks and still lower recurrence in random networks. This progressive loss of recurrence is linked with a decrease in asynchronous bursting cells and an increase in NBI in our simulations, although clearly recurrence is not the only factor determining network burst synchronization (e.g., Hartelt networks are less recurrent than NN). Furthermore, recall that we standardize each of our network topologies to share the same total number of links present within a randomly selected Hartelt network. Coupling in our lattice networks is less recurrent than in NN networks because in lattice networks, each node has a larger number of neighbors that are candidate targets for connections, only a subset of which are realized under the Hartelt standardization. Correspondingly, our lattice networks exhibit fewer asynchronous cells and achieve a higher NBI than seen in our NN networks, and further decreasing the recurrence by moving from a lattice to a lattice SW topology enhances these differences. A potential mechanism behind these results is that the dominance of local feedback loops in recurrent networks promotes local activity patterns that are insulated from global feedback signals. Cells in more diffuse networks receive a broad signal including input from many areas of the network, which can unify activity across regions and could potentially allow a local hotspot of bursting to spread effectively though the network.
Network characteristics associated with topology–dynamics interaction
What accounts for the increased interaction of topology and cell dynamics in random and especially scale-free networks (Figures 4D,E)? The structure of a scale-free network is self- similar, so if a cell-type hierarchy can establish a set dynamic pattern locally, then it is theoretically possible that that pattern may be repeated across different spatial scales. Furthermore, certain nodes in scale-free networks have very high betweenness centrality, higher than that found in any other network (Figure 1B, far right). The dynamics of these nodes will affect the shortest paths between many points on the network, such that these nodes mediate the interactions of many cells in the network. Consistent with this idea, the highest burst synchrony was achieved when intrinsically tonic cells were placed at high betweenness nodes. Conversely, the Hartelt network, which has the lowest maximum betweenness of all topologies, shows the least sensitivity to cell-type hierarchies. The absence of nodes of high betweenness thus is likely to constrain global network synchrony.
Topologies as constraints on synchrony, not guarantees
Based on the results observed across all networks, it appears that certain topology characteristics may promote network bursting, yet these features do not ensure particular outcomes. For instance, in our simulations, no networks with high path-length show high burst synchrony, suggesting that low path-length may be necessary for bursting; however, low path-length does not guarantee synchrony (as the Hartelt topology has low path-length). As another example, a large number of bursting cells within the coupled network may be associated with high synchrony, due to a unification of network dynamics, but may also arise without strong global synchrony (as in NN networks), perhaps due to dominance of local interactions. Similarly, direct local feedback in topologies encourages bursting, but it will likely be asynchronous when measured across the whole network unless the local feedback is balanced or even dominated by more diffuse connections as in random networks. Network topology does appear to constrain synchrony, as the overall level of burst synchronization in certain architectures remains relatively low regardless of cell-type hierarchy (Figure 5B, column heights and error bars). For other topologies where strong synchronization may occur, it is not guaranteed, but instead depends on cell-type hierarchies, as is particularly evident in scale-free networks. Thus, certain graph characteristics, such as low path-length and a sufficient diffusivity of connections, within a network can be considered as a minimal set of conditions conducive to strong network burst synchrony, but these factors do not guarantee synchrony, and should be considered in tandem with cell-type heterogeneity.
Implications and Interpretations of Low Synchronization in the Hartelt Topology
Variations in synchrony across the suite of topologies that we have considered are useful in understanding the origin of the low synchrony that we observe in the Hartelt topology. Despite the low average path-length of the Hartelt topology, it is visually clear that groups of nodes form spatially isolated clusters within the network graph. This local isolation may also be found in NN networks. Both Hartelt and NN topologies show large numbers of asynchronous cells as well as similarly small increases in synchrony with increases in synaptic weight. Indeed, we conjecture that the burst synchronization characteristics of the Hartelt topology resemble those of the NN topology because, like NN networks, Hartelt networks feature strong recurrent local linkages and lack global signaling, such that local connections and cell types largely determine cells’ dynamics. Concordantly, our permutation tests did show greater than expected local synchrony within the clusters in the Hartelt topology. This local synchrony could actually impede the establishment of global synchrony, as the input that each neuron receives from within its cluster is so concerted that between-cluster links are ineffective in resetting the burst phase to match a global frequency.
Examining the interactions between two or three linked Hartelt clusters in future work would aid in understanding the mechanisms that maintain desynchronization across clusters despite local synchronization and in exploring how synchrony changes over a range of within-cluster to between-cluster link ratios. One future experiment that could shed light on precisely how certain network structures facilitate bursting would be to initiate bursting in a single cell in an uncoupled network and then turn on connections between neurons in a certain pattern, to see how such activity spreads or is suppressed by particular topological features.
How can we resolve the disparity between the robust network bursts seen in the pre-BötC network in intact experimental preparations (Smith et al., 2007) and the poor network burst performance of the Hartelt topology in our simulations? One possibility is that putative synchronized bursting in the pre-BötC in actuality consists of phases of tonic spiking, interrupted by the arrival of strong synaptic inhibition (Rybak et al., 2007; Smith et al., 2007; Rubin et al., 2009b). While this possibility may indeed arise in vivo under normal conditions, however, burst synchrony is also observed in pre-BötC slice preparations under a blockade of inhibition (Smith et al., 1991). Alternatively, it is possible that the inclusion of other channels known to contribute to bursting in at least a subset of pre-BötC neurons (Pace et al., 2007; Rubin et al., 2009a; Toporikova and Butera, 2010; Dunmyre et al., 2011) may significantly alter network burst synchronization, and this possibility will be considered in future work. Similarly, a dramatically different balance of intrinsically quiescent, bursting, and tonic cells might also increase network burst synchrony, as might the inclusion of additional heterogeneities in synaptic conductances. Finally, another possibility to consider is that the slice preparation on which our connectivity estimates are based underestimated the number of between-network links, which seems plausible given that only a portion of the pre-BötC was extracted. Correspondingly, a realistic increase in inter-cluster links might increase synchrony toward experimentally observed levels, and a systematic increase in the prevalence of these links will also be investigated in the future.
Additional Relevance and Limitations
Applicability to biological systems
Our purpose in categorically placing certain cell types at distinct levels of the centrality hierarchy was to explore whether it is possible to tune the burst synchrony of various topologies through this manipulation. The likelihood that a specific cell type is uniformly located at a particular centrality level is debatable. However, areas such as the cerebellum do exhibit dramatic degree heterogeneity among a large collection of electrophysiologically distinct cell types, each of which occupies stereotypical positions within a local microcircuitry (Ohyama et al., 2003). Therefore, the brain does contain microcircuits that are relevant analogs for our cell-type hierarchies and topology comparisons. Also, alterations to biological hubs are associated with disease, so it is important to understand how network dynamics may be influenced through changes in cell properties at critical nodes (Stam et al., 2007; Morgan and Soltesz, 2008).
Limitations of biological detail in simulations of the pre-BötC
We recreate the connectivity statistics shown in Figure 5 of Hartelt et al. (2008) as precisely as possible, but there is some ambiguity in how to interpret the results of that paper, in light of disparities between distributions of connection numbers shown by histograms and SD stated to be associated with these data. As with any simulation, the discovery and inclusion of additional biological details that further characterize the pre-BötC connection architecture, or homeostatic feedback mechanisms that alter cellular conductances to promote synchronized bursting, could potentially affect our results. As discussed above, our simulations do not include the CAN current, which is critical for bursting in at least a subset of pre-BötC neurons (Pace et al., 2007). Incomplete information is available on the proportion of cell types, defined by intrinsic dynamics in the absence of coupling, present within the pre-BötC, so we tested an even split of cell types; additional investigation of changes in network burst synchronization within each case due to alterations in these proportions is beyond the scope of our analysis, given the large number of variations we have already considered.
We did not incorporate synaptic delays in our simulations; however, delays within clusters would be expected to be smaller than those between clusters, and thus we expect that realistic delays would only worsen the already poor inter-cluster synchrony we found in the Hartelt network. We choose to normalize the maximal input a cell could receive to a constant value, regardless of the number of inputs, in order to facilitate more direct comparisons between topologies. It is possible that this normalization is biologically justified, based on homeostatic mechanisms or limitations of the molecular resources needed to support synaptic channels, but it is also possible that a weaker form of normalization or an absence of normalization is more appropriate for pre-BötC circuits and other particular neuronal networks.
Constraints on the applicability of our results to other systems
The number of links in each topology is set to exactly match that of a corresponding Hartelt network, and the resulting low number of links leads to clustering coefficients in our SW networks that are lower than those typically expected. Therefore, our SW networks do not meet the full specification of SW as highly clustered that is usually presented in the literature (although they do have low path-length and mainly local connections), and this issue could affect development of synchrony in those networks. To check for this effect, we generated a new set of SW networks with a 50% greater number of links and repeated all synchrony tests. Results for all networks in all synchrony measures were very similar to what we have reported for our original networks, despite increased connectivity and higher clustering coefficients. More generally, our networks can be thought of as discrete points in a high-dimensional network space, in which properties, such as averages and higher moments of path-lengths, clustering coefficients, in- and out-degrees, and many others, can vary systematically. Future work is needed to explore effects of systematic variations in these network parameters, but our results hint that analysis will be complicated by the interactions of properties.
Our characterization of the burst synchrony properties of different topologies is based on using very specific cell dynamics. Results from square-wave bursting cells may not extend to spike synchrony in more general cortical models. Indeed, our results highlight the interaction of topology and dynamics, and thus any alternative system of cells featuring different forms of dynamics may show different behavior than that reported in our study. However, although specific activity patterns may differ, the broadly distinct synchronization properties that we found across NN, SW, Hartelt (or other architectures featuring dense local clusters and sparse inter-cluster connections), and scale-free topologies (in short the families shown in Figure 3H) will likely persist.
Conclusion
Results from numerous brain systems illustrate that the topological organization of interacting neurons is important in generating or directing ongoing dynamics. The SW concept of low path-length and high clustering, for example, has repeatedly been linked to efficient information transfer and swift network synchronization. But how these results relate to the performance of other topologies in networks with realistic cellular dynamics and heterogeneities is rarely explored. In contrast to the general emphasis on topology directing network dynamics, we show that burst synchrony is a function of both network topology and the dynamics of cells located at central locations within the topology. These two features interact to control network burst synchrony, and the balance of this interaction depends on the nature of each topology and on the strengths of synaptic connections within the network. Thus, while particular features of connection topologies can be linked to certain trends in burst synchronization, specific topologies cannot be considered to have a single characteristic effect on network outputs when implemented in realistic neuronal systems.
Conflict of Interest Statement
The authors declare that the research was conducted in the absence of any commercial or financial relationships that could be construed as a potential conflict of interest.
Acknowledgments
This work was partially supported by NSF grants DMS 0716936 and DMS 1021701.
References
Achard, S., Salvador, R., Whitcher, B., Suckling, J., and Bullmore, E. (2006). A resilient, low-frequency, small-world human brain functional network with highly connected association cortical hubs. J. Neurosci. 26, 63–72.
Bassett, D. S., Meyer-Lindenberg, A., Achard, S., Duke, T., and Bullmore, E. (2006). Adaptive reconfiguration of fractal small-world human brain functional networks. Proc. Natl. Acad. Sci. U.S.A. 103, 19518–19523.
Best, J., Borisyuk, A., Rubin, J., Terman, D., and Wechselberger, M. (2005). The dynamic range of bursting in a model respiratory pacemaker network. SIAM J. Appl. Dyn. Syst. 4, 1107–1139.
Bonifazi, P., Goldin, M., Picardo, M. A., Jorquera, I., Cattani, A., Bianconi, G., Represa, A., Ben-Ari, Y., and Cossart, R. (2009). GABAergic hub neurons orchestrate synchrony in developing hippocampal networks. Science 326, 1419–1424.
Brockhaus, J., and Ballanyi, K. (1998). Synaptic inhibition in the isolated respiratory network of neonatal rats. Eur. J. Neurosci. 10, 3823–3839.
Bullmore, E., and Sporns, O. (2009). Complex brain networks: graph theoretical analysis of structural and functional systems. Nat. Rev. Neurosci. 10, 186–198.
Butera, R., Rubin, J., Terman, D., and Smith, J. (2005). “Oscillatory bursting mechanisms in respiratory pacemaker neurons and networks,” in Bursting: The Genesis of Rhythm in the Nervous System, eds S. Coombes and P. C. Bressloff (Singapore: World Scientific), 303–346.
Butera, R. J., Rinzel, J., and Smith, J. C. (1999a). Models of respiratory rhythm generation in the pre-Bötzinger complex. I. Bursting pacemaker neurons. J. Neurophysiol. 82, 382–397.
Butera, R. J., Rinzel, J., and Smith, J. C. (1999b). Models of respiratory rhythm generation in the pre-Bötzinger complex. II. Populations of coupled pacemaker neurons. J. Neurophysiol. 82, 398–415.
Dunmyre, J. R., Del Negro, C. A., and Rubin, J. E. (2011). Interactions of persistent sodium and calcium-activated nonspecific cationic currents yield dynamically distinct busting regimes in a model of respiratory neurons. J. Comput. Neurosci. doi: 10.1007/s10827-010-0311-y. [Epub ahead of print].
Dunmyre, J. R., and Rubin, J. E. (2010). Optimal intrinsic dynamics for bursting in a three-cell network. SIAM J. Appl. Dyn. Syst. 9, 154–187.
Feldman, J. L., and Del Negro, C. A. (2006). Looking for inspiration: new perspectives on respiratory rhythm. Nat. Rev. Neurosci. 7, 232–242.
Feldman, J. L., and Smith, J. C. (1989). Cellular mechanisms underlying modulation of breathing pattern in mammals. Ann. N. Y. Acad. Sci. 563, 114–130.
Hartelt, N., Skorova, E., Manzke, T., Suhr, M., Mironova, L., Kügler S, and Mironov, S. L. (2008). Imaging of respiratory network topology in living brainstem slices. Mol. Cell. Neurosci. 37, 425–431.
Jeong, H., Mason, S. P., Barabási, A. L., and Oltvai, Z. N. (2001). Lethality and centrality in protein networks. Nature 411, 41–42.
Liu, Y., Liang, M., Zhou, Y., He, Y., Hao, Y., Song, M., Yu, C., Liu, H., Liu, Z., and Jiang, T. (2008). Disrupted small-world networks in schizophrenia. Brain 131, 945–961.
Morgan, R. J., and Soltesz, I. (2008). Nonrandom connectivity of the epileptic dentate gyrus predicts a major role for neuronal hubs in seizures. Proc. Natl. Acad. Sci. U.S.A. 105, 6179–6184.
Netoff, T. I., Clewley, R., Arno, S., Keck, T., and White, J. A. (2004). Epilepsy in small-world networks. J. Neurosci. 24, 8075–8083.
Ohyama, T., Nores, W. L., Murphy, M., and Mauk, M. D. (2003). What the cerebellum computes. Trends Neurosci. 26, 222–227.
Olfati-Saber, R. (2005). “Ultrafast consensus in small-world networks,” in Proceedings of the 2005 American Control Conference (IEEE), Portland, OR, 2371–2378.
Pace, R. W., Mackay, D. D., Feldman, J. L., and Del Negro, C. A. (2007). Inspiratory bursts in the preBotzinger complex depend on a calcium-activated non-specific cation current linked to glutamate receptors in neonatal mice. J. Physiol. 582, 113–125.
Purvis, L. K., Smith, J. C., Koizumi, H., and Butera, R. J. (2007). Intrinsic bursters increase the robustness of rhythm generation in an excitatory network. J. Neurophysiol. 97, 1515–1526.
Rubin, J., and Terman, D. (2002). Synchronized activity and loss of synchrony among heterogeneous conditional oscillators. SIAM J. Appl. Dyn. Syst. 1, 146–174.
Rubin, J. E. (2006). Bursting induced by excitatory synaptic coupling in nonidentical conditional relaxation oscillators or square-wave bursters. Phys. Rev. E. Stat. Nonlin. Soft Matter Phys. 74, 021917.
Rubin, J. E., Hayes, J. A., Mendenhall, J. L., and Del Negro, C. A. (2009a). Calcium-activated nonspecific cation current and synaptic depression promote network-dependent burst oscillations. Proc. Natl. Acad. Sci. U.S.A. 106, 2939–2944.
Rubin, J. E., Shevtsova, N. A., Ermentrout, G. B., Smith, J. C., and Rybak, I. A. (2009b). Multiple rhythmic states in a model of the respiratory central pattern generator. J. Neurophysiol. 101, 2146–2165.
Rybak, I. A., Abdala, A. P., Markin, S. N., Paton, J. F., and Smith, J. C. (2007). Spatial organization and state- dependent mechanisms for respiratory rhythm and pattern generation. Prog. Brain Res. 165, 201–220.
Shao, J., Tsao, T.-H., and Butera, R. (2006). Bursting without slow kinetics: a role for a small world? Neural. Comput. 18, 2029–2035.
Smith, J. C., Abdala, A. P., Koizumi, H., Rybak, I. A., and Paton, J. F. (2007). Spatial and functional architecture of the mammalian brain stem respiratory network: a hierarchy of three oscillatory mechanisms. J. Neurophysiol. 98, 3370–3387.
Smith, J. C., Ellenberger, H. H., Ballanyi, K., Richter, D. W., and Feldman, J. L. (1991). Pre-Botzinger complex: a brainstem region that may generate respiratory rhythm in mammals. Science 254, 726–729.
Srinivas, K. V., Jain, R., Saurav, S., and Sikdar, S. K. (2007). Small-world network topology of hippocampal neuronal network is lost, in an in vitro glutamate injury model of epilepsy. Eur. J. Neurosci. 25, 3276–3286.
Stam, C. J., Jones, B. F., Nolte, G., Breakspear, M., and Scheltens, P. (2007). Small-world networks and functional connectivity in Alzheimer’s disease. Cereb. Cortex 17, 92–99.
Toporikova, N., and Butera, R. J. (2010). Two types of independent bursting mechanisms in inspiratory neurons: an integrative model. J. Comput. Neurosci. doi:10.1007/s10827-010-0274-z. [Epub ahead of print]
van den Heuvel, M. P., Stam, C. J., Boersma, M., and Pol, H. E. H. (2008). Small-world and scale-free organization of voxel-based resting-state functional connectivity in the human brain. Neuroimage 43, 528–539.
Wang, J., Wang, L., Zang, Y., Yang, H., Tang, H., Gong, Q., Chen Z, Zhu, C., and He, Y. (2009a). Parcellation-dependent small-world brain functional networks: a resting-state fMRI study. Hum. Brain Mapp. 30, 1511–1523.
Wang, J., Zhang, S., Wang, Y., Chen, L., and Zhang, X.-S. (2009b). Disease-aging network reveals significant roles of aging genes in connecting genetic diseases. PLoS Comput. Biol. 5, e1000521. doi: 10.1371/journal.pcbi.1000521
Keywords: pre-Bötzinger complex, small-world, scale-free, burst synchrony, respiration, network dynamics, network topology
Citation: Gaiteri C and Rubin JE (2011) The interaction of intrinsic dynamics and network topology in determining network burst synchrony. Front. Comput. Neurosci. 5:10. doi: 10.3389/fncom.2011.00010
Received: 16 October 2010;
Accepted: 10 February 2011;
Published online: 18 February 2011.
Edited by:
Ad Aertsen, Albert Ludwigs University, GermanyCopyright: © 2011 Gaiteri and Rubin. This is an open-access article subject to an exclusive license agreement between the authors and Frontiers Media SA, which permits unrestricted use, distribution, and reproduction in any medium, provided the original authors and source are credited.
*Correspondence: Jonathan E. Rubin, Department of Mathematics, University of Pittsburgh, 301 Thackeray Hall, Pittsburgh, PA 15260, USA. e-mail:cnViaW5AbWF0aC5waXR0LmVkdQ==