
 Florian Diehl1
- 1 Institute of Neurobiology, Ulm University, Ulm, Germany
- 2 School of Biological Sciences, Illinois State University, Normal, IL, USA
The perception of proprioceptive signals that report the internal state of the body is one of the essential tasks of the nervous system and helps to continuously adapt body movements to changing circumstances. Despite the impact of proprioceptive feedback on motor activity it has rarely been studied in conditions in which motor output and sensory activity interact as they do in behaving animals, i.e., in closed-loop conditions. The interaction of motor and sensory activities, however, can create emergent properties that may govern the functional characteristics of the system. We here demonstrate a method to use a well-characterized model system for central pattern generation, the stomatogastric nervous system, for studying these properties in vitro. We created a real-time computer model of a single-cell muscle tendon organ in the gastric mill of the crab foregut that uses intracellular current injections to control the activity of the biological proprioceptor. The resulting motor output of a gastric mill motor neuron is then recorded intracellularly and fed into a simple muscle model consisting of a series of low-pass filters. The muscle output is used to activate a one-dimensional Hodgkin–Huxley type model of the muscle tendon organ in real-time, allowing closed-loop conditions. Model properties were either hand tuned to achieve the best match with data from semi-intact muscle preparations, or an exhaustive search was performed to determine the best set of parameters. We report the real-time capabilities of our models, its performance and its interaction with the biological motor system.
Introduction
The perception of proprioceptive signals that report the internal state of the body is one of the essential tasks of the nervous system, because it adapts ongoing motor activity to changes in the environment or the body (review in Pearson, 1986; Grillner, 2003; Pearson, 2004). In fact, phasic proprioceptive feedback contributes significantly to the motor output in many rhythmic motor systems (Rossignol et al., 2006; Ausborn et al., 2007). It is thus often regarded as an integral part of the rhythm generating machinery (Pearson, 2004), even if the basic motor pattern can still be expressed after removing all sensory input.
The effects of sensory organs on motor circuits have been demonstrated in many systems, typically using open-loop conditions, i.e., with emphasis on how sensory signals alter motor output, or information flows toward that output. Sensory activity itself, however, remains unaffected by motor output in these conditions despite the fact that the nervous system always acts in closed-loop conditions in behaving animals. The dynamical components determined by the interaction of motor and sensory activities can create emergent properties that govern the functional characteristics of the system (Lehmann and Dickinson, 2000; Büschges, 2005). While already a standard for investigating movement or behavior in general (e.g., fly and bee flight: Dickinson, 2005; Fry et al., 2008; Mronz and Lehmann, 2008; Sareen et al., 2011; Srinivasan, 2011; monkey motor control and vision: Nicolelis, 2003; robotics: Novellino et al., 2007), the idiosyncratic dynamics created by the sensorimotor interaction have only rarely been elucidated on the levels of networks and single neurons. In the few instances in which they have been studied (Bässler and Nothof, 1994; Ausborn et al., 2007, 2009; Smarandache et al., 2008), it is obvious that they play an important role in shaping the motor output.
On the other hand, the functional and circuit properties as well as the cellular characteristics of many pattern generating networks are known in great detail. This is particularly true for central pattern generators, which often govern basic, but essential behaviors such as breathing, heartbeat, or chewing (Briggman and Kristan, 2008) and can be studied in isolation from the body. They allow access to the cellular level for investigations, but sensory feedback (in contrast to sensory input) is not available due to missing sensory structures. One way to circumvent this problem is to provide artificial sensory feedback in real-time which is altered according to the motor activity. In most systems this is not feasible since either the sense organs or the sensory activity are too complex to be understood sufficiently to serve as foundation for feedback calculation, or the sensory activity cannot be provided in real-time.
We here demonstrate a method how to use a well-characterized model system for central pattern generation, the stomatogastric nervous system (STNS; Nusbaum and Beenhakker, 2002; Marder and Bucher, 2007; Stein, 2009), for real-time closed-loop investigations of proprioceptive feedback. We use a cellular model of the anterior gastric receptor (AGR), a single-cell muscle tendon organ in the gastric mill of the crab foregut, which processes motor activity in real-time to provide computer-generated sensory feedback.
Materials and Methods
Animals and Preparation
Adult crabs, Cancer pagurus, were purchased from commercial sources (Feinfisch GmbH, Neu-Ulm, Germany). Animals were kept in filtered aerated artificial seawater (10–12°C). Animals were anesthetized by packing them on ice for 30–40 min. Experiments were performed on the isolated STNS preparation (Figure 1). Dissections were carried out as previously described in Gutierrez and Grashow (2009). Experiments were carried out in accordance with the European Communities Council Directive of November 24, 1986 (86/609/EEC) and with the guidelines laid down by the US National Institutes of Health regarding the care and use of animals for experimental procedures.
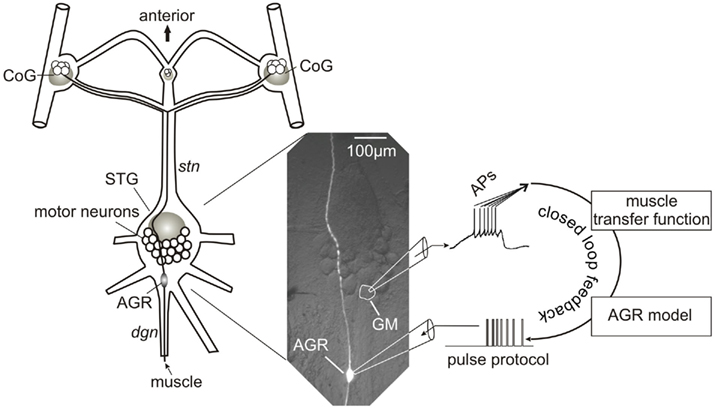
Figure 1. Schematic representation of experimental setup and closed-loop design. The spike activity of a GM motor neuron was recorded using a sharp microelectrode and corresponding intracellular amplifier. Action potentials were detected and used to calculate the muscle response in madSim. The muscle activity activated the cellular AGR model, whose action potentials were then used to drive current injection into the biological AGR. AGR was recorded from, and injected into, its soma from which its spike activity can be controlled (Smarandache and Stein, 2007). Each action potential generated in the model elicited an action potential in the biological AGR. STG, stomatogastric ganglion; CoG, commissural ganglion; stn, stomatogastric nerve; dgn, dorsal gastric nerve; GM, gastric mill motor neuron; AGR, anterior gastric receptor; APs, action potentials.
Solutions
During all recordings in the Petri-dish, preparations were superfused continuously with chilled (10–13°C) C. pagurus saline. Saline had the following compositions [mM*l−1]: NaCl, 440; MgCl2, 26; CaCl2, 13; KCl, 11; trisma base, 10; maleic acid, 5; pH 7.4–7.6. In some experiments, CsCl2 was added to the saline at concentrations between 1 and 5 mM.
Dissection and Electrophysiology
The isolated STNS preparation (Figure 1) was pinned down in a silicone elastomer-lined (ELASTOSIL RT-601, Wacker, Munich, Germany) Petri-dish and continuously superfused (7–12 ml/min) with physiological saline. Standard techniques were used for extracellular and intracellular recordings (for details see Stein et al., 2005). Petroleum jelly-based cylindrical compartments were used to electrically isolate nerve sections from the bath. One of two stainless steel electrodes was placed inside the compartment to record the activity on the nerve. The other wire was placed in the bath as reference electrode. Extracellular signals were recorded, filtered, and amplified through an amplifier from AM Systems (Model 1700, Carlsborg, WA, USA). To facilitate intracellular recordings, we desheathed the stomatogastric ganglion (STG) and visualized it with white light transmitted through a darkfield condenser (Nikon, Tokyo, Japan). Sharp microelectrodes (15–25 MΩ) were filled with a solution containing 0.6 M K2SO4 and 0.02 M KCl. Intracellular current injections were accomplished using either an NPI NEC 10L amplifier (NPI Electronic GmbH, Tamm, Germany) or an Axoclamp 2B amplifier (Molecular devices, Sunnyvale, CA, USA) in bridge mode, discontinuous current clamp (switching frequency 10–15 kHz for NPI and 2–3 kHz for Axoclamp) or single electrode voltage clamp. STG neurons were identified by their activity patterns, synaptic interactions, and axonal projection pathways, as described previously (Weimann et al., 1991; Bartos and Nusbaum, 1997; Blitz and Nusbaum, 1997). The activity of the AGR neuron was monitored either via intracellular recordings from its soma in the STG or via extracellular recordings from the dorsal gastric nerve (dgn), stomatogastric nerve (stn), supraesophageal nerve (son) or anterior gastric nerve (agn). Activity was measured as the number of action potentials per burst, the mean intraburst spike frequency, burst duration, as instantaneous frequency or average firing frequency of an arbitrarily chosen section of the recording.
Data Analysis
Data were recorded onto computer hard disk using Spike2 (ver. 6.02–6.12; CED, Cambridge, UK) and a micro 1401 board (CED). Data were analyzed using Spike2 script language. Individual scripts are available at http://www.neurobiologie.de/spike2. Final figures were prepared with CorelDraw (version 12–15 for Windows). Graphics and statistics were generated using Excel (Microsoft) or Origin (version 7.0237; Northampton, MA, USA). Normally distributed data were tested with a non-directional paired t-test. A non-directional Wilcoxon signed rank test was used for all other data. Data are either presented as mean ± SD or as box plots containing median, minimum and maximum, upper and lower quartiles, and mean. N refers to the number of animals, n to the number of trials. For all statistical tests, significance with respect to control is indicated on the figures using the following symbols: *p < 0.05, **p < 0.01, ***p < 0.001.
Computational Model
To investigate the impact of AGR’s intrinsic properties within sensory information processing, we built a single compartment computational model in the simulation environment madSim (Ausborn et al., 2007, 2009; Stein et al., 2008; freely available at www.neurobiologie.de/madSim). The passive properties were implemented and modified after Ekeberg et al. (1991). Active membrane properties were implemented according to SWIM-conductances (Wallen et al., 1992), which are based on Hodgkin–Huxley equations (Hodgkin and Huxley, 1952; Ekeberg et al., 1991). Basic parameters for active membrane properties (c) were represented by the following equation:

Where Vm is the membrane potential, Ec is the reversal potential of the current in question. Gc is defined as the maximum conductance, p and q are integer values. The activation (a) and inactivation (b) parameters are each described by a first-order differential equation:

αa describes the opening rate of the channel’s gates. βa describes the same for the closing rate. The parameter forms for α and β for each channel were taken from Buchholtz et al. (1992). The opening and closing rates for the activation of the fast sodium and the voltage dependent potassium current are described by the following term:
Where k is the rate constant, E the equilibrium potential for the respective ion, Vo represents the half-maximum potential and s is the Step width. The inactivation gate of the fast sodium channel is described by term 4:
α of the sag-current (Ih) is also described by term 4 with k = 1. β adopts the rate constant k. The activation kinetics of the two calcium channels are following term 4 for parameter α with −s instead of s; β is described by the rate constant k. α (inactivation) adopts k = 1. α and β (activation) of the calcium-dependent potassium current follow term 4 with −s instead of s.
The parameter-values and maximal conductances were hand tuned for each conductance to best match the data. Voltage clamp experiments were conducted to tune Ih. The parameters of other conductances were estimated by comparing the model response with the biological response (spike frequency adaptation, resting potential, and duty cycle). The values for each parameter are given in Appendix 1.
In some experiments, the model received input from the biological system via the analog input of a National Instruments A/D board (PCI 6221; Austin, TX, USA) and generated output to the biological nervous system via one of its analog outputs.
Results
The gastric mill central pattern generator in the STG has been studied in great detail (Bartos and Nusbaum, 1997; Nusbaum and Beenhakker, 2002; Stein et al., 2007; Stein, 2009). Its connectivity and cellular components are well-characterized, as are sensory feedback pathways (Katz and Harris-Warrick, 1989; Katz et al., 1989; Katz, 1998; Birmingham, 2001; Birmingham and Tauck, 2003; Beenhakker et al., 2004, 2005; Blitz et al., 2004, 2008; Billimoria et al., 2006; Le et al., 2006; Barriere et al., 2008) and muscle properties (Jorge-Rivera and Marder, 1996; Jorge-Rivera et al., 1998; Stein et al., 2006). This makes this system attractive to test the effect of realistic closed-loop proprioceptive feedback on motor pattern generation. The muscle tendon organ AGR, a single neuron, has been examined extensively (Simmers and Moulins, 1988a,b; Norris et al., 1994; Smarandache and Stein, 2007; Smarandache et al., 2008; Hedrich et al., 2009) due to the unique access to its soma. This provided us with the prerequisites to create realistic artificial sensory feedback: our approach was to create a computer model that recreates the response properties of AGR, processes the motor activity currently present in real-time and activates AGR according to the model activity (Figure 1).
Anterior gastric receptor’s soma is located in the STG, which allowed us to investigate its response characteristics (Figures 2 and 3) using extracellular nerve recordings and intracellular recordings from the soma and to control its firing with current injections (Figure 2A). The first was necessary to determine the basic response properties of AGR in order to create the model. The latter allowed us to feed the model activity back into the system such that the computer model predefined and controlled the spike activity of the biological AGR.
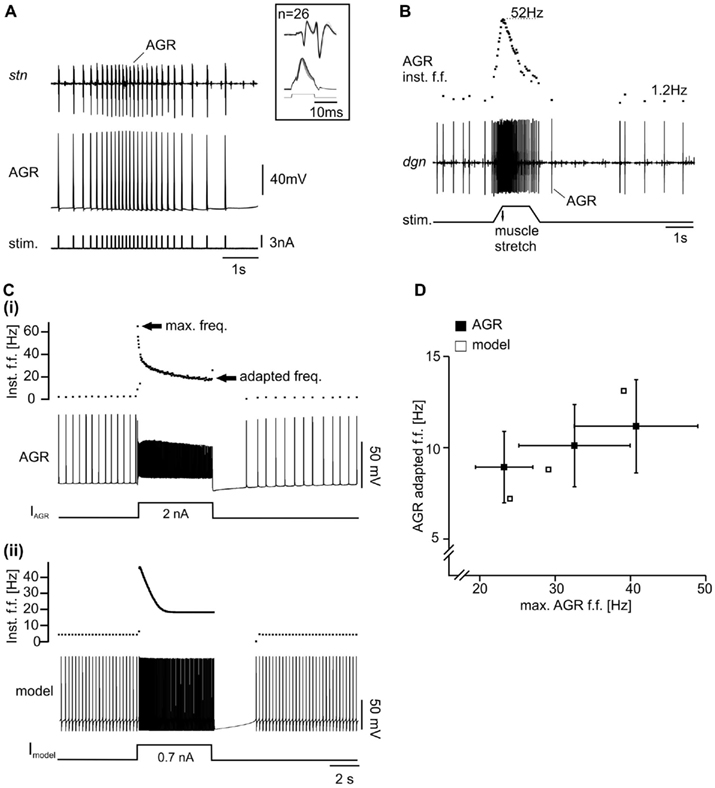
Figure 2. Properties of biological and model AGR. (A) Intracellular recording of AGR during injection of current pulses along with extracellular recording of the stomatogastric nerve (stn), which contains the AGR axon. Each current pulse elicited an action potential in AGR – a prerequisite for the specific activation of AGR with the model neuron. Inset: overlay of multiple sweeps of AGR stimulation. (B) Extracellular recording of the dgn, which also contains the AGR axon. Here, AGR still innervated the gm1 muscle (“semi-intact preparation”). When the muscle was stretched passively, AGR activity increased. After an initial peak in firing frequency (top trace) AGR activity dropped even though the muscle remained stretched. Upon release of the muscle, AGR activity stopped. Spontaneous tonic activity resumed after a few seconds. Inst. f.f., instantaneous firing frequency. [(C)(i)] Example intracellular recording of AGR along with plot of AGR instantaneous firing frequency. Upon tonic depolarization by current injection AGR firing frequency increased. After reaching an initial peak, spike frequency decreased to a constant level (“adapted frequency”). Most hyperpolarized membrane potential −70 mV. (ii) Similar experiment in the model. Most hyperpolarized membrane potential −82 mV. (D) Comparison of maximum and adapted AGR firing frequencies in the model and in the biological neuron. The adapted frequency was measured at the end of the 5-s stimulation.
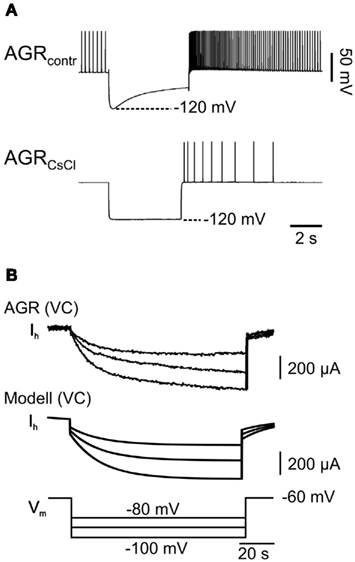
Figure 3. Hyperpolarization-activated inward current in model and biological AGR. (A) AGR displays a prominent sag toward depolarized membrane potentials when it is held hyperpolarized with current injection (top). This sag could be blocked almost entirely by applying CsCl, which is consistent with the presence of a hyperpolarization-activated inward current (Ih) similar to those in other STG neurons (Golowasch and Marder, 1992). (B) Comparison of Ih in model (bottom) and biological AGR (top). Here, AGR was recorded in voltage clamp and membrane potentials were stepped from −60 to −80, −100, and −120 mV. Time course and maximum current were similar.
Building the AGR Model
To build an initial model, we focused on three prominent properties of AGR that define AGR activity: (1) AGR shows spontaneous tonic activity in a low frequency range (Daur et al., 2009). (2) Once activated, AGR shows a distinct spike frequency adaptation which is present both when the tendon organ is activated by muscle stretch (Figure 2B; an experimental paradigm also used to assess the spike activity of this muscle tendon organ in Combes et al., 1995 and Smarandache and Stein, 2007) and when it is depolarized above spike threshold with current injections (Figure 2Ci). After an initial peak the firing frequency drops to about 20% of the maximum (see also Smarandache and Stein, 2007). (3) If hyperpolarized, AGR shows a slow depolarization of the membrane potential despite persisting hyperpolarizing current injection (sag potential; Figure 3A, top). The depolarization was apparently caused by a slow inward current that was activated by hyperpolarization (Figure 3B) and blocked by CsCl (Figure 3A, bottom). Similar currents have been shown to be present in other stomatogastric neurons (Ih; Buchholtz et al., 1992).
The AGR model was created using the computer software madSim (Ausborn et al., 2007; Stein et al., 2008; see also Materials and Methods). We created a single compartment model that represented the AGR response using Hodgkin–Huxley type equations. We considered the main properties obvious in intracellular recordings of AGR: (1) Resting potential and spike threshold were directly determined by recording the AGR soma in current clamp (N = 20). (2) The sag potential was modeled with a non-inactivating hyperpolarization-activated cation current based on the equations described in Buchholtz et al. (1992). To match the model current to its biological counterpart, we used voltage clamp to determine reversal potential, half-maximum potential, and time constant of activation. These experiments (N = 7) were performed first in saline containing Tetrodotoxin (TTX, 5 × 10⁻⁷ M) to block action potential generation and then repeated in saline with CsCl (5 × 10⁻⁴ M), which blocked the hyperpolarization-activated current, and TTX. The difference current between both conditions represents Ih and is shown in Figure 3B. (3) AGR spike frequency adaptation was implemented using three currents already described in the STNS (Buchholtz et al., 1992):
(a) A T-type calcium current (IT), with fast activation and inactivation kinetics to arrange for high firing frequencies at the beginning of the AGR burst.
(b) An L-type calcium current (IL), which activates slowly and does not inactivate to support the residual firing during the burst and to increase the intracellular calcium concentration.
(c) A calcium-dependent potassium current [IK(Ca)], which activates due to the increase in calcium concentration during the burst. Consequently, the membrane potential hyperpolarizes, and the potassium shunt reduces firing frequency.
Since these currents cannot be unambiguously separated in experiments, we hand tuned them in the model until the spike frequency adaptation was in the range of that measured in the biological AGR (for parameters see Appendix 1). For tuning, we injected depolarizing current pulses (5 s duration) into both, the biological neuron (in vitro preparation) and the model, and adjusted the amplitude of the injected current such that the maximum firing frequency at the beginning of each current injection was roughly 10, 20, 30, and 40 Hz, respectively. As a measure for spike frequency adaptation, we used the instantaneous firing frequency of the last two AGR spikes before the end of each current injection and plotted it over the maximum frequency. IT, IL, and IK(Ca) were then tuned such that the spike frequency adaptation of the model matched that of the biological neuron.
With these initial conductances, we obtained a fair representation of the AGR response and its spontaneous activity (Figures 2Cii,D).
Testing the AGR Model
Can the model not only recreate, but also predict the response of the biological AGR? One way to test the cellular model is to alter its properties and to compare the resulting changes in its activity to those in the biological neuron. For this, we first analyzed AGR’s spontaneous activity and then measured its activity during stimulation with a sinusoidal current in the model and in the biological neuron. For the latter, we used stimulation frequencies of 0.2, 0.4, and 0.6 Hz, which roughly correspond to the range of frequencies of the gastric mill rhythm in which AGR participates (Smarandache et al., 2008). During stimulation, AGR showed rhythmic bursting during the depolarizing phase of the sine wave in both model and biological neuron (example with 0.2 Hz shown in Figure 4). The trough of the membrane potential was sufficiently hyperpolarized to activate the hyperpolarization-activated current (Ih).
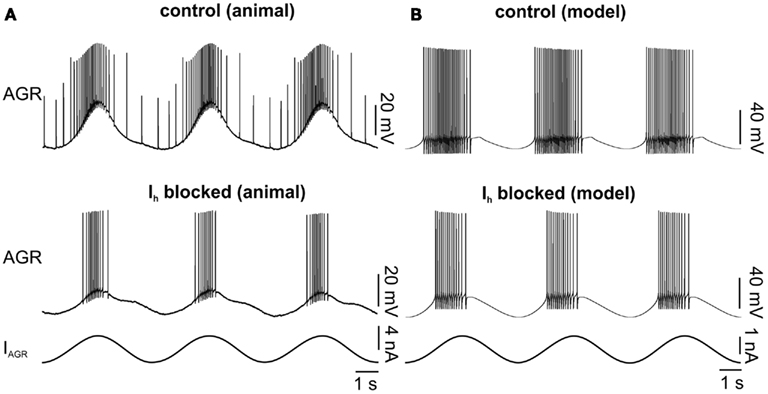
Figure 4. Influence of blocking Ih on AGR activity in the model and the biological system. (A) Biological system: AGR was driven with a sinusoidal current injection. Top: control. Bottom: Ih was blocked with CsCl. (B) Similar experiment in the model. In the bottom experiment the maximum conductance of Ih was set to zero.
To test the model, we multiplied the maximum conductance value of the Ih by a factor that ranged between 0 and 4 (Figure 5). In general, the biological neuron and the model showed the same qualitative changes in each analyzed parameter (Figure 5C). The model predicted lower activities with weaker Ih conductance. AGR spontaneous firing, burst duration, number of spikes per burst, and intraburst spike frequency decreased with lower Ih conductances (Figures 5Ai–iv). Accordingly, AGR’s duty cycle (the part of the sine wave cycle during which AGR is active) decreased (Figure 5Av). This was due to a later beginning and an earlier end of the AGR burst. For comparison, we blocked (or strongly reduced) Ih with CsCl (5 × 10⁻⁴ M; Figure 3B; N = 11) in the biological neuron and then applied the same sinusoidal stimuli (Figure 4). Similar to the model, in the biological AGR the spontaneous firing frequency was significantly lower during CsCl application (Figure 5B; N = 11; p < 0.001). The firing frequency of the biological AGR dropped by 67.6%, from 2.77 ± 0.8 to 0.90 ± 1.0 Hz (N = 11). In comparison, the spontaneous activity of the model dropped by 71%, from 4.43 Hz during control to 1.28 Hz when Ih conductance was set to 0. AGR’s burst duration during 0.2 Hz sinusoidal stimulation dropped by 28% when Ih was blocked (from 1.98 ± 0.2 to 1.52 ± 0.6 s; Figure 5C; N = 11, p < 0.05, n = 12 cycles measured in each preparation). Bursts in control contained on average 25.14 ± 3.5 spikes, while there were only 16.80 ± 8.7 during CsCl application (N = 11, p < 0.01). Intraburst spike frequency dropped, but not significantly from 12.39 ± 2.5 to 10.2 ± 4.9 Hz (N = 11). AGR’s duty cycle was shortened in CsCl: in control, its burst activity started at phase 0.23 ± 0.02 and ended at 0.62 ± 0.04, whereas in CsCl its onset was significantly delayed (0.31 ± 0.02; N = 11; p < 0.01) while its burst terminated at the same phase (0.61 ± 0.06; N = 11). When stimulated with higher frequencies (0.4 and 0.6 Hz), we found the same qualitative changes (data not shown, but significant for all parameters that showed significances at 0.2 Hz stimulation; N = 11; at least p < 0.05 for all comparisons).
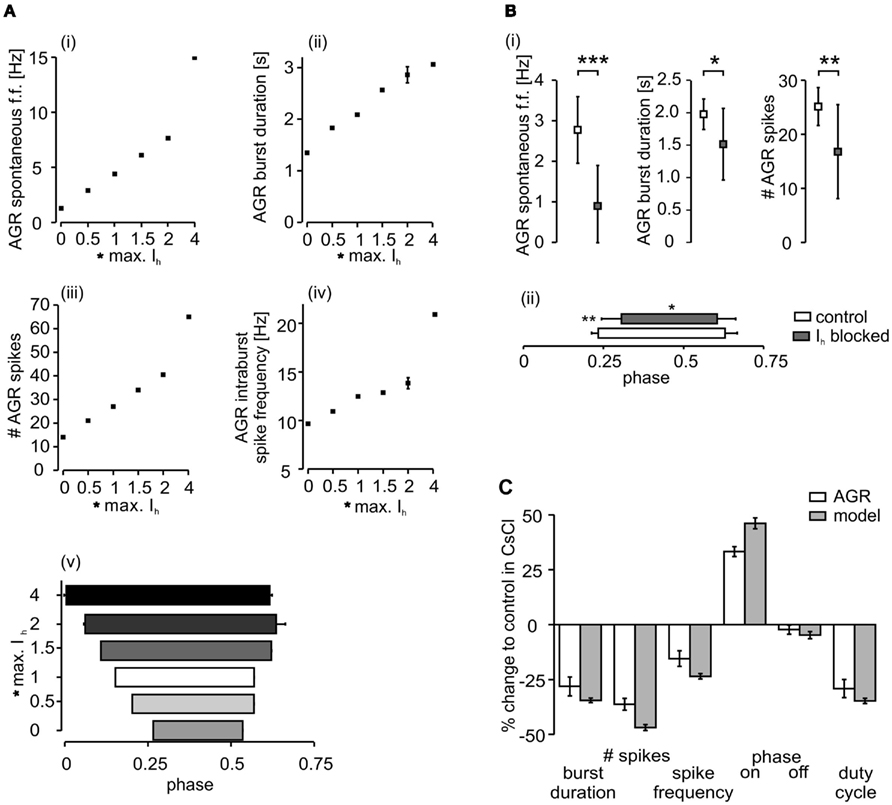
Figure 5. Comparison of the influence of Ihon AGR activity in the model and the biological system. (A) The model’s activity decreased with decreasing maximum conductance of Ih. (i) Average spontaneous firing frequency, (ii) burst duration during sinusoidal stimulation, (iii) number of spikes per burst, and (iv) intraburst spike frequency. (v) The model’s duty cycle (the fraction of a given cycle during which AGR was firing) also increased with increasing maximum conduction of Ih. (B) The activity of the biological AGR decreases with reduction of Ih during CsCl application. (i) Spontaneous firing frequency, burst duration and number of spikes per burst are shown. (ii) AGR’s duty cycle during CsCl application is shorter and its phase onset is significantly delayed. (C) Comparison of relative changes in the model and the biological neuron when Ih was blocked (biological AGR N = 11, model n = 15 cycles).
In summary, our model generated a fair prediction (Figure 5C) of the response of its biological counterpart. This indicates that the implemented properties were sufficient to create a reliable model of AGR’s activity.
Activating the AGR Model
In the animal, AGR is activated when the muscle tension of the gm1 muscles increases. These muscles are the protractor muscles of the medial tooth in the stomach and they are innervated by four gastric mill (GM) motor neurons (Selverston and Moulins, 1987). To recreate this in the model, we needed to transform GM motor neuron activity into the appropriate current stimulus to drive the AGR model. Calculating this transfer function allowed us to artificially close the loop between motor neuron activity and sensory feedback in the isolated nervous system, i.e., to activate AGR depending on the motor activity currently present.
In order to determine the transfer function, we used data from semi-intact preparations (according to Smarandache et al., 2008) in which the gm1 muscles were left intact and GM and AGR activities were monitored during muscle contractions with extracellular recordings (N = 7). In principle, these data show the relationship between motor neuron and sensory activity. To extrapolate a transfer function from these experiments we made the following assumptions about the muscle behavior and AGR activation: (1) as gm1 muscles are slow, non-twitch muscles and do not generate intrinsic action potentials (Jorge-Rivera and Marder, 1997), they can be approximated as a low-pass filter for the motoneuronal input (as also suggested in other systems: Partridge, 1966; Beer and Chiel, 2003). This ignores the fact that muscle dynamics can vary greatly depending on activity history and hormonal influences (Jorge-Rivera et al., 1998; Sharman et al., 2000; Birmingham and Tauck, 2003). Since we were not trying to create a realistic model of the muscle, but rather the proprioceptive response we tuned the muscle model together with the AGR model to generate the output which fit our data best (see also Discussion). (2) AGR bursting activity is initiated and terminated at a particular value of the muscle transfer function.
We used a series of three low-pass filters with identical filter time constants to calculate the muscle response in Spike2 (kindly provided by C. Geier and S. Hooper; Ohio University; see also Geier et al., 2002 and Supplementary Material). The timing of the GM motor neuron action potentials is used as input for these filters, i.e., action potentials are treated as time events. We were, however, confronted with the question which time constant would generate the appropriate muscle response. We thus compared the muscle responses calculated at different filter settings (iterated between 10 and 3,000 ms in 10 ms increments) to the AGR bursts that were recorded in the experiments. Naturally, longer time constants resulted in slower muscle responses (Figure 6A from bottom to top). To determine the adequate time constant for any given recording we first measured the values of the transfer function at the beginning (t1 in Figure 6A) and the end (t2 in Figure 6A) of the AGR burst (indicated as gray box) for all calculated filter setting. Assuming that AGR activity starts and ends at the same value of the muscle transfer function only a particular time constant will give a minimum deviation between both values. The difference between these two values is shown in Figure 6 as Δy. As a second measure we used the time at which the muscle response returned to its initial value (the value at the beginning of the AGR burst). The deviation between this time and the time at which the AGR burst ended (Δx) should be small at the optimum muscle time constant. Figure 6A shows these calculations for a series of filters with different time constants. Note that very high time constant values (Figure 6A, top) caused the muscle response to be very slow which clearly did not resemble the condition in the animal. Similarly, very short time constants elicited muscle responses that were by far too short to have caused the observed AGR activity.
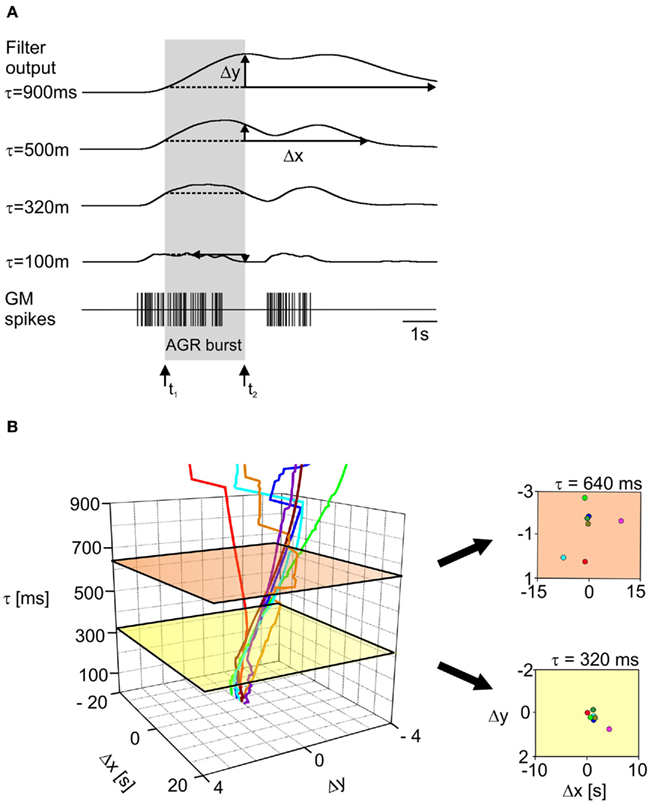
Figure 6. Muscle transfer function. (A) Bottom: representation of GM motor neuron activity recorded in a semi-intact preparation. Above are the results of the muscle transfer function (a series of low-pass filters), calculated for the sequence of GM spikes shown in the bottom trace but with different filter time constants. Δx and Δy (see text for details) are given for the different filter settings. The AGR burst is indicated by the gray box. Arrows mark its beginning and end. At a time constant of 320 ms Δx and Δy were smallest. (B) Left: plot showing Δx and Δy for recordings from seven semi-intact preparations, for increasing filter time constants. The values closest to zero for Δx and Δy for the seven experiments were found at a time constant of 320 ms (yellow plane). Right: 2D representation of Δx and Δy at 640 ms (top, orange) and 320 ms (bottom, yellow). Δx and Δy for all animals were smallest at τ = 320 ms. Please note differences in scaling.
Figure 6B shows the dependence of Δx and Δy on the time constant of the low-pass filters. The minimum values for Δx and Δy for all seven preparations were found at a time constant of 320 ms (green plane in Figure 6B). It should be noted that introducing the muscle model introduced the necessary delay between motor output and sensory response which is also seen in the biological system.
The output of the low-pass filter was then used as a current input into the AGR model. We faced two problems: (1) since the filter output is normalized, it had to be scaled to accordingly activate the model. We thus scaled the transfer function resulting from each semi-intact experiment so that the model AGR showed the same maximum firing frequency as the biological AGR in the given experiment (we used the burst with the median maximum firing frequency as reference). (2) In addition, the amplitude of the filter output depends on the number of motor neurons from which the filter receives input. Four GM motor neurons (Selverston and Moulins, 1987) with approximately similar firing patterns (Stein et al., 2005) innervate the gm1 muscle. However, not all GM neurons project via a single motor nerve, because their axonal projection pathways differ between preparations (C. Städele, personal communication). In fact, it is difficult to determine the number of neurons present on a given extracellular recording, since GM spike amplitudes and shapes are often similar. To avoid this uncertainty in GM spike detection in our closed-loop experiments we decided to record intracellularly from a single GM motor neuron and to use the spikes of that GM for calculating the transfer function. Thus, we needed to scale the transfer function, which was derived from extracellular recordings and thus calculated using somewhat varying numbers of motor neurons, to fit a recording of a single neuron. For this, we used an example intracellular recording from a GM motor neuron which contained 15 bursts and compared the results of the transfer function of this recording to those of the semi-intact preparations. We measured the median amplitude of the transfer function of all recordings and then normalized the semi-intact data by the transfer function of the intracellular recording. This resulted in an average factor of 2.95, representing the average number of GM neurons on the extracellular recordings.
The multiplication of both scaling factors (separately for each semi-intact preparation) then returned an average scaling factor of 1.128, which we subsequently used for the current injection into the AGR model. Since the gm1 muscles are slow muscles and the first few motor neuron action potentials appear to only cause an isotonic muscle contraction (C. Städele, personal communication), we decided to ignore the first three GM spike for the calculation of the transfer function. To test the performance of the model with the obtained filter settings (320 ms) and the scaling of the transfer function, we first measured the phasing of the AGR model in comparison to its biological counterpart (i.e., when and how long AGR was active in relation to the GM activity; example shown in Figure 7A). We found no significant differences between model and biological AGR. The model nicely mimicked the activity of the biological AGR, both in its phase and firing properties (Figures 7B,C).
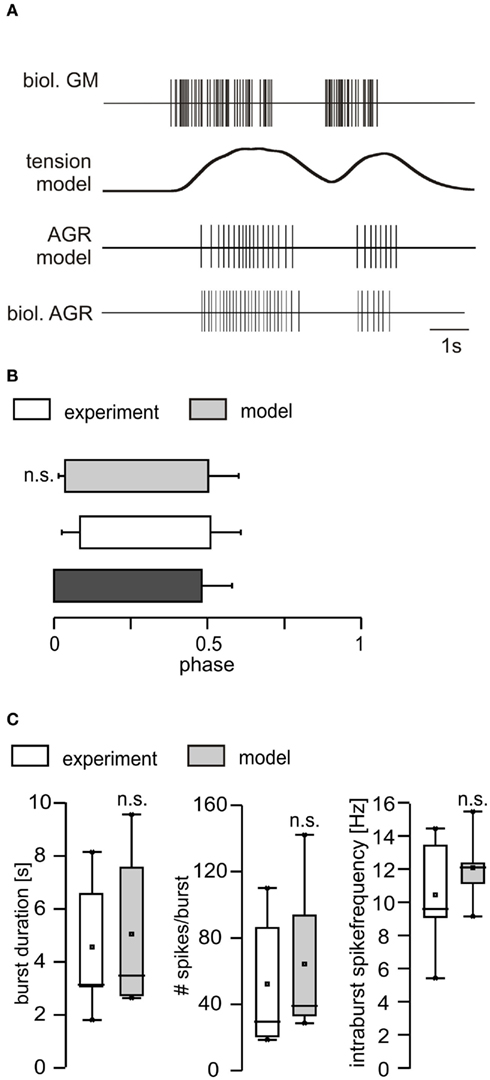
Figure 7. Comparison of the responses of the AGR model and the biological AGR. (A) Top: representation of GM motor neuron activity in a semi-intact preparation. Below: filter output with a time constant of 320 ms. Second from bottom: model AGR activity calculated when the filter output was used as current injection into the AGR model. Bottom: response of the biological AGR to the GM motor neuron activity in the semi-intact preparation. (B) Phasing and duty cycle of biological AGR (semi-intact preparation) and model. (C) Comparison of burst duration, number of spikes per burst and intraburst spike frequency between model and biological counterpart after adjustment. n.s, not significant.
Real-Time Implementation
To use the model in closed-loop conditions, the motor activity of the biological nervous system must be used as input for the calculation of the sensory feedback by the model. Thus, the model needs to be calculated in real-time, i.e., the calculation of each step of the model output must be faster than the stepwidth (0.1 ms) used in the model, including the detection of the motor activity. To ensure a sufficiently quick calculation, we developed a function for madSim (called “real-time server”), in which time consuming components such as graphical user interface and user-defined script functions were removed and just the core model calculations were kept. In real-time mode, madSim can process all simulation files created in the regular mode.
The real-time server function provides a GM activity-dependent AGR stimulation. To represent the muscle transfer function, an impulse response (Figure 8A) is calculated for each motor neuron action potential. The value of the impulse response is multiplied in each simulation step by the scaling factor to achieve the appropriate current injection into AGR. The calculated current is then added to the other currents available in the AGR model. The impulse responses of all GM action potentials are stored in separate queues and all queues are added to the current. Thus, the spike activity in the recorded GM neuron leads to an arbitrary number of queues that are processed independently in each simulation step. To limit the amount of memory, the length of each queue was limited to 3.84 s [at which the value of the impulse response was virtually zero (<0.0001)].
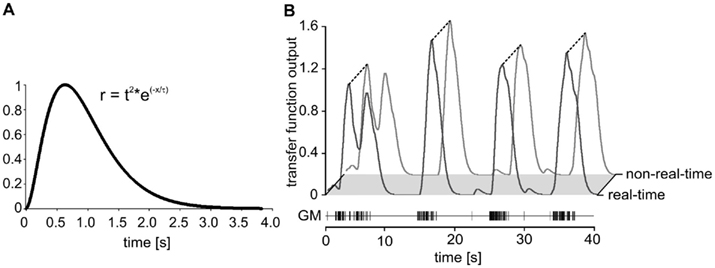
Figure 8. (A) Impulse response of the low-pass filter with a time constant of 320 ms. The length of each filter queue was limited to 3.84 s. (B) Comparison of real-time and regular calculation of the muscle transfer function. Plot of the transfer functions elicited by a sequence of GM action potentials. Real-time: black line. Non-real-time simulation: gray line. The figure shows a 40 s section of a total of 6,000 s experiment.
For the calculation of the transfer function, the recorded motor neuron action potentials (see Appendix 2 “step 1”) had to be converted to time events to be transferred from the intracellular amplifier to the madSim computer (see Appendix 2 “step 2”). Since all neuronal activities were recorded using Spike2, this was achieved by assigning each detected action potential a fixed amplitude voltage pulse with a duration of 2 ms via the DAC output of the micro 1401 board. This output was connected to the analog input of the National Instruments board (see Materials and Methods) and fed into madSim (see Appendix 2 “step 3”).
To test accuracy, speed, and reliability in real-time mode, we first replayed a stretch of previously recorded GM motor neuron activity using Spike2 and repeated this stretch for 10 h. Spike detection by madSim was tested by creating a simple cell model in real-time mode which responded with a single action potential for each detected motor neuron spike. We then compared the number of generated action potentials with that of the replayed motor neuron. Of 105,882 motor neuron spikes that were applied in bursts with a maximum instantaneous frequency of 110 Hz, the model missed only 18 (0.017%) over the whole 10 h. Next, we calculated whether these missing spikes changed the transfer function and could eventually lead to a different AGR model activity. For this, we compared the transfer function outputs calculated by the non-real-time model with that of the real-time calculation (Figure 8B).
We continued by testing the calculation of the transfer function in the real-time mode. We again replayed the spike activity of a previously recorded GM motor neuron (a total of 6,000 s). We obtained a perfect correlation between the real-time and the regular calculation (Figure 8B; r2 = 1; p < 0.001; n = 38,399 data points; linear regression using a least-squares fit). We also tested the AGR model spike activity in real-time against the non-real-time calculated output. There were no differences in number and timing of the action potentials (data not shown). Together, these results show that spike detection and calculation of the transfer function were not affected in the real-time setting.
Real-Time Closed-Loop Feedback
We went on to use the real-time model in a closed-loop electrophysiological experiment. Intracellular electrodes were applied to AGR and a GM motor neuron in an isolated nervous system and an unambiguous threshold was set for GM spike detection (between −30 and −10 mV, depending on the recorded GM; see Appendix 2 “step 1”). After detection using Spike2, GM spikes were transferred as fixed amplitude voltage pulses (duration 2 ms; see Appendix 2 “step 4”) to madSim. The calculated AGR model activity was then used to drive the biological AGR neuron with current pulses (duration 10 ms; via the analog output of the National Instruments card; see Appendix 2 “step 5”), each of which elicited a single action potential in AGR (see Figure 2A). If necessary, AGR was kept hyperpolarized (−1 to −5 nA) in between current pulses to prevent spontaneous spiking. In Figure 9A, a gastric mill rhythm (Figure 9A, left) was elicited with dpon stimulation (according to Beenhakker et al., 2004) and the real-time model was activated (Figure 9A, middle). As a result, the biological AGR was reliably activated by GM motor neuron activity and its activity depended on the activity of the GM motor neuron. At the same time, the change in AGR activity caused a clear change in the motor activity (Figure 9A, right), demonstrating the functioning of the closed-loop system. Closed-loop experiments permit to investigate the dynamical components created by the interaction of motor and sensory activities and whether they affect the functional characteristics of the system (Bässler and Nothof, 1994; Ausborn et al., 2007, 2009; Smarandache et al., 2008). In our hands, the gastric mill rhythm changed when we switched to closed-loop conditions (Figure 9A, right, indicated by GM activity), as exemplified by a significant change in cycle period (from 7.92 ± 1.7 to 9.9 ± 1.5 s; p < 0.001, N = 9, data not shown) when compared to the gastric mill rhythm without any sensory feedback (Figure 9A, left, indicated by GM activity).
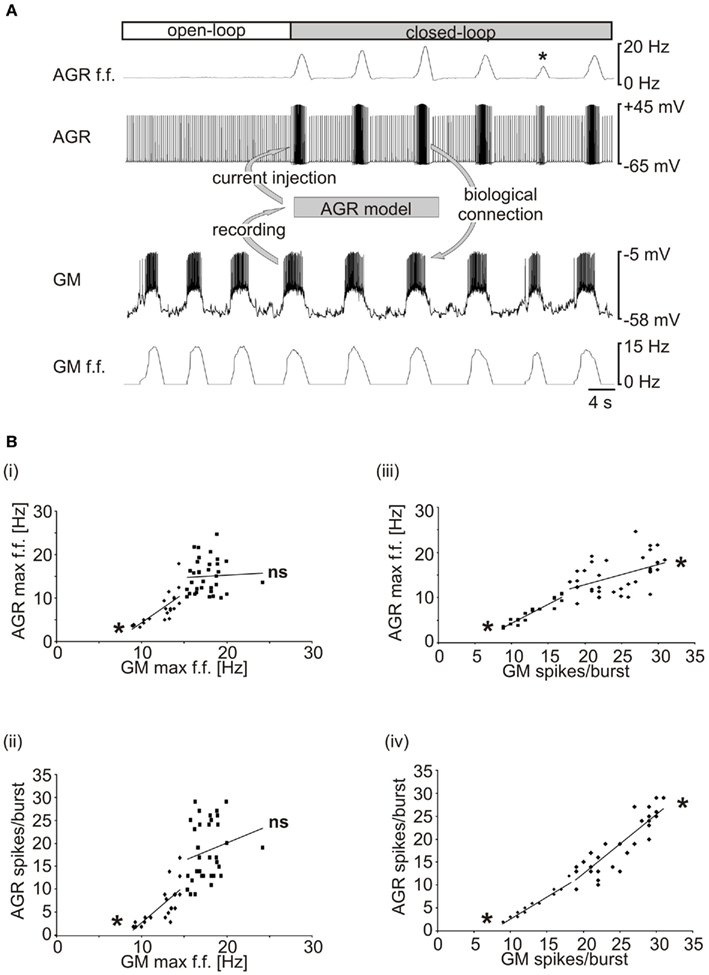
Figure 9. Providing real-time closed-loop feedback to the system. (A) The activities of AGR and the GM motor neuron were recorded intracellularly in an isolated stomatogastric nervous system. A gastric mill rhythm was elicited with dpon stimulation (left, open-loop; Beenhakker et al., 2004). Closed-loop: AGR activity was controlled by the real-time computer model and thus depended on the activity of the motor neuron (*marks a drastic example in which GM burst activity was low and AGR responded correspondingly). AGR activity, in turn, affected the motor neuron due to its synaptic effects in the biological system. Note that there was no current injection into the GM neuron and that all effects on the motor pattern were mediated by the synaptic connections in the biological system. (B) AGR’s response depended on GM spike number rather than on GM firing frequency. (i) AGR maximum intraburst firing frequency is plotted over GM maximum intraburst firing frequency. Only at low GM firing frequencies, a significant correlation was obtained. (ii) AGR spike number and GM maximum intraburst firing frequency. (iii) AGR maximum intraburst firing frequency was at all times correlated with GM spike number. (iv) AGR spike number and GM spike number were always correlated. *p < 0.05. ns, not significant.
In one instance during this closed-loop experiment, the AGR firing frequency dropped significantly (asterisk, Figure 9A top trace) as a result of a short GM burst. The fact that the AGR spike frequency was significantly lower compared to the previous bursts although the maximum GM firing frequency was similar suggests a spike number dependence of the model (Hooper and Weaver, 2000). When we plotted the maximum AGR firing frequency over the maximum GM firing frequency, we only found a correlation for lower GM frequencies (Figure 9Bi). For GM frequencies higher than 15 Hz, no significant correlation was obtained. Similarly, for the number of AGR spikes per burst, a significant correlation was only found at low GM firing frequencies (Figure 9Bii). In contrast, when we did the same analysis for the number of GM spikes per burst, we found that both AGR firing frequency and the number of AGR spikes per burst were correlated throughout the whole experiment. This suggests that over the whole range of elicited bursts, GM spike number had a greater effect on AGR activity than spike frequency.
Discussion
In this methods paper, we demonstrate the use of the STNS of the crab as a model for real-time closed-loop investigations of proprioceptive feedback. We show (1) the tuning of a muscle transfer function and of a cellular model of AGR (2) that it is possible to measure GM motor neuron activity and to control the firing frequency of the muscle tendon organ AGR in real-time and (3) the real-time application of the model.
Tuning and Accuracy of the Model: Hurdles, Hindrances, and Stumbling Blocks when Creating Closed-Loop Experiments
There are many challenges when creating a closed-loop experiment. First of all one must assess whether the system of choice is suitable to conduct closed-loop experiments. The system must fulfill certain demands: most importantly, the motor pattern generating circuits as well as motor and sensory activity must be accessible so that an interface between both can be established. The amount of detail known about the system is critical for building and implementing the feedback and determines the level of detail of the model. Once established, it is essential to test the feedback loop to determine how well it represents the conditions in the animal. Again, this is determined by the accessibility of the system. The STNS is very rewarding for these types of experiments.
To learn about the system properties, we need to compare open and closed-loop conditions and we need to modify specific parameters to see the response of others. In virtually all cases we will thus have to rely on a model that generates or represents the feedback and at the same time allows us to alter the feedback (for example the flow of sensory information). The question arises how accurate this model has to be and how much detail is necessary. Naturally, there is no universal answer to this question and it has to be addressed separately in each system. Yet, there are some general recommendations that are highlighted by the challenges encountered in this study.
Our closed-loop model consists of two models that act sequentially: the first represents the response of the muscle innervated by the GM motor neurons and the second calculates the AGR activity. For both, we had to decide the level of detail and precision to accurately represent the biological conditions. It may cross your mind to try and record all possible measures that describe the characteristics of the system. Yet, due to limitations of the experimental access, it is practically impossible to come up with all parameters needed for the model. Consequently, we have to use meaningful estimates when establishing the model. What is the best way to achieve these estimates? When many factors affect the system’s behavior, there appears to be no single solution but rather a solution space containing a divers set of combinations of individual factors. For example, many different combinations of ionic conductances may result in the same oscillatory activity of a neuronal network (Prinz et al., 2004; Taylor et al., 2009; Grashow et al., 2011). This is not only a theoretical assumption, but also a fact seen in voltage clamp measurements and mRNA analyses of the biological neurons (Marder et al., 2007; Nowotny et al., 2007; Schulz et al., 2007; Goaillard et al., 2009): maximum conductances and mRNA levels in STG neurons, for example, vary substantially between different individuals (possibly following particular rules), although the motor pattern generated is virtually identical (Bucher et al., 2005). Although not studied so far, it is conceivable that other intrinsic and non-intrinsic properties can vary as well. For modeling, this results in severe consequences: finding a particular solution (independently of using hand-tuning, exhaustive search or advanced search algorithms) for re-creating a particular activity pattern may not be adequate. Rather, for each solution, the response of the model has to be tested in different conditions to see if it faithfully reproduces the biological response. To determine the appropriate measure, of course, remains with the investigator and depends on his or her particular field of interest. To this end, we tested the response of our AGR model to current injections and modifications of intrinsic properties. We used a sinusoidal current injection to alter the membrane potential in a range that activated all implemented conductances and then perturbed the model by altering Ih. We compared this to blocking Ih in the biological AGR with CsCl (Figure 3A). We found the same trends in both model and biological counterpart. Yet, when Ih was completely blocked in the model, averaged changes were always larger, although not significantly, than in the animal (Figure 5C). We contribute this to the fact that CsCl does not block Ih completely (Pape, 1996; Zhang et al., 2003) and some residual effects of Ih remained in the animal.
The cellular model of AGR was built using conductances typically found in other STG neurons. The parameters used to calculate these conductances were hand tuned according to measurements taken in the biological system. For Ih, the responses of model and biological AGR to hyperpolarizing voltage-steps, which exclusively activate this conductance, were compared. In contrast, other voltage- or ligand-gated conductances are more difficult to measure directly, which is why we instead used the spike response (tonic activity and spike frequency adaptation) of the AGR model to depolarizing current steps as a measure for the accuracy of the model. The responses obtained were well within the range of the biological AGR (Figure 2D) and this approach also takes into account a growing body of evidence that the underlying conductances may vary substantially, while the target activity is reached (Schulz et al., 2006; Marder and Bucher, 2007; Nowotny et al., 2007; Taylor et al., 2009; Costa, 2011). It is important to note, however, that the set of conductances and intrinsic properties used may not reflect the conditions in the biological neuron. For example, the amount of current needed to reach specific firing frequencies differed between model and biological neuron. For our purposes, this did not matter since the amount of current injected to activate the AGR model was later adjusted as a factor between muscle output and AGR model input. It should be noted, thus, that one has to be very careful when using the obtained model parameters for interpretations beyond spike activity changes.
Our AGR model is a single compartment model using Hodgkin–Huxley type equations. While in the animal AGR is a bipolar neuron with rather long axons (Smarandache and Stein, 2007; Daur et al., 2009), we decided not to implement the morphology. There were two main reasons: (1) the model AGR was connected to the biological AGR using current injections into the soma, which bypasses the posterior axon. (2) The action potentials elicited in the biological AGR take the same route to their postsynaptic targets as those action potentials elicited by muscle stretch, i.e., they are conducted along the anterior axon in the stn (Figure 2A). In addition, AGR appears to be electrically compact, since spontaneous spike generation can be suppressed from the soma, although the initiation occurs spatially distant in the axon (Daur et al., 2009).
The second model used in our closed-loop approach was the muscle model. The model we use is very simple. It was not meant to accurately represent the muscle and its force production or effect on behavior (which would have required a much more detailed model), but rather as a vehicle to activate the AGR model. The model consists of a series of three low-pass filters that essentially smooth and summate all motor neuron action potentials (Geier et al., 2002) and ignore the dynamics of the muscle itself, such as facilitation and depression because our focus was the proper simulation of AGR activity. To give a fully realistic simulation of the gm1 muscle dynamics would go beyond the scope of this study. However, in our hands, a more detailed model was not necessary, because the response of the AGR model, when activated by GM activity via the muscle model, resembles that of the biological AGR (Figures 6B,C), which demonstrates the validity of the model.
Another issue in closed-loop experiments is the necessity for real-time calculation of the model. Again, here we have to compromise and in this case trade detail for speed. The trade depends on the computer power available, the detail of the model, the operating system and on the skill of the programmer. For example, running a morphologically adequate version of the AGR model or a Hill-type muscle model would not have been feasible because it would simply take too long to calculate in real-time. This, however, may change with the emergence of analog very-large-scale integration (VLSI) chips used to mimic neuronal processes (Poon and Zhou, 2011).
Another matter to take into account is the usability of the closed-loop system for the experimenter. Managing the models is complicated enough but adding on top of that the handling of different operating systems could make things worse. We believe that this is one of the factors preventing researchers from carrying out closed-loop experiments because there is typically the need for hiring a separate expert just for running the hard and software. We thus decided to rely on Windows, which is what most people are already familiar with. This comes with the caveat that communication with the hardware can be slow or sometimes even interrupted for several milliseconds. However, this also makes the approach simple enough to be carried out by graduate students. In our hands, the real-time computation on a Windows PC did not pose a problem (Figure 8B) but we chose to turn off all unnecessary processes (such as update services or background programs) just the same.
Novelties and Advantages of the Closed-loop Approach Presented Here
In many rhythmic motor systems proprioceptive feedback contributes substantially to the motor pattern characteristics (Pearson, 2004; Rossignol et al., 2006; Ausborn et al., 2007; Proekt et al., 2008), even if a basic version of the motor pattern can be generated after removing all sensory input. The interactions between motor and sensory activities may even govern the functional characteristics of the system (Lehmann and Dickinson, 2000; Büschges, 2005). Yet, designing experiments to investigate these interactions is difficult because most often when the neuronal circuits are well-characterized, the isolated nervous system is studied and no proprioceptive feedback is present. One way to circumvent this problem is to provide artificial sensory feedback in real-time (Bässler and Nothof, 1994; Ausborn et al., 2007; Smarandache et al., 2008). For lack of access to the sensory neurons, motor neurons or lack of knowledge of the sensory physiology, one usually reverts to either activate sensory feedback with an arbitrary activity (usually the average or maximum firing rate measured) at the appropriate time or phase during the motor pattern. There are several disadvantages with these approaches: first, the activity of the model sensor is predefined and remains constant during the experiment – a property that clearly differs from a biological proprioceptor. Second, if the sensory organ consists of many neurons, extracellular stimulation of a nerve may be necessary to activate it. Depending on stimulus strength, however, this may recruit different sensory units or only a subset of the sensory neurons (since axonal diameters vary substantially in sensory nerves). Third, even if there is only a single sensory neuron, and its activity can be altered using intracellular recordings, it is advantageous to use current pulses to elicit single action potentials instead of a continuous current step during the activity phase of the sensor. In the latter case, there may be a run-down of activity during the course of the experiment, since electrode properties may change or voltage-sensitive ionic conductances may be activated that alter the cell’s response to the current stimulus. Ih, for example, may be de-activated by repetitive depolarizing current steps, increasing the responsiveness of the cell to the current injection. Lastly, a phase-correct activation such as used in several studies (Tosato et al., 2006; Arsiero et al., 2007; Ausborn et al., 2007; Smarandache et al., 2008) is calculated by estimating the time for activating the sensor using the cycle period of the previous cycle. Thus, the timing of the sensory activity is a prediction based on the previous cycle and not due to the motor neuron activity of the current cycle. Yet, the adequate phasing of input may be important for its influence on the motor pattern (Prinz et al., 2003). In contrast, sensory activity that is activated by an actuator, such as an artificial muscle, is always dependent on the current motor activity and automatically phase-correct. Analog models of sensory activity are usually not flexible and building and tuning them to the adequate response is difficult. For example, in the stick insect, an analog model of chordotonal organ feedback was used to study the effects of gain changes in a reflex loop (Bässler and Nothof, 1994). Here, leg position was detected with a photodiode and the tendon of the femoral chordotonal organ was moved by an actuator (a Pen motor). While this is one of the few examples in which a sensory modality can be directly and adequately stimulated, the circuit driving the actuator is rather rigid. In this paper, we show the use of a computer simulation of both actuator and sensor, and both can be adjusted and modified rather easily.
The STG as a Model System for Closed-Loop Investigations of Proprioceptive Feedback
Although sensory feedback appears to be ubiquitously in the STNS, it has mostly been studied in open-loop conditions (with a few exceptions; Smarandache et al., 2008), i.e., by stimulating sensory nerves and monitoring the response of the motor circuits. This is mostly due to the fact that the actual behavior elicited by the pyloric and gastric mill pattern generators (filtering and chewing, respectively) are hard to monitor and little is known about the activity of sensory neurons during the actual behavior in vivo. Nevertheless, the STG offers many advantages for real-time closed-loop studies: several sensory pathways consist of a single or only a few neurons, which can be stimulated unambiguously (Sigvardt and Mulloney, 1982; Nagy et al., 1988; Cazalets et al., 1990a,b; Hooper et al., 1990; Blitz et al., 2004; Christie et al., 2004; Smarandache and Stein, 2007; Hedrich and Stein, 2008). AGR, which we used in this study, has a unique accessibility since its soma is located in the STG and its activity can be altered by current injection. AGR activity has been characterized in vivo and in semi-intact preparations (Smarandache and Stein, 2007; Smarandache et al., 2008), as well as in vitro (Simmers and Moulins, 1988b; Elson et al., 1994; Combes et al., 1995, 1997, 1999; Smarandache and Stein, 2007; Hedrich et al., 2009). The properties of the muscles in the STNS are also well-characterized (Hooper et al., 1986; Jorge-Rivera and Marder, 1996; Morris and Hooper, 1997, 1998; Jorge-Rivera et al., 1998; Hooper and Weaver, 2000; Thuma et al., 2003; Stein et al., 2006), as are the central pattern generators in the STNS: all neurons in the pyloric and gastric mill central pattern generators are identified and can be monitored (one-by-one) with either extra- or intracellular recordings (Nusbaum and Beenhakker, 2002; Stein, 2009), which already allowed to describe many general mechanisms for motor pattern generation and initiation. Since these mechanisms can be easily manipulated by various means (for example the dynamic clamp – another real-time closed-loop system, Sharp et al., 1993), the validity and impact of pattern generating mechanisms can now be tested in more realistic conditions, i.e., when sensory feedback is present. This is important since the muscular apparatus in the stomatogastric system of crustaceans is complex (Weimann et al., 1991) and not well understood. Closed-loop simulations might shed light on the question how a small nervous system with relatively little proprioceptive input can control such a complex system. Our closed-loop experiments, for example, revealed a spike number dependence of the model, i.e., GM spike number had a greater effect on AGR than spike frequency. Findings from Morris and Hooper (1997) and Hooper and Weaver (2000) show that muscles in the stomatogastric system have spike number and spike frequency response domains. It is unknown whether such domains exist for the large gm1 muscle, but our model suggests that spike number is more important than spike frequency, at least at high motoneuronal firing frequencies. At low GM firing frequencies, both frequency and the number of spikes determine the AGR response (Figures 9Bi,iii).
Perspectives
The properties of neurons and circuits are dynamic and altered by neuromodulatory substances present in the blood stream or released from modulatory neurons. For example, the timing of the motor pattern may change (Blitz and Nusbaum, 1997; White and Nusbaum, 2011) and neurons may change their phase relationship (Goaillard et al., 2004; Smarandache et al., 2009) or resonance properties (Hänggi, 2002; Tohidi and Nadim, 2009). While the effects of neuromodulators in the isolated system are well-known, it is unclear how such changes in the motor circuit affect sensory activity and if sensory feedback supports or opposes these changes. It is conceivable that, since the sensory feedback itself constitutes an oscillatory system which is coupled to the neuronal oscillators, the resonance properties of the feedback loop interact with that of the neuronal oscillator. In fact, perturbing the motor circuits with neuromodulators or by manipulating the pattern generating neurons directly will allow characterization of the dynamics of these sensorimotor interactions. A comparable manipulation would be to alter the sensory feedback itself. Neuromodulators and hormones also influence sensory neurons (Beenhakker et al., 2007; DeLong et al., 2009), most likely by altering intrinsic membrane properties and synaptic transmission at the neuromuscular junction (Jorge-Rivera et al., 1998; Marder and Thirumalai, 2002). An adjustment of intrinsic properties to match the effects of these modulators is straight forward and easy in our model. For example, Dopamine and Octopamine affect Ih in STG cells (Harris-Warrick et al., 1995; Peck et al., 2006) and if a similar effect is present on Ih in AGR (Octopamine affects the spontaneous activity of AGR; Daur et al., 2009), this could change the gain (the strength), the delay or the phasing of the feedback (see also Figure 5).
Even further, muscle properties can be dynamic. For example they are history-dependent, i.e., they depend crucially on previous motor activity (Stein et al., 2006) and they are modulated by a variety of substances (Jorge-Rivera et al., 1998). Thus, it may be sensible to extend the current muscle model or to use a more complex muscle model to achieve a representation of neuromodulatory effects. In summary, we have shown that the STNS can serve as a fruitful model system for real-time closed-loop studies.
Conflict of Interest Statement
The authors declare that the research was conducted in the absence of any commercial or financial relationships that could be construed as a potential conflict of interest.
Acknowledgments
We would like to thank Harald Wolf for and the Institute of Neurobiology at Ulm University for intellectual and financial support. Grants: DFG STE 537/2-1 and 2-1 (to Wolfgang Stein) and DFG DA 1188/1-1 (to Nelly Daur).
Supplementary Material
The Supplementary Material for this article can be found online at http://www.frontiersin.org/computational_neuroscience/10.3389/fncom.2012.00013/abstract
References
Arsiero, M., Luscher, H. R., and Giugliano, M. (2007). Real-time closed-loop electrophysiology: towards new frontiers in in vitro investigations in the neurosciences. Arch. Ital. Biol. 145, 193–209.
Ausborn, J., Stein, W., and Wolf, H. (2007). Frequency control of motor patterning by negative sensory feedback. J. Neurosci. 27, 9319–9328.
Ausborn, J., Wolf, H., and Stein, W. (2009). The interaction of positive and negative sensory feedback loops in dynamic regulation of a motor pattern. J. Comput. Neurosci. 27, 245–257.
Barriere, G., Simmers, J., and Combes, D. (2008). Multiple mechanisms for integrating proprioceptive inputs that converge on the same motor pattern-generating network. J. Neurosci. 28, 8810–8820.
Bartos, M., and Nusbaum, M. P. (1997). Intercircuit control of motor pattern modulation by presynaptic inhibition. J. Neurosci. 17, 2247–2256.
Bässler, U., and Nothof, U. (1994). Gain control in a proprioceptive feedback loop as a prerequisite for working close to instability. J. Comput. Biol. 175, 23–33.
Beenhakker, M. P., Blitz, D. M., and Nusbaum, M. P. (2004). Long-lasting activation of rhythmic neuronal activity by a novel mechanosensory system in the crustacean stomatogastric nervous system. J. Neurophysiol. 91, 78–91.
Beenhakker, M. P., Delong, N. D., Saideman, S. R., Nadim, F., and Nusbaum, M. P. (2005). Proprioceptor regulation of motor circuit activity by presynaptic inhibition of a modulatory projection neuron. J. Neurosci. 25, 8794–8806.
Beenhakker, M. P., Kirby, M. S., and Nusbaum, M. P. (2007). Mechanosensory gating of proprioceptor input to modulatory projection neurons. J. Neurosci. 27, 14308–14316.
Beer, R. D., and Chiel, H. J. (2003). “Locomotion, invertebrate,” in The Handbook of Brain Theory and Neural Networks, 2nd Edn, ed. M. A. Arbib (Cambridge, MA: MIT Press), 646–649.
Billimoria, C. P., Dicaprio, R. A., Birmingham, J. T., Abbott, L. F., and Marder, E. (2006). Neuromodulation of spike-timing precision in sensory neurons. J. Neurosci. 26, 5910–5919.
Birmingham, J. T. (2001). Increasing sensor flexibility through neuromodulation. Biol. Bull. 200, 206–210.
Birmingham, J. T., and Tauck, D. L. (2003). Neuromodulation in invertebrate sensory systems: from biophysics to behavior. J. Exp. Biol. 206, 3541–3546.
Blitz, D. M., Beenhakker, M. P., and Nusbaum, M. P. (2004). Different sensory systems share projection neurons but elicit distinct motor patterns. J. Neurosci. 24, 11381–11390.
Blitz, D. M., and Nusbaum, M. P. (1997). Motor pattern selection via inhibition of parallel pathways. J. Neurosci. 17, 4965–4975.
Blitz, D. M., White, R. S., Saideman, S. R., Cook, A., Christie, A. E., Nadim, F., and Nusbaum, M. P. (2008). A newly identified extrinsic input a distinct gastric mill rhythm via activation of modulatory projection neurons. J. Exp. Biol. 211, 1000–1011.
Briggman, K. L., and Kristan, W. B. (2008). Multifunctional pattern-generating circuits. Annu. Rev. Neurosci. 31, 271–294.
Bucher, D., Prinz, A. A., and Marder, E. (2005). Animal-to-animal variability in motor pattern production in adults and during growth. J. Neurosci. 25, 1611–1619.
Buchholtz, F., Golowasch, J., Epstein, I. R., and Marder, E. (1992). Mathematical model of an identified stomatogastric ganglion neuron. J. Neurophysiol. 67, 332–340.
Büschges, A. (2005). Sensory control and organization of neural networks mediating coordination of multisegmental organs for locomotion. J. Neurophysiol. 93, 1127–1135.
Cazalets, J. R., Nagy, F., and Moulins, M. (1990a). Suppressive control of the crustacean pyloric network by a pair of identified interneurons. I. Modulation of the motor pattern. J. Neurosci. 10, 448–457.
Cazalets, J. R., Nagy, F., and Moulins, M. (1990b). Suppressive control of the crustacean pyloric network by a pair of identified interneurons. II. Modulation of neuronal properties. J. Neurosci. 10, 458–468.
Christie, A. E., Stein, W., Quinlan, J. E., Beenhakker, M. P., Marder, E., and Nusbaum, M. P. (2004). Actions of a histaminergic/peptidergic projection neuron on rhythmic motor patterns in the stomatogastric nervous system of the crab Cancer borealis. J. Comp. Neurol. 469, 153–169.
Combes, D., Meyrand, P., and Simmers, J. (1999). Dynamic restructuring of a rhythmic motor program by a single mechanoreceptor neuron in lobster. J. Neurosci. 19, 3620–3628.
Combes, D., Simmers, J., and Moulins, M. (1995). Structural and functional characterization of a muscle tendon proprioceptor in lobster. J. Comp. Neurol. 363, 221–234.
Combes, D., Simmers, J., and Moulins, M. (1997). Conditional dendritic oscillators in a lobster mechanoreceptor neurone. J. Physiol. (Lond.) 499(Pt 1), 161–177.
Costa, R. M. (2011). A selectionist account of de novo action learning. Curr. Opin. Neurobiol. 21, 579–586.
Daur, N., Nadim, F., and Stein, W. (2009). Regulation of motor patterns by the central spike-initiation zone of a sensory neuron. Eur. J. Neurosci. 30, 808–822.
DeLong, N. D., Beenhakker, M. P., and Nusbaum, M. P. (2009). Presynaptic inhibition selectively weakens peptidergic cotransmission in a small motor system. J. Neurophysiol. 102, 3492–3504.
Dickinson, M. H. (2005). The initiation and control of rapid flight maneuvers in fruit flies. Integr. Comp. Biol. 45, 274.
Ekeberg, Ö., Wallén, P., Lansner, A., Travén, H., Brodin, L., and Grillner, S. (1991). A computer based model for realistic simulations of neural networks. Biol. Cybern. 65, 81–90.
Elson, R. C., Panchin, Y. V., Arshavsky, Y. I., and Selverston, A. I. (1994). Multiple effects of an identified proprioceptor upon gastric pattern generation in spiny lobsters. J. Comp. Physiol. A. 174, 317–329.
Fry, S. N., Rohrseitz, N., Straw, A. D., and Dickinson, M. H. (2008). TrackFly: virtual reality for a behavioral system analysis in free-flying fruit flies. J. Neurosci. Methods 171, 110–117.
Geier, C. F., Hobbs, K. H., and Hooper, S. L. (2002). Modeling p1 (LP neuron) Muscle Isometric Motor Activity, Program No. 465.9, 2002 Neuroscience Meeting Planner. Orlando, FL: Society for Neuroscience, Online.
Goaillard, J. M., Schulz, D. J., Kilman, V. L., and Marder, E. (2004). Octopamine modulates the axons of modulatory projection neurons. J. Neurosci. 24, 7063–7073.
Goaillard, J. M., Taylor, A. L., Schulz, D. J., and Marder, E. (2009). Functional consequences of animal-to-animal variation in circuit parameters. Nat. Neurosci. 12, 1424–1430.
Golowasch, J., and Marder, E. (1992). Ionic currents of the lateral pyloric neuron of the stomatogastric ganglion of the crab. J. Neurophysiol. 67, 318–331.
Grashow, R., Brookings, T., and Marder, E. (2011). Compensation for variable intrinsic neuronal excitability by circuit-synaptic interactions. J. Neurosci. 30, 9145–9156.
Grillner, S. (2003). The motor infrastructure: from ion channels to neuronal networks. Nat. Rev. Neurosci. 4, 573–586.
Gutierrez, G. J., and Grashow, R. G. (2009). Cancer borealis stomatogastric nervous system dissection. J. Vis. Exp. (25), e1207. doi: 10.3791/1207
Hänggi, P. (2002). Stochastic resonance in biology. How noise can enhance detection of weak signals and help improve biological information processing. Chemphyschem 3, 285–290.
Harris-Warrick, R. M., Coniglio, L. M., Levini, R. M., Gueron, S., and Guckenheimer, J. (1995). Dopamine modulation of two subthreshold currents produces phase shifts in activity of an identified motoneuron. J. Neurophysiol. 74, 1404–1420.
Hedrich, U. B., Smarandache, C. R., and Stein, W. (2009). Differential activation of projection neurons by two sensory pathways contributes to motor pattern selection. J. Neurophysiol. 102, 2866–2879.
Hedrich, U. B., and Stein, W. (2008). Characterization of a descending pathway: activation and effects on motor patterns in the brachyuran crustacean stomatogastric nervous system. J. Exp. Biol. 211, 2624–2637.
Hodgkin, A. L., and Huxley, A. F. (1952). A quantitative description of membrane current and its application to conduction and excitation in nerve. J. Physiol. 117, 500–544.
Hooper, S. L., Moulins, M., and Nonnotte, L. (1990). Sensory input induces long-lasting changes in the output of the lobster pyloric network. J. Neurophysiol. 64, 1555–1573.
Hooper, S. L., O’Neil, M. B., Wagner, R., Ewer, J., Golowasch, J., and Marder, E. (1986). The innervation of the pyloric region of the crab, Cancer borealis: homologous muscles in decapod species are differently innervated. J. Comp. Physiol. A 159, 227–240.
Hooper, S. L., and Weaver, A. L. (2000). Motor neuron activity is often insufficient to predict motor response. Curr. Opin. Neurobiol. 10, 676–682.
Jorge-Rivera, J., and Marder, Y. E. (1997). Allatostatin decreases stomatogastric neuromuscular transmission in the crab Cancer borealis. J. Exp. Biol. 200, 2937–2946.
Jorge-Rivera, J. C., and Marder, E. (1996). TNRNFLRFamide and SDRNFLRFamide modulate muscles of the stomatogastric system of the crab Cancer borealis. J. Comp. Physiol. A 179, 741–751.
Jorge-Rivera, J. C., Sen, K., Birmingham, J. T., Abbott, L. F., and Marder, E. (1998). Temporal dynamics of convergent modulation at a crustacean neuromuscular junction. J. Neurophysiol. 80, 2559–2570.
Katz, P. S. (1998). Comparison of extrinsic and intrinsic neuromodulation in two central pattern generator circuits in invertebrates. Exp. Physiol. 83, 281–292.
Katz, P. S., Eigg, M. H., and Harris-Warrick, R. M. (1989). Serotonergic/cholinergic muscle receptor cells in the crab stomatogastric nervous system. I. Identification and characterization of the gastropyloric receptor cells. J. Neurophysiol. 62, 558–570.
Katz, P. S., and Harris-Warrick, R. M. (1989). Serotonergic/cholinergic muscle receptor cells in the crab stomatogastric nervous system. II. Rapid nicotinic and prolonged modulatory effects on neurons in the stomatogastric ganglion. J. Neurophysiol. 62, 571–581.
Le, T., Verley, D. R., Goaillard, J. M., Messinger, D. I., Christie, A. E., and Birmingham, J. T. (2006). Bistable behavior originating in the axon of a crustacean motor neuron. J. Neurophysiol. 95, 1356–1368.
Lehmann, F.-O., and Dickinson, M. H. (2000). The production of elevated flight force compromises manoeuvrability in the fruit fly Drosophila melanogaster. J. Exp. Biol. 204, 627–635.
Marder, E., and Bucher, D. (2007). Understanding circuit dynamics using the stomatogastric nervous system of lobsters and crabs. Annu. Rev. Physiol. 69, 291–316.
Marder, E., and Thirumalai, V. (2002). Cellular, synaptic and network effects of neuromodulation. Neural Netw. 15, 479–493.
Marder, E., Tobin, A. E., and Grashow, R. (2007). How tightly tuned are network parameters? Insight from computational and experimental studies in small rhythmic motor networks. Prog. Brain Res. 165, 193–200.
Morris, L. G., and Hooper, S. L. (1997). Muscle response to changing neuronal input in the lobster (Panulirus interruptus) stomatogastric system: spike number- versus spike frequency-dependent domains. J. Neurosci. 17, 5956–5971.
Morris, L. G., and Hooper, S. L. (1998). Muscle response to changing neuronal input in the lobster (Panulirus interruptus) stomatogastric system: slow muscle properties can transform rhythmic input into tonic output. J. Neurosci. 18, 3433–3442.
Mronz, M., and Lehmann, F. O. (2008). The free-flight response of Drosophila to motion of the visual environment. J. Exp. Biol. 211, 2026–2045.
Nagy, F., Dickinson, P. S., and Moulins, M. (1988). Control by an identified modulatory neuron of the sequential expression of plateau properties of, and synaptic inputs to, a neuron in a central pattern generator. J. Neurosci. 8, 2875–2886.
Nicolelis, M. A. (2003). Brain-machine interfaces to restore motor function and probe neural circuits. Nat. Rev. Neurosci. 4, 417–422.
Norris, B. J., Coleman, M. J., and Nusbaum, M. P. (1994). Recruitment of a projection neuron determines gastric mill motor pattern selection in the stomatogastric nervous system of the crab, Cancer borealis. J. Neurophysiol. 72, 1451–1463.
Novellino, A., D’Angelo, P., Cozzi, L., Chiappalone, M., Sanguineti, V., and Martinoia, S. (2007). Connecting neurons to a mobile robot: an in vitro bidirectional neural interface. Comput. Intell Neurosci. 12725.
Nowotny, T., Szucs, A., Levi, R., and Selverston, A. I. (2007). Models wagging the dog: are circuits constructed with disparate parameters? Neural Comput. 19, 1985–2003.
Nusbaum, M. P., and Beenhakker, M. P. (2002). A small-systems approach to motor pattern generation. Nature 417, 343–350.
Pape, H. C. (1996). Queer current and pacemaker: the hyperpolarization-activated cation current in neurons. Annu. Rev. Physiol. 58, 299–327.
Partridge, L. D. (1966). Signal-handling characteristics of load-moving skeletal muscle. Am. J. Physiol. 210, 1178–1191.
Pearson, K. G. (1986). “Neuronal circuits for patterning motor activity in invertebrates,” in Comparative Neurobiology, Modes of Communication in the Nervous System, eds M. J. Cohen, and F. Strumwasser (New York: John Wiley and Sons, Inc.), 225–244.
Pearson, K. G. (2004). Generating the walking gait: role of sensory feedback. Prog. Brain Res. 143, 123–129.
Peck, J., Gaier, E., Stevens, E., and Repicky, S. (2006). Amine modulation of Ih in a small neural network. J. Neurophysiol. 96, 2931–2940.
Poon, C. S., and Zhou, K. (2011). Neuromorphic silicon neurons and large-scale neural networks: challenges and opportunities. Front. Neurosci. 5:108. doi: 10.3389/fnins.2011.00108
Prinz, A. A., Bucher, D., and Marder, E. (2004). Similar network activity from disparate circuit parameters. Nat. Neurosci. 7, 1345–1352.
Prinz, A. A., Thirumalai, V., and Marder, E. (2003). The functional consequences of changes in the strength and duration of synaptic inputs to oscillatory neurons. J. Neurosci. 23, 943–954.
Proekt, A., Wong, J., Zhurov, Y., Kozlova, N., Weiss, K. R., and Brezina, V. (2008). Predicting adaptive behavior in the environment from central nervous system dynamics. PLoS ONE 3, e3678. doi: 10.1371/journal.pone.0003678
Rossignol, S., Dubuc, R., and Gossard, J. P. (2006). Dynamic sensorimotor interactions in locomotion. Physiol. Rev. 86, 89–154.
Sareen, P., Wolf, R., and Heisenberg, M. (2011). Attracting the attention of a fly. Proc. Natl. Acad. Sci. U.S.A. 108, 7230–7235.
Schulz, D. J., Goaillard, J. M., and Marder, E. (2006). Variable channel expression in identified single and electrically coupled neurons in different animals. Nat. Neurosci. 9, 356–362.
Schulz, D. J., Goaillard, J. M., and Marder, E. E. (2007). Quantitative expression profiling of identified neurons reveals cell-specific constraints on highly variable levels of gene expression. Proc. Natl. Acad. Sci. U.S.A. 104, 13187–13191.
Selverston, A. I., and Moulins, M. (1987). The Crustacean Stomatogastric System: A Model for the Study of Central Nervous Systems. Heidelberg: Springer-Verlag
Sharman, A., Hirji, R., Birmingham, J. T., and Govind, C. K. (2000). Crab stomach pyloric muscles display not only excitatory but inhibitory and neuromodulatory nerve terminals. J. Comp. Neurol. 425, 70–81.
Sharp, A. A., O’Neil, M. B., Abbott, L. F., and Marder, E. (1993). Dynamic clamp: computer-generated conductances in real neurons. J. Neurophysiol. 69, 992–995.
Sigvardt, K. A., and Mulloney, B. (1982). Sensory alteration of motor patterns in the stomatogastric nervous system of the spiny lobster Panulirus interruptus. J. Exp. Biol. 97, 137–152.
Simmers, J., and Moulins, M. (1988a). A disynaptic sensorimotor pathway in the lobster stomatogastric system. J. Neurophysiol. 59, 740–756.
Simmers, J., and Moulins, M. (1988b). Nonlinear interneuronal properties underlie integrative flexibility in a lobster disynaptic sensorimotor pathway. J. Neurophysiol. 59, 757–777.
Smarandache, C., Hall, W. M., and Mulloney, B. (2009). Coordination of rhythmic motor activity by gradients of synaptic strength in a neural circuit that couples modular neural oscillators. J. Neurosci. 29, 9351–9360.
Smarandache, C. R., Daur, N., Hedrich, U. B., and Stein, W. (2008). Regulation of motor pattern frequency by reversals in proprioceptive feedback. Eur. J. Neurosci. 28, 460–474.
Smarandache, C. R., and Stein, W. (2007). Sensory-induced modification of two motor patterns in the crab, Cancer pagurus. J. Exp. Biol. 210, 2912–2922.
Srinivasan, M. V. (2011). Honeybees as a model for the study of visually guided flight, navigation, and biologically inspired robotics. Physiol. Rev. 91, 413–460.
Stein, W. (2009). Modulation of stomatogastric rhythms. J. Comp. Physiol. A Neuroethol. Sens. Neural. Behav. Physiol. 11, 989–1009.
Stein, W., Delong, N. D., Wood, D. E., and Nusbaum, M. P. (2007). Divergent co-transmitter actions underlie motor pattern activation by a modulatory projection neuron. Eur. J. Neurosci. 26, 1148–1165.
Stein, W., Eberle, C. C., and Hedrich, U. B. S. (2005). Motor pattern selection by nitric oxide in the stomatogastric nervous system of the crab. Eur. J. Neurosci. 21, 2767–2781.
Stein, W., Smarandache, C. R., Nickmann, M., and Hedrich, U. B. (2006). Functional consequences of activity-dependent synaptic enhancement at a crustacean neuromuscular junction. J. Exp. Biol. 209, 1285–1300.
Stein, W., Straub, O., Ausborn, J., Mader, W., and Wolf, H. (2008). Motor pattern selection by combinatorial code of interneuronal pathways. J. Comput. Neurosci. 25, 543–561.
Taylor, A. L., Goaillard, J. M., and Marder, E. (2009). How multiple conductances determine electrophysiological properties in a multicompartment model. J. Neurosci. 29, 5573–5586.
Thuma, J. B., Morris, L. G., Weaver, A. L., and Hooper, S. L. (2003). Lobster (Panulirus interruptus) pyloric muscles express the motor patterns of three neural networks, only one of which innervates the muscles. J. Neurosci. 23, 8911–8920.
Tohidi, V., and Nadim, F. (2009). Membrane resonance in bursting pacemaker neurons of an oscillatory network is correlated with network frequency. J. Neurosci. 29, 6427–6435.
Tosato, M., Yoshida, K., Toft, E., Nekrasas, V., and Struijk, J. J. (2006). Closed-loop control of the heart rate by electrical stimulation of the vagus nerve. Med. Biol. Eng. Comput. 44, 161–169.
Wallen, P., Ekeberg, O., Lansner, A., Brodin, L., Traven, H., and Grillner, S. (1992). A computer-based model for realistic simulations of neural networks. II. The segmental network generating locomotor rhythmicity in the lamprey. J. Neurophysiol. 68, 1939–1950.
Weimann, J. M., Meyrand, P., and Marder, E. (1991). Neurons that form multiple pattern generators: identification and multiple activity patterns of gastric/pyloric neurons in the crab stomatogastric system. J. Neurophysiol. 65, 111–122.
White, R. S., and Nusbaum, M. P. (2011). The same core rhythm generator underlies different rhythmic motor patterns. J. Neurosci. 31, 11484–11494.
Zhang, Y., Oliva, R., Gisselmann, G., Hatt, H., Guckenheimer, J., and Harris-Warrick, R. M. (2003). Overexpression of a hyperpolarization-activated cation current (Ih) channel gene modifies the firing activity of identified motor neurons in a small neural network. J. Neurosci. 23, 9059–9067.
Appendices
Appendix 1
Appendix 2
Keywords: central pattern generation, sensorimotor, proprioception, spike frequency adaptation, emergent properties
Citation: Daur N, Diehl F, Mader W and Stein W (2012) The stomatogastric nervous system as a model for studying sensorimotor interactions in real-time closed-loop conditions. Front. Comput. Neurosci. 6:13. doi: 10.3389/fncom.2012.00013
Received: 18 October 2011; Accepted: 25 February 2012;
Published online: 14 March 2012.
Edited by:
Misha Tsodyks, Weizmann Institute of Science, IsraelReviewed by:
Andre Longtin, University of Ottawa, CanadaJordan Chambers, University of Melbourne, Australia
Evan Thomas, Florey Neuroscience Institutes, Australia
Copyright: © 2012 Daur, Diehl, Mader and Stein. This is an open-access article distributed under the terms of the Creative Commons Attribution Non Commercial License, which permits non-commercial use, distribution, and reproduction in other forums, provided the original authors and source are credited.
*Correspondence: Wolfgang Stein, School of Biological Sciences, Illinois State University, Normal, IL 61790, USA. e-mail:d3N0ZWluQG5ldXJvYmlvbG9naWUuZGU=
†Present address: Nelly Daur, Whitney Laboratory for Marine Bioscience, University of Florida, St. Augustine, FL 32080, USA.