Abstract
We propose a model of neurite growth to explain the differences in dendrite and axon specific neurite development. The model implements basic molecular kinetics, e.g., building protein synthesis and transport to the growth cone, and includes explicit dependence of the building kinetics on the geometry of the neurite. The basic assumption was that the radius of the neurite decreases with length. We found that the neurite dynamics crucially depended on the relationship between the rate of active transport and the rate of morphological changes. If these rates were in the balance, then the neurite displayed axon specific development with a constant elongation speed. For dendrite specific growth, the maximal length was rapidly saturated by degradation of building protein structures or limited by proximal part expansion reaching the characteristic cell size.
Introduction
Recent theoretical and experimental studies in neuroscience have demonstrated that many molecular, cellular, network, and system level functions of the brain can be simulated using computational models in silico. Such models can assist in the understanding of how lower level dynamics can be projected to a system level outcome. These models involve construction of large scale networks mimicking the morphology and functions of particular brain circuits, such as models of thalamocortical system (Izhikevich and Edelman, 2008), cortical column simulation (Markram, 2006), and many other brain modeling initiatives (Fleischer et al., 2007; Ananthanarayanan et al., 2009; Markram et al., 2011). The models used in these simulations collected cell morphology, molecular interactions and connectivity from experimental studies. Some aspects of network development in silico can be investigated using simulators such as Netmorph (Koene et al., 2009) and CX3D (Zubler and Douglas, 2009; Zubler et al., 2013) and neural culture models (Gritsun et al., 2012). However, many fundamental questions, including axon, and dendrite differentiation and the influence of intra- and extra-cellular factors on the elongation, navigation, and branching of neurites, are still under discussion. From a computational point of view, it is also important to generate a minimal biologically relevant cell development model to simulate large networks.
Neurite growth involves complex molecular machinery responsible for cytoskeleton formation driven by intracellular and extracellular signaling. One of the main building blocks of the cytoskeleton are microtubules (Heidemann, 1996). They represent long polymers formed by heterodimers of tubulin. The most active microtubules, which are capable of joining and contracting, are localized in the end of the neurite called the growth cone (Shea, 1999; Morrison et al., 2002). Thus, neurite elongation can be considered as elongation of the microtubules located in the distant parts of the neurite. Building proteins (e.g., tubulin) are synthesized in the soma and have to be transported to the growth cone. In one hypothesis, this transport is provided by oligomers or microtubule fragments transported by motor proteins along the neurite (Wang and Brown, 2002; Vale, 2003; Baas and Buster, 2004; Hirokawa and Takemura, 2007). Another hypothesis is based on heterodimers of tubulin synthesized in the soma and moved along the neurite due to both diffusion and active transport (Galbraith et al., 1999; Kimura et al., 2005).
Different aspects of neurite growth dynamics have been studied using mathematical models. Most of them are focused on the description of molecular machinery underlying the elongation process. Such models usually consider tubulin microtubule dynamics and its contribution in neurite growth. All models describing the elongation dynamics, share the concept mentioned above (tubulin synthesis takes place in the cell body and then it travels toward the growth cone). The key difference of the existing models is in description of building protein delivery to the growth cone. In (Samuels et al., 1996; Van Ooyen et al., 2001; Toriyama et al., 2010) neurite is considered as a single compartment, and elongation dynamics is determined by a fraction of a some shared resource (such as building proteins or proteins promoting elongation). The competition process leads to the monopolization of the resource by single neurite which demonstrates axon-like development, while other neurites elongation is slowing down.
Another approach has been proposed in Miller and Samuels (1997). Based on conveyor analogy of active transport process, accounting the degradation of the protein, linear decrease active transport velocity has been proposed. Using this assumption, the estimation of the axon maximum length was performed.
More detailed description of the outgrowth development involves consideration of the evolution of the building proteins concentration profile along the neurite. In one approach the outgrowth is represented as a segments sequence and tubulin transition toward the growth cone is carried out by the adjacent compartments interaction (active transport and/or diffusion). It should be noted that usually the segments radius changes when the neurite branching occurs. These models reproduce a wide variety of developmental scenarios, for example dendritic trees formation accounting the calcium-dependent processes of MAPs (de-)phosphorylation (Graham and Van Ooyen, 2001, 2004; Hely et al., 2001; Kiddie et al., 2004; Hjorth et al., 2014; Mironov et al., 2014).
Another models type suggests the most detailed study of the tubulin transport along non-branching process. To this end, the PDE describing the concentration of tubulin as a function of time and distance from the soma along the axon to the growth cone is used (McLean et al., 2004; Diehl et al., 2014). The analysis of PDE provides the stationary tubulin distribution along the process and allows making estimations of neurite maximum length.
Here, a novel mathematical model reproducing experimental data of dendrite and axon specific development is proposed. The main focus is made on the relationship between geometrical characteristics and effective rate of tubulin transport of the neurite. In particular, the balance of these rates predicts a neurite projected over a very long distance, i.e., reproducing the axon specificity.
Results
Geometry independent model
We propose a mathematical model of non-branching neurite elongation based on the dynamics of cytoskeleton microtubules under the following assumptions. The elongation depends on tubulin concentration in the growth cone. Building proteins are synthesized only in the cell soma, and there is no additional tubulin production occur in other compartments (e.g., in the axon and dendrites). We assumed that the intracellular machinery regulating the synthesis compensates for building proteins utilized for the elongation (moreover, as we shall see, together with geometrical changes it forms a positive feedback that supports the neurite growth). In other words, the concentration of tubulin heterodimers in the soma is sustained near a constant level (Cleveland et al., 1981; Theodorakis and Cleveland, 1992). In the cell soma, the tubulin forms quite massive structures (e.g., oligomers or microtubule fragments), hence the contribution of their passive diffusion to the neurite elongation is negligibly small. Therefore, we assumed that tubulin transport from the cell soma to the growth cone was provided by active transport only. It is implemented by motor proteins binding tubulin structures and bringing them to the growth cone. For our purposes, we do not explore further details of these mechanisms, assuming only that the active transport occurs with a certain constant speed.
Also, it should be mentioned that the neurite elongation rate (Keenan et al., 2006; Rizzo et al., 2013) is usually several times lower than the active transport velocity (Table 1) and it makes possible to consider the growth process using quasi-steady-state approximation (i.e., in the form of alternating stationary states).
Table 1
| Parameter | Value | Units | |
|---|---|---|---|
| α | Neurite growth rate | 1.5–22 | |
| The rate for GTP-tubulin association with microtubule is generally considered in the range of 106−107M−1·s−1 (Mitchison and Kirschner, 1984; Desai and Mitchison, 1997). Using estimation of microtubule structural parameters (tubulin dimer size is 8 nm; microtubules are formed by the parallel association of 13 protofilaments, so 1 μm of microtubule consist 1625 tubulin dimers), neurite growth rate can be calculated: It should be noted that the estimation was performed in assumption than all microtubules grow simultaneously, but in practice their dynamics is highly desynchronized (some microtubules are shrinking, giving building material for neighbors' polymerization). Thus, the lower limit of neurite elongation rate should be decreased. In this paper the values in the range of 1.5–22 are considered. |
|||
| β | Neurite contraction rate | 0.2–99 | |
| According to experimental data of tubulin dissociation rate measurement it lies in the range 0.1 to 45 dimers s−1 (Walker et al., 1988; Drechsel et al., 1992; Desai and Mitchison, 1997). Using the algorithm described above the interval mentioned can be projected to 0.2–99 μM·h−1. | |||
| C 0 | Tubulin concentration in the proximal part of neurite | 5–20 | μM |
| Values are reported in (Gard and Kirschner, 1987; Walker et al., 1988). | |||
| τ | The rate of building material (tubulin structures) degradation | 0.0004–4 | h −1 |
| The range of acceptable values is determined by the individual microtubules half-life, which is 5–10 min. On the other hand, the upper bound is limited by the tubulin dimer degradation constant—several days (Sjöstrand and Karlsson, 1969; Hoffman and Lasek, 1975; Miller and Samuels, 1997). | |||
| V at | The rate of active transport | 12–100 | |
| Values are reported in (Lasek et al., 1984; Brown, 2000). | |||
Estimation of model parameters value.
To describe the evolution of the tubulin concentration along the neurite, the following approach was used. Let's consider number of tubulin structures moving along toward growth cone at constant velocity Vat. There is also the degradation of the building material (e.g., oligomers or fragments of microtubules) during their transport. Consequently, the number of structures can be formulated in the following form:
Where, N0 is the number of structures localized in the proximal part of the neurite (near the cell soma), N(x)—at the distance x along the neurite (x ∈ [0, L], L is a total length of neurite), Vat is the speed of the active transport, and τ is a constant describing the rate of building material (tubulin structures) degradation. The resulting equation can be expressed in terms of concentration. Thus a concentration profile in case of shape independent model (the cross-sectional area is constant along the neurite) can be represented as
Where, C0 denotes the tubulin concentration in the proximal part of the neurite (its value is equal to concentration of building proteins in the cell soma) and C(x) is the profile of the tubulin concentration along the neuronal outgrowth. The concentration of the building material localized in a growth cone (Cgc) available for neurite elongation can be obtained from Equation (2) as Cgc = C(L) (where L is a total length of the neurite). Assuming that the intensity of microtubule polymerization is a function of available building protein, the rate of the elongation process in a quasi-steady-state approximation can be expressed in the following form:
Where, α and β are constants representing rates of neurite growth and contraction, respectively.
It follows from Equation (3) that the elongation rate decreases exponentially with increasing neurite length. Moreover, when the concentration in the growth cone reaches some critical level (Cgc = Ccr = b/a) the neurite growth stops (microtubule assembly is fully compensated by depolymerization process). Thus, the maximum neurite length is defined by the following value
Note that the model accounts indirectly for mechanisms specific for dendrite and axon development. In particular, in defining the different values for the active transport velocity, one can take into account the influence of the microtubule orientation in dendrites and in axons (Heidemann et al., 1981; Baas et al., 1988) and the contribution of tubulin post-translational modification, which determines the spectrum of molecular motors that may participate in the cargo transport along microtubules (Reed et al., 2006; Bulinski, 2007; Konishi and Setou, 2009). Variations of the tubulin structure degradation rate reflect specific mechanisms of the axon and dendrite development associated with different proteins (maps/tau proteins) involved in the stabilization of the microtubules.
Shape-dependent model
Next, we analyzed the effect of neurite geometry on the elongation dynamics. Our results suggested that the shape, e.g., neurite tapering with the distance from cell soma, may have a significant impact on the developmental dynamics. To account for this we made the following assumptions. First we assumed that the neurite cross-section near the growth cone is fixed and does not depend on the neurite length. Second, a possible source of soluble tubulin for neurite caliber enlargement may be a building material, which is released during depolymerization of microtubules transported. Thus, it does not reach the growth cone, while it can be used for the local changes in the neurite. Third, for simplicity, we assumed that the cross-section at any distance from the soma has a circular shape with a radius, R(x, L), which changes with the distance from the soma and total neurite length. Because cross-sectional area near the growth cone is assumed to be constant, the following boundary condition should be satisfied: R(x, L)|x = L = r. Thus, using Equation (1), we obtained the following relationship:
Where S(x, L) is the cross-section area and C(x, L) is the concentration profile along the neurite (x ∈ [0, L]), S(0, L) denotes the cross-section area of the proximal part of the neuronal outgrowth. In this case, the concentration of building material localized in the growth cone (x = L) and available for neurite elongation is defined by the following Equation: where R(0, L) and r denote the radius of the cross-section near the cell soma and the growth cone, respectively. Also geometrical restriction (GR) introduced here meaning that proximal segment radius cannot exceed the soma size. Thus, tubulin concentration in the growth cone depends on the caliber ratio (CR) R(0, L)/r.
To illustrate how the neurite geometry influences the elongation dynamics, we investigated two options of R(x, L) dependence. First, we considered the linear dependence of the radius on the total length of the neurite, i.e., R(x, L) = r (1 + k (L - x)), R(0, L) = r (1+k L) where k is a tapering constant. It follows from Equation (6) that
Resulting curves for maximal length and elongation dynamics depending on different parameters of the model are illustrated in Figure 1. Note that initially the elongation speed increases with the factor (1 + kL)2, i.e., providing positive feedback. This is a cooperative effect of two processes. The first one is an increase of tubulin influx due to expansion of the proximal part. On the other hand, the increase of tubulin synthesis occurs, since, as previously noted, intracellular machinery maintains the tubulin concentration in soma at a fixed level. Thus, a feedback, stimulating the elongation process emerges. However, with increasing length, the portion of available tubulin decreases (building proteins need more time to travel from the cell soma to the growth cone, therefore, more tubulin structures degrade), hence slowing the elongation process. Note that this model prediction is in good agreement with experimental observations of dendrite growth (Dotti et al., 1988; Teichmann and Shen, 2011). Figure 2 illustrates the dendrite elongation dynamics of DA9 motor neuron in wild-type C. elegans. Analysis of the dendrite development of such type neuronal cells is interesting in the context of this paper, primarily because it forms single unbranched outgrowth. Thus, mentioned experimental model is very useful for verification of simulation results. It demonstrates the existence of a distinct phase of accelerated elongation that, in accordance with the proposed model can be explained by the presence of positive feedback, and the phase of slowing down growth, caused by the building protein degradation. Thus, it supports the prediction that the dendritic tapering with increasing distance to the cell soma may be linear or nearly linear.
Figure 1
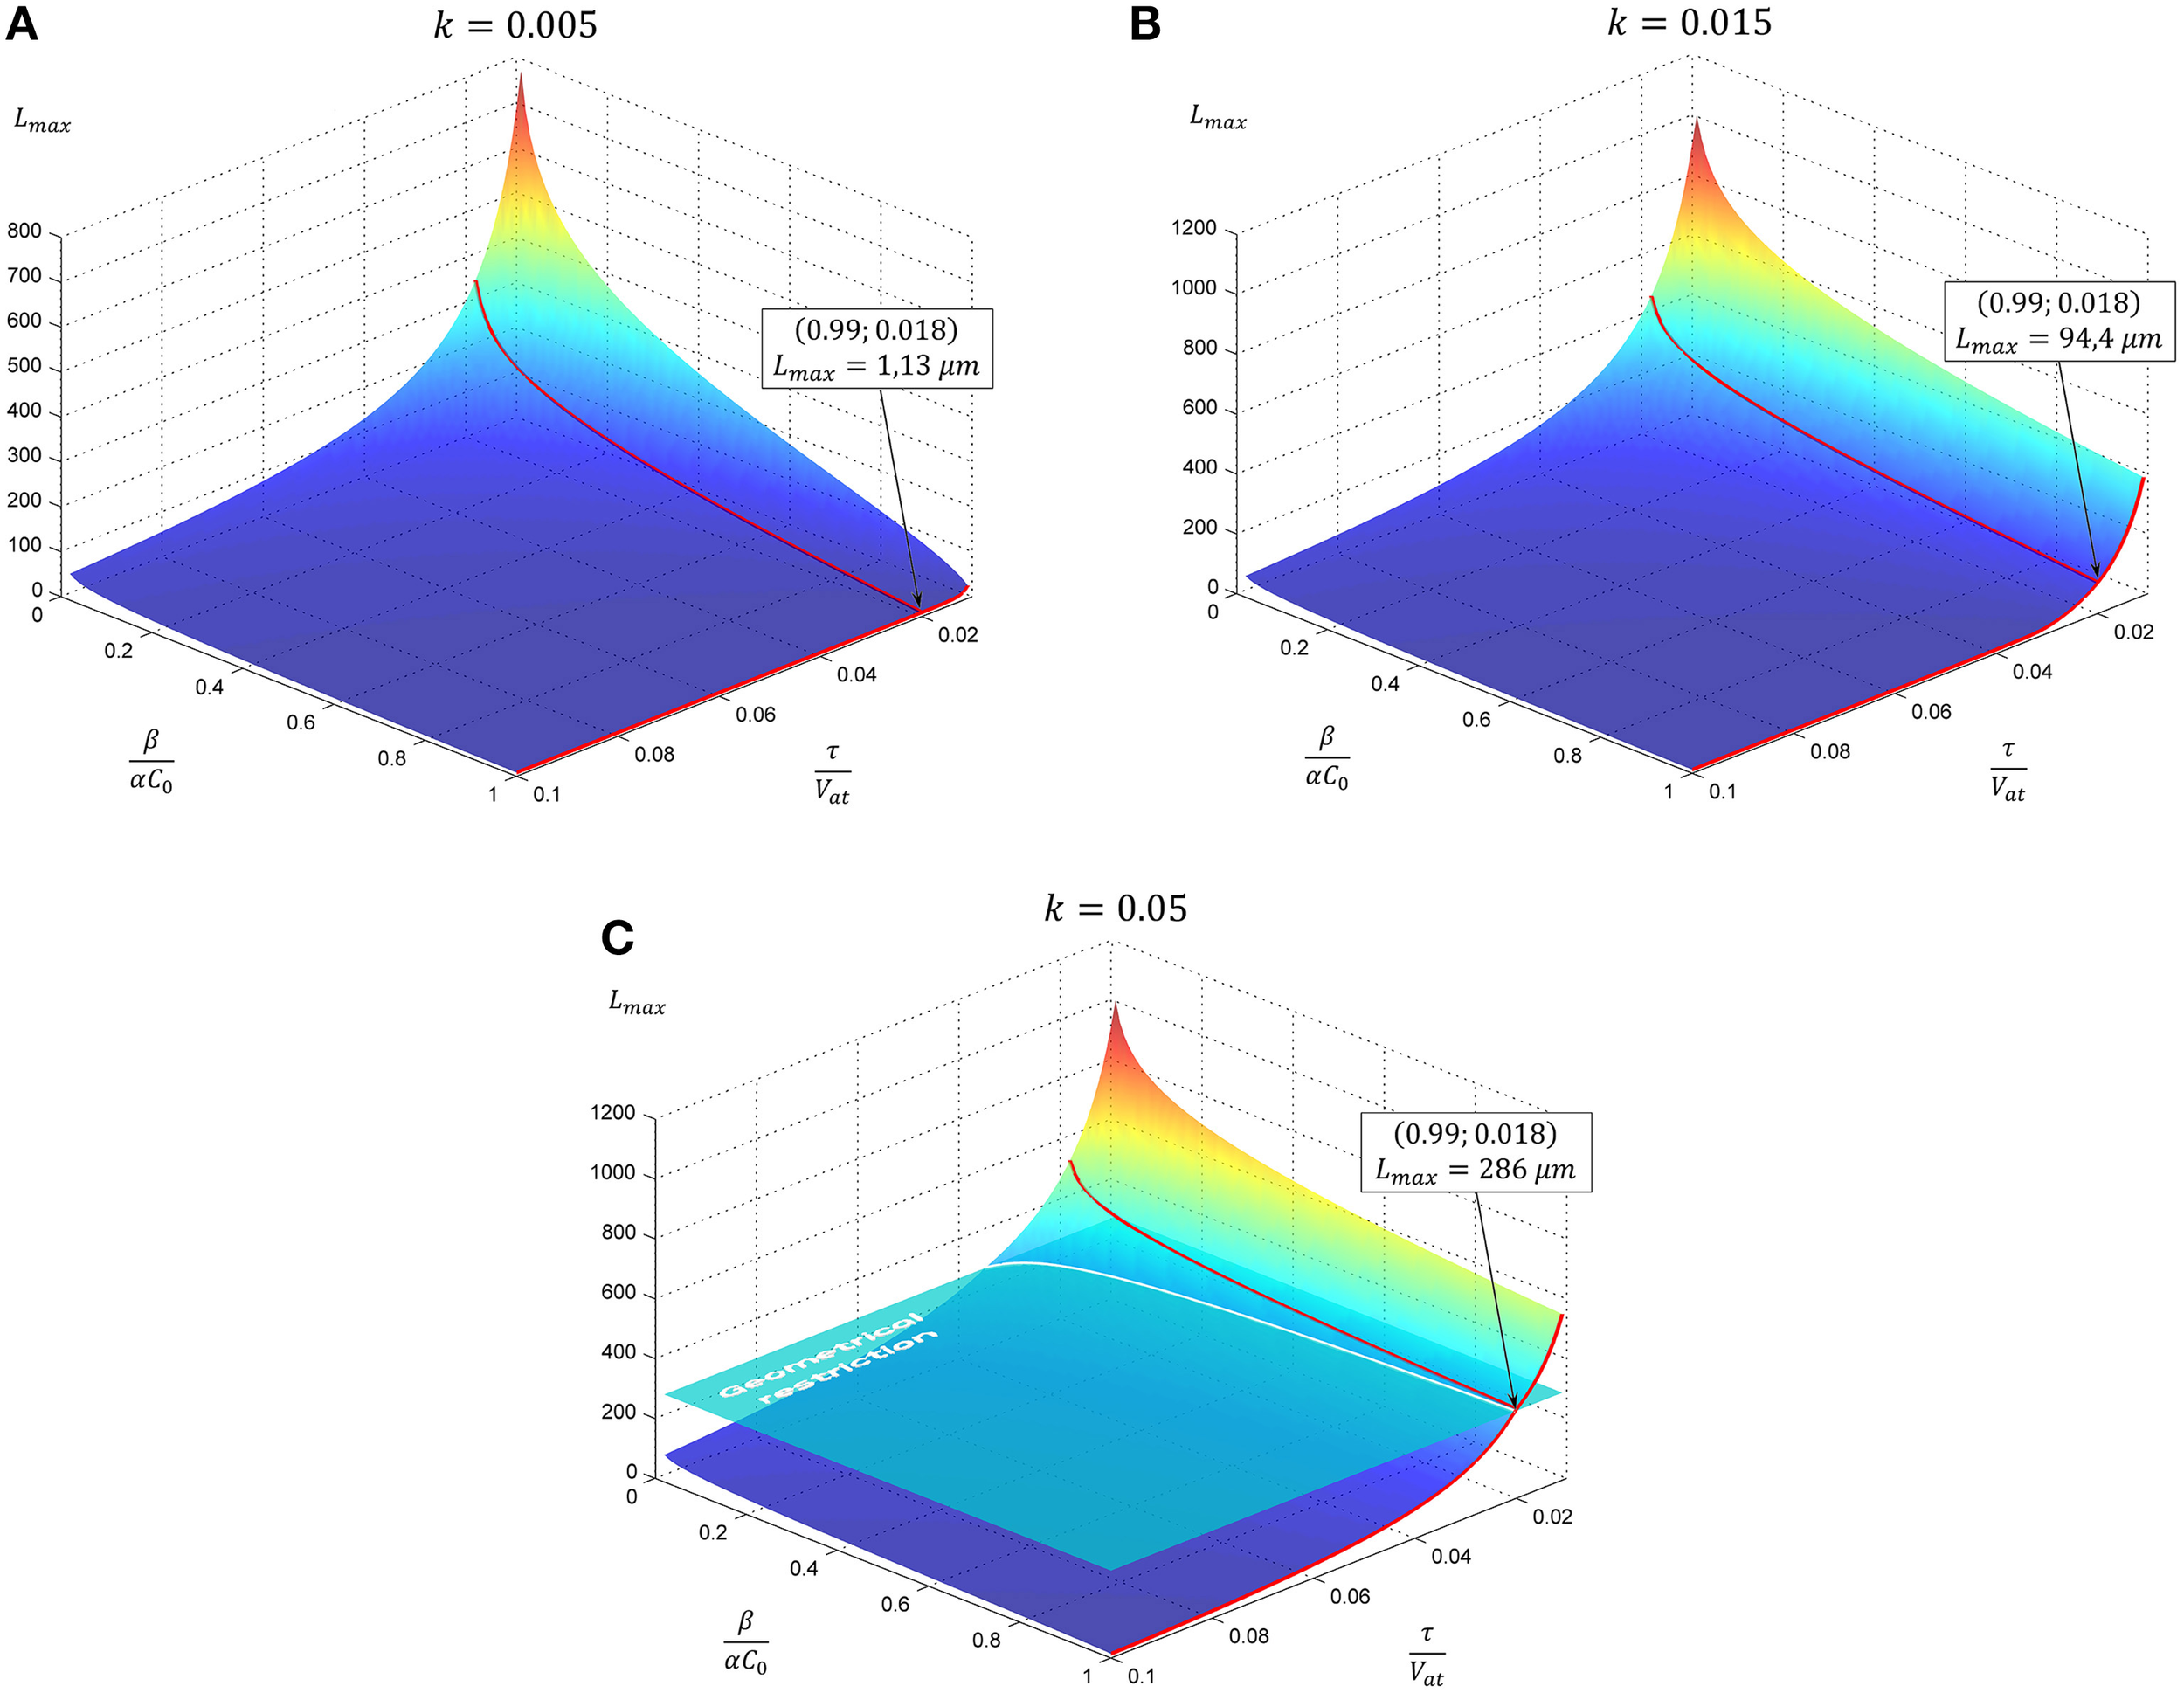
The evolution of neurite maximal length depending on model parameters. In subsequent panels results for the case of linear tapering are presented. The geometrical restriction (GR) represents the case when the proximal segment radius reaches the soma size. Parameter k characterizing neurite narrowing is varied: (A)k = 0.005, (B)k = 0.015, (C)k = 0.05. All calculations are performed with GR = 15. Point marked corresponds to the case considered in Figure 2.
Figure 2
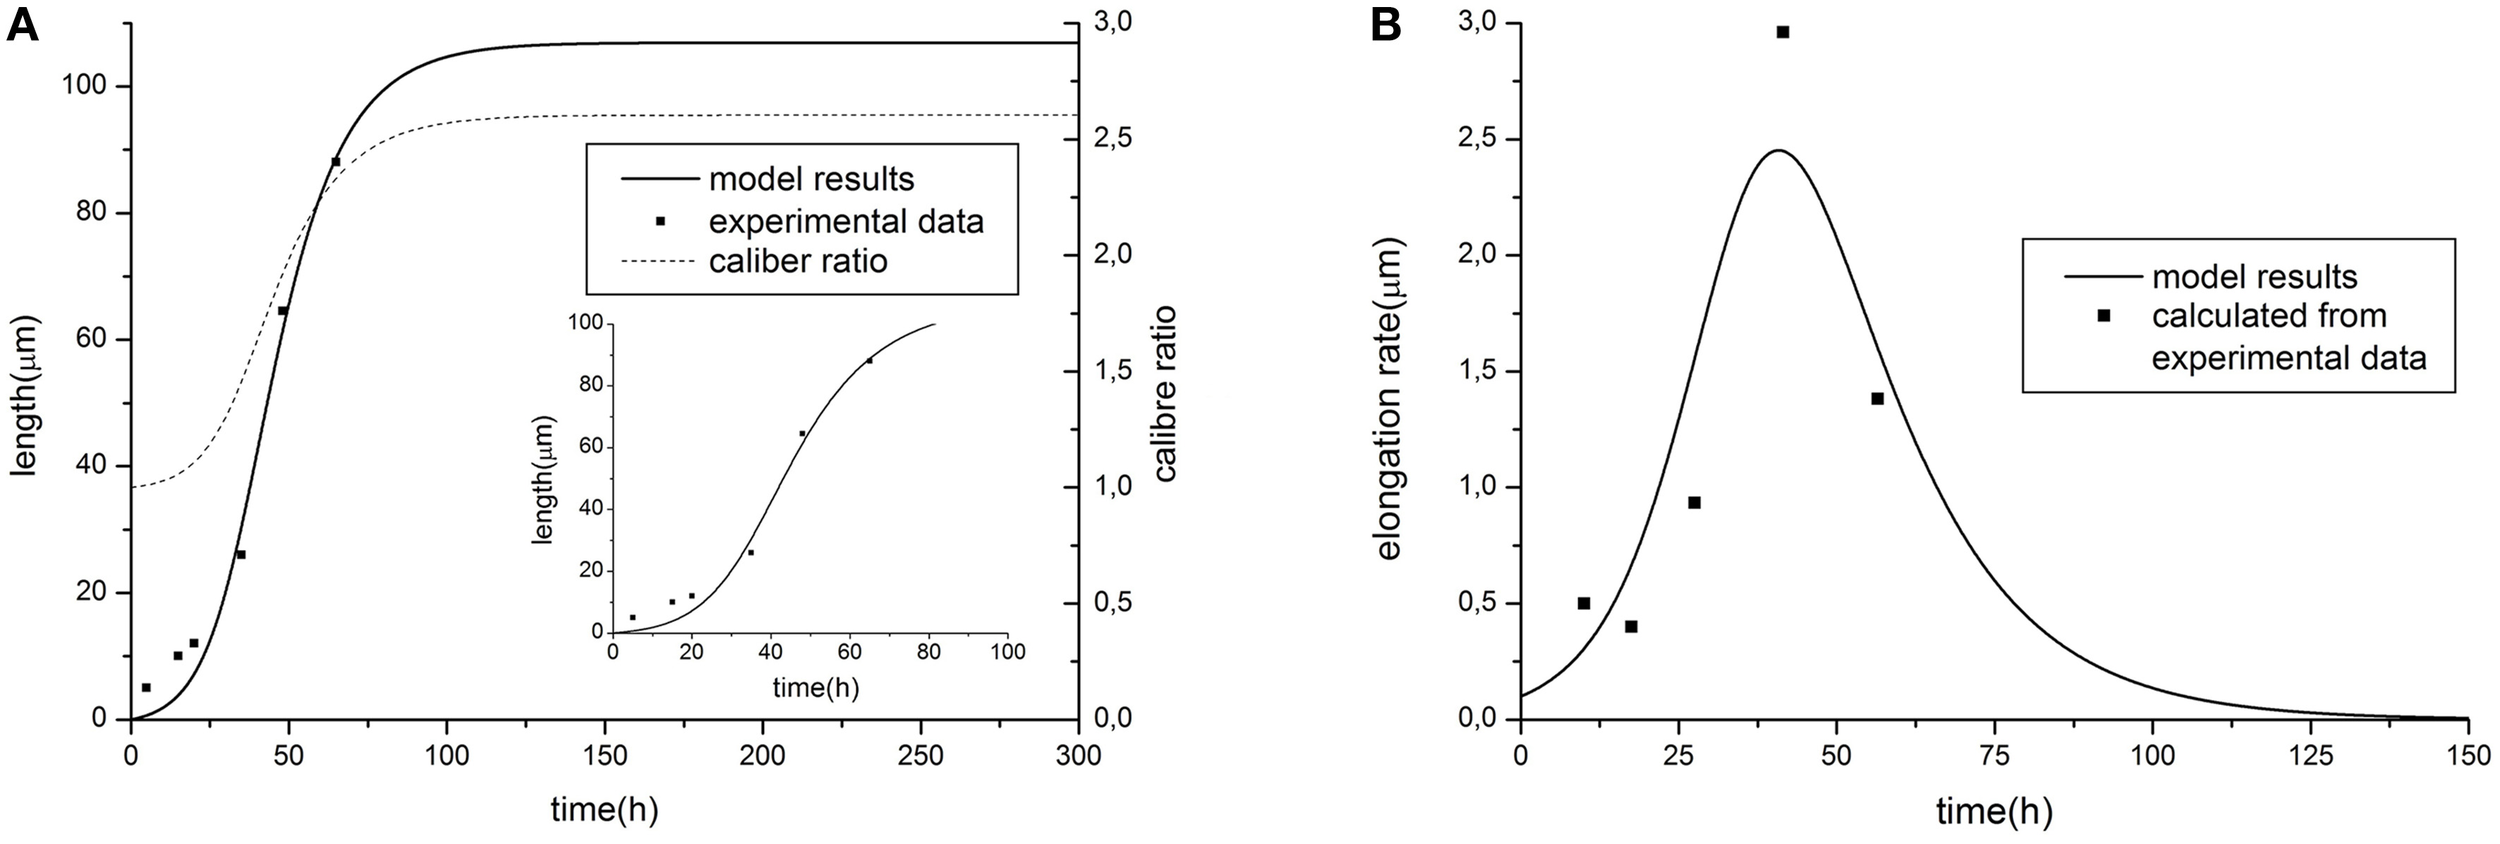
Comparison of model predictions [(A) elongation dynamics and (B) rate for the case of linear tapering] with experimental data of dendrite growth (modified from (Teichmann and Shen, 2011), data represents the development of the DA9 motor neuron in wild-type C. elegans). Parameter values: α = 1.58, β = 9.38, C0 = 6, τ = 0.54, Vat = 30, k = 0.015. The value of caliber ratio represent the relationship between size of proximal and distal neurite part (R(0, L)/r) depending on time.
Second, let us assume that the neurite radius transformation has the following form: i.e., the neurite cross-sectional area decreases exponentially with distance from the cell soma, and elongation dynamics can be described by the following expression:
Note that the rate of elongation is limited by the geometric restriction, GR, and by the limit of active transport velocity, Vat. Since neurite elongation requires tubulin, the overall growth rate is determined by building protein transport to the growth cone.
The dependence of the neurite elongation dynamics on model parameters is illustrated in Figure 3. Interestingly, depending on the value k - τ/Vat, one of three possible scenarios for the development processes can be realized (Figure 4).
Figure 3
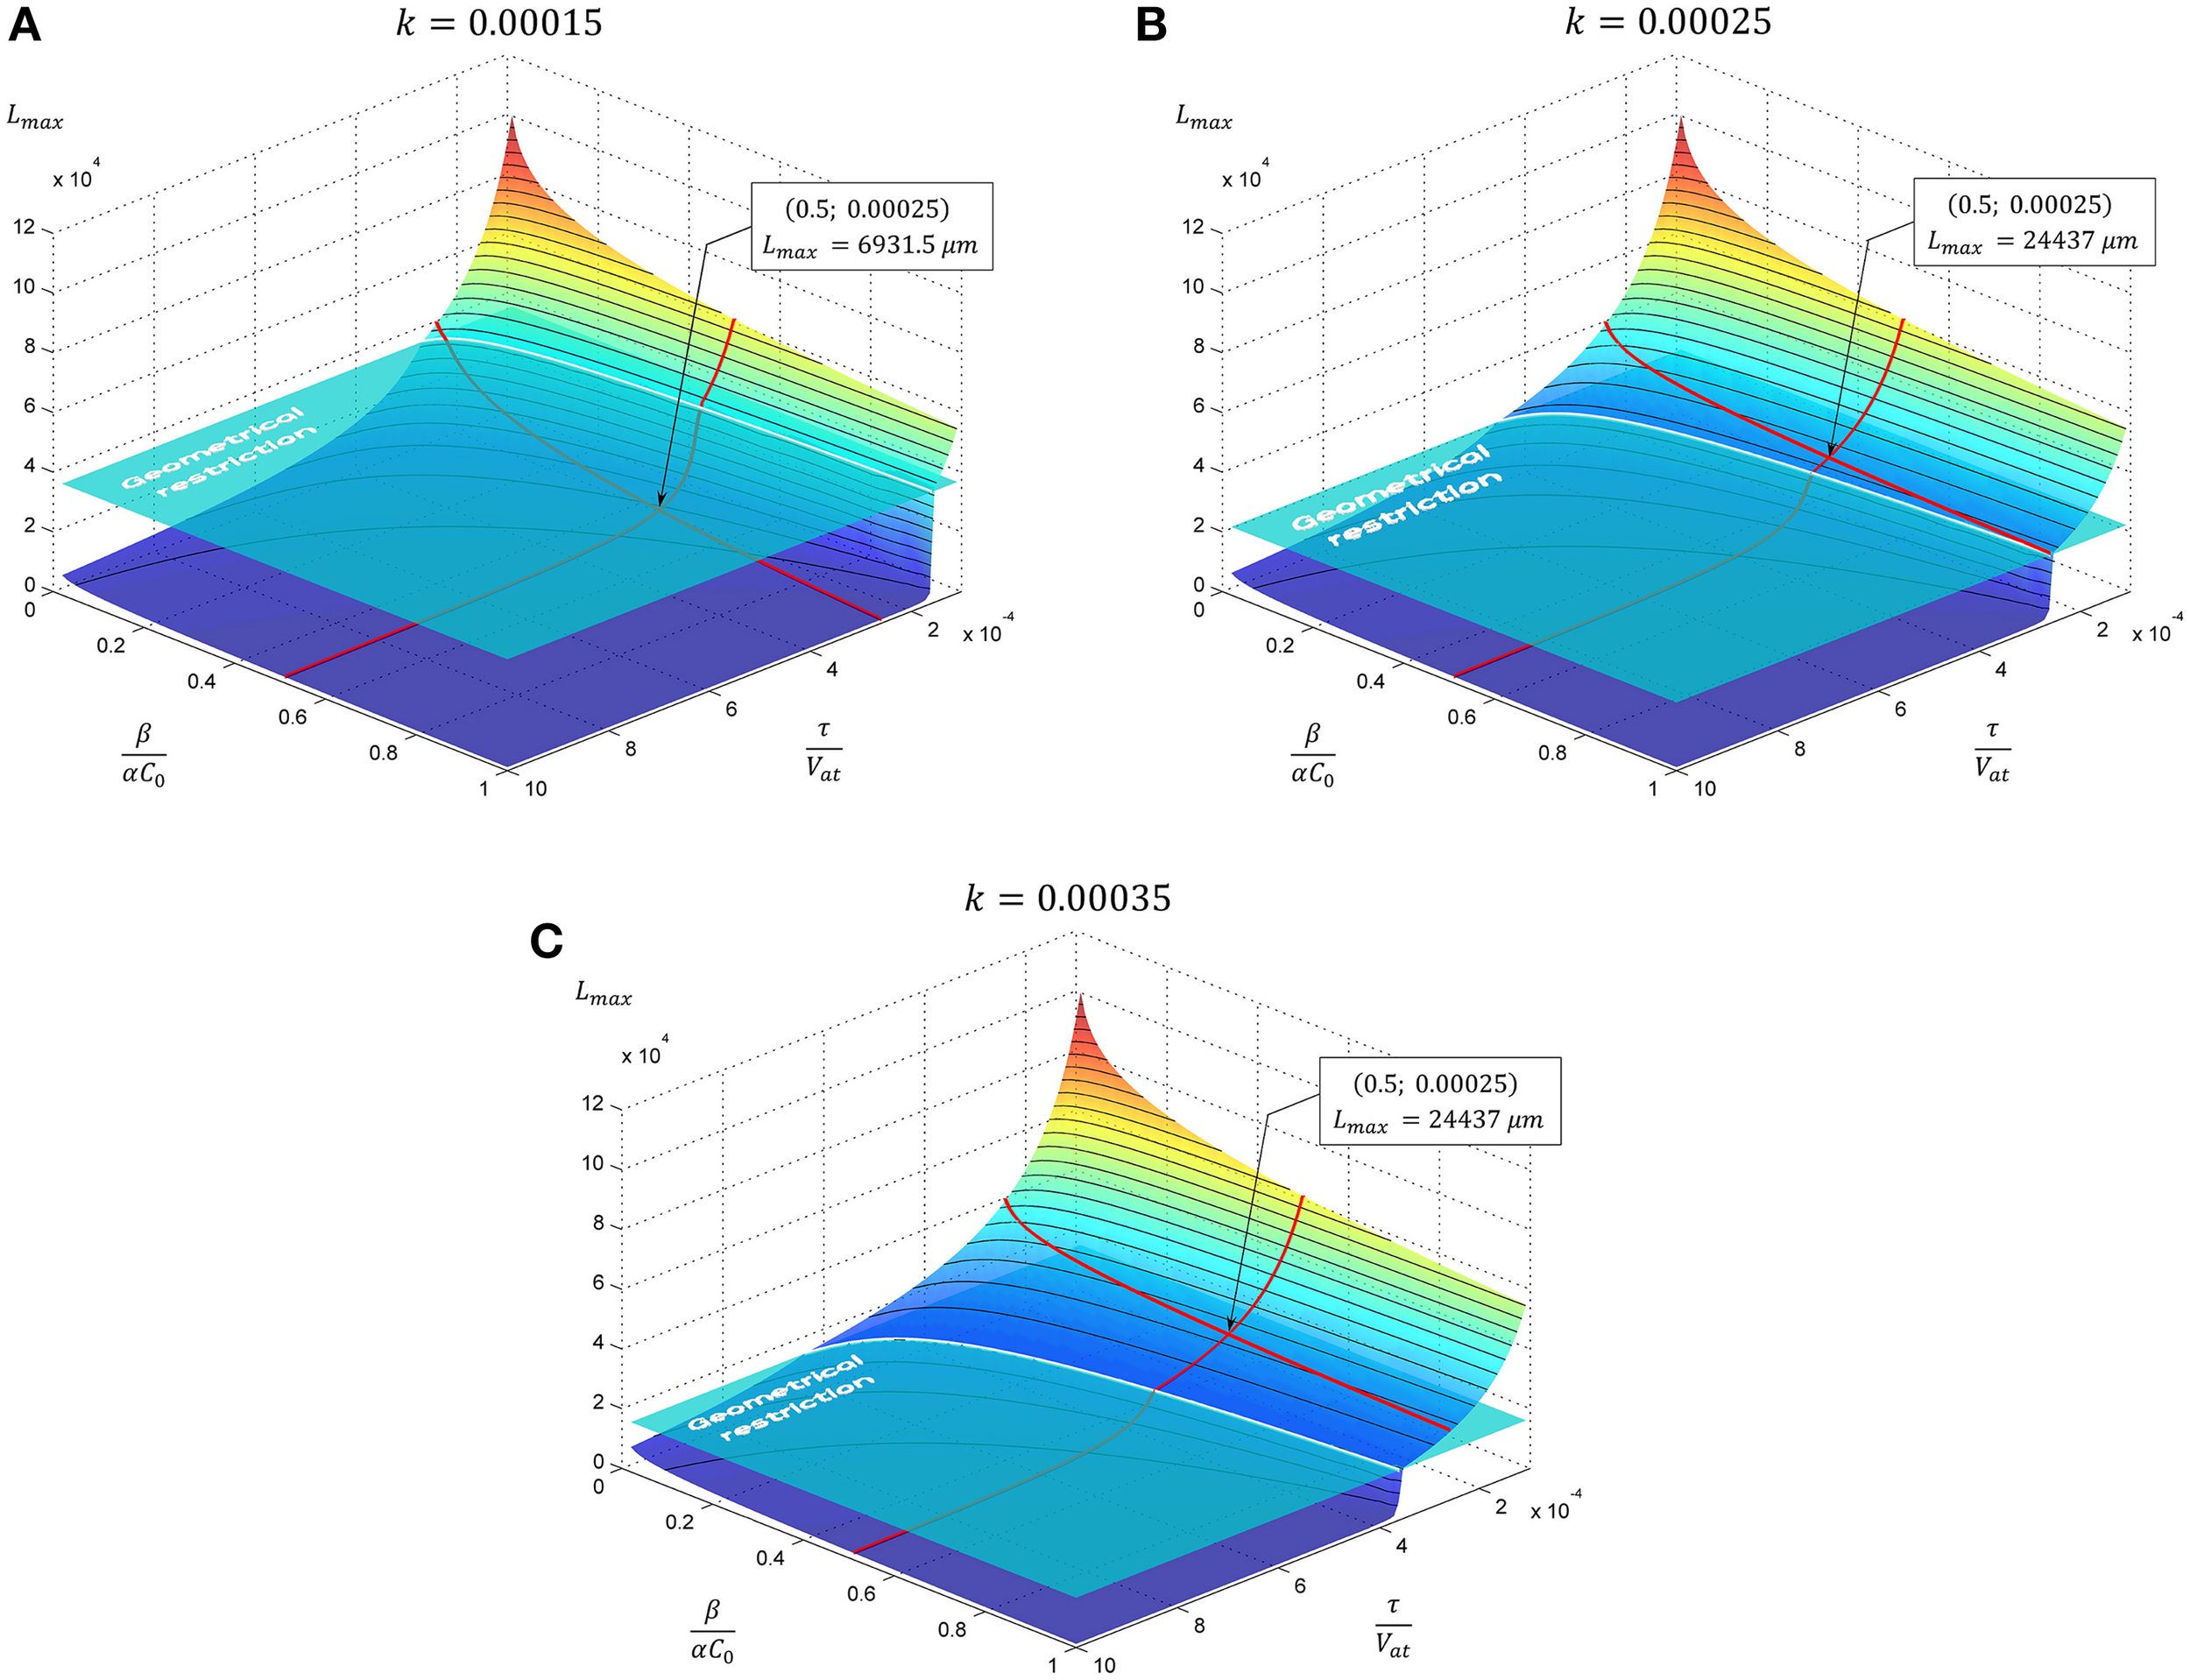
The evolution of neurite maximal length depending on model parameters. In subsequent panels results for the case of exponential decay of neurite cross-sectional area are presented. Tapering parameter k is varied: (A)k = 0.00015, (B)k = 0.00025, (C)k = 0.00035, geometrical restriction GR = 15. Point marked corresponds to the case considered in Figure 4.
Figure 4
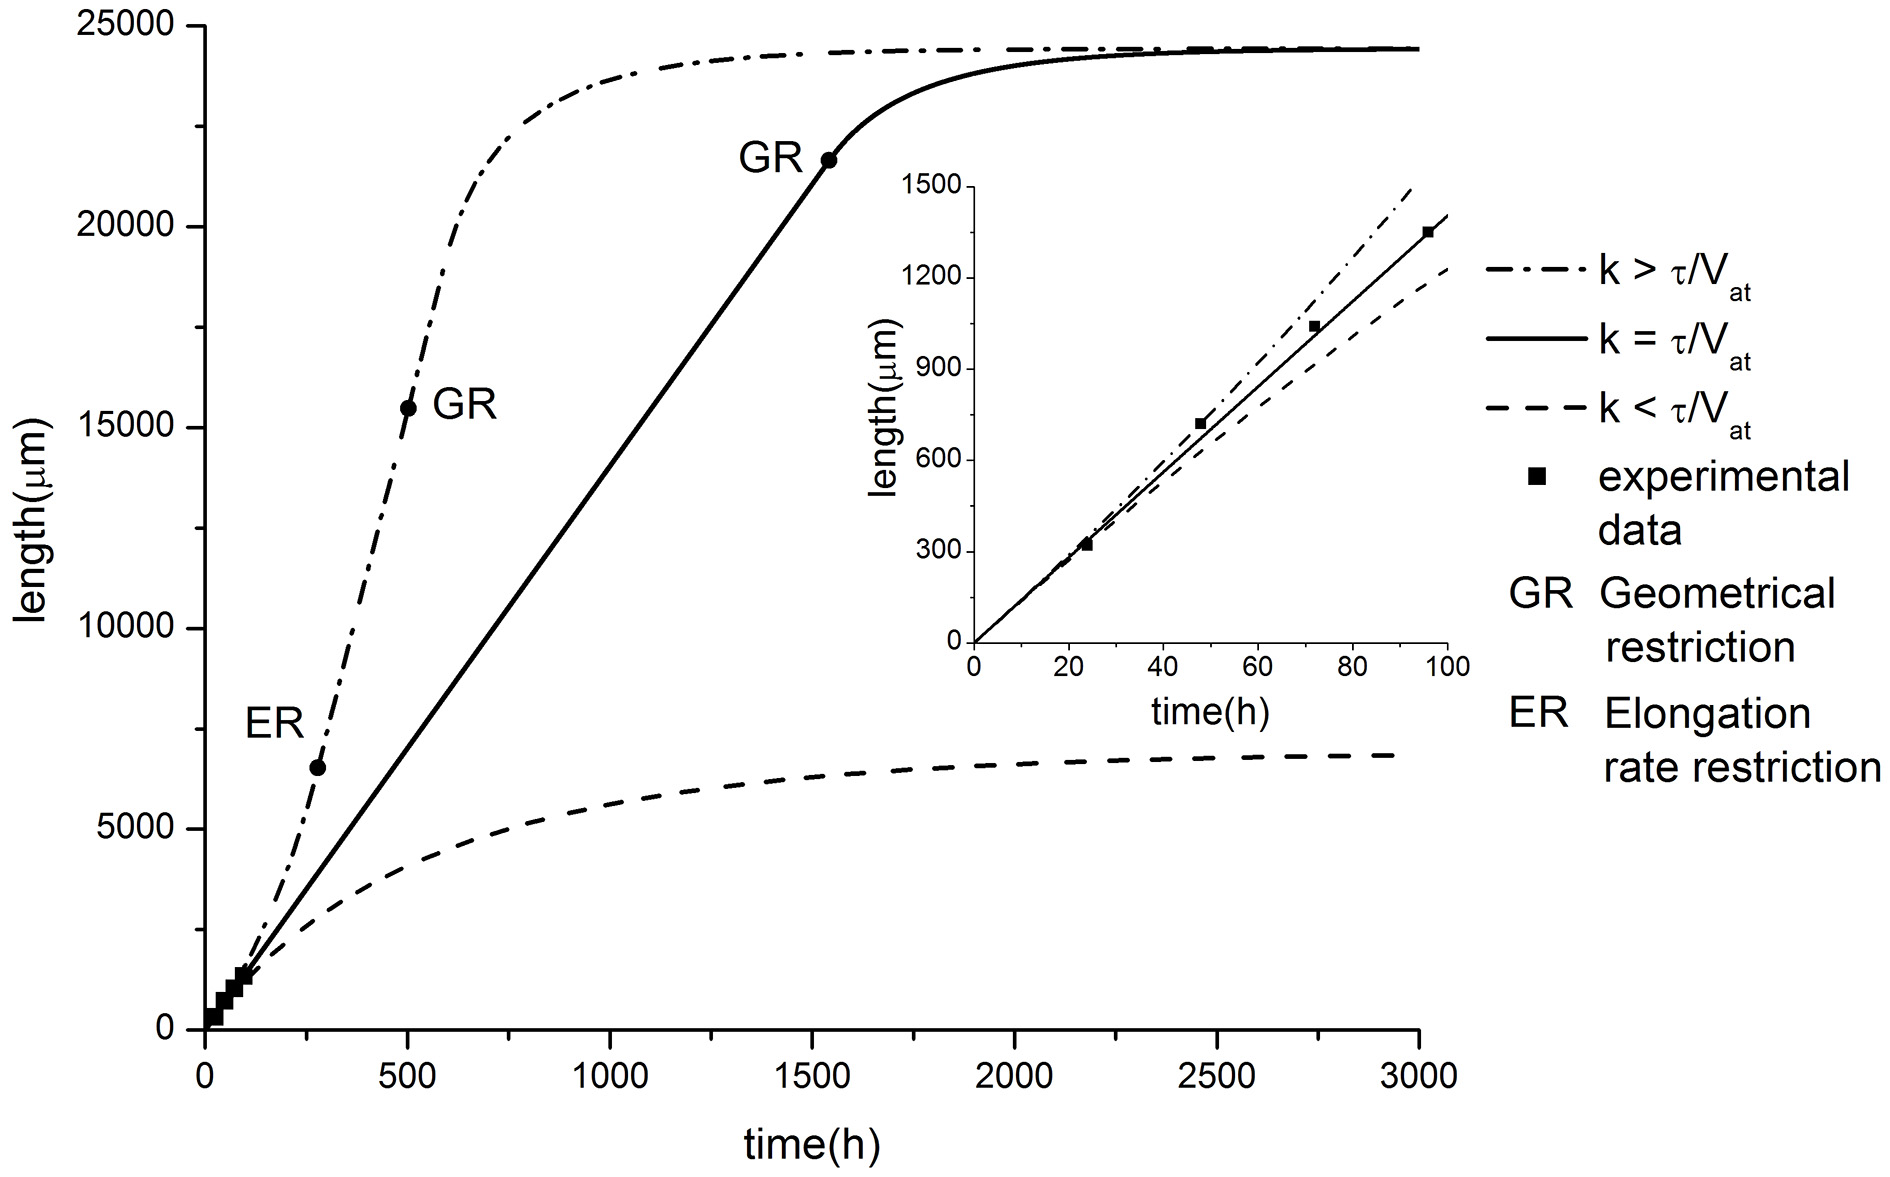
Comparison of model predictions in case of exponential tapering with experimental data of axon growth (modified from Karten et al., 2005). Parameter values: α = 2.81, β = 14.06, C0 = 10, τ = 0.005, Vat = 40. Different elongation dynamics are illustrated for different values of parameter k: k = 0.00015 < τ/Vat; k = 0.00025 = τ/Vat; k = 0.00035 > τ/Vat. The ER restriction means that the upper limit of neurite elongation rate determined by the active transport rate is achieved (dL/dt = Vat).
Let us focus on the case of exact balance, i.e., k = τ/Vat. As we noted earlier, typically, tubulin structures decay exponentially with increasing distance from the soma. However, in this case, the proximal segment increases exponentially during the elongation process. This effect provides the additional building protein influx from the cell soma (but, the tubulin concentration in the neurite proximal part C0 remains constant) sufficient to compensate for the loss of tubulin associated with degradation during the transport over longer distances. Note also that the neurite segment cross-sectional area and its volume decrease with distance at the same rate as the number of tubulin structures moving toward the growth cone. Therefore, the building protein concentration in the growth cone can be sustained at some constant level regardless of the distance from the cell soma. Thus, in the case where k = τ/Vat, the model predicts a sustainable elongation process with a fixed elongation rate:
As a validation of the presented hypothesis the comparison of numerical calculation results and experimental studies of axonal outgrowth is performed. Figure 4 shows the growth dynamics of axons of retinal ganglion cells isolated from the rat CNS (Karten et al., 2005). The experimental data demonstrate a linear neurite elongation throughout the experiment (Dotti et al., 1988; Rochlin et al., 1996; Karten et al., 2005) indicating that the building material flow remains unchanged. Nevertheless, the model predicts that the outgrowth length is again limited even in the balanced condition. In contrast to previous cases, we obtain geometrical restriction because the proximal segment radius cannot exceed the soma size. As a result, the building proteins inflow is saturated, since the further expansion of the neurite proximal part is impossible. Thus, the positive feedback which supports the neurite elongation disappears and finally the growth stops.
When k < τ/Vat, the neurite elongation dynamics were quite similar to the linear case considered earlier. The proximal segment expansion resulted in an increase in the amount of building proteins transported from the soma to the growth cone. However, this increase compensated for only a part of the tubulin loss due to degradation. As a result, the elongation process slows down over time and stops when a maximal length is reached (Figure 4).
For k > τ/Vat, neurite growth dynamics occurred with increasing elongation speed. This effect can be explained as follows. The rate of the tubulin flow increase depends on the proximal segment size and in the case of k > τ/Vat, it grows faster than losses occur due to the degradation of building proteins. This functions as positive feedback, accelerating the elongation process (Figure 4). However, similar to the case of constant speed elongation (k = τ/Vat), the geometric constraint of limited proximal segment size provides a growth saturation factor.
Note that for this case there is a bias of the balance toward positive feedback, e.g., building proteins influx exceeds the amount of tubulin needed to compensate its degradation with increasing the neurite length. Thus, the outgrowth elongation accelerates with the course of time. However, the growth rate is limited by the active transport velocity and accelerated growth is replaced by the steady elongation.
Discussion
We proposed a mathematical model of neurite development based on the microtubule cytoskeleton dynamics. The model incorporated basic molecular mechanisms underlying the elongation and demonstrated growth dynamics which is consistent with experimental studies of neural development (Dotti et al., 1988; Rochlin et al., 1996; Karten et al., 2005; Teichmann and Shen, 2011). In contrast to classical model approaches and existing experimental hypotheses considered differences in neurite structural organization (Baas et al., 1988; Sharp et al., 1997; Yu et al., 2000), selective post-translational microtubule modifications (Witte et al., 2008; Kollins et al., 2009) or accumulation of specific proteins (Takei et al., 2000; Gonzalez-Billault et al., 2001) as factors causing differences in the dynamics of dendrites and axons development (Bartlett and Banker, 1984) the main focus of the presented work is done on the effect of geometric changes occurring during the neurite elongation, and related scenarios of the outgrowth development.
Particularly, we found that the growth process can significantly depend on the neurite geometry. The geometrical transformation of the growth, e.g., changing the neurite radius with length, permitted us to delineate different types of the elongation dynamics. A dynamic mechanism of the geometry specific growth is concerned with interplay between factors promoting neurite growth and those suppressing it. Indeed, by the neurite elongation the proximal part expansion occurs and additional tubulin structures influx arise. At the same time, the tubulin synthesis increases since the intracellular machinery maintains its concentration at a fixed level in the cell soma. Thus, raising tubulin outflow to the neurite induced by geometrical changes and its consumption for elongation process is fully compensated by intracellular synthesis. As a result, the positive feedback promoting the neurite growth arises. On the other hand, the fraction of tubulin structures reaching growth cone decrease by the neurite elongation hence slows down the growth process. Moreover model implicitly accounts the consumption of the soluble tubulin released from degraded structures for the radial expansion (positive feedback formation).
Hence, depending on the parameters of the growth kinetics, several scenarios corresponding to dendrite or axon growth can be achieved. These types include the dendrite specific kinematics with slowing speed and axon growth specificity with constant elongation speed over long distances.
Conflict of interest statement
The author declares that the research was conducted in the absence of any commercial or financial relationships that could be construed as a potential conflict of interest.
Statements
Acknowledgments
This study was supported by the Russian Ministry of Education and Science, the Federal Program (unique identification number–RFMEFI58114X0011).
Conflict of interest
The author declares that the research was conducted in the absence of any commercial or financial relationships that could be construed as a potential conflict of interest.
References
1
Ananthanarayanan R. Esser S. K. Simon H. D. Modha D. S. (2009). The cat is out of the bag: cortical simulations with 10 9 Neurons, 10 13 Synapses. Matrix2, 1–12. 10.1145/1654059.1654124
2
Baas P. W. Buster D. W. (2004). Slow axonal transport and the genesis of neuronal morphology. J. Neurobiol.58, 3–17. 10.1002/neu.10281
3
Baas P. W. Deitch J. S. Black M. M. Banker G. A. (1988). Polarity orientation of microtubules in hippocampal neurons: uniformity in the axon and nonuniformity in the dendrite. Proc. Natl. Acad. Sci. U.S.A.85, 8335–8339. 10.1073/pnas.85.21.8335
4
Bartlett W. P. Banker G. A. (1984). An electron microscopic study of the development of axons and dendrites by hippocampal neurons in culture. I. Cells which develop without intercellular contacts. J. Neurosci.4, 1944–1953.
5
Brown A. (2000). Slow axonal transport: stop and go traffic in the axon. Nat. Rev. Mol. Cell Biol.1, 153–156. 10.1038/35040102
6
Bulinski J. C. (2007). Microtubule modification: acetylation speeds anterograde traffic flow. Curr. Biol.17, R18–R20. 10.1016/j.cub.2006.11.036
7
Cleveland D. W. Lopata M. A. Sherline P. Kirschner M. W. (1981). Unpolymerized tubulin modulates the level of tubulin mRNAs. Cell25, 537–546. 10.1016/0092-8674(81)90072-6
8
Desai A. Mitchison T. J. (1997). Microtubule polymerization dynamics. Annu. Rev. Cell Dev. Biol.13, 83–117. 10.1146/annurev.cellbio.13.1.83
9
Diehl S. Henningsson E. Heyden A. Perna S. (2014). A one-dimensional moving-boundary model for tubulin-driven axonal growth. J. Theor. Biol.358, 194–207. 10.1016/j.jtbi.2014.06.019
10
Dotti C. G. Sullivan C. A. Banker G. A. (1988). The establishment of polarity by hippocampal neurons in culture. J. Neurosci.8, 1454–1468.
11
Drechsel D. N. Hyman A. A. Cobb M. H. Kirschner M. W. (1992). Modulation of the dynamic instability of tubulin assembly by the microtubule-associated protein tau. Mol. Biol. Cell3, 1141–1154. 10.1091/mbc.3.10.1141
12
Fleischer J. G. Gally J. A. Edelman G. M. Krichmar J. L. (2007). Retrospective and prospective responses arising in a modeled hippocampus during maze navigation by a brain-based device. Proc. Natl. Acad. Sci. U.S.A.104, 3556–3561. 10.1073/pnas.0611571104
13
Galbraith J. A. Reese T. S. Schlief M. L. Gallant P. E. (1999). Slow transport of unpolymerized tubulin and polymerized neurofilament in the squid giant axon. Proc. Natl. Acad. Sci. U.S.A.96, 11589–11594. 10.1073/pnas.96.20.11589
14
Gard D. L. Kirschner M. W. (1987). Microtubule assembly in cytoplasmic extracts of Xenopus oocytes and eggs. J. Cell Biol.105, 2091–2201. 10.1083/jcb.105.5.2191
15
Gonzalez-Billault C. Avila J. Cáceres A. (2001). Evidence for the role of MAP1B in axon formation. Mol. Biol. Cell12, 2087–2098. 10.1091/mbc.12.7.2087
16
Graham B. P. Van Ooyen A. (2001). Compartmental models of growing neurites. Neurocomputing38–40, 31–36. 10.1016/S0925-2312(01)00463-5
17
Graham B. P. Van Ooyen A. (2004). Transport limited effects in a model of dendritic branching. J. Theor. Biol.230, 421–432. 10.1016/j.jtbi.2004.06.007
18
Gritsun T. A. le Feber J. Rutten W. L. C. (2012). Growth dynamics explain the development of spatiotemporal burst activity of young cultured neuronal networks in detail. PLoS ONE7:e43352. 10.1371/journal.pone.0043352
19
Heidemann S. R. Landers J. M. Hamborg M. A. (1981). Polarity orientation of axonal microtubules. J. Cell Biol.91, 661–665. 10.1083/jcb.91.3.661
20
Heidemann S. R. (1996). Cytoplasmic mechanisms of axonal and dendritic growth in neurons. Int. Rev. Cytol.165, 235–296. 10.1016/S0074-7696(08)62224-X
21
Hely T. A. Graham B. Ooyen A. V. (2001). A computational model of dendrite elongation and branching based on MAP2 phosphorylation. J. Theor. Biol.210, 375–384. 10.1006/jtbi.2001.2314
22
Hirokawa N. Takemura R. (2007). Intracellular transport and kinesin superfamily proteins: structure, function and dynamics. Lect. Notes Phys.711, 85–121. 10.1007/3-540-49522-3_5
23
Hjorth J. J. J. Van Pelt J. Mansvelder H. D. Van Ooyen A. (2014). Competitive dynamics during resource-driven neurite outgrowth. PLoS ONE9:e86741. 10.1371/journal.pone.0086741
24
Hoffman P. N. Lasek R. J. (1975). The slow component of axonal transport. Identification of major structural polypeptides of the axon and their generality among mammalian neurons. J. Cell Biol.66, 351–366. 10.1083/jcb.66.2.351
25
Izhikevich E. M. Edelman G. M. (2008). Large-scale model of mammalian thalamocortical systems. Proc. Natl. Acad. Sci. U.S.A.105, 3593–3598. 10.1073/pnas.0712231105
26
Karten B. Hayashi H. Francis G. A. Campenot R. B. Vance D. E. Vance J. E. (2005). Generation and function of astroglial lipoproteins from Niemann-Pick type C1-deficient mice. Biochem. J.387, 779–788. 10.1042/BJ20041694
27
Keenan T. M. Hooker A. Spilker M. E. Li N. Boggy G. J. Vicini P. et al . (2006). Automated identification of axonal growth cones in time-lapse image sequences. J. Neurosci. Methods151, 232–238. 10.1016/j.jneumeth.2005.07.010
28
Kiddie G. McLean D. Van Ooyen A. Graham B. (2004). Biologically plausible models of neurite outgrowth. Prog. Brain Res.147, 67–80. 10.1016/S0079-6123(04)47006-X
29
Kimura T. Arimura N. Fukata Y. Watanabe H. Iwamatsu A. Kaibuchi K. (2005). Tubulin and CRMP-2 complex is transported via Kinesin-1. J. Neurochem.93, 1371–1382. 10.1111/j.1471-4159.2005.03063.x
30
Koene R. A. Tijms B. Van Hees P. Postma F. de Ridder A. Ramakers G. J. A. et al . (2009). NETMORPH: a framework for the stochastic generation of large scale neuronal networks with realistic neuron morphologies. Neuroinformatics7, 195–210. 10.1007/s12021-009-9052-3
31
Kollins K. M. Bell R. L. Butts M. Withers G. S. (2009). Dendrites differ from axons in patterns of microtubule stability and polymerization during development. Neural Dev.4:26. 10.1186/1749-8104-4-26
32
Konishi Y. Setou M. (2009). Tubulin tyrosination navigates the kinesin-1 motor domain to axons. Nat. Neurosci.12, 559–567. 10.1038/nn.2314
33
Lasek R. J. Garner J. A. Brady S. T. (1984). Axonal transport of the cytoplasmic matrix. J. Cell Biol.99, 212s–221s. 10.1083/jcb.99.1.212s
34
Markram H. Meier K. Lippert T. Grillner S. Frackowiak R. Dehaene S. et al . (2011). Introducing the human brain project. Proced. Comput. Sci.7, 39–42. 10.1016/j.procs.2011.12.015
35
Markram H. (2006). The blue brain project. Nat. Rev. Neurosci.7, 153–160. 10.1038/nrn1848
36
McLean D. R. van Ooyen A. Graham B. P. (2004). Continuum model for tubulin-driven neurite elongation. Neurocomputing58–60, 511–516. 10.1016/j.neucom.2004.01.088
37
Miller K. E. Samuels D. C. (1997). The axon as a metabolic compartment: protein degradation, transport, and maximum length of an axon. J. Theor. Biol.186, 373–379. 10.1006/jtbi.1996.0355
38
Mironov V. I. Romanov A. S. Simonov A. Y. Vedunova M. V. Kazantsev V. B. (2014). Oscillations in a neurite growth model with extracellular feedback. Neurosci. Lett.570, 16–20. 10.1016/j.neulet.2014.03.041
39
Mitchison T. Kirschner M. (1984). Dynamic instability of microtubule growth. Nature312, 237–242. 10.1038/312237a0
40
Morrison E. E. Moncur P. M. Askham J. M. (2002). EB1 identifies sites of microtubule polymerisation during neurite development. Mol. Brain Res.98, 145–152. 10.1016/S0169-328X(01)00290-X
41
Reed N. A. Cai D. Blasius T. L. Jih G. T. Meyhofer E. Gaertig J. et al . (2006). Microtubule acetylation promotes Kinesin-1 binding and transport. Curr. Biol.16, 2166–2172. 10.1016/j.cub.2006.09.014
42
Rizzo D. J. White J. D. Spedden E. Wiens M. R. Kaplan D. L. Atherton T. J. et al . (2013). Neuronal growth as diffusion in an effective potential. Phys. Rev. E Stat. Nonlin. Soft Matter Phys.88:042707. 10.1103/PhysRevE.88.042707
43
Rochlin M. W. Wickline K. M. Bridgman P. C. (1996). Microtubule stability decreases axon elongation but not axoplasm production. J. Neurosci.16, 3236–3246.
44
Samuels D. C. Hentschel H. G. Fine A. (1996). The origin of neuronal polarization: a model of axon formation. Philos. Trans. R. Soc. Lond. B Biol. Sci.351, 1147–1156. 10.1098/rstb.1996.0099
45
Sharp D. J. Yu W. Ferhat L. Kuriyama R. Rueger D. C. Baas P. W. (1997). Identification of a microtubule-associated motor protein essential for dendritic differentiation. J. Cell Biol.138, 833–843. 10.1083/jcb.138.4.833
46
Shea T. B. (1999). Selective stabilization of microtubules within the proximal region of developing axonal neurites. Brain Res. Bull.48, 255–261. 10.1016/S0361-9230(98)00019-7
47
Sjöstrand J. Karlsson J.-O. (1969). Axoplasmic Transport in the optic nerve and tract of the rabbit. J. Neurochem.16, 833–844. 10.1111/j.1471-4159.1969.tb08971.x
48
Takei Y. Teng J. Harada A. Hirokawa N. (2000). Defects axonal elongation and neuronal migration in mice with disrupted tau and map1b genes. J. Cell Biol.150, 989–1000. 10.1083/jcb.150.5.989
49
Teichmann H. M. Shen K. (2011). UNC-6 and UNC-40 promote dendritic growth through PAR-4 in Caenorhabditis elegans neurons. Nat. Neurosci.14, 165–172. 10.1038/nn.2717
50
Theodorakis N. G. Cleveland D. W. (1992). Physical evidence for cotranslational regulation of beta-tubulin mRNA degradation. Mol. Cell. Biol.12, 791–799. 10.1128/MCB.12.2.791
51
Toriyama M. Sakumura Y. Shimada T. Ishii S. Inagaki N. (2010). A diffusion-based neurite length-sensing mechanism involved in neuronal symmetry breaking. Mol. Syst. Biol.6, 394. 10.1038/msb.2010.51
52
Vale R. D. (2003). The molecular motor toolbox for intracellular transport. Cell112, 467–480. 10.1016/S0092-8674(03)00111-9
53
Van Ooyen A. Graham P. Ramakers G. J. A. (2001). Competition for tubulin between growing neurites during development. Neurocomputing38–40, 73–78. 10.1016/S0925-2312(01)00487-8
54
Walker R. A. O'Brien E. T. Pryer N. K. Soboeiro M. F. Voter W. A. Erickson H. P. et al . (1988). Dynamic instability of individual microtubules analyzed by video light microscopy: rate constants and transition frequencies. J. Cell Biol.107, 1437–1448.
55
Wang L. Brown A. (2002). Rapid movement of microtubules in axons. Curr. Biol.12, 1496–1501. 10.1016/S0960-9822(02)01078-3
56
Witte H. Neukirchen D. Bradke F. (2008). Microtubule stabilization specifies initial neuronal polarization. J. Cell Biol.180, 619–632. 10.1083/jcb.200707042
57
Yu W. Cook C. Sauter C. Kuriyama R. Kaplan P. L. Baas P. W. (2000). Depletion of a microtubule-associated motor protein induces the loss of dendritic identity. J. Neurosci.20, 5782–5791.
58
Zubler F. Douglas R. (2009). A framework for modeling the growth and development of neurons and networks. Front. Comput. Neurosci.3:25. 10.3389/neuro.10.025.2009
59
Zubler F. Hauri A. Pfister S. Bauer R. Anderson J. C. Whatley A. M. et al . (2013). Simulating cortical development as a self constructing process: a novel multi-scale approach combining molecular and physical aspects. PLoS Comput. Biol.9:e1003173. 10.1371/journal.pcbi.1003173
Summary
Keywords
shape specific elongation, neurite outgrowth, tubulin, active transport, microtubule cytoskeleton
Citation
Mironov VI, Semyanov AV and Kazantsev VB (2016) Dendrite and Axon Specific Geometrical Transformation in Neurite Development. Front. Comput. Neurosci. 9:156. doi: 10.3389/fncom.2015.00156
Received
10 November 2015
Accepted
24 December 2015
Published
28 January 2016
Volume
9 - 2015
Edited by
Bartlett W. Mel, University of Southern California, USA
Reviewed by
Bruce Graham, University of Stirling, UK; Arjen Van Ooyen, VU University Amsterdam, Netherlands
Updates
Copyright
© 2016 Mironov, Semyanov and Kazantsev.
This is an open-access article distributed under the terms of the Creative Commons Attribution License (CC BY). The use, distribution or reproduction in other forums is permitted, provided the original author(s) or licensor are credited and that the original publication in this journal is cited, in accordance with accepted academic practice. No use, distribution or reproduction is permitted which does not comply with these terms.
*Correspondence: Vasily I. Mironov mironov@neuro.nnov.ru
Disclaimer
All claims expressed in this article are solely those of the authors and do not necessarily represent those of their affiliated organizations, or those of the publisher, the editors and the reviewers. Any product that may be evaluated in this article or claim that may be made by its manufacturer is not guaranteed or endorsed by the publisher.