 Ziyi Huang
 Lei Wang
- Scholastic Excellence Research Center, Wuxi Dipont School of Arts and Science, Wuxi, China
Memory impairment is a prevalent symptom in patients with Alzheimer's disease (AD), with working memory loss being the most prominent deficit. Recent experimental evidence suggests that abnormal calcium levels in the Endoplasmic Reticulum (ER) may disrupt synaptic transmission, leading to memory loss in AD patients. However, the specific mechanisms by which intracellular calcium homeostasis influences memory formation, storage, and recall in the context of AD remain unclear. In this study, we investigate the effects of intracellular calcium homeostasis on AD-related working memory (WM) using a spiking network model. We quantify memory storage by measuring the similarity between images during the training and testing phases. The model results indicate that ~90% of memory can be stored in the WM network under normal conditions. In contrast, the presence of amyloid beta (Aβ), associated with AD, significantly reduces this similarity, allowing only 54%-58% of memory to be stored, this alteration trend is consistent with previous experimental findings. Further analysis reveals that downregulating the activation of inositol triphosphate (IP3) receptors and upregulating the activation of the sarco-endoplasmic reticulum Ca2+ ATPase (SERCA) pumps can enhance memory performance, achieving about 78% and 77%, respectively. Moreover, simultaneously manipulating both IP3 and SERCA activations can increase memory capacity to around 81%. These findings suggest several potential therapeutic targets for addressing memory impairment in Aβ aggregation induced AD patients. Additionally, our network model could serve as a foundation for exploring further mechanisms that modulate memory dysfunction at the genetic, cellular, and network levels.
1 Introductions
Alzheimer's disease (AD) is the most prevalent neurodegenerative disorder and the leading cause of dementia worldwide. It is affecting more than 40 million people globally, as this number is constantly increasing (Kim et al., 2024). AD is commonly associated with the accumulation of amyloid-beta (Aβ) plaques and tau tangles. Cognitive symptoms such as working memory (WM) loss are often detected before these pathological hallmarks (Breijyeh and Karaman, 2020). The early dysfunction of working memory (i.e., the ability to temporarily store and process information) shows that defects in neuronal pathways may result in the initial cognitive deficits before the major neurodegenerations occur.
Recent advances in neuroscience research demonstrate that astrocyte, the previously considered supporting cell (Kimelberg and Nedergaard, 2010; Farhy-Tselnicker and Allen, 2018), plays an important role in WM via synapse modulations (Gordleeva et al., 2021). Astrocytes respond to neuronal activities by producing intracellular inositol triphosphate (IP3), causing calcium (Ca2+) release from internal stores. The Ca2+ elevation triggers the increase of gliotransmitters release, which enhances the synaptic connections, forming the basis of short-term memory formation. This feedback loop has been tested to successfully model the encoding and retrieval of WM under a biologically plausible network (Gordleeva et al., 2021).
However, this intricate mechanism became vulnerable in the situation of AD. Aβ oligomers is studied to interfere with intracellular Ca2+ homeostasis by enhancing membrane leak, over-activating IP3 receptors and suppressing the activity of sarco-endoplasmic reticulum Ca2+ ATPase (SERCA) pumps, leading to persistent intracellular Ca2+ elevation and signaling irregularities (Latulippe et al., 2018). This abnormality leads to the unstable intracellular environment while also impairs the astrocytic capacity on modulating working memory, which might be the reason of WM damage.
Most research on the causes and treatments of AD has been conducted through experimental methods, which are often rigorous and time-consuming. Given this challenge, computational approaches have emerged as a viable alternative (Moravveji et al., 2024). In recent decades, numerous network models have been developed to explore potential mechanisms related to the causes and treatments of AD, addressing areas such as disease progression (Chamberland et al., 2024; Bertsch et al., 2017), pathogenesis (Puri and Li, 2010), the effects of specific proteins (Helal et al., 2019, 2014), and mitochondrial dysfunction (Toglia et al., 2018). Many of these studies have utilized non-spiking neuron models; however, spiking signals are intrinsic to neurons and can be reliably transmitted over long distances in brain regions affected by AD. Therefore, this study employs spiking neuron models as the primary functional units in constructing the network.
In this study, we construct a computational network model to examine how intracellular calcium homeostasis affects the formation, impairment, and restoration of WM under Aβ-induced AD conditions. The network comprises two cell types: spiking excitatory neurons and non-spiking astrocytes. The neurons are primarily responsible for generating population spiking activity, while the astrocytes are mainly involved in producing various calcium signals. Model results indicate that the presence of Aβ impairs WM performance by significantly increasing Ca2+ concentrations. Conversely, downregulating IP3 activation and upregulating SERCA activation, either separately or simultaneously, can help restore WM performance to some extent.
2 Model descriptions
In this study, we introduce a biologically plausible spiking neuron-astrocyte network that simulates WM through local synaptic modulations. Neurons generate spikes in response to external stimuli, releasing glutamates into the extracellular space. Surrounding astrocytes detect these glutamates, activating internal IP3 and Ca2+ signaling cascades. When astrocytic Ca2+ exceeds a critical threshold, gliotransmitters are released, transiently enhancing synaptic weights in the stimulated neuronal subnetwork. This temporary potentiation supports cue-based memory retrieval during test phases. In the following subsections, we detail the model components responsible for simulating this loop, including the neuron dynamics, astrocyte calcium signaling, Aβ modulation, and memory performance metrics.
Architecture and cell units of our network model are inspired and adapted from Gordleeva et al. (2021). Based on the spiking network, we employed three additional elements: Aβ-dependent calcium flows, calcium-dependent variations of synaptic weight combined with Aβ modulations, and negative components in describing the activation of IP3. The first two elements are used to introduce the influence of Aβ. The larger the Aβ value, the more severe the AD and the worse the WM performance. The last element is used to balance the variation of IP3.
2.1 Neuron model
Spiking dynamics of single neuron is described using the Izhikevich model (Izhikevich, 2003). Due to its simplicity and computational efficient, this neuron model has been widely used to study population activities of neurons, e.g., synchronization and oscillation (Khoshkhou and Montakhab, 2018).
Mathematical expressions of the Izhikevich model are:
with the auxiliary after-spike resetting:
Here, V represents the transmembrane potential, while U denotes a membrane recovery variable that provides negative feedback to V. The indices (i, j) indicate the corresponding neuron. c is the resting potential, and a, b, d are dimensionless parameters. Iapp refers to the applied currents to the respective neurons, which will be explained further below.
Synaptic currents that neurons receive is expressed as Gordleeva et al. (2021):
Here, N is the total number of presynaptic neurons, Esyn is the reversal potential for the synapse, Vpre denotes the membrane potential of the presynaptic neuron, and ksyn is slope of the synaptic activation function. The parameter gsyn describes the synaptic strength (Gordleeva et al., 2021):
Here (m, n) denotes the index of the corresponding astrocyte that modulates the synaptic currents of neuron (i, j). η represents the synaptic weight without astrocyte influence, while vca denotes the astrocyte-induced modulation of synaptic strength.
Specific values of these parameters are given in Table 1.
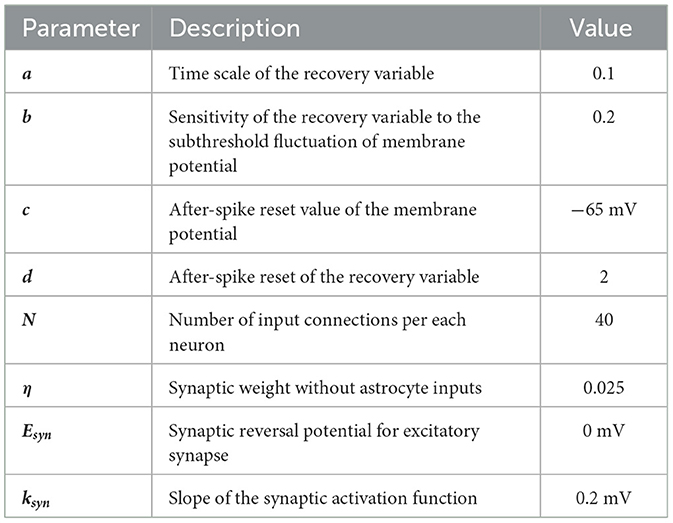
Table 1. Parameter values in the neuron model.
2.2 Astrocyte model
As mentioned above, astrocytes in our network primarily generate various calcium signals. Following the method used in the previous study (Gordleeva et al., 2021), a mean-field approach is employed to describe the emergence of Ca2+ signals, as shown in Equation 5 and Figure 1.
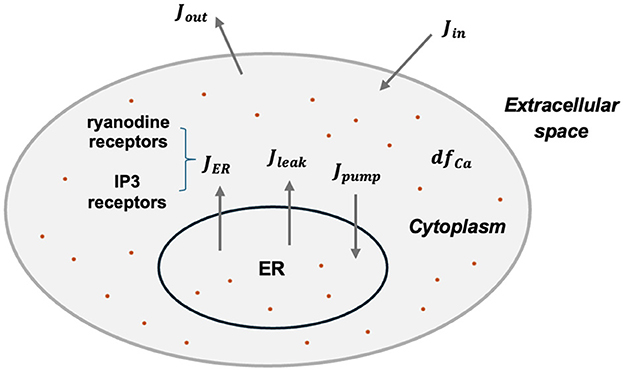
Figure 1. Schematic diagram of intracellular calcium exchanges.
Here Ca2+ indicate the intracellular calcium concentration, h is the fraction of the activated IP3 receptors on the ER surface. Detailed expressions of each flux are:
Here JER represents the Ca2+ flux from the ER to the cytoplasm through IP3 receptors and ryanodine receptors (RyR). Jpump denotes the Ca2+ flux pumped back into the ER via the SERCA, while Jleak indicates the leakage flux from the ER to the cytoplasm. Jin and Jout describe the calcium exchange with extracellular space.
Activation dynamics of IP3 is expressed as Gordleeva et al. (2021) and Wagner et al. (2004):
Here denotes the steady-state concentration of the IP3 receptors, while τIP3 is the rate constant for IP3 loss. λ is a control parameter used to regulate various elements in IP3 dynamics. JPLCδ describes the production of IP3 by phospholipase Cδ (PLCδ), expressed as Gordleeva et al. (2021):
Jglu describes the production of IP3 induced by glutamate in response to neuronal activities, which is modeled as Gordleeva et al. (2021):
Here Aglu represents the amplitude of glutamate contributing to the production of IP3, while tglu denotes the periods when the total level of glutamate from all synapses reaches a given threshold:
Here Na represents the number of neurons connected to a single astrocyte, Gthr = 0.7 is the threshold, and [x] denotes the Iverson bracket. Fact = 0.5 indicates the fraction of synchronously spiking neurons within the total neuronal ensemble associated with the astrocyte. G refers to the amount of glutamate, which will be explained further below.
JKinase and JPhosphatase are currents for IP3 degradation, which are expressed as Wagner et al. (2004):
The currents dfCa in Equation 5 and dfIP3 in Equation 7 represent the diffusion of Ca2+ ions and IP3 molecules via gap junctions between astrocytes, expressed as follows (Gordleeva et al., 2021):
Here dCa and dIP3 represent the diffusion rate of the Ca2+ and IP3, respectively. Following a previous study (Gordleeva et al., 2021), we assume that each astrocyte is diffusively coupled only with its four nearest neighbors:
Specific values of these parameters are given in Table 2.
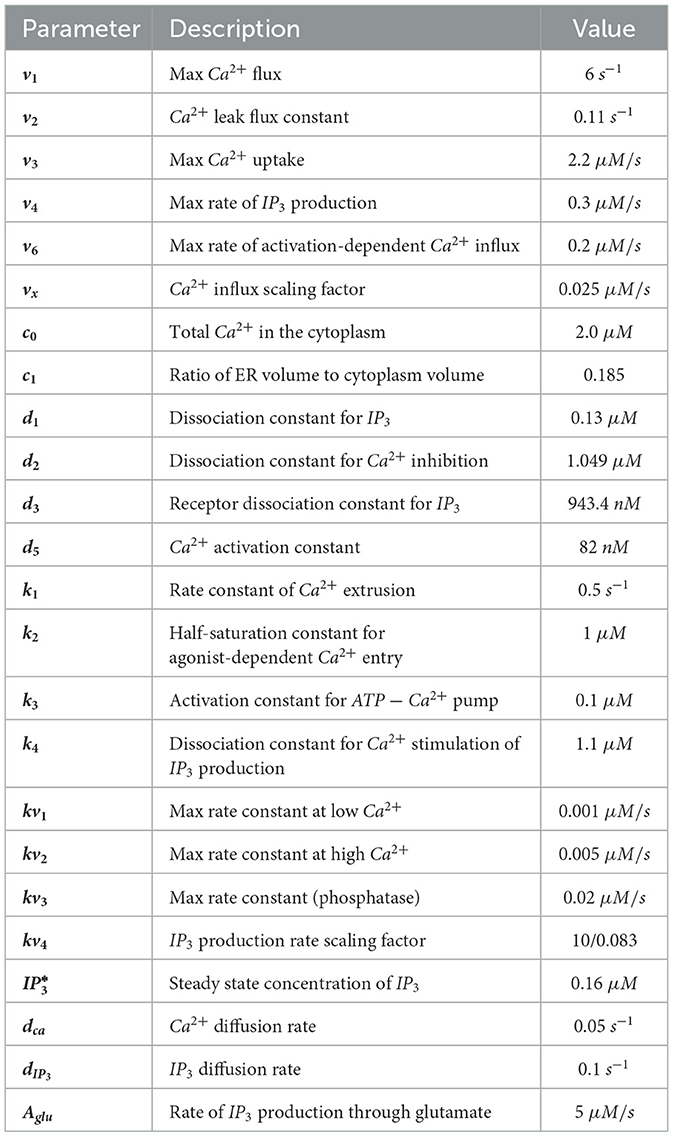
Table 2. Parameter values in astrocyte model.
2.3 Neuron-astrocyte network
As described in Gordleeva et al. (2021), the network model for WM comprises three layers: the input layer, the neurons layer, and the astrocytes layer. The input layer consists of two types of stimuli: (1) image signals labeled {“0″, “1″, “2″, “3″, “4″, “5″, “6″, “7″, “8″, “9″} (Figure 2), which are responsible for memory training and testing, and (2) background noise signals, that generate low-rate spontaneous spikes.
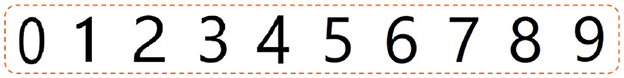
Figure 2. Image stimulus patterns.
The neurons layer contains 79 × 79 neurons, which receive stimuli from the input layer and project to the astrocytes layer. The third layer consists of 26 × 26 astrocytes, with each astrocyte projecting back to neurons in the second layer.
The architecture of synaptic connections among neurons is random; specifically, each neuron connects to N = 40 local postsynaptic target neurons via excitatory chemical synapses, with these neurons chosen randomly from the neurons layer. In contrast, the synaptic connections among astrocytes are deterministic, with each astrocyte connecting to its four nearest neighbors via gap junctions (Gordleeva et al., 2021).
Additionally, each astrocyte connects with Na = 16 (i.e., 4 × 4) neurons through reciprocal excitatory chemical synapses. Thus, the synaptic strength in Equation 4 has a Ca2+ dependent component vCa, which can be expressed as:
Here denotes the strength of astrocyte-induced modulation of synaptic weight, Θ(x) is the Heaviside step-function, and is the threshold.
In Equation 10, the amount of glutamate G is characterized as Gordleeva et al. (2021):
Here αglu represents the glutamate clearance constant, while kglu indicates the efficacy of the release. Similar to Equation 17, Θ(x) is the Heaviside step-function.
Specific values of relevant parameters are given in Table 3.
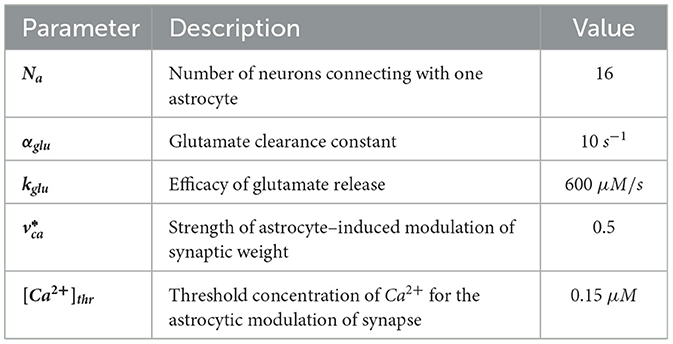
Table 3. Parameter values in neuron-astrocyte network.
2.4 Stimulation protocol
Our stimulation protocol follows the delayed match-to-sample task (DMS), which is commonly used in experimental studies of memory formation and recall. During the training phase, an image labeled with a specific digit is presented for 200 ms (500 ms-700 ms), followed by a 700 ms break (700 ms-1,400 ms). After this, two non-match images are displayed, each for 150 ms (1,400 ms-1,550 ms and 1,800 ms-1,950 ms), with a 250 ms break in between (1,550 ms-1,800 ms and 1,950 ms-2,200 ms). Finally, the matching stimulus appears for 150 ms (2,200 ms-2,350 ms) to test the network's memory recall capability. The total duration of the simulation experiment is 3,000 ms. Detailed stimulus information during training and testing phases can refer to Gordleeva et al. (2021). A demonstration of a sample stimulus current and the corresponding neuronal activities during the training and test phases is presented in Supplementary Figure 17.
2.5 Memory performance matrices
To quantify the amount of memory that can be stored, we use a measure calculated based on the similarity between a recalled image and the sample image. The similarity ranges from 0 to 1, with larger values indicating better WM performance.
Here w = 1 ms represents the time step, thr denotes the spiking threshold of the neuron, P is the set of pixels belonging to the sample image, and W and H are the network dimensions. I is the indicator function, and TP is the set of frames within the tracking range of pattern P. For more details (see Gordleeva et al., 2021).
2.6 Introduction of Aβ to calcium flows
The effect of Aβ on calcium dynamics is reflected in its influence on the currents Jin and JER. Following a previous study (Latulippe et al., 2018), Jin and JER with the addition of Aβ are expressed as:
Here Aβ represents a fixed level of Aβ concentration.
2.7 Calcium-dependent change of synaptic weights with Aβ modulations
Previous experimental results indicate that high concentrations of Ca2+ can promote the release probability of neurotransmitters, thereby strengthening synaptic connections between neurons (Neher and Sakaba, 2008). However, excessive levels of Ca2+ can disrupt synaptic connections by inducing irreversible excitotoxic injury (Vermma et al., 2022). In our model, Equation 21 is employed to prevent exaggerated Ca2+ concentrations.
Another experiment demonstrated that the accumulation of Aβ negatively affects Ca2+ levels (Toglia et al., 2018). Therefore, Equation 22 is introduced to simulate this variation.
Here Aβ represents a fixed level of Aβ concentration. Based on the value of wb, we have .
All simulations were performed using the Matlab software (Matlab R2021a), and the fourth-order Runge-Kutta algorithm was employed to calculate the values of different variables with a time integration step of 0.1 ms.
3 Model results
In this section, we present the functional outcomes of the neuron-astrocyte network model under both normal and AD-like conditions. We begin by illustrating how the intact system encodes, maintains, and successfully retrieves a single stimulus, highlighting the role of astrocyte-mediated synaptic modulation in WM. Next, we analyze memory performance metrics across varying levels of Aβ pathology and under parameter modulations targeting IP3 production and SERCA activity. These results provide valuable insights into the effects of calcium dysregulation on WM and emphasize potential strategies for restoring cognitive function in Aβ-induced AD.
3.1 WM network performance under normal conditions
In the absence of Aβ (indicating no AD symptoms), the WM network performs effectively. Results shown in Figure 3 illustrate that the training stimulus “1” can be successfully recalled during the testing period after two non-match stimuli (“0” and “7”). Quantitative results in terms of similarity and peak frequency indicate that the similarity of neuronal responses to the sample stimulus and the match stimulus reaches ~0.9195. Additionally, the peak frequency of neurons responding to the match stimulus is comparable to that of neurons responding to the sample stimulus.
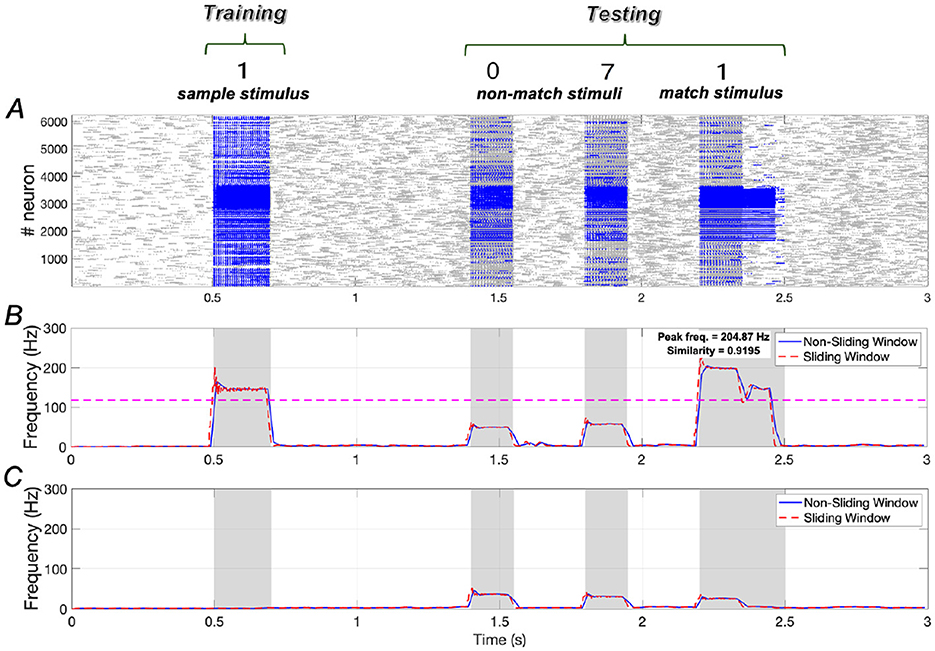
Figure 3. Neuronal responses in WM network under normal conditions. (A) Raster plots of spikes for all the neurons during different phases; (B, C) Average frequencies of stimulus-specific and unspecific neurons using different time windows, respectively (bin = 20 ms).
The dotted pink line in Figure 3B is determined by evaluating each stimulus from the set {“0″, “2″, “3″, “4″, “5″, “6″, “7″, “8″, “9″} as the match stimulus and calculating the maximum peak frequency among these stimuli (see Supplementary Figure 18). If the peak frequency of neurons under the match stimulus “1” exceeds this line, we consider neuronal activity under “1” to be distinguishable from the activities elicited by the other stimuli.
Results presented in Figures 4A, B illustrate the spiking sequence of a stimulus-specific neuron along with the amount of glutamate (G) it releases, demonstrating comparable spiking activities for both the sample and match stimuli. Figures 4C, D display the Ca2+ signal and IP3 levels in an astrocyte that is that is synaptically connected to the stimulus-specific neuron. It is evident that once the glutamate release from the neuron reaches a certain threshold (“0.7”, as indicated in Equation 10), the IP3 level rises rapidly. This continuous increase in IP3 concentration gradually elevates the Ca2+ levels, ultimately enhancing neuronal responses. These findings highlight the critical role of Ca2+-mediated modulation in sustaining working memory, aligning with previous research (Mongillo et al., 2008).
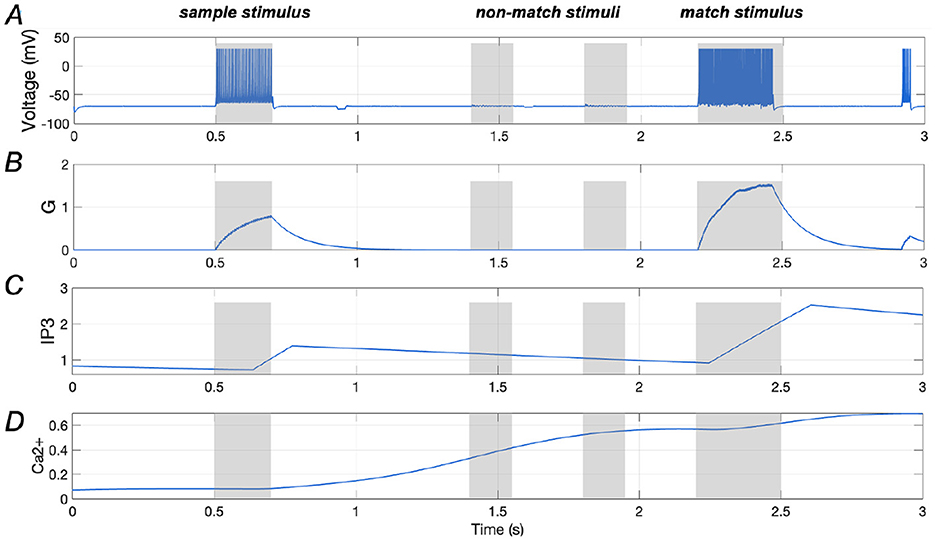
Figure 4. Responses of a stimulus-specific neuron and corresponding astrocyte. (A, B) Spike train of a specific neuron and the amount of glutamate (G) it releases, respectively; (C, D) Ca2+ signals and IP3 value of an astrocyte which has synaptic connection with the specific neuron.
3.2 WM network performance in the presence of Aβ
Accumulation of Aβ has been linked to memory loss in AD in numerous studies (Hampel et al., 2021; Ma and Klann, 2012; Poling et al., 2008). In our research, we simulate Aβ accumulation by varying the Aβ parameter and observe changes in memory performance. Figure 5 illustrates how similarity and peak frequency vary with respect to Aβ levels, showing that increased Aβ significantly impairs WM performance. Specifically, the peak frequency decreases from over 200 Hz (Aβ = 0) to 93.87 Hz (Aβ = 1.6), while similarity drops from 0.9195 (Aβ = 0) to 0.541 (Aβ = 1.6), indicating a substantial loss of memory recall fidelity.
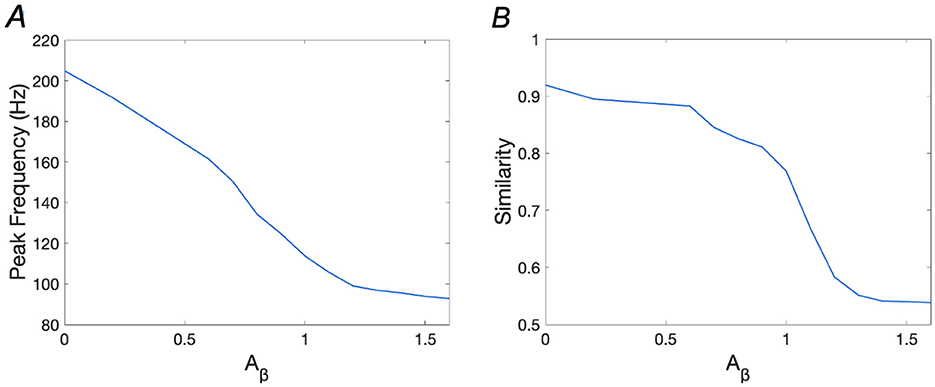
Figure 5. Peak frequencies and similarities with the increase of Aβ. (A) Peak Frequency vs. Aβ; (B) Similarity vs. Aβ.
In the following sections, we will separately analyze how memory performance is disrupted and the potential for restoration at Aβ = 1.2 (mild AD) and Aβ = 1.6 (severe AD).
3.2.1 Working memory impairment under mild Aβ accumulation
Results shown in Figure 6 indicate that the addition of a small amount of Aβ significantly impairs WM performance. Specifically, similarity decreases from 0.9195 to 0.5832, representing a reduction of ~36.6%, while peak frequency drops from 204.87 Hz to 98.98 Hz, reflecting a 51.7% reduction.
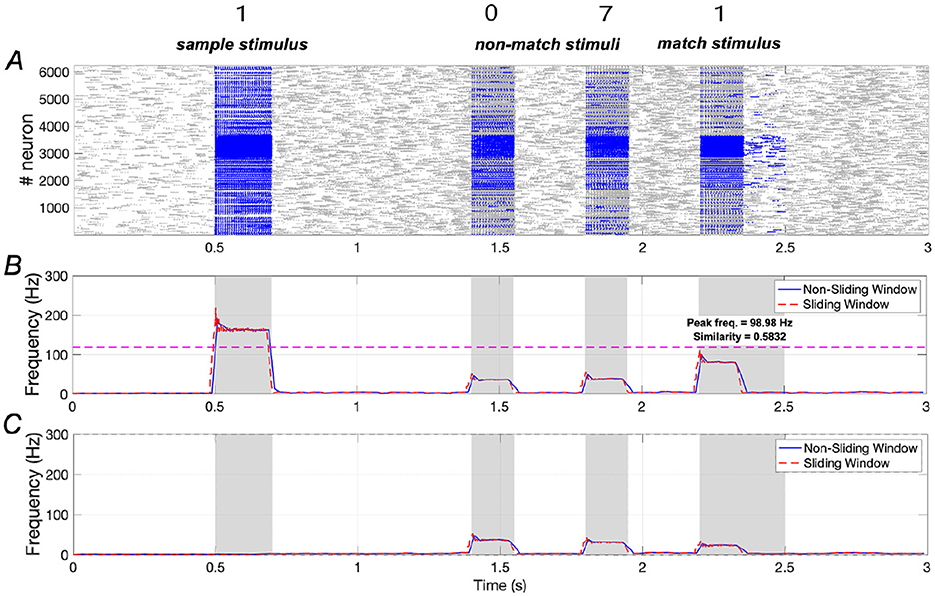
Figure 6. Neuronal responses in WM network in the presence of Aβ (Aβ = 1.2). (A) Raster plots of spikes for all the neurons during different phases; (B, C) Average frequencies of stimulus-specific and unspecific neurons using different time windows, respectively (bin = 20 ms).
Figures 7A, B illustrate the spiking response of a stimulus-specific neuron, and the amount of glutamate released, further highlighting the negative modulatory effect of Aβ. Additionally, the Ca2+ signal and IP3 levels in an astrocyte that is connected to the neuron are demonstrated in Figures 7C, D, in which the amplitude of Ca2+ signal shows an increasing trend, rising from about 0.7 (as seen in Figure 4D) to ~1.4 (as shown in Figure 7D). This finding aligns with previous studies indicating that Aβ accumulation disrupts calcium homeostasis, leading to increased Ca2+ concentrations in the intracellular space (Fani et al., 2021; Toglia et al., 2018).
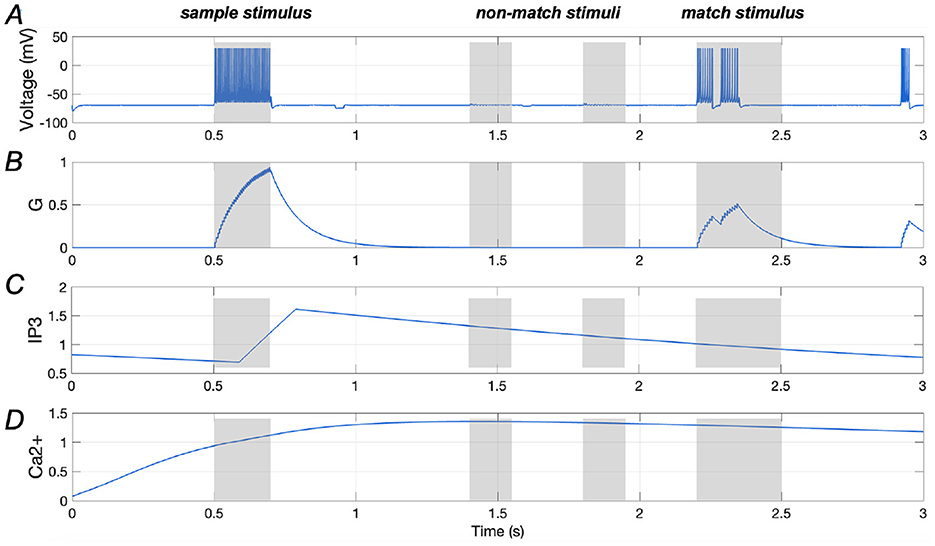
Figure 7. Responses of a stimulus-specific neuron and corresponding astrocyte in the presence of Aβ (Aβ = 1.2). (A, B) Spike train of a specific neuron and the amount of glutamate (G) it releases, respectively; (C, D) Ca2+ signals and IP3 values of an astrocyte which has synaptic connection with the specific neuron.
3.2.2 Working memory impairment under severe Aβ accumulation
Results presented in Figure 8 indicate that the addition of a large amount of Aβ to the network severely impairs WM performance. Specifically, similarity decreases from 0.9195 to 0.5380, representing a reduction of ~41.5%, while peak frequency declines from 204.87 Hz to 92.80 Hz, reflecting a 54.7% reduction. These decreases are more pronounced than those observed at Aβ = 1.2.
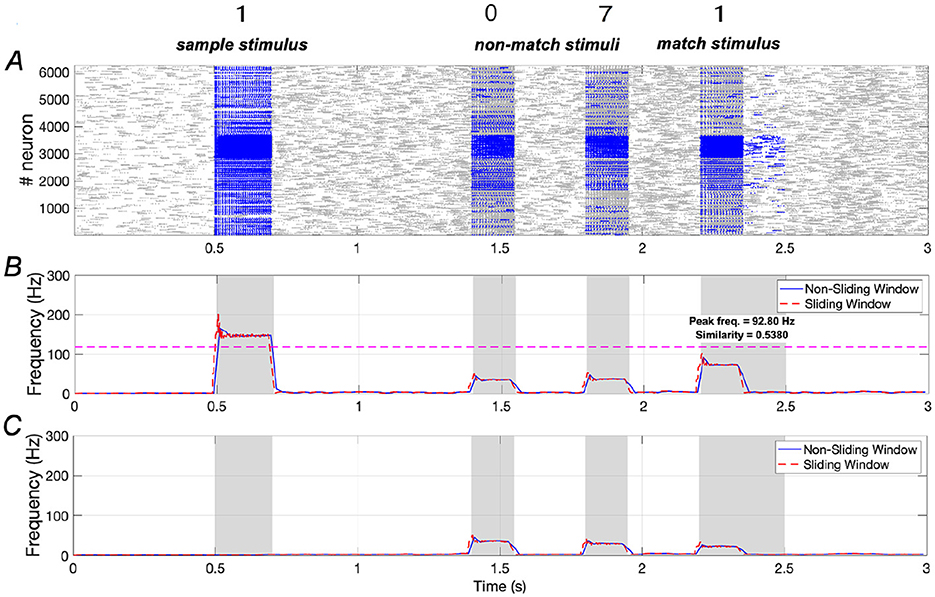
Figure 8. Neuronal responses in WM network in the presence of Aβ (Aβ = 1.6). (A) Raster plots of spikes for all the neurons during different phases; (B, C) Average frequencies of stimulus-specific and unspecific neurons using different time windows, respectively (bin = 20 ms).
Figures 9A, B illustrate the spiking response of a stimulus-specific neuron along with the amount of glutamate released, further emphasizing the negative modulatory effect of Aβ. Additionally, the Ca2+ signal and IP3 levels in an astrocyte that is connected to the neuron are demonstrated in Figures 9C, D, in which the amplitude of Ca2+ signal shows significant growth, reaching ~5 (as shown in Figure 9D).
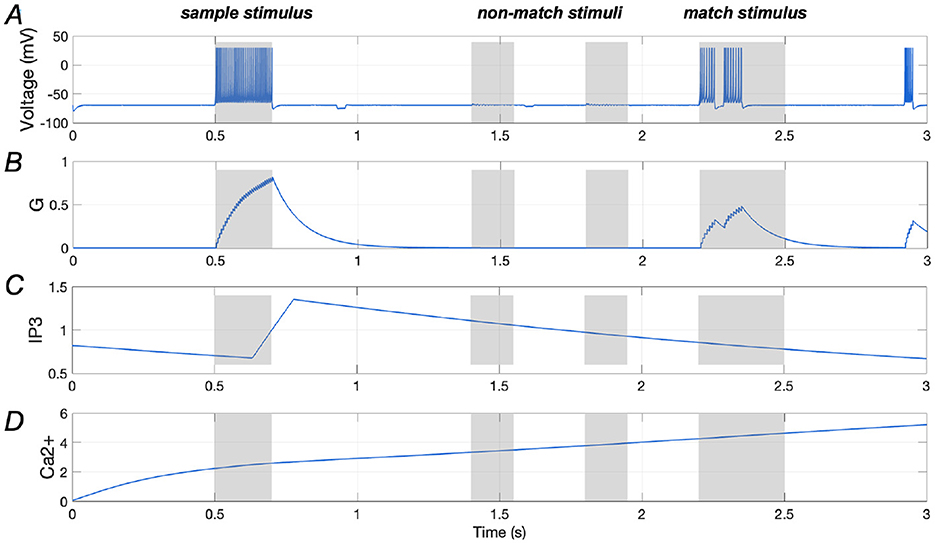
Figure 9. Responses of a stimulus-specific neuron and corresponding astrocyte in the presence of Aβ (Aβ = 1.6). (A, B) Spike train of a specific neuron and the amount of glutamate (G) it releases, respectively; (C, D) Ca2+ signals and IP3 values of an astrocyte which has synaptic connection with the specific neuron.
3.3 Restoring WM network performance by downregulating IP3 activation
The results in Section 3.2 indicate that excessive levels of Ca2+ induced by Aβ play a crucial role in disrupting the memory performance of WM network. In this section, we investigate whether downregulation of IP3 can partially restore WM under pathological conditions by reducing intracellular calcium levels, as IP3 positively influences intracellular calcium concentration (see Equations 5, 6).
In Figure 10, we analyze two cases under the condition of Aβ = 1.2 (mild AD): (1) When λ = 0.1 (see Equation 7), similarity increases from 0.5832 to 0.7752, a rise of ~32.9%, and peak frequency increases from 98.98 Hz to 115.36 Hz, reflecting a 16.5% increase; (2) When λ = 0.05, similarity rises from 0.5832 to 0.7808, representing a 33.9% increase, while peak frequency increases from 98.98 Hz to 117.74 Hz, showing a 19.0% increase. These findings suggest that downregulation of IP3 activation can significantly enhance WM performance under mild AD conditions.
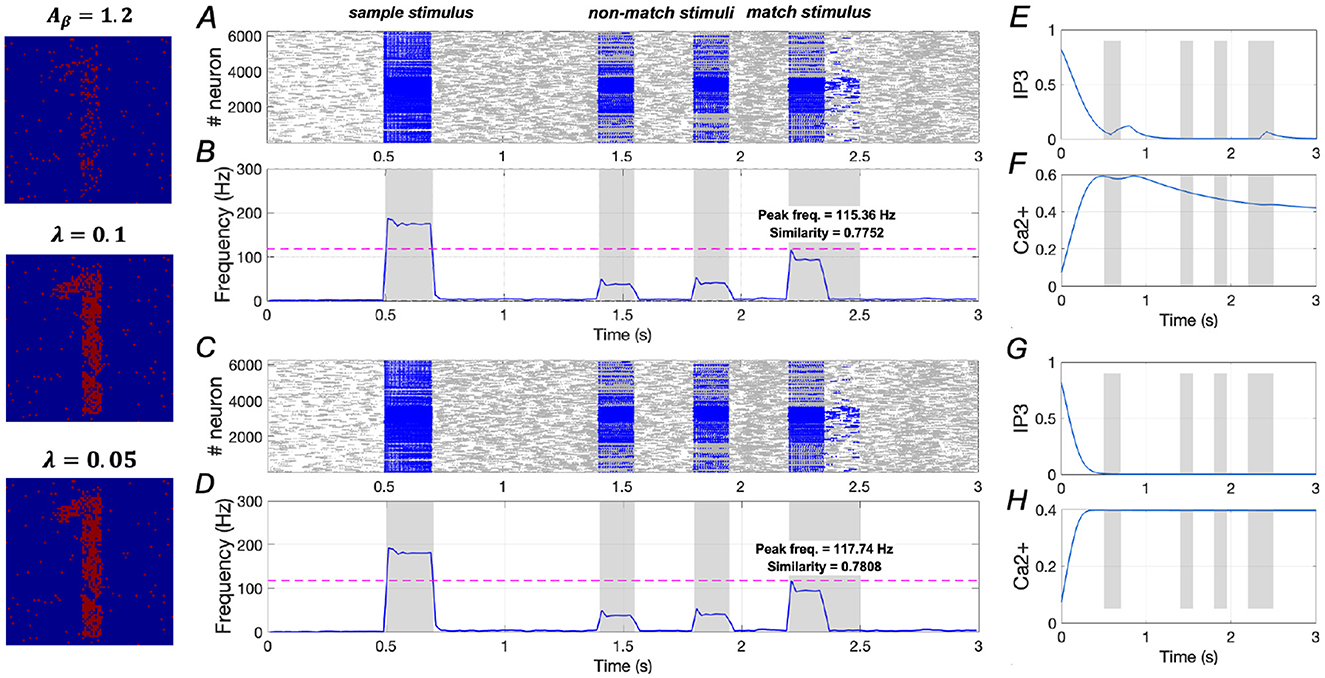
Figure 10. Modulation of memory performance by downregulating IP3 when Aβ = 1.2. (A, B) and (E, F) Raster plot, average frequency of neurons, Ca2+ and IP3 of a specific astrocyte (λ = 0.1); (C, D) and (G, H) Raster plot, average frequency of neurons, Ca2+ and IP3 of a specific astrocyte (λ = 0.05).
However, in Figure 11, under the condition of Aβ = 1.6 (severe AD), both λ = 0.1 and λ = 0.05 show minimal effects on similarity and peak frequency. This indicates that downregulating IP3 activation does not improve WM performance in severe AD, underscoring the necessity for a dual-target modulation strategy to achieve full recovery in severe AD patients.
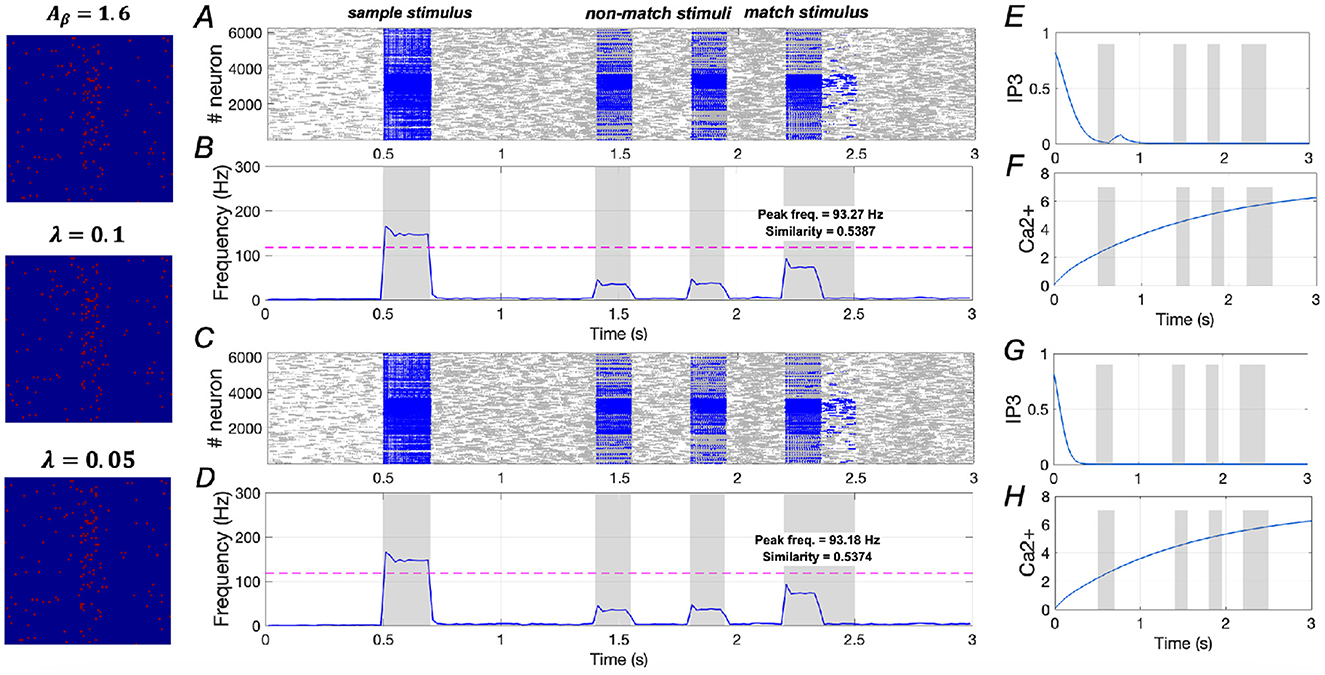
Figure 11. Modulation of memory performance by downregulating IP3 when Aβ = 1.6. (A, B) and (E, F) Raster plot, average frequency of neurons, Ca2+ and IP3 of a specific astrocyte (λ = 0.1); (C, D) and (G, H) Raster plot, average frequency of neurons, Ca2+ and IP3 of a specific astrocyte (λ = 0.05).
3.4 Restoring WM network performance by downregulating IP3 activation and upregulating SERCA activation
The effects of upregulating SERCA activation on WM performance are illustrated in Figure 12. In mild AD conditions, when γ = 1.25, similarity increases from 0.5832 to 0.6132, reflecting a ~5.1% increase, and peak frequency rises from 98.98 Hz to 101.58 Hz, a ~2.6% increase. However, when γ = 2.0, similarity increases from 0.5832 to 0.7710, representing a ~32.2% increase, while peak frequency rises from 98.98 Hz to 114.06 Hz, a ~ 15.2% increase (see Supplementary Figure 19). The corresponding variations in the Ca2+ signal for γ = 1.25 is shown in Figure 12B.
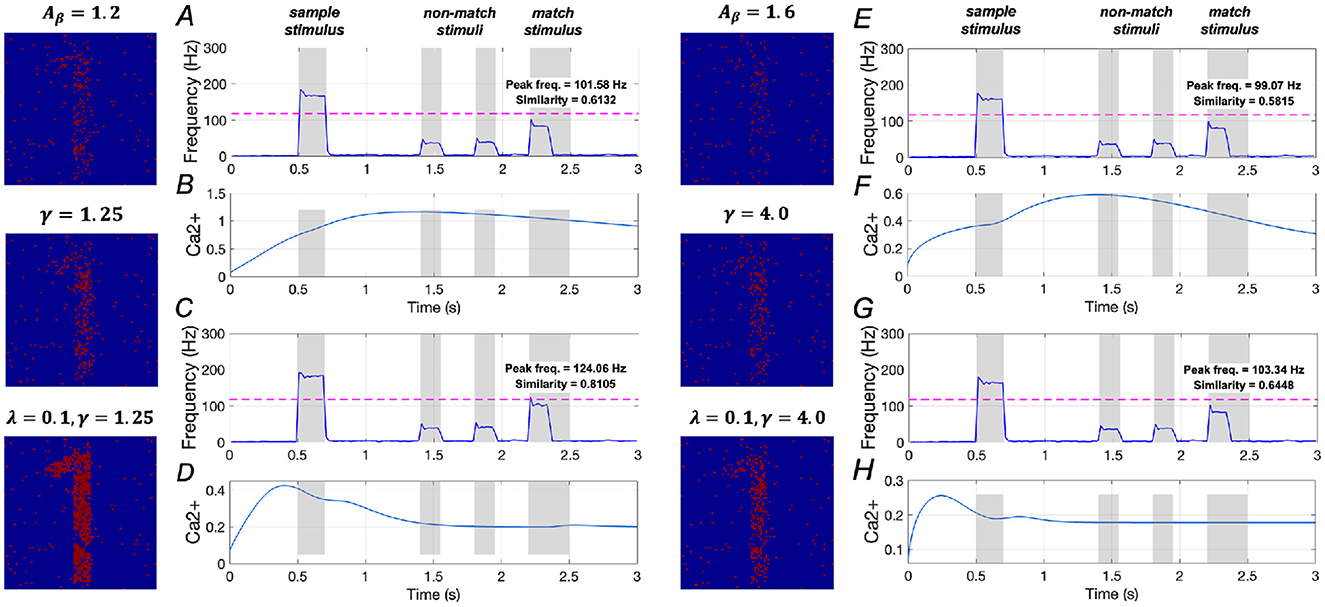
Figure 12. Modulation of memory performance by downregulating IP3 and upregulating SERCA activations. Average frequency of neurons and Ca2+ signal of a specific astrocyte: (A, B) γ = 1.25; (C, D) λ = 0.1, γ = 1.25; (E, F) γ = 4.0; (G, H) λ = 0.1, γ = 4.0.
Moreover, simultaneously altering the activations of IP3 and SERCA significantly enhances WM performance. Specifically, similarity rises from 0.5832 to 0.8105, a ~39.0% increase, and peak frequency increases from 98.98 Hz to 124.06 Hz, reflecting a ~25.3% increase. These findings suggest that concurrently downregulating IP3 activation while upregulating SERCA activation plays a crucial role in restoring WM under mild AD conditions.
In Figures 12E–H, the model results for severe AD conditions indicate that upregulating SERCA activation has minimal impact on WM performance. Additionally, simultaneous changes to the activations of IP3 and SERCA show only slight improvements in WM performance. These results imply that simply regulating intracellular calcium levels is insufficient to effectively restore WM performance in severe AD conditions.
3.5 Test the modulatory roles of IP3 and SERCA using other two sample stimuli
To evaluate the general applicability of our network model, we conducted two additional experiments by changing the sample stimulus to two other digit stimuli: “2” and “7”.
3.5.1 Model evaluation using digit “2” as sample stimulus
Results demonstrated in Figure 13 indicate that the similarity of neuronal responses to the sample and match stimuli reaches ~0.8975, with the peak frequency of neurons responding to the match stimulus being comparable to that of neurons responding to the sample stimulus.
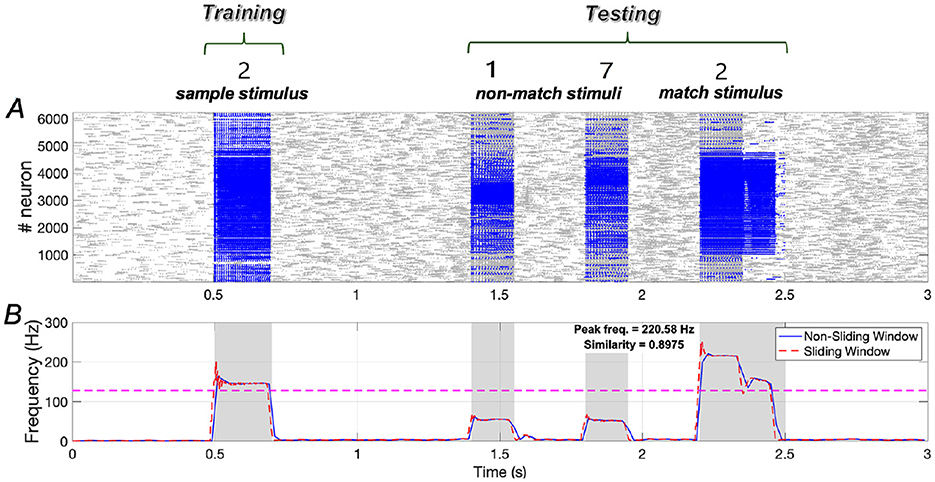
Figure 13. Neuronal responses in the WM network when the sample stimulus image is “2”. (A) Raster plots of spikes for all the neurons during different phases; (B) Average frequencies of stimulus-specific neurons using different time windows, respectively (bin = 20 ms).
The effects of downregulating IP3 activation and upregulating SERCA activation on WM performance are illustrated in Figures 14A–D. In mild AD conditions, when λ = 0.1, similarity increases from 0.5680 to 0.7559, representing a ~33.1% increase, and peak frequency rises from 107.80 Hz to 125.24 Hz, a ~16.2% increase. When γ = 1.25, similarity increases from 0.5680 to 0.5991 (~5.5 increase), and peak frequency rises from 107.80 Hz to 111.06 Hz (~3.0% increase). When both λ = 0.1 and γ = 1.25 are applied, similarity increases from 0.5680 to 0.8016 (~41.1%), and peak frequency rises from 107.80 Hz to 136.29 Hz (~26.4%). These findings suggest that simultaneously downregulating IP3 activation and upregulating SERCA activation plays a crucial role in restoring WM under mild AD conditions, consistent with the results observed under the sample stimulus “1”.
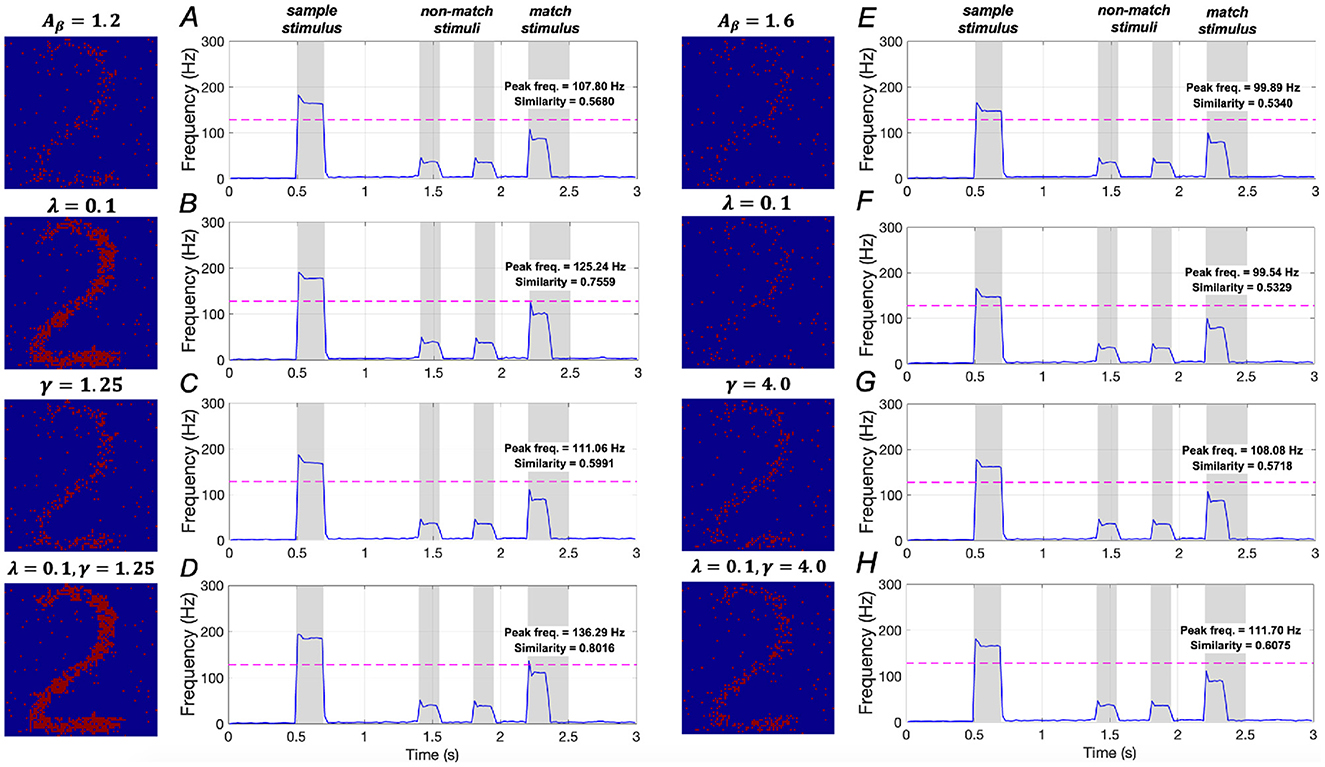
Figure 14. Modulation of memory performance when the sample stimulus image is “2”. Average frequency of neurons: (A) AD condition (Aβ = 1.2); (B) λ = 0.1; (C) γ = 1.25; (D) λ = 0.1, γ = 1.25; (E) AD condition (Aβ = 1.6); (F) λ = 0.1; (G) γ = 4.0; (H) λ = 0.1, γ = 4.0.
In severe AD conditions, the model results shown in Figures 14E–H demonstrate that manipulating the activation of IP3 and SERCA, either separately or simultaneously, does not significantly improve memory performance. These findings imply that the WM performance in severe AD cannot be effectively restored solely by regulating intracellular calcium levels, aligning with the conclusions drawn under the sample stimulus “1”.
3.5.2 Model evaluation using digit “7” as sample stimulus
The trends in similarity and peak frequency under sample stimulus “7” are consistent with those observed for sample stimuli “1” and “2”. Specifically, under sample stimulus “7”, the similarity of neuronal responses to the sample and match stimuli reaches ~0.8629, with the peak frequency of neurons responding to the match stimulus being comparable to that of neurons responding to the sample stimulus (Figure 15).
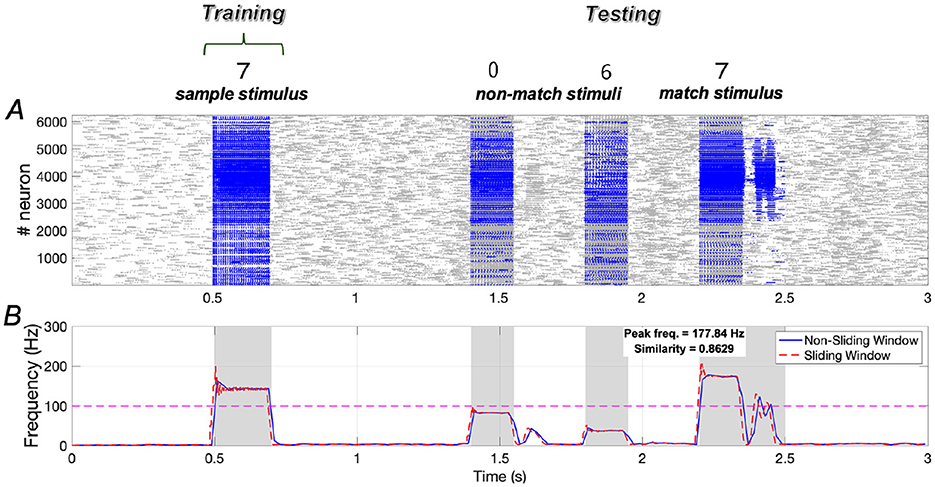
Figure 15. Neuronal responses in the WM network when the sample stimulus image “7”. (A) Raster plots of spikes for all the neurons during different phases; (B) Average frequencies of stimulus-specific neurons using different time windows, respectively (bin = 20 ms).
The effects of downregulating IP3 activation and upregulating SERCA activation on WM performance are illustrated in Figures 16A–D. In mild AD conditions, when λ = 0.1, similarity increases by ~29.3% (from 0.5504 to 0.7117), and peak frequency shows an ~11.9% increase (from 96.42 Hz to 107.94 Hz). When γ = 1.25, there is a small increase of ~2.5% in similarity (from 0.5504 to 0.5643) and ~1.2% in peak frequency (from 96.42 Hz to 97.56 Hz). When both λ = 0.1 and γ = 1.25 are applied, similarity increases significantly by ~37.7% (from 0.5504 to 0.7577), and peak frequency rises by ~18.0% (from 96.42 Hz to 113.76 Hz). These results suggest that simultaneously downregulating IP3 activation and upregulating SERCA activation plays a crucial role in restoring WM in mild AD conditions, consistent with the findings under sample stimulus “1”.
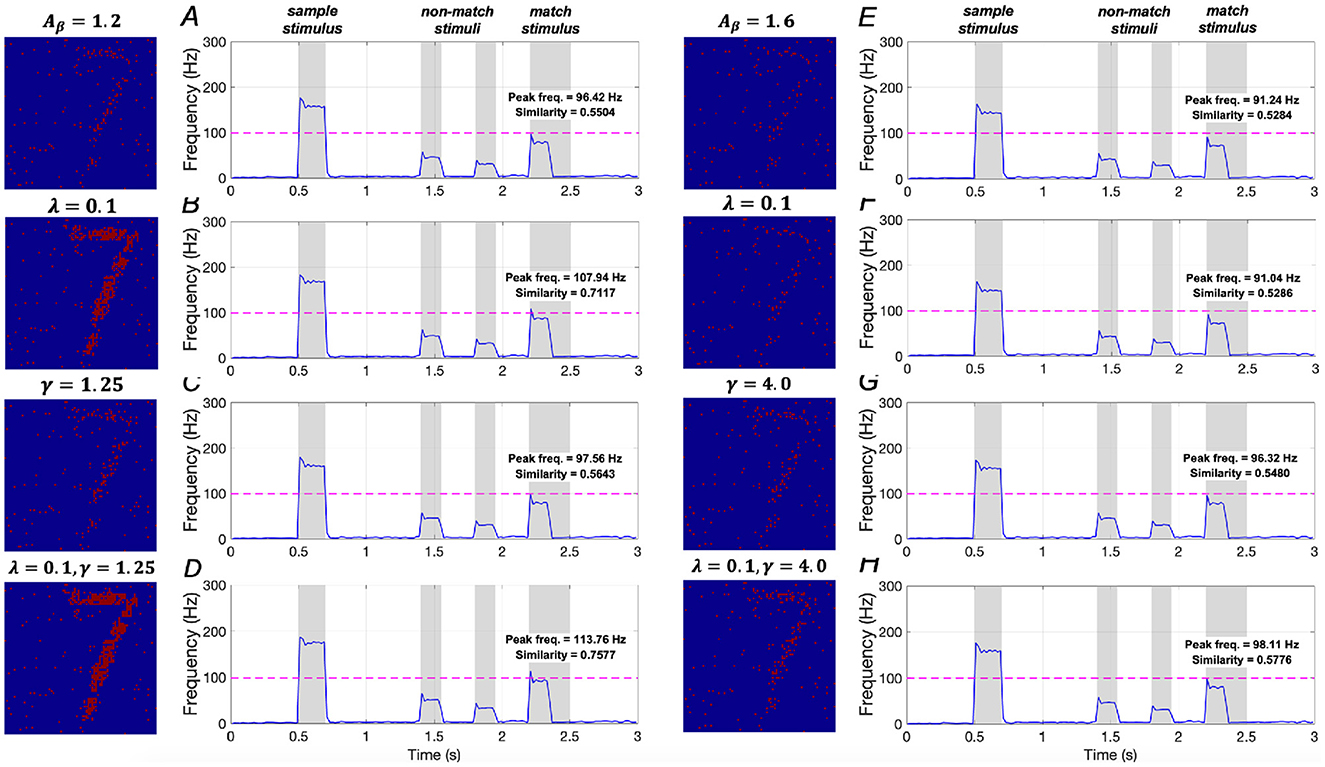
Figure 16. Modulation of memory performance when the sample stimulus image is “7”. Average frequency of neurons: (A) AD condition (Aβ = 1.2); (B) λ = 0.1; (C) γ = 1.25; (D) λ = 0.1, γ = 1.25; (E) AD condition (Aβ = 1.6); (F) λ = 0.1; (G) γ = 4.0; (H) λ = 0.1, γ = 4.0.
Model results for severe AD conditions, shown in Figures 16E–H, demonstrate that manipulating the activations of IP3 and SERCA, either separately or together, does not significantly impact memory performance. There results indicating that WM performance in severe AD cannot be effectively restored by merely regulating intracellular calcium levels, aligning with the conclusions drawn from sample stimulus “1”.
4 Discussions
In this study, we developed a computational model comprising spiking neurons and non-spiking astrocytes to explore how intracellular calcium homeostasis affects WM performance under Aβ-induced AD conditions. Quantitative measures, represented by similarity and peak frequency, indicate that manipulating IP3 receptor activation and SERCA pump activity can significantly enhance memory performance in mild AD conditions. However, minimal effects on performance are observed in severe AD conditions when altering IP3 and SERCA activation. Evaluations using two additional sample stimuli further confirm the general applicability of our network model.
Several previous experimental findings support our proposed modulation strategies of downregulating IP3 and upregulating SERCA as physiologically realistic (Green et al., 2008; Krajnak and Dahl, 2018; Kumar et al., 2015). For instance, mGluR5 antagonists, such as MPEP and fenobam, can pharmacologically reduce IP3 production by blocking metabotropic glutamate receptor 5 (Kumar et al., 2015). These drugs have been shown to effectively reduce synaptic hyperexcitability and improve memory deficits in mouse models of AD, aligning with our model predictions. Additionally, enhancing SERCA pump efficiency has been explored through SERCA2a gene therapy in cardiac disease models (Kranias and Hajjar, 2012), where improved calcium handling restores cellular function. While SERCA upregulation has not been extensively tested in neuronal contexts, pharmacological activators and gene delivery vectors present promising avenues. Together, these strategies offer a translationally relevant approach to restore calcium homeostasis and potentially reverse early WM damage in Aβ-induced mild AD conditions.
Despite the effectiveness of our model in characterizing WM formation and restoration, several limitations still need to be addressed.
4.1 Model components in the network
First, our network model includes only excitatory neurons, overlooking the crucial role of inhibitory interneurons, which are essential for synchronizing network rhythms and preventing overexcitability. Future studies should incorporate inhibitory interneurons to enhance the realism of the memory model. Second, the astrocyte model is based on mean-field approximations, averaging calcium responses across compartments (Bazargani and Attwell, 2016). This approach simplifies the intricate spatial signaling seen in actual astrocytes, particularly in presynaptic domains. Integrating spatially distinct, cell-type-specific mechanisms would enhance the model's fidelity and biological relevance for future laboratory research.
4.2 Aβ and other hypotheses
In recent decades, the pathogenesis of AD has received considerable attention, leading to several prominent hypotheses: (1) Amyloid Hypothesis (Aβ): This hypothesis suggests that neuronal damage in AD patients arises from abnormalities in the processing of amyloid precursor protein (APP) and the subsequent accumulation of Aβ (Hampel et al., 2021). (2) Cholinergic Hypothesis: Supported by experimental observations, this hypothesis highlights a significant reduction in choline acetyltransferase, the enzyme responsible for synthesizing acetylcholine (ACh), in the amygdala, cortex, and hippocampus of postmortem brains from AD patients (Chen et al., 2022). (3) Glutamate Toxicity Hypothesis: This hypothesis is based on evidence of a marked reduction in the binding of 1-[3H] glutamate in the brains of individuals with AD (Maragos et al., 1987). (4) Tau Hypothesis: This hypothesis is grounded in the observation of aggregates of misfolded tau proteins present in the brains of AD patients (Frost et al., 2009).
While these four hypotheses aim to elucidate the pathophysiological basis of AD, it is important to recognize that the triggers associated with these hypotheses likely do not operate in isolation and may interact synergistically (Patow et al., 2023). In this study, we focused solely on AD conditions induced by Aβ accumulation. Future research should also examine AD conditions triggered by other significant factors.
4.3 Synaptic plasticity in WM network
Plasticity is a well-documented phenomenon at nearly all synapses in the brain, encompassing various types such as short-term plasticity, long-term plasticity (including long-term potentiation and long-term depression), Hebbian learning, and spike-timing-dependent plasticity (STDP). Moreover, synaptic plasticity is believed to play a critical role in the formation and storage of WM (Froudist-Walsh et al., 2018; Huang and Wei, 2021). In this study, however, the performance of the WM network is driven solely by intracellular calcium dynamics, without incorporating mechanisms of synaptic plasticity. Therefore, a potential extension of our network model could involve integrating plasticity mechanisms to explore changes in synaptic weights among cells.
4.4 Functions of Aβ at the genetic level
Our network model operates at the cellular level, while the specific mechanisms of Aβ function predominantly occur at the genetic level. For example, Hao and Friedman developed a mathematical model that outlines the Aβ aggregation process in detail, including production, clearance, and degradation (Hao and Friedman, 2016). Mustafa et al. created a two-compartment diffusion model to examine the effects of Aβ on the acetylcholine neurocycle, incorporating a differential equation to characterize changes in Aβ levels (Mustafa et al., 2021). Similarly, Chamberland et al. proposed a multiscale model consisting of 19 ordinary differential equations to analyze the progression of AD, introducing equations for both intracellular and extracellular Aβ (Chamberland et al., 2024). Models that focus on Aβ at the genetic level may offer a more accurate representation of its dynamic variations. Therefore, future modeling studies on Aβ-related AD generation and progression should incorporate more genetic-level components.
4.5 Other types of memory impairments
Memory impairments are common symptoms observed in the brains of AD patients. Alongside deficits in WM, other types of memory, such as short-term, episodic, and semantic memories (Jahn, 2013), are also affected during the progression of AD. Furthermore, various memory-related symptoms, including sleep disturbances (Pathmanathan et al., 2025) and accelerated long-term forgetting (Stamate et al., 2020), have been observed. Recent years have seen the development of computational models addressing these symptoms. For example, Horn et al. constructed a biologically motivated Hopfield model to investigate how the interplay between synaptic deletion and compensation influences memory deterioration patterns (Horn et al., 1993). Razi et al. built a network model of coupled cortical columns to explore the propagation modes between sleep and wakefulness (Razi et al., 2021). Additionally, Murre et al. introduced a mathematical model to analyze the dynamics of forgetting and amnesia, applying their findings to experimental observations from mice, rats and monkeys (Murre et al., 2013). Given this context, future computational studies could integrate these model explorations with our spiking network model to investigate potential therapeutic targets for these symptoms under AD conditions.
Data availability statement
The original contributions presented in the study are included in the article/Supplementary material, further inquiries can be directed to the corresponding author.
Author contributions
ZH: Writing – review & editing, Software, Writing – original draft, Conceptualization, Visualization, Data curation, Methodology. LW: Validation, Conceptualization, Investigation, Writing – review & editing, Supervision, Resources.
Funding
The author(s) declare that no financial support was received for the research and/or publication of this article.
Conflict of interest
The authors declare that the research was conducted in the absence of any commercial or financial relationships that could be constructed as a potential conflict of interest.
Generative AI statement
The author(s) declare that no Gen AI was used in the creation of this manuscript.
Publisher's note
All claims expressed in this article are solely those of the authors and do not necessarily represent those of their affiliated organizations, or those of the publisher, the editors and the reviewers. Any product that may be evaluated in this article, or claim that may be made by its manufacturer, is not guaranteed or endorsed by the publisher.
Supplementary material
The Supplementary Material for this article can be found online at: https://www.frontiersin.org/articles/10.3389/fncom.2025.1643547/full#supplementary-material
References
Bazargani, N., and Attwell, D. (2016). Astrocyte calcium signaling: the third wave. Nat. Neurosci. 19, 182–189. doi: 10.1038/nn.4201
Bertsch, M., Franchi, B., Marcello, N., Tesi, M. C., and Tosin, A. (2017). Alzheimer's disease: a mathematical model for onset and progression. Math. Med. Biol. 34, 193–214. doi: 10.1093/imammb/dqw003
Breijyeh, Z., and Karaman, R. (2020). Comprehensive review on Alzheimer's disease: causes and treatment. Molecules 25:5789. doi: 10.3390/molecules25245789
Chamberland, É., Moravveji, S., Doyon, N., and Duchesne, S. (2024). A computational model of Alzheimer's disease at the nano, micro, and macroscales. Front. Neuroinform. 18:1348113. doi: 10.3389/fninf.2024.1348113
Chen, Z. R., Huang, J. B., Yang, S. L., and Hong, F. F. (2022). Role of cholinergic signaling in Alzheimer's disease. Molecules 27:1816. doi: 10.3390/molecules27061816
Fani, G., Mannini, B., Vecchi, G., Cascella, R., Cecchi, C., Dobson, C. M., et al. (2021). Aβ oligomers dysregulate calcium homeostasis by mechanosensitive activation of AMPA and NMDA receptors. ACS Chem. Neurosci. 12, 766–781. doi: 10.1021/acschemneuro.0c00811
Farhy-Tselnicker, I., and Allen, N. J. (2018). Astrocytes, neurons, synapses: a tripartite view on cortical circuit development. Neural Dev. 13:7. doi: 10.1186/s13064-018-0104-y
Frost, B., Jacks, R. L., and Diamond, M. I. (2009). Propagation of tau misfolding from the outside to the inside of a cell. J. Biol. Chem. 284, 12845–12852. doi: 10.1074/jbc.M808759200
Froudist-Walsh, S., López-Barroso, D., Torres-Prioris, M. J., Croxson, P. L., and Berthier, M. L. (2018). Plasticity in the working memory system: life span changes and response to injury. Neuroscientist 24, 261–276. doi: 10.1177/1073858417717210
Gordleeva, S. Y., Tsybina, Y. A., Krivonosov, M., Ivanchenko, M. V., Zaikin, A. A., Kazantsev, V. B., et al. (2021). Modeling working memory in a spiking neuron network accompanied by astrocytes. Front. Cell Neurosci. 15:631485. doi: 10.3389/fncel.2021.631485
Green, K. N., Demuro, A., Akbari, Y., Hitt, B. D., Smith, I. F., Parker, I., et al. (2008). SERCA pump activity is physiologically regulated by presenilin and regulates amyloid β production. J. Cell Biol. 181, 1107–1116. doi: 10.1083/jcb.200706171
Hampel, H., Hardy, J., Blennow, K., Chen, C., Perry, G., Kim, S. H., et al. (2021). The amyloid-β pathway in Alzheimer's disease. Mol. Psychiatry 26, 5481–5503. doi: 10.1038/s41380-021-01249-0
Hao, W. R., and Friedman, A. (2016). Mathematical model on Alzheimer's disease. BMC Syst. Biol. 10:108. doi: 10.1186/s12918-016-0348-2
Helal, M., Hingant, E., Pujo-Menjouet, L., and Webb, G. F. (2014). Alzheimer's disease: analysis of a mathematical model incorporating the role of prions. J. Math. Biol. 69, 1207–1235. doi: 10.1007/s00285-013-0732-0
Helal, M., Igel-Egalon, A., Lakmeche, A., Mazzocco, P., Perrillat-Mercerot, A., Pujo-Menjouet, L., et al. (2019). Stability analysis of a steady state of a model describing Alzheimer's disease and interactions with prion proteins. J. Math. Biol. 78, 57–81. doi: 10.1007/s00285-018-1267-1
Horn, D., Ruppin, E., Usher, M., and Herrmann, M. (1993). Neural network modeling of memory deterioration in Alzheimer's disease. Neural Comput. 5, 736–749. doi: 10.1162/neco.1993.5.5.736
Huang, Q. S., and Wei, H. (2021). A computational model of working memory based on spike-timing-dependent plasticity. Front. Comput. Neurosci. 15:630999. doi: 10.3389/fncom.2021.630999
Izhikevich, E. M. (2003). Simple model of spiking neurons. IEEE Trans. Neural Netw. 14, 1569–1572. doi: 10.1109/TNN.2003.820440
Jahn, H. (2013). Memory loss in Alzheimer's disease. Dialogues Clin. Neurosci. 15, 445–454. doi: 10.31887/DCNS.2013.15.4/hjahn
Khoshkhou, M., and Montakhab, A. (2018). Beta-rhythm oscillations and synchronization transition in network models of Izhikevich neurons: effect of topology and synaptic type. Front. Comput. Neurosci. 12:59. doi: 10.3389/fncom.2018.00059
Kim, A. Y., Jerdi, S. A., MacDonald, R., and Triggle, C. R. (2024). Alzheimer's disease and its treatment – yesterday, today and tomorrow. Front. Pharmacol. 15:1399121. doi: 10.3389/fphar.2024.1399121
Kimelberg, H. K., and Nedergaard, M. (2010). Functions of astrocytes and their potential as therapeutic targets. Neurotherapeutics. 7, 338–353. doi: 10.1016/j.nurt.2010.07.006
Krajnak, K., and Dahl, R. (2018). A new target for Alzheimer's disease: a small molecule SERCA activator is neuroprotective in vitro and improves memory and cognition in APP/PS1 mice. Bioorg. Med. Chem. Lett. 28, 1591–1594. doi: 10.1016/j.bmcl.2018.03.052
Kranias, E. G., and Hajjar, R. J. (2012). Modulation of cardiac contractility by the phospholamban/ SERCA2a regulatome. Circ. Res. 110, 1646–1660. doi: 10.1161/CIRCRESAHA.111.259754
Kumar, A., Dhull, D. K., and Mishra, P. S. (2015). Therapeutic potential of mGluR5 targeting in Alzheimer's disease. Front. Neurosci. 9:215. doi: 10.3389/fnins.2015.00215
Latulippe, J., Lotito, D., and Murby, D. (2018). A mathematical model for the effects of amyloid beta on intracellular calcium. PLoS ONE 13:e0202503. doi: 10.1371/journal.pone.0202503
Ma, T., and Klann, E. (2012). Amyloid β: linking synaptic plasticity failure to memory disruption in Alzheimer's disease. J. Neurochem. 120, 140–148. doi: 10.1111/j.1471-4159.2011.07506.x
Maragos, W. F., Chu, D. C., Young, A. B., D'Amato, C. J., and Penney Jr, J. B. (1987). Loss of hippocampal [3H]TCP binding in Alzheimer's disease. Neurosci. Lett. 74, 371–376. doi: 10.1016/0304-3940(87)90326-0
Mongillo, G., Barak, O., and Tsodyks, M. (2008). Synaptic theory of working memory. Science 319, 1543–1546. doi: 10.1126/science.1150769
Moravveji, S., Doyon, N., Mashreghi, J., and Duchesne, S. (2024). A scoping review of mathematical models covering Alzheimer's disease progression. Front. Neuroinform. 18:1281656. doi: 10.3389/fninf.2024.1281656
Murre, J. M., Chessa, A. G., and Meeter, M. (2013). A mathematical model of forgetting and amnesia. Front. Psychol. 4:76. doi: 10.3389/fpsyg.2013.00076
Mustafa, I., Awad, A., Fgaier, H., Mansur, A., and Elkamel, A. (2021). Compartmental modeling and analysis of the effect of β-amyloid on acetylcholine neurocycle via choline leakage hypothesis. Comput. Chem. Eng. 145:107165. doi: 10.1016/j.compchemeng.2020.107165
Neher, E., and Sakaba, T. (2008). Multiple roles of calcium ions in the regulation of neurotransmitter release. Neuron 59, 861–872. doi: 10.1016/j.neuron.2008.08.019
Pathmanathan, J., Westover, M. B., Sivakumaran, S., Donoghue, J., and Puryear, C. B. (2025). The role of sleep in Alzheimer's disease: a mini review. Front. Neurosci. 19:1428733. doi: 10.3389/fnins.2025.1428733
Patow, G., Stefanovski, L., Ritter, P., Deco, G., and Kobeleva, X. (2023). Whole-brain modeling of the differential influences of amyloid-beta and tau in Alzheimer's disease. Alzheimers Res. Ther. 15:210. doi: 10.1186/s13195-023-01349-9
Poling, A., Morgan-Paisley, K., Panos, J. J., Kim, E., O'Hare, E., Cleary, J. P., et al. (2008). Oligomers of the amyloid-beta protein disrupt working memory: confirmation with two behavioral procedures. Behav. Brain Res. 193, 230–234. doi: 10.1016/j.bbr.2008.06.001
Puri, I. K., and Li, L. W. (2010). Mathematical modeling for the pathogenesis of Alzheimer's disease. PLoS ONE 5:e15176. doi: 10.1371/journal.pone.0015176
Razi, F., Moreno-Bote, R., and Sancristóbal, B. (2021). Computational modeling of information propagation during the sleep-walking cycle. Biology 10:945. doi: 10.3390/biology10100945
Stamate, A., Logie, R. H., Baddeley, A. D., and Sala, S. D. (2020). Forgetting in Alzheimer's disease: is it fast? Is it affected by repeated retrieval? Neuropsychologia 138:107351. doi: 10.1016/j.neuropsychologia.2020.107351
Toglia, P., Demuro, A., Mak, D. D., and Ullah, G. (2018). Data-driven modeling of mitochondrial dysfunction in Alzheimer's disease. Cell Calcium 76, 23–35. doi: 10.1016/j.ceca.2018.09.003
Vermma, M., Lizama, B. N., and Chu, C. T. (2022). Excitotoxicity, calcium and mitochondria: a triad in synaptic neurodegeneration. Transl. Neurodegener. 11:3. doi: 10.1186/s40035-021-00278-7
Wagner, J., Fall, C. P., Hong, F., Sims, C. E., Allbritton, N. L., Fontanilla, R. A., et al. (2004). A wave of IP3 production accompanies the fertilization Ca2+ wave in the egg of the frog, Xenopus laevis: theoretical and experimental support. Cell Calcium 35, 433–447. doi: 10.1016/j.ceca.2003.10.009
Keywords: working memory, Alzheimer's disease, spiking network, IP3 receptors, SERCA pumps
Citation: Huang Z and Wang L (2025) The role of IP3 receptors and SERCA pumps in restoring working memory under amyloid β induced Alzheimer's disease: a modeling study. Front. Comput. Neurosci. 19:1643547. doi: 10.3389/fncom.2025.1643547
Received: 09 June 2025; Accepted: 30 June 2025;
Published: 22 July 2025.
Edited by:
Simone Cauzzo, University of Padua, ItalyReviewed by:
Jiaxing Wang, Columbia University, United StatesAkanksha Kaushik, The NorthCap University School of Engineering & Technology, India
Copyright © 2025 Huang and Wang. This is an open-access article distributed under the terms of the Creative Commons Attribution License (CC BY). The use, distribution or reproduction in other forums is permitted, provided the original author(s) and the copyright owner(s) are credited and that the original publication in this journal is cited, in accordance with accepted academic practice. No use, distribution or reproduction is permitted which does not comply with these terms.
*Correspondence: Lei Wang, bGVpLndhbmdAbmtjc3d4LmNu