ORIGINAL RESEARCH article

Front. Detect. Sci. Technol., 19 May 2025

Sec. Detector Physics

Volume 3 - 2025 | https://doi.org/10.3389/fdest.2025.1580297

This article is part of the Research TopicFundamentals of luminescence and electroluminescence in particle detection technologies relying on noble-gas mediaView all 6 articles

Near-infrared cathodoluminescence of excimers in dense gaseous mixtures

A. F. Borghesani,
A. F. Borghesani1,2*G. CarugnoG. Carugno2F. Chiossi&#x;F. Chiossi3
  • 1CNISM Unit, Department of Physics and Astronomy, Università degli Studi, Padua, Italy
  • 2Istituto Nazionale di Fisica Nucleare, Sezione di Padova, Padua, Italy
  • 3Department of Physics and Astronomy, Università degli Studi, Padua, Italy

We report new spectroscopic measurements of the near-infrared fluorescence band of electron-beam excited Xe2 excimers as a function of the gas density in several gaseous mixtures of different Xe concentrations at room temperature. We have used He, Ar, and N2 as buffer gases, with the Xe concentrations in the mixtures ranging from approximately 8% up to 80%. The investigated density range extends up to 10 times the density Nig of the ideal gas at standard temperature and pressure (Nig2.5×1025m3). In all mixtures, we have observed that the wavelength of the centroid of the infrared excimer band is shifted toward longer wavelengths as the gas density is increased, in a manner similar to what was originally observed in pure Xe gas and an Ar–Xe mixture. The strength of the redshift depends on the Xe concentrations in the mixture and the nature of the buffer gas and is very well rationalized by taking into account both the classical dielectric screening effect due to the gaseous environment and the density-dependent quantum shift of the energy of the optically active electron in the Xe2 molecule, provided that the contributions of the two gaseous species in the mixture are weighted by applying the laws of ideal gaseous mixtures.

1 Introduction

Xenon is chosen in several high-energy physics applications owing to its excellent fluorescence properties. Excitation of the Xe atoms is accomplished by several different techniques, including either electron- (Arai and Firestone, 1969; Lorents, 1976; Koehler et al., 1974)-, proton- (Hurst et al., 1969), ion- (Ulrich, 2012; Khasenov, 2016), or α-particle beams (Mimura et al., 2009; Álvarez et al., 2013); electrical discharges (Suzuki and Kubota, 1979); and synchrotron light (Dutuit et al., 1978). In particular, Xe is experimentally found to be very efficient in shedding its excitation energy due to the electron impacts on lower-lying atomic and excimer levels (Wojciechowski and Foryś, 1999), thereby leading to intense, narrow-band fluorescence in the vacuum–ultraviolet (VUV) range. For this reason, dense Xe gas and liquid are particularly well-suited as sensitive media in ionizing particle detectors (Knoll, 1989; Gómez Cadenas et al., 2014; Zhang et al., 2023; Aalbers et al., 2022; Anton et al., 2020).

In the degradation pathway of the energy released in the detector medium, a significant amount of the energy is released in the VUV range by the de-excitation of Xe2 excimers from the first excited molecular level to the repulsive ground state, leading to the emission of the well-known first and second VUV continua (Tanaka and Zelikoff, 1954). The first continuum is centered at approximately 148nm and is observed at low gas pressure, whereas the second continuum occurs at approximately 172nm for higher pressures. An additional, much fainter, third continuum centered at approximately 270nm has also been observed (Henck and Coche, 1967; Millet et al., 1978; Leardini et al., 2022). At pressures in excess of P100Pa, it is believed that the excimer VUV emission dominates any other type of radiative emission (Moutard et al., 1988).

The processes leading to excimer fluorescence in the low-density limit have been extensively studied and are now very well-known (Millet et al., 1978; Mulliken, 1970; Salamero et al., 1984; Nowak et al., 1985; Keto et al., 1997). The excimer levels responsible for the emission of the first two VUV continua are the Xe2(1u,0u) and the Xe2(0u+) (in the Hund’s c case (Atkins and Friedman, 2005)), which are produced by the collision of a neutral atom in its ground state, Xe (S01), off excited atoms in the 6s[3/2]2o and 6s[3/2]1o levels (in Racah notation) following the reaction scheme (Millet et al., 1978; Moutard et al., 1988; Wenck et al., 1979):

Xe6s3/22o+2XeS01Xe21u,0u+XeS01Xe6s3/21o+2XeS01Xe20u++XeS01.

Eventually, the excimers may radiatively decay toward the repulsive ground state 0g+.

Xe2Xe20g+2XeS01+hν.

The first continuum, observed at low pressure P<2×10⁴Pa, is produced by the transition from the vibrationally excited 0u+v0 molecular state, correlated with the resonant 6sP13 atomic state, toward the dissociative 0g+ ground state. The second continuum, observed at higher pressureP>5×10⁴Pa, is the result of overlapping bound-free transitions to the repulsive ground state from the lowest, vibrationally relaxed 1u,0u molecular states, correlated with the metastable 6sP23 atomic state (Wenck et al., 1979; Gornik et al., 1981), along with contributions from the vibrationally relaxed bound state related to the 6sP13 atomic state (Leardini et al., 2022). For a more detailed discussion on the elementary processes leading to the emission of the VUV continua, we refer to Borghesani et al. (2001) and the references therein.

The potential energy curves of these lowest-lying excimer levels in pure Xe have been determined by both the analysis of spectroscopic experiments (Keto et al., 1997; Gornik et al., 1981; Raymond et al., 1984; Castex, 1981; Koeckhoven et al., 1995) and by theoretical calculations (Mulliken, 1970; Ermler et al., 1978; Jonin and Spiegelmann, 2002).

Although less energetic transitions may be involved in the Xe excimer de-excitation processes along the energy degradation pathway, leading to possible infrared (IR) and/or near-infrared (NIR) fluorescence, the investigation of such a possibility has been given less attention than the VUV fluorescence. NIR cathodoluminescence, produced by electron impacts, was first observed in the gaseous phase of pure Xe at a wavelength of approximately 1.28μm, corresponding to a wavenumber ν̃7900cm1 (Carugno, 1998). As the NIR light yield has been found to be of intensity similar to that in the UV range, its detection could be exploited to enhance the sensitivity and resolution of high-energy particle detectors (Belogurov et al., 2000).

Further investigation of this NIR band produced the de-excitation of Xe2 formed by electron impacts in pure Xe gas, has provided evidence that the broad and asymmetric emission is a strong indication of an excimer-type transition from a bound molecular state to a lower-lying repulsive one. Owing to the relatively large pressure values of our experiment (P1×104Pa), we have suggested that the emission originates from a higher-lying bound-free molecular transition involving the vibrationally relaxed, bound (3)0g+ state related to the 6p[1/2]0 atomic limit and the dissociative (1)0g+ related to the 6s[3/2]1 atomic limit (Jonin and Spiegelmann, 2002). Moreover, we have been able to reproduce the band shape by means of Franck–Condon-type calculations (Borghesani et al., 2007a; Borghesani et al., 2007b). Additional pieces of information regarding the kinetics of the de-excitation reactions leading to the NIR emission have been recently obtained, although unsolved questions remain (Piotter et al., 2023; Hammann et al., 2024).

One striking feature of the discovered NIR excimer band is that its central wavelength, i.e., the wavelength of the band maximum, λm is strongly redshifted as the gas density N is increased (Borghesani et al., 2001; Borghesani et al., 2005; Mogentale, 2006). Its wavenumber ν̃m=1/λm linearly decreases with increasing N. Such a redshift, although weaker, has also been observed in an Ar(90%)-Xe(10%) mixture (Borghesani et al., 2001; Borghesani et al., 2007b). As it is well-known that excitation energy is efficiently transferred from the lighter to the heavier atomic species (Efthimiopoulos et al., 1997), it is safe to assume that the emitting species in the mixture is still the Xe2 excimer.

We have been able to rationalize the experimental findings, i.e., the density-dependent redshift, by setting up a simple theoretical model that takes into account multiple scattering effects (Borghesani et al., 2001). It is only based on the knowledge of the dielectric constant of the gaseous environment and the quantum density-dependent shift V0(N) of the energy of the delocalized, optically active electron in the excimer. It is important to note that the presence of V0(N) establishes a strong and unexpected link to the seemingly unrelated topics of electron energetics and transport in dense noble gases (Borghesani et al., 1988; Borghesani et al., 1992; Borghesani, 2020; Borghesani, 2021).

This model does not contain any adjustable parameters and accurately describes the data up to higher densities and will be described in Section 3. As it depends on the properties of the gaseous environment in which the Xe atoms are immersed, we have decided to carry out measurements in gaseous mixtures in which the emitting species Xe is typically the minority component, whose dielectric constants and scattering lengths (i.e., V0(N)) are different from those of Xe. We have chosen He and Ar because their V0(N) contributions have opposite signs and should lead to significant differences in the experimental outcomes. We have also chosen to use N2 because its dielectric constant is quite large, but its scattering length is not known with as high an accuracy as for the aforementioned noble gases, thereby leading to the conclusion that the present technique could be an alternative method to measure the scattering length of an atomic or molecular species. We anticipate the result that the model remains valid, provided that the atomic properties of the species are taken into account using the law of ideal mixtures.

This article is organized as follows. The experimental technique is briefly described in Section 2. The phenomenology of the experimental results is presented in Section 3, and their discussion is reported in Section 4. Finally, the conclusions are drawn in Section 5.

2 Experimental details

The technique and apparatus have been described accurately in Borghesani et al. (2001). We briefly summarize them here. A simplified schematic of the experimental apparatus is shown in Figure 1. The technique for exciting the gas sample has already been described in the literature (Borghesani et al., 2001). A homemade electron gun (Barcellan et al., 2011) injects 70keV electrons into the pressurized, stainless-steel cell through a 2×2mm2 wide and 10μm thin Ti window. The electron gun can be operated in either pulsed or continuous mode. In the present experiment, we operated the e-gun in the continuous mode at variance with the previous experiments (Borghesani et al., 2001). In spite of this change in the excitation mode, we did not observe any differences in the outcome.

Figure 1
www.frontiersin.org

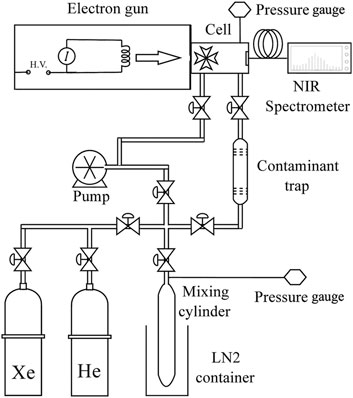
Figure 1. Schematic of the experimental apparatus.

Electrons lose 10 to 20keV energy upon crossing the Ti window but are still energetic enough to excite and ionize the atoms of the gas contained in the cell. An electron current of intensity up to Ie30μA can be easily obtained (Barcellan et al., 2011). Under normal operating conditions, we used excitation currents in the range 0.2μAIe<5μA. As the energy of the injected electrons is fixed by the settings of the e-gun, an increase in the excitation current intensity only results in an increase in the number of excimers formed, leading to a proportional increase in the NIR fluorescence intensity. In any case, the electron current is weak enough not to lead to significant heating of the gas sample, as confirmed by the pressure remaining constant within an accuracy of 1hPa during the whole run.

Xe2 excimers formed in the collision of a ground-state Xe atom with an excited atom (either directly excited by electron impact or in an excited state after a Xe+-electron recombination process) decay to a dissociative state. Owing to the quite large pressure used in the present experiment (P1×104Pa), we safely assumed that the NIR fluorescence is due to a bound-free transition between higher-lying, vibrationally relaxed molecular levels and the dissociative one.

The emitted light exited the cell through a sapphire window and was analyzed by an NIR spectrometer (Ocean Optics, mod. NIRQuest512).

The pressure cell, which was tested with pressure up to P4MPa, was filled with a mixture of gases of the highest commercial purity. The procedure of producing the Xe–He gas mixture of a desired concentration is as follows: at first, Xe is introduced into a calibrated mixing chamber at a desired pressure at room temperature. Subsequently, Xe is frozen by immersing the mixing chamber in a liquid nitrogen (LN2) bath. Then, He gas is added to the refrigerated mixing chamber until a desired pressure is reached. Thereafter, the mixing chamber is heated up to room temperature.

To produce the Xe–N2 mixtures, we use an intermediate calibrated cell to be filled at room temperature with N2 up to the desired pressure. Then, the gas in the intermediate cell is condensed into the mixing chamber along with Xe, and finally, the mixing chamber is allowed to attain room temperature.

After waiting for enough time for the two gases to inter-diffuse, the mixture is introduced to the cell by flowing it through a trap to further remove residual oxygen and other impurities. At the temperature and pressures of the experiment (T300K and P1MPa), the gases can be assumed to obey the ideal gas law, and the concentration of Xe in the mixture is computed by adopting the law of ideal gas mixtures (Guggenheim, 1966).

3 Experimental results: phenomenology

In this section, we present the experimental results obtained in the Xe–He, Xe–N2, and Ar–Xe gaseous mixtures for several pressure values and compare them with previously published results. In Figure 2 we report a spectrum obtained in pure Xe at P=0.1MPa with the high-resolution FT-IR interferometer (Borghesani et al., 2007a) to show how a typical spectrum appears. The continuous band in the center is the excimer spectrum. Several narrow Xe I atomic lines are also present, with their originating atomic manifolds shown in the legend. We would like to warn the interested reader not to give too much importance to the relative intensity of the atomic lines compared to that of the excimer band. We have observed that its height relative to that of the atomic lines strongly depends on the gas purity. If the gas is very pure, the excimer band is much higher than the atomic lines. On the contrary, the atomic lines overwhelm the excimer band if the gas is not so pure. Although the gas was initially introduced in the cell after being purified to a few parts per million oxygen equivalent, the continuous electron bombardment of all surfaces may lead to desorption of several impurities. Although the impurity content may be estimated in the order of some tens of parts per million, especially oxygen-based impurities, their actual amount cannot be controlled. This fact strongly and unpredictably affects the relative weight of the excimer band and the atomic lines from run to run. On the other hand, we have always observed that the features of the excimer spectrum, as far as its location and width are concerned, do not depend on the sample history and purity.

Figure 2
www.frontiersin.org

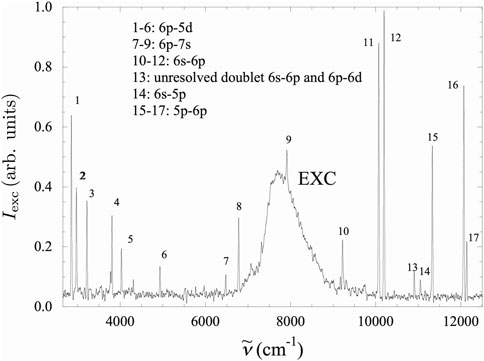
Figure 2. Typical high-resolution spectrum in Xe at P=0.1MPa. The large central feature is the excimer band. The narrow lines are atomic Xe I lines. In the legend, the atomic manifolds are reported, from which the atomic lines originate. This spectrum is obtained with the e-gun in the pulsed mode and with an FT-IR Bruker Equinox 55 interferometer equipped with an LN2-cooled InSb detector (redrawn after Borghesani et al., 2007a).

The intensity of the NIR radiation emitted by the Xe2 excimers obviously depends, among other factors, on the abundance of Xe in the mixture. Thus, it is necessary to adjust the current supplied by the e-gun in order to always safely detect the NIR signal. As the electron current intensity Ie can vary in quite a broad range, one has to check that the features of the excimer spectrum do not depend on it. Toward this goal, we first show in the top panel of Figure 3 that the total integrated light intensity of the excimer spectrum Iexcscales linearly with the excitation current intensity Ie.

Figure 3
www.frontiersin.org

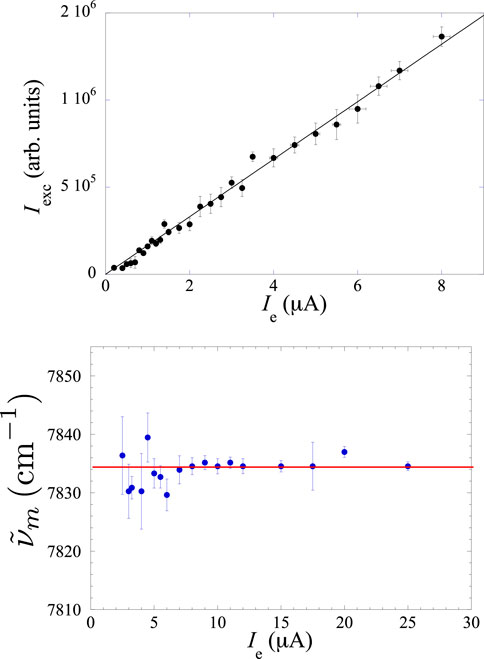
Figure 3. Top panel: linear relationship between the integrated intensity of the excimer spectrum Iexc and the electron current intensity Ie injected into the gas sample. Experimental conditions: pure Xe gas at P=99.4kPa. Bottom panel: the position ν̃m of the excimer band maximum is independent of the intensity of the excitation electron current Ie. Experimental conditions: pure Xe gas at P=82.8kPa.

Another indication that the intensity of the electron current does not influence the microscopic processes leading to excimer formation and decay can be deduced by inspecting the bottom panel of Figure 3, in which the central wavenumber ν̃m of the excimer band is shown to be independent of the intensity of the current injected by the e-gun into the sample. Actually, ν̃m corresponds to the average energy of the excimer bound-free transition, and it turns out not to be altered by the excitation current intensity. Although the data presented in Figure 3 have been recorded in pure Xe gas at pressures P=99.4kPa and 82.8kPa, respectively, similar results are obtained in all investigated mixtures at any pressure.

Finally, we noted that the excimer spectra recorded at different electron current intensities for the same gas pressure do differ only in the intensities and not in their general features. After proper normalization at the unit area, they exactly overlap, provided that the spectra recorded at lower excitation current are less intense and, therefore, much noisier than those recorded at higher excitation current, as shown in Figure 4.

Figure 4
www.frontiersin.org

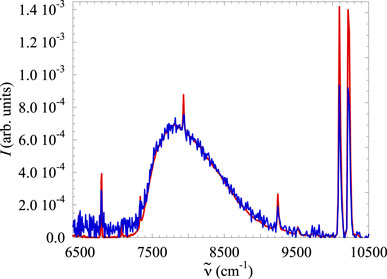
Figure 4. Normalized spectra recorded in pure Xe gas at room temperature for the same pressure P=18.9kPa, corresponding to the gas density N4.6×1024m3, with two different values of the excitation current. Red line: Ie=25μA. Blue line: Ie=2μA. The two spectra are normalized to unit area and almost perfectly overlap.

3.1 Pure Xenon gas and the Ar–Xe mixture

In pure Xe gas, the modification of the spectrum as a consequence of the variation of the gas density is the largest among all mixtures. In Figure 5 we show two spectra recorded at the lowest and highest pressures reached in the present experiment, corresponding to densities N4.6×1024m3 and N1.72×1026m3, respectively. The differences between the two spectra are striking. We immediately observe that the spectrum recorded at high density is significantly shifted toward smaller wavenumbers with respect to the spectrum obtained at low density. The narrow atomic Xe I lines are suppressed at high density. Moreover, as expected, at high density, the excimer band is strongly collisionally broadened. The present measurements are in excellent agreement with our previous measurements (Borghesani et al., 2001; Borghesani et al., 2007b).

Figure 5
www.frontiersin.org

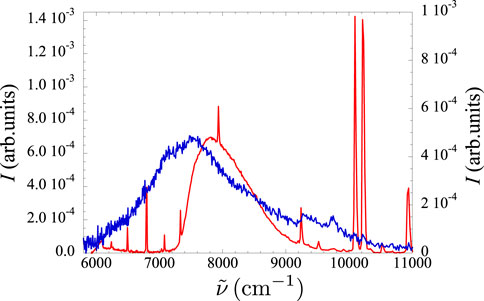
Figure 5. Spectra recorded in pure Xe gas at room temperature at two different pressure values. Red line: P=18.9kPa, N4.6×1024m3 (left scale). Blue line: P=682kPa, N1.72×1026m3 (right scale). Note the strong pressure-dependent redshift and broadening of the excimer band and the almost complete suppression of the narrow Xe I atomic lines at higher pressure. Each spectrum is normalized to unit area.

In the Xe–Ar mixture of nominal 10%90% composition, the shift is smaller than in pure Xe, as is the collisional broadening. For the sake of completeness, we report here our previous data for pure Xe and the Xe–Ar mixture. The density-dependent redshift of ν̃m is plotted in the top panel of Figure 6. We immediately note that ν̃m decreases linearly with increasing gas density N and that the slope is much larger in the pure Xe gas than in the Ar–Xe mixture. The solid lines represent the prediction of the model that will be described and discussed later in this paper and are not a linear fit to the data.

Figure 6
www.frontiersin.org

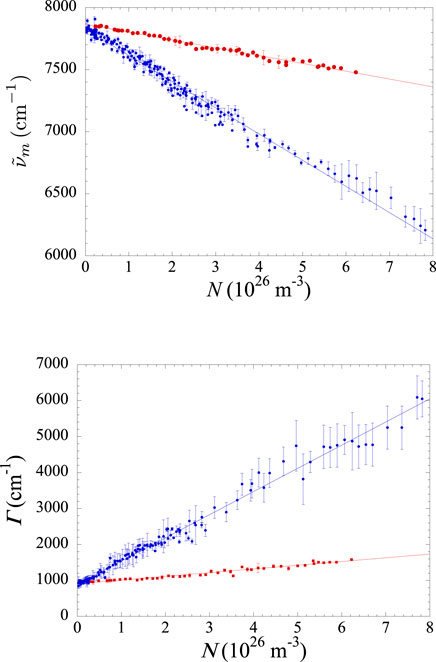
Figure 6. Top panel: density-dependent redshift of the wavenumber ν̃m of the centroid of the Xe2 excimer band in pure Xe gas (blue circles) and in the Xe(10%)–Ar(90%) mixture (red circles) (redrawn after Borghesani et al., 2007b). Lines: prediction of the model, Equation 5 (see text). Bottom panel: density dependence of the full width at half maximum Γ of the excimer spectrum in pure Xe gas (blue circles) and in the Xe(10%)–Ar(90%) mixture (red circles) (redrawn after Borghesani and Carugno, 2008). Lines: linear fit to the data.

The increase in density is (Equations 2, 4, 5, 6, and 7) expected to result in a higher collision frequency that reduces the lifetime of the excimer species and increases the width of the continuum. Although the excimer spectrum is a band rather than a narrow line, its width is a measure of how much the density affects the excimer lifetime. The density dependence of the full width at half height Γ is reported in the bottom panel of Figure 6. First, we noted that the broadening of the excimer band linearly increases with increasing N according to Equation 1 (Borghesani et al., 2007b; Borghesani and Carugno, 2008)

Γ=Γ0+γN,(1)

in which γ=v̄σ/πc, c is the speed of light, v̄T1/2 is the thermal velocity of the species, T is the absolute temperature, σ is a sort of atom–molecule collision cross section, and Nv̄σ is the excimer–atom scattering rate. This is the typical outcome of collisional broadening and is to be expected. As the excimer continuum originates in a bound-free transition, Γ0 is related to the energy range available to the final state. It is roughly determined by the steepness of the potential energy curve of the dissociative state and by the spatial extension of the wavefunction of the vibrational ground state of the bound potential. That is the reason why Γ0 has the same value in both pure Xe and in the Xe–Ar mixture.

The second, and perhaps more interesting, observation is that the spectrum broadening is much larger in the pure gas than in the mixture. Apparently, the Xe2–Xe collision cross-section is roughly one order of magnitude larger than that of Xe2–Ar. We have suggested that this could be an effect of quantum indistinguishability of identical particles (Borghesani and Carugno, 2008), although this interpretation has been strongly criticized, especially because the measurements are carried out at room temperature, at which quantum effects should be negligible.

3.2 Xe–He mixtures

We have investigated three Xe–He mixtures of nominal Xe concentrations that were roughly 10%, 36%, and 69%, respectively. A typical spectrum obtained from the mixture at the lowest Xe concentrations and at the highest pressure value P=787.8kPa, corresponding to a density N1.91×1026m3, is shown in Figure 7, in which it is compared with a pure Xe spectrum at low pressure P63kPa, corresponding to a roughly ten times lower density N1.54×1025m3.

Figure 7
www.frontiersin.org

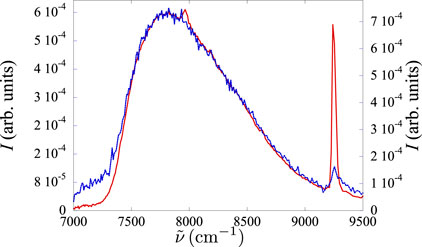
Figure 7. Spectra of a 10% Xe–90% He mixture at P=787.8kPa (N1.91×1026m3) (blue line, left scale) and of pure Xe at P=63kPa (N1.54×1025m3) (red line, right scale). Both spectra are redshifted with respect to the spectrum in pure Xe for P0, but the mixture requires a larger pressure to achieve a comparable redshift. Both spectra are normalized to the unit area.

We immediately note that the redshift in the Xe–He mixture is very weak, as both spectra are almost coincident. The Xe–He mixture requires a much higher density than the pure gas to reach a similar redshift.

In the top panel of Figure 8 we report the density dependence of the central wavenumber of the spectrum for the three investigated Xe–He mixtures, along with the results obtained in pure Xe gas during the present experimental run.

Figure 8
www.frontiersin.org

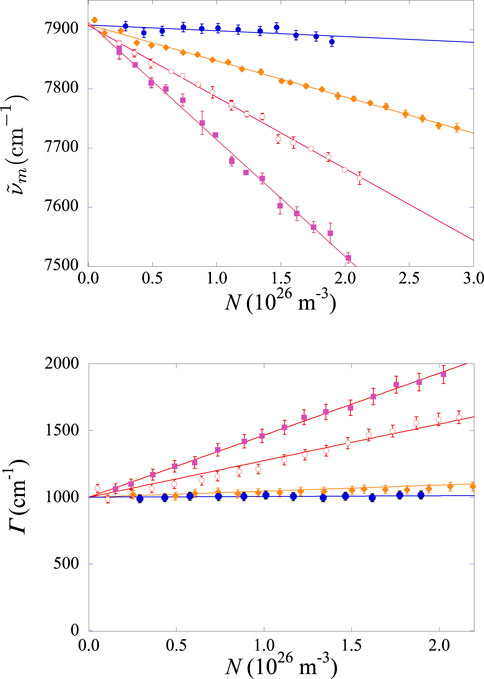
Figure 8. Top panel: density dependence of ν̃m for the Xe–He mixtures of Xe concentrations of (from the top): 12% (closed circles), 36,% (diamonds), and 69% (open circles). The ν̃m redshift in pure Xe measured during the present campaign is also shown (squares). Lines: theoretical prediction. Bottom panel: full width at half height Γ of the Xe2 excimer band in the Xe–He mixtures of Xe concentrations (from bottom): 12% (closed circles), 36% (diamonds), and 69% (open circles). The excimer width Γ in pure Xe measured during the present campaign is also shown (squares). Lines: linear fit to the data.

We observed that in all mixtures, ν̃m is linearly redshifted upon a density increase. The redshift increases with the increase in Xe concentrations in the mixture, eventually converging to the behavior of pure Xe gas.

The spectra also show collisional broadening. Their full width at half maximum Γ is depicted in the bottom panel of Figure 8 and is described by the same linear relationship of Equation 1. We noted that the density dependence of Γ is the weakest for the mixture with the lowest Xe concentrations and becomes stronger as the Xe concentrations increase.

3.3 Xe–N2 mixtures

We investigated several Xe–N2 mixtures of Xe concentrations x(%)8, 15, 20, 25, 30, 40, 75, and 80. Two typical spectra recorded with x25% at low and high density are shown in the top panel of Figure 9, whereas in the bottom panel, two such spectra are reported for low and high density at x=80%. These spectra qualitatively show the same features as those obtained in the other mixtures, i.e., redshift of ν̃m and collisional broadening. However, their shape is more distorted. The distortion with increasing density is even larger at higher x than in other mixtures at the same N and x, as shown in the bottom panel of Figure 9. This phenomenon makes it difficult, at the highest N, to even define the excimer bandwidth. Moreover, some of the atomic Xe I lines are almost entirely suppressed. However, at variance with mixtures with different buffer gases of comparable concentration and density, the atomic lines stemming from transitions within the 6s–6p manifold in the wavenumber range 9×103cm1ν̃104cm1 are not suppressed at all and, at high Xe concentrations, are affected by density in a still unexplained way. They are extremely broadened, and their integrated intensity becomes almost comparable to that of the excimer. We do not know if low nitrogen concentrations may lead to the appearance of satellites around the Xe I atomic lines, which are not resolved in the present experiment, or if another emission continuum, possibly originating from the formation and de-excitation of XeN2 exciplex, is appearing in the spectral range shared with the atomic lines. So far, we have no convincing explanation for this behavior.

Figure 9
www.frontiersin.org

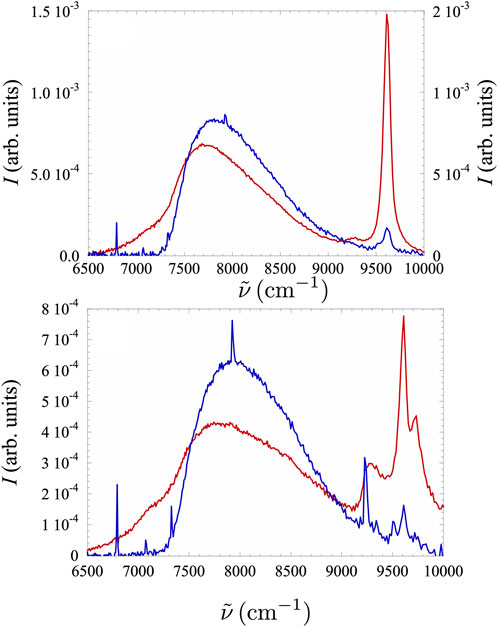
Figure 9. Typical spectra in Xe–N2 mixtures. Top panel: spectra at x=25%. Blue line: P=20kPa and N=4.86×1024m3. Red line: P=718kPa and N=1.75×1026m3. Bottom panel: spectra at x=80%. Blue line: P=20kPa and N4.90×1024m3. Red line: P=740kPa and N=1.80×1026m3. At high pressure, the spectrum is heavily distorted with respect to its low-pressure shape. The lines stemming from atomic transitions within the 6p–6s manifold in the range 9,000cm1<ν̃<104cm1 are not suppressed and are strongly affected by the density, especially in the Xe-richer mixture. All spectra are normalized to the unit area.

For all Xe concentrations, ν̃m linearly decreases with increasing N, as shown in the top panel of Figure 10. Once again, the strength of the redshift is minimal for the mixture with the lowest Xe concentration and increases with the increase in the Xe concentration, monotonically approaching the strength obtained in pure Xe gas.

Figure 10
www.frontiersin.org

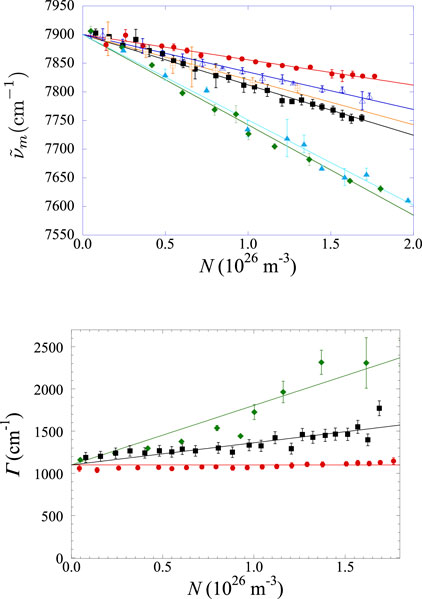
Figure 10. Top panel: density-dependence of ν̃m in the Xe–N2 mixtures of Xe concentrations (from the top): x(%)=8, 20, 30, 40, 75, and 80. Lines: theoretical prediction. Bottom panel: full width at half height Γ of the Xe2 excimer band as a function of the gas density for the Xe–N2 mixtures of Xe concentrations of (from the top): x(%)=80, 40, and 8. The data for the other mixtures are not plotted to avoid cluttering. Lines: linear fit to the data.

The quantification of the collisional broadening of the spectra is shown in the bottom panel of Figure 10, in which the full width at half height Γ is reported as a function of the gas density for some mixtures. Once more, the largest broadening occurs for the mixture with the highest Xe concentration, whereas the minimum broadening is obtained when the Xe concentration is the lowest. Again, we suggest that this effect could be a consequence of the quantum indistinguishability of identical particles (Gasiorowicz, 1974). If the Xe2 excimer collides with an Xe atom, the scattering cross-section might be larger than if it were colliding with a different atomic species, as it occurs in the case of H2–H collisions at low energy (Krstic and Schultz, 1999). However, this hypothesis is questionable, as quantum effects hardly manifest themselves at high temperatures.

Finally, we want to provide evidence regarding the large uncertainty on the width at the highest Xe concentration. As previously noted, the spectra in the Xe–N2 mixtures at high Xe concentrations are so much more distorted than in the mixtures based on different gases that the individuation of the width might be very difficult, thereby making Γ quite meaningless at high density.

4 Discussion

The most interesting feature of our experimental observation is that the NIR excimer spectrum is always shifted toward lower wavenumbers, i.e., it is redshifted, if the density of the gas is increased. This phenomenon may affect the way in which Xe is used in the field of high-energy particle detection. However, most significantly in our opinion, it may shed light on the (unexpected) correlation between two different realms involving very low-energy electrons in a dense environment: loosely bound electron states in a molecule and quasi-free electron transport in dense gases.

We noted that, in the limit of the negligibly small density, ν̃0=limN0ν̃m and Γ0 converge to the same values for all investigated mixtures, which is precisely the one observed in the pure Xe gas. This is a very convincing clue that the emitting species is the Xe2 excimer in all samples. Thus, a possible explanation of the experimental outcome for the pure gas should act as a guide for understanding the behavior observed in the different mixtures.

We were able to set up a theoretical model that explains the experimentally observed redshift in pure Xe gas without any adjustable parameters (Borghesani et al., 2001). We are now in the position to extend this successful model to the case of the mixtures. We will see that all the features of the model maintain their validity and that the extension of the pure gas model to the mixtures is straightforward, provided that the mixtures are dealt with by exploiting the law of the ideal mixtures. Thus, in this section, we will recapitulate the model we have devised and show how it is successfully extended to mixtures.

4.1 Derivation of the model for pure Xe gas

The electronic structure of an isolated homonuclear excimer is accurately described in terms of an ionic core plus a (largely) delocalized electron in a diffuse Rydberg orbital whose radius is much larger than the internuclear separation (Mulliken, 1970). Such a description also retains its validity in a dense gaseous environment, provided that the density is low enough to lead to a negligibly low scattering rate of the electron off the surrounding atoms. Stated differently, the mean free path of a quasi-free electron in the gas must be larger than the size of the Rydberg orbital. This condition is fulfilled in pure Xe gas as the mean free path at the density of our experiment is several nanometers long (Huang and Freeman, 1978). It is also fulfilled in N2 (Wada and Freeman, 1981), Ar (Huang and Freeman, 1981), and He (Bartels, 1975). A rough estimate of an upper limit on the value of the Rydberg orbital radius R can be easily obtained by enforcing the condition that the quasi-free electron mean free path =1/Nσ, in which σ is the momentum-transfer scattering cross-section, is much longer than the circumference 2πR of the Rydberg orbital, 2πRNσ1. For Xe gas atoms, in the 10 meV energy range, σ5×10²⁰m2 (McEachran and Stauffer, 2014). For the highest density N8×1026m3 reached in the previous experiment in pure Xe (Borghesani et al., 2001), we get R3.8nm.

High-extravalence excitations of atomic impurities in highly polarizable media are known to be redshifted and are assumed to have a probable parentage with Wannier impurity states in liquids (Messing et al., 1977a; Messing et al., 1977b). Thus, the excimer energy spectrum can be computed in analogy with that of these Wannier states.

Two main effects influence the excimer energy spectrum. The first one is a classical dielectric screening effect. It has been shown that the electron energy eigenvalues in a point-like Coulomb potential immersed in a medium of a relative dielectric constant K(N), (Equation 2), are reduced by a factor K2(N) (Herman et al., 1956). In a naive picture, we can envision this effect by assuming that many atoms of the environment can be accommodated within the wide electron orbit, thereby screening the ionic core–electron Coulomb interaction.

In the present case, the excimer band originates from the transition from the high-lying, vibrationally relaxed, bound (3)0u+ molecular state, described by the potential energy curve Vu, toward the dissociative (1)0g+ state, described by the potential energy curve Vg (Borghesani et al., 2007a).

As a consequence of dielectric screening, the average energy difference between the initial and final states is reduced by the factor K2(N). The relative dielectric constant is computed via the Lorentz–Lorenz formula

K1K+2=α3ϵ0N,(2)

in which α=4.45×1040Fm is the Xe atomic polarizability (see Table 1) and ϵ0 is the vacuum permittivity.

Table 1
www.frontiersin.org

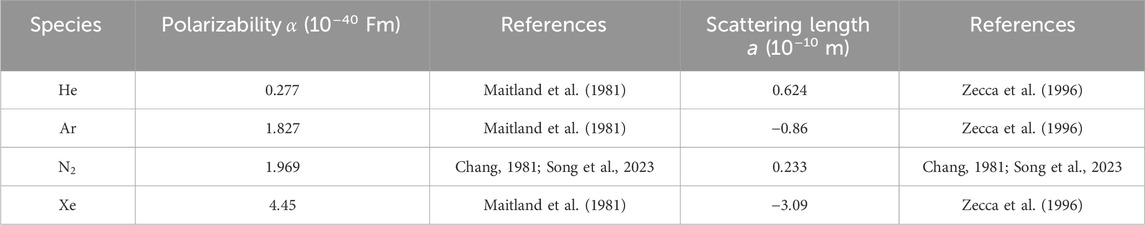
Table 1. Physical properties of the gases.

Owing to the smallness of α and the not-so-large density reached in the present experiment, 1/K2(N) can be expressed as a Taylor expansion by keeping only the first-order term without any loss of accuracy. Thus, the wavenumber ν̃m at the center of the excimer band is obtained as

ν̃m=VuVg2πcK2Nν̃012αϵ0N=ν̃0ν̃02αϵ0N,(3)

In Equation 3 is the reduced Planck’s constant and ν̃0=VuVg/2πc, which can approximately be estimated to be ν̃07900cm1 (Borghesani et al., 2007a; Borghesani et al., 2007b). Unfortunately, there are no precise theoretical estimates, and thus, the value of ν̃0 must be deduced from the experiment. This dielectric screening effect is linear in N, but the slope 2αν̃0/ϵ0 approximately contributes only one-half of the measured slope.

The second, equally relevant contribution to the density dependence of ν̃m is given by a quantum multiple scattering effect that also affects the transport properties of quasi-free electrons in dense noble gases (Borghesani et al., 1992). The Rydberg electron in the excimer is so largely delocalized that it can be treated as if it were almost quasi-free. Its wavefunction spans over many surrounding atoms at once, and its energy is shifted by the density-dependent quantity V0(N) that was first computed by Fermi (Fermi, 1934),

V0N=2π2mNa,(4)

In Equation 4 m is the electron mass and a is the electron–atom scattering length. This contribution only affects the energy of the electron in the upper bound state, whereas it is absent in the final state, in which the electron is no longer widely delocalized.

By adding this contribution to the first one, we finally get the density-dependent shift of ν̃m as

ν̃m=ν̃0ν̃02αϵ0amcN,(5)

which turns out to be linear in N. We stress the fact that the model, Equation 5, does not contain any adjustable parameters.

The Xe scattering length is a=3.09×10¹⁰m (see Table 1) and adds to the effect of the dielectric screening by reducing the energy difference of the bound–free transition. This leads to the observed strong redshift of the spectra in pure Xe. The solid line in the top panel of Figure 5 is the theoretical prediction given by Equation 5.

In the case of the Xe(10%)–Ar(90%) mixture, Xe is mainly surrounded by Ar atoms. Thus, by using the values of atomic polarizability α=1.827×1040Fm and scattering length a=0.86×10¹⁰m relative to Ar, Equation 5 also describes the mixture redshift satisfactorily well, as shown by the solid line in the top panel of Figure 5.

While the dielectric screening effect, although of different strengths in different gases, always acts in the same direction by reducing the transition energy, thereby shifting the excimer spectrum toward longer wavelengths, the contribution of the multiple scattering effect (Equation 4) may be positive or negative depending on the sign of the scattering length a. Thus, it may amplify or diminish the redshift of the excimer spectrum. In low atomic mass noble gases such as He and Ne, a has a positive value, whereas it is negative in heavier noble gases. For these reasons, we expect that the redshift of the Xe2 excimer spectrum in the mixtures is significantly smaller than that in pure Xe. The goal of the present experiment is exactly to test this prediction.

4.2 Extension of the model to Xe-based mixtures

The aim of Section 4.2 is to extend the interpretative model to gaseous mixtures for the redshift. The energy transfer from the lighter to the heavier noble gases is a well-known process (Efthimiopoulos et al., 1997). Therefore, Xe is always excited either by direct or indirect processes, and it is safe to assume that Xe2 excimers, although Xe may be the less abundant species, are the emitting species in the investigated spectral range.

In a mixture, the Xe2 excimer is mostly surrounded by atoms or molecules of different species. It then interacts with them, and not only with other Xe atoms. As a consequence, Equation 5 must accordingly be modified by taking into account the probability that the Xe neighbors are different. The easiest way to pursue this goal is to simply adopt the concept of the ideal mixtures (Guggenheim, 1966) and assume that the average polarizability and scattering length of any mixture are the sum of these properties of the individual species, weighted by their relative abundances.

We have to remember that at the temperature and pressures of the present experiment, all gases follow the law of the ideal gas quite accurately1. Therefore, the average density N of any mixture does not significantly differ from the density of the ideal gas at the same T and P.

Let αi, ai, and xi with i=1,2 be the polarizability, scattering length, and relative abundance of the two species present in the mixture, respectively. Moreover, let x1=x, and x2=1x. Equation 5 is then modified to yield

ν̃m=ν̃02ν̃0ϵ0xα1+1xα2mcxa1+1xa2Nν̃0βN,(6)

with the slope β given by

β=2ν̃0ϵ0xα1+1xα2mcxa1+1xa2.(7)

The main result is that ν̃m is still linearly dependent on the density N, although its value now depends on the properties of the two species in the mixture. Equation 6 is represented by the straight lines in the top panel of Figure 6 for the Ar–Xe mixture and in the top panels of Figure 8 and Figure 10 for the Xe–He and Xe–N2 mixtures, respectively.

The values of polarizability α and scattering length a of the gases at hand are found in the literature and summarized in Table 1. Once the polarizability and scattering length of the species used in our experiment are known, it is an easy task to compute the expected values for the slope β via Equation 7. In Table 2 we compare the values of β obtained with a linear fit to the experimental ν̃m data with the theoretical prediction. The uncertainty δ on the theoretical determination of β is due to the uncertainty of the mixture concentration and the uncertainty of the values of the scattering length found in the literature, whereas the uncertainty of the experimental determination of the slope is the statistical uncertainty of the weighted linear fit to the experimental data.

Table 2
www.frontiersin.org

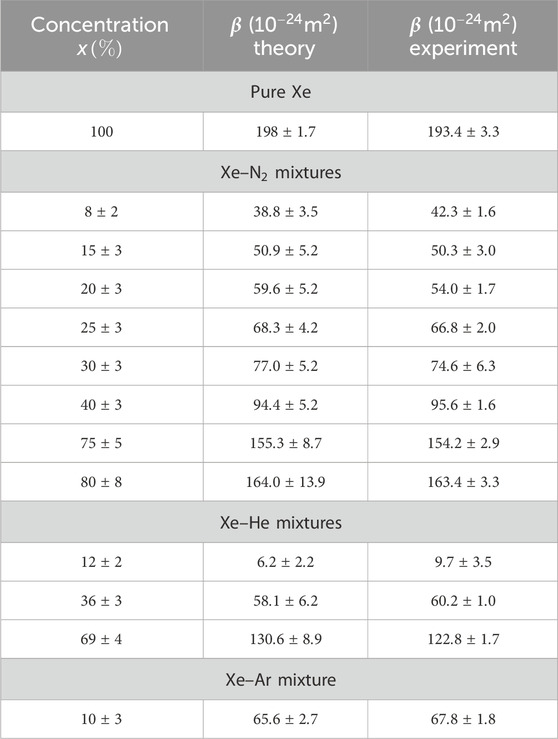
Table 2. Comparison of the experimentally measured values of the linear coefficient β (Equation 7) of the density-dependent redshift of the Xe2 excimer band centroid with the theoretically expected ones for the investigated Xe–N2 and Xe–He mixtures of different Xe concentrations x. Literature data for pure Xe and the Xe–Ar mixture are reported (Borghesani et al., 2001).

We noted that the proposed extension of the original model for the pure gas accounts for the experimental results for the mixtures in an excellent way. The experimental data, within the uncertainty, are very close to the theoretical values for all mixtures. A visual way to ascertain how the experimental data of the slope are close to the predicted values is shown in Figure 11. Here, the experimental βth values of all the mixtures are plotted as a function of the normalized distance from the theoretical value, y=(βthβexp)/δ. Although this way of displaying the results is not statistically rigorous, nonetheless, it suggests how well the experimental values are aligned with the theoretical prediction.

Figure 11
www.frontiersin.org

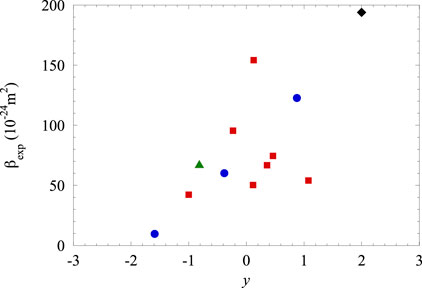
Figure 11. Experimental values of the shift slope βexp versus the normalized distance between the theoretical and experimental slope values y=(βthβexp)/δ, in which δ is the uncertainty in the theoretical value. Mixtures: Xe–N2 (squares), Xe–He (circles), Xe–Ar (triangle), and pure Xe (diamond).

Some additional general remarks can be made by examining the table. The Xe–He mixtures show the lowest βexp values among all mixtures of comparable Xe concentrations. This is because the polarizability of He is the least, and its scattering length is also relatively small. He shows the least polarizability among all investigated gases, thereby yielding the weakest contribution to the redshift due to the dielectric screening effect. Additionally, its scattering length is positive and quite large, leading to a multiple scattering effect contribution, that is, acting to increase the energy difference in the transition, thereby inducing a blueshift that greatly reduces the overall redshift. In addition, the scattering length of the N2 molecule is positive but much smaller than that of He (moreover it is known with quite a large uncertainty (Chang, 1981; Song et al., 2023)), and its blueshift contribution is overwhelmed by the redshift induced by its very large polarizability. We can spot this differences between the two mixtures by observing Figure 12, in which the experimental slope values βexp for the Xe–He and Xe–N2 mixtures are reported as a function of the Xe concentration. Notably, in the limit of the negligibly small Xe concentrations, limx0βexp(x)<0 for the Xe–He mixtures, thereby indicating that if the Xe excimer were only surrounded by He atoms, its emission, would be shifted to higher wavenumbers, i.e., a blueshift of the excimer band would be observed.

Figure 12
www.frontiersin.org

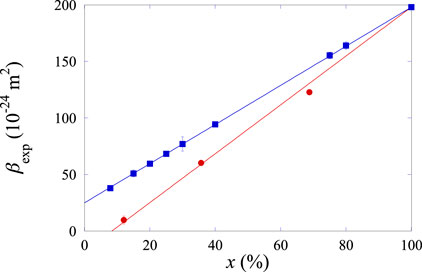
Figure 12. Dependence of the experimental slope βexp on the Xe concentration x for the Xe–N2 mixtures (squares) and for the Xe–He mixtures (circles).

On the contrary, for the Xe–N2 mixtures, we still have limx0βexp(x)>0. In this case, the polarizability of the nitrogen molecule is so large that it obscures the opposing effect of its scattering length, and the excimer band would still be redshifted.

5 Conclusion

The investigation of the NIR fluorescence of Xe2 excimers produced by electron impact has led to very interesting discoveries. In the pure Xe gas we have observed a broad NIR emission centered around the wavenumber ν̃m7,900cm1, which we have attributed to a bound–free transition between higher-lying molecular levels. The number of NIR photons emitted per unit energy released in the gas by energetic particles has been proved to be comparable to that of UV photons emitted in the same excitation process, thereby suggesting that the exploitation of the radiation emitted in this band could help improve the sensitivity and energy resolution of high-energy particle detectors based on Xe.

We have unexpectedly found that in addition to the expected collisional broadening, the excimer band is redshifted, i.e., its centroid linearly shifts to smaller wavenumbers, as the gas density increases. We have been able to rationalize the experimental observations by devising a model in which the optically active electron in the molecule in its high-lying energy state is largely delocalized. In this way, it can be treated almost as if it were a quasi-free electron.

According to our model, two effects act to modify the transition energy. The first one is based on the effect of classical dielectric screening: many surrounding atoms are contained in the extremely extended electron orbit and screen the Coulomb electron–nucleus interaction, thereby reducing the difference between the energy levels.

The second one, on the contrary, is a quantum multiple scattering effect. The wavefunction of the delocalized electron has such a wide spatial extension that it spans over several surrounding atoms at a time. As a result, the electron energy is altered by a density-dependent quantum shift V0(N) of its energy at the bottom of the conduction band. For relatively low and intermediate gas densities, this shift is linear with the density itself and depends on the electron–atom scattering length. For the heavier noble gases, the electron–atom scattering length is negative, and so is V0(N), whereas both are positive for the lighter He and Ne atoms. This effect can, thus, amplify or reduce the influence of the dielectric screening effect.

It is extremely interesting to note that V0(N) influences the energetics and dynamics of excess electrons of very low energy (a few meV) in dense noble gases and liquids and determines their transport regime, where they either drift through the medium as highly mobile quasi-free particles or get self-localized in cavities and consequently move as very slow hydrodynamic objects (Reininger et al., 1983; Borghesani et al., 1991; Borghesani, 2007).

Thus, the spectroscopic measurements may give useful pieces of information on how a delocalized electron interacts with its high-density surroundings. The leading proposal of the present measurements is that the environment could be modified by embedding the probe, i.e., the Xe2 excimer, in different gases. Gas mixtures have proven to be the best solution. The choice of the gases to be used has been dictated by the values of their physical properties. Moreover, at the temperature and pressure of the present experiment, they can be mixed uniformly in all proportions and behave as ideal gases.

The experimental outcome in the mixture turns out to be qualitatively similar to what is observed for pure Xe gas. The excimer band is always redshifted, i.e., its central wavenumber linearly decreases with increasing gas density, but the shift strength depends on the concentration and type of gases in the mixture.

We have extended the equation of the model to the mixtures by simply applying the law of ideal gas mixtures and assuming that the mixture can be treated as a simple gas whose effective scattering length and effective polarizability are given by the contributions of the individual properties of the two species in the mixture, weighted by their relative abundance.

This extended model is able to describe with great accuracy the experimental results without any adjustable parameters and, thus, has great predictive power. For instance, this spectroscopic technique could be used as an alternative way to measure the scattering length of some gases such as, for instance, some highly polarizable gases such as CH3CN (Mikulski et al., 1997), methanol (Krebs and Lang, 1996), or ammonia (Krebs and Wantschik, 1980), which are not known to have equal accuracy as their dielectric constant is, instead of carrying out precision electron scattering experiments at very low energy.

The outcome of the present experiment could have some implications on liquefied noble gas detectors operated in the two-phase mode, such as for liquid Ar mixed with a small concentration of Xe (Kim et al., 2004; Neumeier et al., 2015a), because redshifted luminescence in the gas phase could help correlate the scintillation signal from the liquid. Additionally, the understanding of the processes leading to the NIR shift of the luminescence in the dense gas could also help shed light on the microscopic processes leading to scintillation in liquefied noble gases and/or their mixtures (Neumeier et al., 2015b; Szydagis et al., 2025).

Some puzzling questions remain unsolved. The most critical one is how the collisional broadening of the excimer band correlates with the properties of the individual gases. Although the full width at half length of the excimer band linearly increases with an increase in the gas density, thereby strongly indicating a collision-induced reduction of the excimer lifetime, nonetheless, it is not clear why the coefficient γ in Equation 1 is so large and why the reduction in the Xe concentrations diminishes the density-dependent broadening. For the latter effect, we have proposed the hypothesis of a possible quantum effect of the indistinguishability of identical particles, although the high temperature in the experiment indicates that it might hardly be the case (Borghesani and Carugno, 2008).

Another puzzling question is the effect of nitrogen on some of the Xe I atomic lines, especially at low nitrogen concentrations, as shown in Figure 9. Is their broadening due to the formation of red and blue satellites that are not resolved in our setup? Or is the apparent broadening due to an underlying broad continuum caused by the emission of a possible XeN2 exciplex? Further measurements at low (and accurately determined) nitrogen concentrations could help in understanding this phenomenon. Unfortunately, this remains an unsolved question so far.

Possible future developments of the experiment will be to pursue the possibility of increasing the gas densities to possibly bridge the gap with the liquid, in which similar NIR luminescence has been detected (Neumeier et al., 2014), and to investigate mixtures with different noble gases in order to test the validity of our heuristic model.

Data availability statement

The raw data supporting the conclusions of this article will be made available by the authors without undue reservation.

Author contributions

AFB: conceptualization, data curation, formal analysis, investigation, methodology, supervision, validation, visualization, writing – original draft, writing – review and editing, resources, and software. GC: conceptualization, investigation, methodology, resources, supervision, writing – review and editing, and project administration. FC: conceptualization, investigation, writing – review and editing, formal analysis, data curation, methodology, and validation, and visualization.

Funding

The author(s) declare that no financial support was received for the research and/or publication of this article.

Acknowledgments

The authors acknowledge useful discussion with Prof. D. Iannuzzi of Vrije Universiteit Amsterdam (The Netherlands). They also gratefully acknowledge technical assistance by G. Galeazzi, E. Berto, and G. Galet.

Conflict of interest

The authors declare that the research was conducted in the absence of any commercial or financial relationships that could be construed as a potential conflict of interest.

The author(s) declared that they were an editorial board member of Frontiers at the time of submission. This had no impact on the peer review process and the final decision.

Generative AI statement

The authors declare that no Generative AI was used in the creation of this manuscript.

Publisher’s note

All claims expressed in this article are solely those of the authors and do not necessarily represent those of their affiliated organizations, or those of the publisher, the editors and the reviewers. Any product that may be evaluated in this article, or claim that may be made by its manufacturer, is not guaranteed or endorsed by the publisher.

Footnotes

1https://webbook.nist.gov/chemistry/fluid/

References

Aalbers, J., AbdusSalam, S. S., Abe, K., Aerne, V., Agostini, F., Ahmed Maouloud, S., et al. (2022). A next-generation liquid xenon observatory for dark matter and neutrino physics. J. Phys. G Nucl. Part. Phys. 50, 013001. doi:10.1088/1361-6471/ac841a

CrossRef Full Text | Google Scholar

Álvarez, V., Borges, F. I. G., Cárcel, S., Cebrián, S., Cervera, A., Conde, C. A. N., et al. (2013). Ionization and scintillation response of high-pressure xenon gas to alpha particles. JINST 8, P05025. doi:10.1088/1748-0221/8/05/p05025

CrossRef Full Text | Google Scholar

Anton, G., Badhrees, I., Barbeau, P. S., Beck, D., Belov, V., Bhatta, T., et al. (2020). Measurement of the scintillation and ionization response of liquid xenon at mev energies in the exo-200 experiment. Phys. Rev. C 101, 065501. doi:10.1103/PhysRevC.101.065501

CrossRef Full Text | Google Scholar

Arai, S., and Firestone, R. F. (1969). Evidence for the formation of neutral rare-gas molecules by electron-beam Pulses. J. Chem. Phys. 50, 4575–4589. doi:10.1063/1.1670934

CrossRef Full Text | Google Scholar

Atkins, P., and Friedman, R. (2005). Molecular quantum Mechanics. Oxford: Oxford University Press.

CrossRef Full Text | Google Scholar

Barcellan, L., Berto, E., Carugno, G., Galet, G., Galeazzi, G., and Borghesani, A. F. (2011). A battery-operated, stabilized, high-energy pulsed electron gun for the production of rare gas excimers. Rev. Sci. Instrum. 82, 095103–095107. doi:10.1063/1.3636078

PubMed Abstract | CrossRef Full Text | Google Scholar

Bartels, A. (1975). Density dependence of electron drift velocities in helium and hydrogen at 77.6 K. Appl. Phys. 8, 59–64. doi:10.1007/BF00883671

CrossRef Full Text | Google Scholar

Belogurov, S., Bressi, G., Carugno, G., Conti, E., Iannuzzi, D., and Meneguzzo, A. (2000). Measurement of the light yield of infrared scintillation in xenon gas. Nucl. Instrum. Methods Phys. Res. Sect. A Accel. Spectrom. Detect. Assoc. Equip. 452, 167–169. doi:10.1016/S0168-9002(00)00358-2

CrossRef Full Text | Google Scholar

Borghesani, A., Carugno, G., and Santini, M. (1991). Experimental determination of the conduction band of excess electrons in liquid Ar. IEEE Trans. Elect. Insul. 26, 615–622. doi:10.1109/14.83680

CrossRef Full Text | Google Scholar

Borghesani, A. F. (2007). Electrons and ions in liquid Helium, International Series of Monographs on physics, 137. Oxford: Oxford University Press.

Google Scholar

Borghesani, A. F. (2020). Resonant low-energy electron attachment to O2 impurities in dense neon gas. Plasma Sources Sci. Technol. 29, 035024. doi:10.1088/1361-6595/ab708a

CrossRef Full Text | Google Scholar

Borghesani, A. F. (2021). Accurate electron drift mobility measurements in moderately dense helium gas at several temperatures. Atoms 9, 52–19. doi:10.3390/atoms9030052

CrossRef Full Text | Google Scholar

Borghesani, A. F., Bressi, G., Carugno, G., Conti, E., and Iannuzzi, D. (2001). Infrared fluorescence of Xe2 molecules in electron/proton beam excited pure Xe gas and in an Ar/Xe gas mixture. J. Chem. Phys. 115, 6042–6050. doi:10.1063/1.1398307

CrossRef Full Text | Google Scholar

Borghesani, A. F., Bruschi, L., Santini, M., and Torzo, G. (1988). Electron mobility in neon at high densities. Phys. Rev. A 37, 4828–4835. doi:10.1103/PhysRevA.37.4828

PubMed Abstract | CrossRef Full Text | Google Scholar

Borghesani, A. F., and Carugno, G. (2008). Dielectric screening–, multiple scattering–, and quantum indistinguishability effects in the IR emission spectrum of Xe2 excimers in dense Xe gas. doi:10.48550/arXiv.0802.3602

CrossRef Full Text | Google Scholar

Borghesani, A. F., Carugno, G., Iannuzzi, D., and Mogentale, I. (2005). Environmental influence on the IR fluorescence of Xe2* molecules in electron beam excited Ar–Xe mixture at high density. Eur. Phys. J. D. 35, 299–306. doi:10.1140/epjd/e2005-00077-9

CrossRef Full Text | Google Scholar

Borghesani, A. F., Carugno, G., and Mogentale, I. (2007a). Infrared emission spectrum and potentials of 0+u and 0+g states of Xe2 excimers produced by electron impact. J. Phys. B Atomic, Mol. Opt. Phys. 40, 4551–4560. doi:10.1088/0953-4075/40/24/001

CrossRef Full Text | Google Scholar

Borghesani, A. F., Carugno, G., and Mogentale, I. (2007b). Low- and high-density features of IR luminescence of Xe2 excimers produced by electron impact. Phys. Scr. 76, C84–C89. doi:10.1088/0031-8949/76/3/N13

CrossRef Full Text | Google Scholar

Borghesani, A. F., Santini, M., and Lamp, P. (1992). Excess electron mobility in high-density argon gas. Phys. Rev. A 46, 7902–7909. doi:10.1103/PhysRevA.46.7902

PubMed Abstract | CrossRef Full Text | Google Scholar

Carugno, G. (1998). Infrared emission in gaseous media induced by ionizing particles and by drifting electrons. Nucl. Instrum. Methods Phys. Res. Sect. A Accel. Spectrom. Detect. Assoc. Equip. 419, 617–620. doi:10.1016/S0168-9002(98)00840-7

CrossRef Full Text | Google Scholar

Castex, M. C. (1981). Experimental determination of the lowest excited Xe2 molecular states from VUV absorption measurements. J. Chem. Phys. 74, 759–771. doi:10.1063/1.441177

CrossRef Full Text | Google Scholar

Chang, E. S. (1981). Modified effective-range theory for electron scattering from molecules. J. Phys. B Atomic Mol. Phys. 14, 893–901. doi:10.1088/0022-3700/14/5/023

CrossRef Full Text | Google Scholar

Dutuit, O., Gutcheck, R. A., and Calvé, J. L. (1978). Spectral and kinetic studies of the second continuum fluorescence of xenon excited by synchrotron radiation. Chem. Phys. Lett. 58, 66–72. doi:10.1016/0009-2614(78)80318-2

CrossRef Full Text | Google Scholar

Efthimiopoulos, T., Zouridis, D., and Ulrich, A. (1997). Excimer emission spectra of rare gas mixtures using either a supersonic expansion or a heavy-ion-beam excitation. J. Phys. D. Appl. Phys. 30, 1746–1754. doi:10.1088/0022-3727/30/12/010

CrossRef Full Text | Google Scholar

Ermler, W. C., Lee, Y. S., Pitzer, K. S., and Winter, N. W. (1978). Ab initio effective core potentials including relativistic effects. II. Potential energy curves for Xe2. J. Chem. Phys. 69, 976–983. doi:10.1063/1.436650

CrossRef Full Text | Google Scholar

Fermi, E. (1934). Sopra lo spostamento per pressione delle righe elevate delle serie spettrali. Il Nuovo Cimento 11, 157–166. doi:10.1007/bf02959829

CrossRef Full Text | Google Scholar

Gasiorowicz, S. (1974). Quantum physics. New York: Wiley.

Google Scholar

Gómez Cadenas, J. J., Álvarez, V., Borges, F. I. G., Cárcel, S., Castel, J., Cebrián, S., et al. (2014). Present Status and future Perspectives of the NEXT experiment. Adv. High. Energy Phys. 2014, 907067/1–22. doi:10.1155/2014/907067

CrossRef Full Text | Google Scholar

Gornik, W., Kindt, S., Matthias, E., and Schmidt, D. (1981). Two-photon excitation of xenon atoms and dimers in the energy region of the 5p5-6p configuration. J. Chem. Phys. 75, 68–74. doi:10.1063/1.441856

CrossRef Full Text | Google Scholar

Guggenheim, E. A. (1966). Thermodynamics. Amsterdam: North-Holland.

Google Scholar

Hammann, R., Böse, K., Hötzsch, L., Jörg, F., and Marrodán Undagoitia, T. (2024). Investigating the slow component of the infrared scintillation time response in gaseous xenon. JINST 19, C02080/1–7. doi:10.1088/1748-0221/19/02/C02080

CrossRef Full Text | Google Scholar

Henck, R., and Coche, A. (1967). Studies on noble gas Scintillators. IEEE Trans. Nucl. Sci. 14, 478–486. doi:10.1109/TNS.1967.4324458

CrossRef Full Text | Google Scholar

Herman, R., Wallis, M. C., and Wallis, R. F. (1956). Intensities of the R1 and R2 bands in KCl crystals. Phys. Rev. 103, 87–93. doi:10.1103/PhysRev.103.87

CrossRef Full Text | Google Scholar

Huang, S. S. S., and Freeman, G. R. (1978). Electron mobilities in gaseous, critical, and liquid xenon: density, electric field, and temperature effects: Quasilocalization. J. Chem. Phys. 68, 1355–1362. doi:10.1063/1.435954

CrossRef Full Text | Google Scholar

Huang, S. S. S., and Freeman, G. R. (1981). Electron transport in gaseous and liquid argon: effects of density and temperature. Phys. Rev. A 24, 714–724. doi:10.1103/PhysRevA.24.714

CrossRef Full Text | Google Scholar

Hurst, G. S., Bortner, T. E., and Strickler, T. D. (1969). Proton excitation of the argon atom. Phys. Rev. 178, 4–10. doi:10.1103/PhysRev.178.4

CrossRef Full Text | Google Scholar

Jonin, C., and Spiegelmann, F. (2002). Pseudopotential hole–particle formalism for excitations in xenon molecules and clusters. II. The electronic structure of Xe2*. J. Chem. Phys. 117, 3059–3073. doi:10.1063/1.1491400

CrossRef Full Text | Google Scholar

Keto, J. W., Cai, H., Kykta, M., Lei, C., Möller, T., and Zimmerer, G. (1997). Two-photon spectroscopy of xenon dimers in supersonic jets. J. Chem. Phys. 107, 6080–6093. doi:10.1063/1.474276

CrossRef Full Text | Google Scholar

Khasenov, M. (2016). Emission spectra of noble gases and their mixtures under ion beam excitation. Laser Part. Beams 34, 655–662. doi:10.1017/s0263034616000616

CrossRef Full Text | Google Scholar

Kim, J., Dardin, S., Kadel, R., Kadyk, J., Peskov, V., and Wenzel, W. (2004). Electron avalanches in liquid argon mixtures. Nucl. Instrum. Methods Phys. Res. Sect. A Accel. Spectrom. Detect. Assoc. Equip. 534, 376–396. doi:10.1016/j.nima.2004.06.136

CrossRef Full Text | Google Scholar

Knoll, G. F. (1989). Radiation detectors and measurements. New York: Wiley.

Google Scholar

Koeckhoven, S. M., Burma, W. J., and de Lange, C. A. (1995). A resonance enhanced multiphoton ionization study of the gerade excited states of Xe2 with a Xe + Xe 6s[3/2]1 dissociation limit. J. Chem. Phys. 102, 4020–4026. doi:10.1063/1.4366510

CrossRef Full Text | Google Scholar

Koehler, H. A., Ferderber, L. J., Redhead, D. L., and Ebert, P. J. (1974). Vacuum-ultraviolet emission from high-pressure xenon and argon excited by high-current relativistic electron beams. Phys. Rev. A 9, 768–781. doi:10.1103/PhysRevA.9.768

CrossRef Full Text | Google Scholar

Krebs, P., and Lang, U. (1996). Electron mobility and multiple scattering effects in dense methanol gas. J. Phys. Chem. 100, 10482–10489. doi:10.1021/jp952470z

CrossRef Full Text | Google Scholar

Krebs, P., and Wantschik, M. (1980). Mobility of electrons in ammonia vapor at various densities. J. Phys. Chem. 84, 1155–1160. doi:10.1021/j100447a016

CrossRef Full Text | Google Scholar

Krstic, P. S., and Schultz, D. R. (1999). Elastic scattering and charge transfer in slow collisions: isotopes of H and H+ colliding with isotopes of H and with He. J. Phys. B Atomic, Mol. Opt. Phys. 32, 3485–3509. doi:10.1088/0953-4075/32/14/317

CrossRef Full Text | Google Scholar

Leardini, S., García, E. S., Amedo, P., Saa-Hernández, A., González-Díaz, D., Santorelli, R., et al. (2022). Time and band-resolved scintillation in time projection chambers based on gaseous xenon. Eur. Phys. J. C 82, 425/1–13. doi:10.1140/epjc/s10052-022-10385-y

CrossRef Full Text | Google Scholar

Lorents, D. C. (1976). The physics of electron beam excited rare gases at high densities. Phys. B+C 82, 19–26. doi:10.1016/0378-4363(76)90265-5

CrossRef Full Text | Google Scholar

Maitland, G. C., Rigby, M., Smith, E. B., and Wakeham, W. A. (1981). “Intermolecular Forces. Their Origin and determination,” in International Series of Monographs on chemistry. Oxford: Clarendon Press.

Google Scholar

McEachran, R. P., and Stauffer, A. D. (2014). Momentum transfer cross sections for the heavy noble gases. Eur. Phys. J. D. 68, 153–158. doi:10.1140/epjd/e2014-50166-7

CrossRef Full Text | Google Scholar

Messing, I., Raz, B., and Jortner, J. (1977a). Experimental evidence for Wannier impurity states in doped rare-gas fluids. Chem. Phys. 23, 23–37. doi:10.1016/0301-0104(77)89040-X

CrossRef Full Text | Google Scholar

Messing, I., Raz, B., and Jortner, J. (1977b). Solvent perturbations of extravalence excitations of atomic xe by rare gases at high pressures. J. Chem. Phys. 66, 4577–4586. doi:10.1063/1.433714

CrossRef Full Text | Google Scholar

Mikulski, P., Klahn, T., and Krebs, P. (1997). Excess electron mobility in low density CH3CN gas: mShort-lived dipole-bound electron ground states as precursors of localized electron states. Phys. Rev. A 55, 369–377. doi:10.1103/PhysRevA.55.369

CrossRef Full Text | Google Scholar

Millet, P., Birot, A., Brunet, H., Galy, J., Pons-Germain, B., and Teyssier, J. L. (1978). Time resolved study of the UV and near UV continuums of xenon. J. Chem. Phys. 69, 92–97. doi:10.1063/1.436349

CrossRef Full Text | Google Scholar

Mimura, M., Kobayashi, S., Masuyama, N., Miyajima, M., and Hasebe, N. (2009). Average numbers of scintillation photons and electrons produced by an alpha particle in high-density xenon gas. Jpn. J. Appl. Phys. 48, 076501. doi:10.1143/JJAP.48.076501

CrossRef Full Text | Google Scholar

Mogentale, I. (2006). Luminescence of Xe2 molecules in dense Xe gas. Padua, Italy: Università degli Studi di Padova.

Google Scholar

Moutard, P., Laporte, P., Subtil, J. L., Damany, N., and Damany, H. (1988). Pressure effects on kinetics and decay processes in xenon after selective photoexcitation. J. Chem. Phys. 88, 7485–7500. doi:10.1063/1.454313

CrossRef Full Text | Google Scholar

Mulliken, R. S. (1970). Potential curves of diatomic rare-gas molecules and their ions, with particular reference to Xe2. J. Chem. Phys. 52, 5170–5180. doi:10.1063/1.1672756

CrossRef Full Text | Google Scholar

Neumeier, A., Dandl, T., Heindl, T., Himpsl, A., Hagn, H., Hofmann, M., et al. (2014). Intense infrared scintillation of liquid Ar-Xe mixtures. Eur. Phys. Lett. 106, 32001/1–5. doi:10.1209/0295-5075/106/32001

CrossRef Full Text | Google Scholar

Neumeier, A., Dandl, T., Heindl, T., Himpsl, A., Oberauer, L., Potzel, W., et al. (2015a). Intense vacuum ultraviolet and infrared scintillation of liquid Ar-Xe mixtures. EPL Europhys. Lett. 109, 12001–12006. doi:10.1209/0295-5075/109/12001

CrossRef Full Text | Google Scholar

Neumeier, A., Dandl, T., Himpsl, A., Oberauer, L., Potzel, W., Schönert, S., et al. (2015b). Attenuation of vacuum ultraviolet light in pure and xenon-doped liquid argon —an approach to an assignment of the near-infrared emission from the mixture. EPL Europhys. Lett. 111, 12001–12006. doi:10.1209/0295-5075/111/12001

CrossRef Full Text | Google Scholar

Nowak, G., Frey, L., and Fricke, J. (1985). Ar2*, Kr2* and Xe2* excimer formation from metastable and alpha -particle impact on solid rare-gas layers. J. Phys. B Atomic Mol. Phys. 18, 2851–2860. doi:10.1088/0022-3700/18/14/010

CrossRef Full Text | Google Scholar

Piotter, M., Cichon, D., Hammann, R., Jörg, F., Hötzsch, L., and Marrodán Undagoitia, T. (2023). First time-resolved measurement of infrared scintillation light in gaseous xenon. Eur. Phys. J. C 83, 482. doi:10.1140/epjc/s10052-023-11618-4

CrossRef Full Text | Google Scholar

Raymond, T. D., Böwering, N., Kuo, C. Y., and Keto, J. W. (1984). Two–photon laser spectroscopy of xenon collision pairs. Phys. Rev. A 29, 721–734. doi:10.1103/PhysRevA.29.721

CrossRef Full Text | Google Scholar

Reininger, R., Asaf, U., Steinberger, I. T., and Basak, S. (1983). Relationship between the energy V0 of the quasi-free-electron and its mobility in fluid argon, krypton, and xenon. Phys. Rev. B 28, 4426–4432. doi:10.1103/PhysRevB.28.4426

CrossRef Full Text | Google Scholar

Salamero, Y., Birot, A., Brunet, H., Galy, J., and Millet, P. (1984). Kinetic study of the VUV xenon emissions using selective multiphoton excitation. J. Chem. Phys. 80, 4774–4780. doi:10.1063/1.446550

CrossRef Full Text | Google Scholar

Song, M. Y., Cho, H., Karwasz, G. P., Kokoouline, V., and Tennyson, J. (2023). Electron scattering on molecular nitrogen: common gas, uncommon cross sections. Eur. Phys. J. D 77, 105–108. doi:10.1140/epjd/s10053-023-00687-5

CrossRef Full Text | Google Scholar

Suzuki, M., and Kubota, S. (1979). Mechanism of proportional scintillation in argon, krypton and xenon. Nucl. Instrum. Methods 164, 197–199. doi:10.1016/0029-554X(79)90453-1

CrossRef Full Text | Google Scholar

Szydagis, M., Balajthy, J., Block, G. A., Brodsky, J. P., Brown, E., Cutter, J. E., et al. (2025). A review of NEST models for liquid xenon and an exhaustive comparison with other approaches. Front. Detect. Sci. Technol. 2. doi:10.3389/fdest.2024.1480975

CrossRef Full Text | Google Scholar

Tanaka, Y., and Zelikoff, M. (1954). Continuous emission spectrum of xenon in the vacuum ultraviolet region. J. Opt. Soc. Am. 44, 254_1–255. doi:10.1364/JOSA.44.0254_1

CrossRef Full Text | Google Scholar

Ulrich, A. (2012). Light emission from particle beam induced plasma: an overview. Laser Part. Beams 30, 199–205. doi:10.1017/S0263034611000838

CrossRef Full Text | Google Scholar

Wada, T., and Freeman, G. R. (1981). Temperature, density, and electric-field effects on electron mobility in nitrogen vapor. Phys. Rev. A 24, 1066–1076. doi:10.1103/PhysRevA.24.1066

CrossRef Full Text | Google Scholar

Wenck, H. D., Hasnain, S. S., Nikitin, M. M., Sommer, K., Zimmerer, G. F. K., and Haaks, D. (1979). Time and spectrally resolved fluorescence of Xe2 molecules excited with synchrotron radiation. Chem. Phys. Lett. 66, 138–143. doi:10.1016/0009-2614(79)80384-X

CrossRef Full Text | Google Scholar

Wojciechowski, K., and Foryś, M. (1999). The mechanism of three-body process of energy transfer from excited xenon atoms to molecules. Radiat. Phys. Chem. 54, 1–10. doi:10.1016/S0969-806X(98)00217-5

CrossRef Full Text | Google Scholar

Zecca, A., Karwasz, G. P., and Brusa, R. S. (1996). One century of experiments on electron-atom and molecule scattering: a critical review of integral cross-sections. La Riv. del Nuovo Cimento 19, 1–146. doi:10.1007/bf02742990

CrossRef Full Text | Google Scholar

Zhang, W., Lin, H., Liu, Y., Han, K., Ni, K., Wang, S., et al. (2023). Status and prospects of the PandaX-III experiment. J. Instrum. 18, C12001. doi:10.1088/1748-0221/18/12/C12001

CrossRef Full Text | Google Scholar

Keywords: Xe excimers, infrared cathodoluminescence, density-induced redshift, collision broadening, dense gas mixtures

Citation: Borghesani AF, Carugno G and Chiossi F (2025) Near-infrared cathodoluminescence of Xe2 excimers in dense gaseous mixtures. Front. Detect. Sci. Technol. 3:1580297. doi: 10.3389/fdest.2025.1580297

Received: 20 February 2025; Accepted: 16 April 2025;
Published: 19 May 2025.

Edited by:

Saša Dujko, Institute of Physics, University of Belgrade, Serbia

Reviewed by:

Robert Hammann, Max Planck Institute for Nuclear Physics, Germany
Grzegorz Karwasz, Nicolaus Copernicus University in Toruń, Poland

Copyright © 2025 Borghesani, Carugno and Chiossi. This is an open-access article distributed under the terms of the Creative Commons Attribution License (CC BY). The use, distribution or reproduction in other forums is permitted, provided the original author(s) and the copyright owner(s) are credited and that the original publication in this journal is cited, in accordance with accepted academic practice. No use, distribution or reproduction is permitted which does not comply with these terms.

*Correspondence: A. F. Borghesani, YXJtYW5kb2ZyYW5jZXNjby5ib3JnaGVzYW5pQHVuaXBkLml0

Present address: F. Chiossi, Chimie ParisTech, PSL University, CNRS, Institut de Recherche de Chimie, Paris, France

Disclaimer: All claims expressed in this article are solely those of the authors and do not necessarily represent those of their affiliated organizations, or those of the publisher, the editors and the reviewers. Any product that may be evaluated in this article or claim that may be made by its manufacturer is not guaranteed or endorsed by the publisher.