 C. A. O. Henriques1*
 L. M. P. Fernandes1P. A. O. C. Silva1D. González-Díaz2
 C. D. R. Azevedo3J. M. F. dos Santos1C. M. B. Monteiro1
- 1LIBPhys, LA-REAL, Physics Department, University of Coimbra, Coimbra, Portugal
- 2Instituto Gallego de Física de Altas Energías, Universidade de Santiago de Compostela, Santiago de Compostela, Spain
- 3I3N, Physics Department, University of Aveiro, Aveiro, Portugal
We have developed a comprehensive methodology to measure electron transport and electroluminescence parameters in xenon-based gaseous detectors using photosensor waveform analysis. Our approach integrates measurements of the Fano factor, electroluminescence fluctuations (Q-factor), scintillation probability, electron drift velocity, diffusion, and attachment coefficients into a unified experimental framework, with particular focus on the effects of molecular additives. Using a driftless Gas Proportional Scintillation Counter and advanced event-depth analysis, we achieved an energy resolution of (7.42
1 Introduction
Gaseous xenon time projection chambers (TPCs) have become increasingly important for rare-event detection experiments, including searches for neutrinoless double-beta decay, double-electron capture, and directional dark matter (Novella et al., 2023; Yan et al., 2024; Bo et al., 2025; Aprile et al., 2019; Aprile et al., 2025; Nugren et al., 2013; Adams et al., 2021). Compared to liquid xenon (Aprile et al., 2025; Aalbers et al., 2023; Cui et al., 2017; Albert et al., 2018; Gando et al., 2016; Abe et al., 2016), gaseous xenon TPCs offer superior energy resolution and enable topological reconstruction of event signatures, capabilities that have been demonstrated for both double beta decay and double electron capture detection (Luscher et al., 1998; Ferrario et al., 2016; Gavrilyuk et al., 2015). Such topological reconstruction is not viable in liquid xenon, where the extremely compact primary ionization trail prevents pattern-based event discrimination.
Optical TPCs using electroluminescence (EL) amplification have emerged as particularly promising instruments. These detectors can achieve energy resolutions as low as 0.7% FWHM at 2.5 MeV (
Despite their advantages, gaseous xenon TPCs face a significant challenge: large electron diffusion, which degrades the detector’s ability to reconstruct event topologies. This diffusion results from inefficient energy loss during elastic collisions between electrons and xenon atoms (Renner et al., 2017). One promising approach to mitigate this problem is the addition of molecular gases (e.g.,
Historically, the addition of molecular species to noble gases was believed to dramatically reduce EL yield (Takahashi et al., 1983). The concern was that electrons would lose energy through collisions with molecular impurities before gaining sufficient energy from the electric field to excite xenon atoms, thus reducing photon production. Additional mechanisms for scintillation loss include excimer quenching, photo-absorption, and electron attachment (Azevedo et al., 2018). However, recent experimental studies with Xe-
To optimize xenon-based TPCs with molecular additives, several critical parameters must be carefully measured and balanced. First, as said, electron drift velocity and diffusion directly affect the TPC’s position resolution and constitute the primary motivation for molecular gas doping. Equally important is the scintillation probability (SP), defined as the ratio of detectable VUV photons to the number of excited xenon atoms. In pure xenon, this probability exceeds 97% (Azevedo et al., 2018). The SP remains largely independent of the electric field because the dominant atomic states in EL (
In this research, we present a comprehensive experimental methodology for measuring these fundamental parameters in gaseous xenon doped with molecular additives. Using a driftless Gaseous Proportional Scintillation Counter (dGPSC) and advanced waveform analysis techniques, we extract electron drift velocity, longitudinal electron diffusion, attachment coefficients, intrinsic energy resolution, and scintillation probability directly from electroluminescence signals. We validate our approach through comparison with both theoretical predictions and previous experimental results.
2 Experimental setup
The experimental setup comprises three main subsystems: (1) a gas system equipped with a Residual Gas Analyzer (RGA) for doping xenon with molecular species and measuring their concentrations in real time; (2) a driftless Gaseous Proportional Scintillation Counter (dGPSC) (Henriques et al., 2017; Henriques et al., 2019) for studying electroluminescence and electron drift parameters; and (3) a data acquisition system to record the detector’s photosensor waveforms.
2.1 Gas system
An RGA is a highly sensitive mass spectrometer commonly employed for monitoring contamination and detecting leaks in vacuum systems (Mao and Leck, 1987). Its operation is typically limited to a maximum pressure of
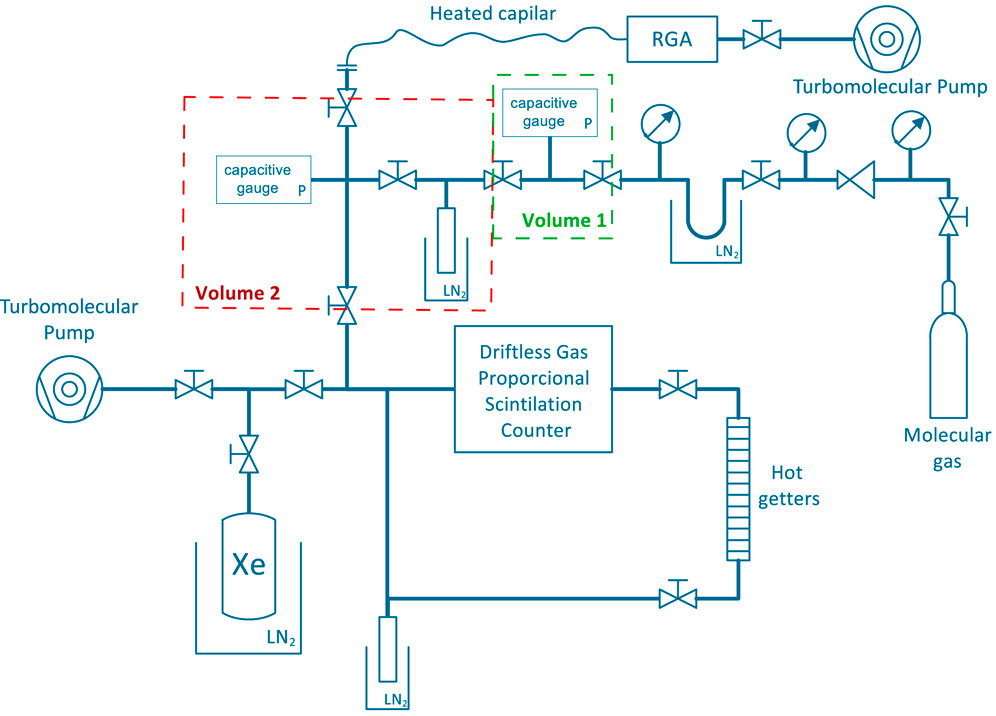
Figure 1. Schematic of the gas system used in this work, incorporating the dGPSC, the RGA, and the two calibration volumes.
Given the low concentrations of molecular gases used in this work (120–660 ppm), the RGA and capillary system require careful calibration for each additive. Calibration mixtures were prepared in two small volumes, each monitored by a capacitive pressure gauge. The concentration of molecular species is determined from the initial pressures of the molecular gas (in volume 1) and xenon (in volume 2), and the final pressure after combining the two volumes, based on the ideal gas law. The final pressure of these mixtures was set to 1.2 bar, consistent with the gas pressure during detector operation, to ensure the reliability of the RGA calibration. The purity of the detector filling gas is continuously maintained by circulation through hot getters (SAES St-707 (SAES, 2025)) in a closed loop by convection. This purification setup was extensively detailed and benchmarked in our previous work (Teixeira et al., 2025). For measurements with pure xenon, the getters are maintained at 250 °C to maximize purity; during electroluminescence measurements with mixtures, the temperature is reduced to approximately 100 °C to minimize additive absorption. Although the getters’ performance is not optimal at these lower temperatures, it remains acceptable. A slight reduction in the pure xenon EL yield (up to 7%) was observed compared to that obtained at 250 °C, after several days of operation.
2.2 The driftless GPSC
In contrast to a conventional GPSC (dos Santos et al., 2001), the driftless GPSC lacks a drift region, with radiation absorbed directly within the electroluminescence region (Simons and de Korte, 1989). This distinctive detector geometry is leveraged in this work to measure specific electron drift parameters that would otherwise remain inaccessible.
A simplified schematic of our dGPSC is presented in Figure 2. The 2.5-cm-thick EL region is defined by an aluminized Kapton radiation window (8 mm in diameter) mounted on a stainless-steel holder and by the PMT quartz window, which is vacuum-evaporated with a chromium grid (strips with a width of 100 μm, spacing of 1000 μm, and thickness of 80 nm) electrically connected to the photocathode pin. The PMT (model EMI D676QB, 52 mm in diameter, with a 45-mm effective photocathode diameter, multi-electron rise time of 4 ns, multi-electron FWHM of 6.5 ns, and electron transit time of 40 ns) is epoxied to a cylinder made from ceramic (Macor), which couples to the stainless-steel detector enclosure (approximately 10 cm in diameter) connected to the gas circulation tubing. This PMT model is sensitive to wavelengths ranging from 150 to 650 nm, thus covering the VUV second continuum of Xe electroluminescence (Fujii et al., 2015). The D676QB is a customized eight-dynode version of the 9266QB model, and its quantum efficiency can be found on the manufacturer’s website (Enterprises Limited, 2025). The electric field across the EL region is approximately uniform, with variations of less than 15% as determined from simulations within the studied electric field range (1.5–3.5 kV

Figure 2. Schematic of the driftless GPSC used in this work.
2.3 Data acquisition system
The photosensor output of a GPSC is typically amplified, shaped, and recorded using a charge-sensitive pre-amplifier, a shaping linear amplifier, and a Multi-Channel Analyzer. However, this data acquisition system fails to preserve the temporal information of the photosensor signal, which is essential for analyzing the dynamics of electron drift and scintillation production. Consequently, the PMT output was directly connected to an oscilloscope (WaveRunner 610Zi from LeCroy) with a sampling rate of 10 GS/s and an analog bandwidth (−3 dB) of 1 GHz, hence avoiding signal distortion introduced by the shaping stages of the pre-amplifier and linear amplifier.
The oscilloscope’s 50-
Figure 3 displays a typical PMT waveform recorded with 5.9-keV X-rays. The waveform amplitude increases over time as the solid angle subtended by the PMT window grows while the electron cloud (
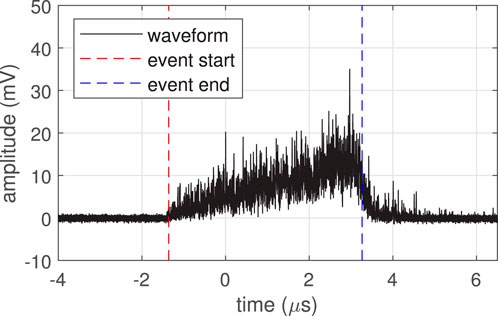
Figure 3. Typical PMT waveform obtained by irradiating the dGPSC with 5.9-keV X-rays (before applying the 20-point moving average).
A pre-processing algorithm was developed to discriminate background events (e.g., cosmic radiation) and waveforms with characteristics unsuitable for further analysis. This is particularly important for time-dependent measurements. For instance, a waveform containing two events would yield an anomalously long duration measurement. The discrimination algorithm rejects waveforms based on baseline cleanness, event duration, and pulse shape. Additionally, the oscilloscope baseline offset is measured at the start of each recorded waveform and corrected accordingly.
Waveforms were recorded using two different radioactive sources. For most measurements, we employed a 55Fe source, which produces characteristic X-rays at 5.9 keV (Mn K
3 Methods and results
3.1 X-ray penetration
Unlike conventional GPSCs, the response of a driftless detector exhibits a strong dependence on X-ray interaction depth. Since the number of EL photons is proportional to the electron drift distance, monoenergetic X-rays produce a pulse-height distribution with a characteristic left-sided tail when measured using standard data acquisition systems. As illustrated in Figure 4 (left), this distribution can be decomposed into multiple Gaussian functions, each corresponding to interactions at a specific depth, with amplitudes that follow the exponential X-ray absorption law. In gas mixtures where electron attachment occurs, the distribution may additionally develop a right-sided tail, as deeper events experience less electron loss.
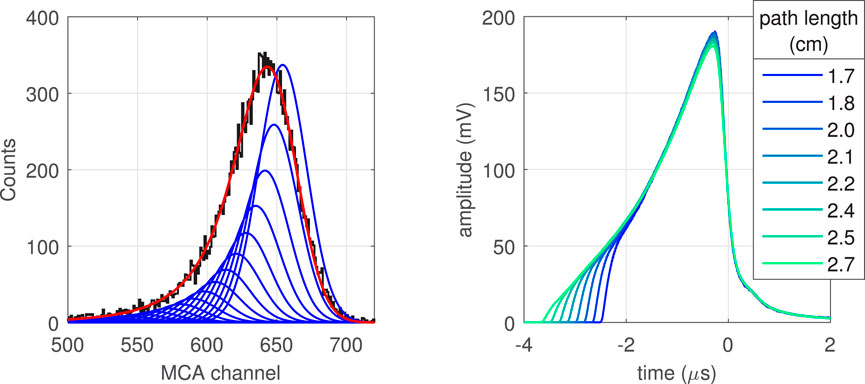
Figure 4. Depth-dependent response characteristics of the dGPSC: (Left) Pulse-height distribution acquired with 5.9-keV X-rays (black), showing the asymmetric shape typical of driftless detectors. The theoretical response function (red) is constructed as a superposition of Gaussian components (blue, amplitude scaling arbitrary), each representing interactions at a specific depth. (Right) Experimentally measured waveforms in pure xenon, averaged across events with similar drift path lengths.
Assuming constant electron drift velocity, the PMT waveform duration is directly proportional the electron drift path length. This relationship enables depth-specific analysis by grouping waveforms according to their duration. Figure 4 (right) shows averaged waveforms for different interaction depths. In pure xenon, where electron loss is negligible, shorter waveforms from deeper interactions maintain amplitude profiles consistent with longer ones from shallower depths. The characteristic shape of these waveforms is primarily determined by geometrical factors, particularly the varying solid angle subtended by the PMT as electrons drift through the anode.
3.1.1 Drift path length distribution
The depth distribution of X-ray interactions can be quantitatively analyzed by plotting event frequency as a function of waveform duration. For each event, duration was measured between the 1%-rising edge and the 50%-falling edge thresholds relative to waveform amplitude. Prior to this measurement, a moving average filter was applied to waveforms to reduce high-frequency noise. Using this method, our definition of event duration encompasses the interval from the initiation of the scintillation process to approximately the moment when the electron cloud’s centroid reaches the anode. These two limits are also illustrated in Figure 3.
Figure 5 presents an example distribution of event durations obtained with 5.9-keV X-rays. The data exhibit the expected exponential absorption law of X-rays in matter, with notable deviations observed only for longer-duration waveforms (leading to apparent drift path lengths exceeding the detector’s physical length of 2.5 cm). These deviations from theoretical predictions are attributed to two primary factors: (1) the weaker electric field near the detector window (12
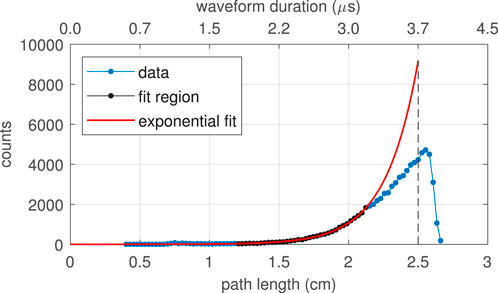
Figure 5. Histogram of event durations (blue and black points) and theoretical X-ray attenuation curve (red), used to compute the conversion factor between event duration (upper axis) and corresponding electron drift path length (bottom axis).
To convert event duration into mean electron drift path length, we first fit the event duration distribution with an exponential function over the range of approximately 1.2–2.2 cm, where the data closely follow an exponential trend. We then apply a scaling procedure to determine this conversion factor. Since the maximum physical drift path is 2.5 cm, measured events with apparent path lengths exceeding this limit were actually produced below the 2.5-cm threshold. Accordingly, the conversion factor is scaled such that the excess area (events measured beyond 2.5 cm) equals the deficit area (between the measured and fitted distributions below 2.5 cm). This ensures event count conservation and maps zero duration to zero drift path length (the PMT’s transit time spread,
The X-ray attenuation coefficient extracted from the exponential fit after conversion factor adjustment provides an independent validation of our calibration method. The experimental value (i.e., an attenuation length
With this calibration established, we can classify all PMT waveforms according to their electron drift path length. This classification method was used to create the color-coded waveform representation in Figure 4 (right).
3.1.2 Electroluminescence gain distribution
The PMT charge generated by each X-ray interaction can be obtained by integrating the PMT waveform from 100 ns before the start of the event to 150 ns after the event termination. We present these charge values in the natural units of the integral (mV
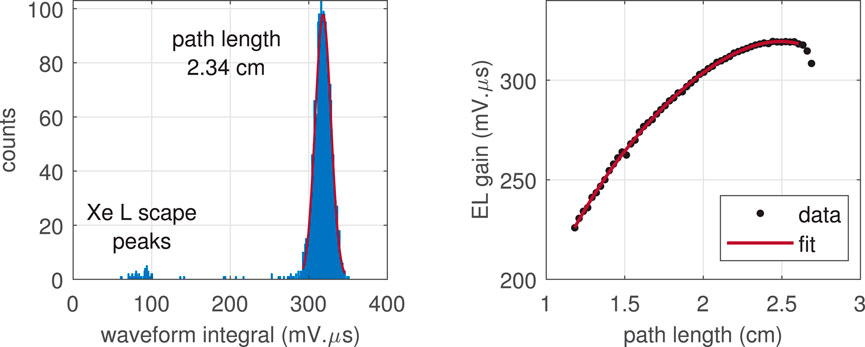
Figure 6. Depth-dependent EL gain characterization: (Left) Charge distribution for 5.9-keV X-rays interacting at a path length of approximately 2.34 cm, with the Gaussian fit centroid used to determine the relative EL gain. (Right) Variation of EL gain as a function of electron drift path length, fitted with a fourth-degree polynomial function (excluding the three longest path length data points due to edge effects).
The centroid of the 5.9-keV full-absorption peak in these distributions is directly proportional to the number of EL photons collected by the PMT for events at the corresponding depth. To characterize the EL gain dependence on interaction depth, we fitted Gaussian functions to the full-absorption peaks of charge distributions obtained at various path lengths. Figure 6 (right) shows the resulting relationship between the EL gain and drift path length, which is well-described by a fourth-degree polynomial function.
This depth-dependent gain variation is primarily governed by geometric factors, specifically the solid angle subtended by the PMT as electrons drift toward it, and remains independent of both X-ray energy and electric field, as confirmed in our experimental measurements (see chapters 5 and 6 in (Henriques, 2019)). The fitted polynomial function is then used to determine the appropriate EL gain correction applied to each waveform charge value, based on its measured drift path length.
3.2 Intrinsic energy resolution
Figure 7 presents the typical dGPSC energy spectrum obtained with 5.9-keV X-rays after applying depth EL gain corrections derived from the polynomial fit shown in Figure 6 (right). The spectrum was calibrated in energy using the 5.9-keV full-absorption peak and the two L-shell xenon escape peaks visible on the left side of the spectrum.
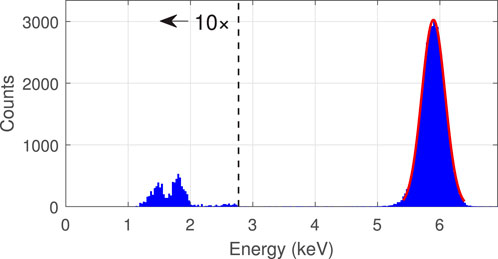
Figure 7. Energy spectrum for 5.9-keV X-rays after applying depth-dependent gain corrections, measured at an EL field of 3.2 kV
In contrast to the uncorrected energy spectrum obtained with the standard data acquisition system (Figure 4, left), the full-absorption peak now exhibits a symmetrical Gaussian profile. This correction procedure significantly improves the detector’s energy resolution from approximately 9%–7.4% FWHM, slightly exceeding the typical performance of standard GPSCs (dos Santos et al., 2001). This enhancement demonstrates the value of utilizing temporal information from the PMT signal to compensate for X-ray penetration effects in the detector response.
Various fluctuation sources contribute to the energy resolution
The first term under the square root represents the relative fluctuations in the number of ionization electrons produced by the interacting radiation, characterized by the Fano factor
The intrinsic energy resolution of a detector is defined as the statistical limit imposed by the gas physics, independent of detector geometry or photosensor characteristics, providing a valuable metric for assessing fluctuations in electroluminescence and primary charge production. To isolate the PMT contribution (the final term in Equation 1) from the overall energy resolution, we experimentally measured the dependence of PMT signal fluctuations on
In pure xenon, relative fluctuations in EL photon production (
Previous determinations of the Fano factor in noble gases have predominantly relied on the infinite light extrapolation technique (do Carmo et al., 2008), which is susceptible to systematic errors arising from the electric field dependence of gas-related fluctuations (Henriques, 2019).1 Our methodology eliminates this dependence, potentially yielding more accurate results.
The
3.3 Electron transport parameters
Since the dGPSC lacks a drift region, electron kinetic parameters critical for modeling large TPC experiments, such as electron drift velocity and diffusion, cannot be measured under typical drift electric fields. Nevertheless, a systematic study of these parameters at high electric fields is valuable for validating simulation models. Additionally, other drift parameters, such as electron attachment induced at high electric fields, are essential for understanding the fluctuations introduced by molecular additives in the EL signal.
3.3.1 Electron cloud simulation
The evolution of the electron cloud along the drift path can be described by the hydrodynamic approximation of the Boltzmann equation (Gonzalez-Diaz et al., 2018):
where
here,
By projecting the electron density (
Based on this simplification, we simulated the evolution of a Gaussian-distributed electron cloud along the drift axis to analyze the shape of PMT waveforms. Our simulation incorporated the solid angle subtended by the PMT window and the exponential decay rate of the xenon second continuum, which we assumed to be 100 ns (Henriques et al., 2024). The radial charge distribution of the initial electron cloud was obtained from (Dias et al., 1993).
3.3.2 Electron drift velocity
Section 3.1 introduced a method to determine the conversion factor between the waveform duration and path length drifted by the electron cloud. However, calculating the electron drift velocity
Figure 8 presents the experimental
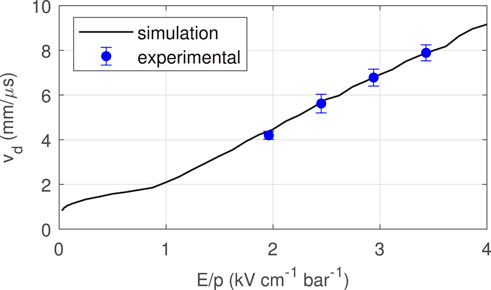
Figure 8. Electron drift velocity
3.3.3 Longitudinal electron diffusion
To investigate the influence of longitudinal electron diffusion on detector response, we employed the electron cloud simulation detailed in Section 3.3.1. Figure 9 presents a comparison between simulated (left) and experimental (right) PMT waveform trailing edges across various drift path lengths. As shown in simulated waveforms, the effect of longitudinal diffusion is particularly noticeable near the maximum amplitude and in the falling edge. For longer path lengths (red curves), the electron cloud becomes more elongated due to diffusion, resulting in longer fall times and lower waveform maximum amplitudes. Simulation results are closely matched by our experimental observations, confirming that the electron cloud expands longitudinally as it drifts through the EL region. This relationship between waveform fall time and drift path length provides a robust method to quantify the longitudinal electron diffusion coefficient from experimental waveforms.
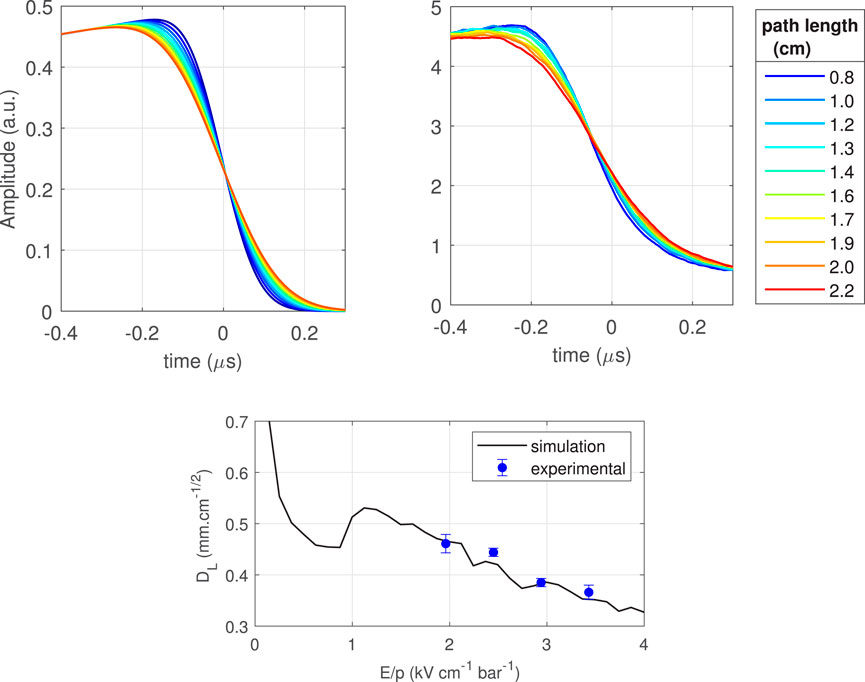
Figure 9. Longitudinal electron diffusion: (Top) Simulated (left) and experimental (right) PMT waveform trailing edges for various drift path lengths, showing longer fall times with increasing path length due to diffusion. (Bottom) Measured diffusion coefficient
The majority of afterpulsing in our PMT occurs within the first 900 ns after the emission of the photoelectron. Therefore, the afterpulsing effect on waveform trailing edges remains constant across different drift path lengths, provided waveforms are not shorter than 900 ns. Consequently, while the absolute fall time values are influenced by both afterpulsing and the initial electron cloud spread, only longitudinal diffusion determines how fall time varies with drift path length. As an additional precaution, we restricted our fall time measurements to the region between 90% and 60% of the waveform maximum amplitude, further reducing any residual afterpulsing contributions.
Using our electron cloud simulation framework (Section 3.3.1), we constructed a model that predicts waveform fall times as a function of drift path length. The model incorporates three key parameters: electron drift velocity, longitudinal diffusion coefficient, and the initial spatial spread of the electron cloud. To extract the diffusion coefficient from experimental data, we fitted this model to the measured fall times across various drift path lengths. To minimize the impact of high-frequency noise, average waveforms were used instead of individual waveforms in the fall time measurements. In this fitting procedure, we fixed the drift velocity to our experimentally determined values (Section 3.3.2) while allowing both the diffusion coefficient and initial electron cloud spread to vary as free parameters. To avoid the boundary effects, we excluded data points with path lengths exceeding 1.7 cm from our analysis.
The results of our longitudinal diffusion coefficient measurements are summarized in Figure 9 (bottom), which displays the parameter
3.3.4 Electron attachment
Electron attachment can be quantified by examining average PMT waveforms at different interaction depths, since the number of emitted EL photons is directly proportional to the surviving electron population. Figure 10 illustrates this effect by comparing waveforms from pure Xe and Xe-
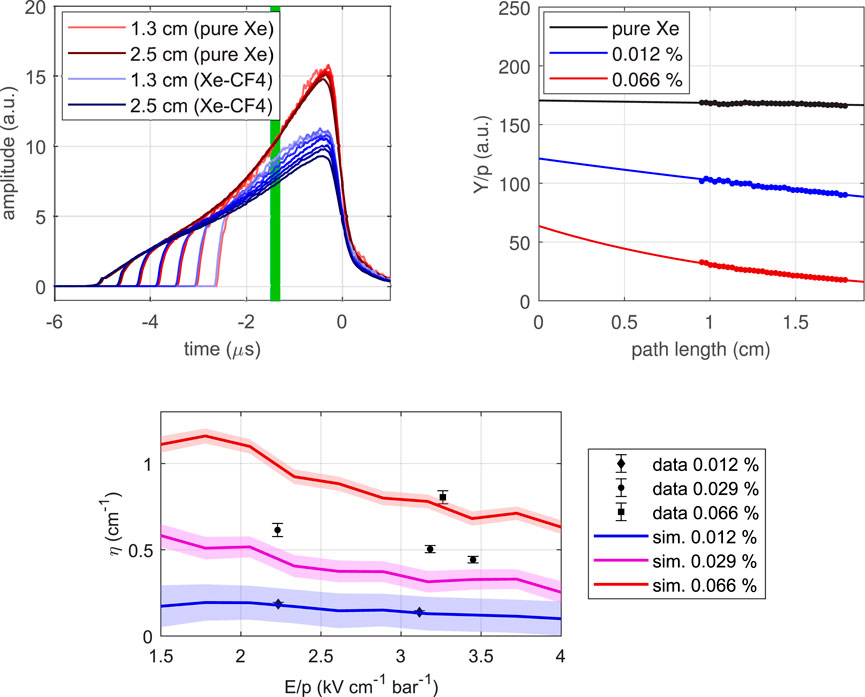
Figure 10. Electron attachment characterization: (Top left) Averaged waveforms from pure xenon and 0.012%
To determine electron attachment coefficients, we developed a method based on the EL signal analysis at a fixed reference position. For each average waveform, we integrated the signal when the electron cloud was between 6.5 and 7.5 mm from the anode. This integration measures the reduced EL yield
Figure 10 (bottom) shows the experimental attachment coefficients obtained with three Xe-
3.4 Electroluminescence parameters
The temporal information encoded in PMT waveforms enables precise measurement of several key electroluminescence parameters. Through analysis of waveforms produced under different drift distances and electric fields, we can quantify fundamental properties including the scintillation probability, EL yield, statistical fluctuations in the EL process, and the impact of electron attachment on detector performance.
3.4.1 Electron attachment impact on electroluminescence
When evaluating how electron attachment affects EL yield, we must first account for other molecular additive effects that simultaneously influence the signal. Processes such as quenching of atomic and dimer excited states and electron cooling also contribute to EL yield degradation. To isolate the effect of these other processes, we applied the method described in Section 3.3.4, where the EL yield at zero drift path length
The ratio between
Figure 11 presents our key experimental results quantifying electron attachment effects on electroluminescence, obtained with 5.9-keV X-rays for pure Xe and various Xe-
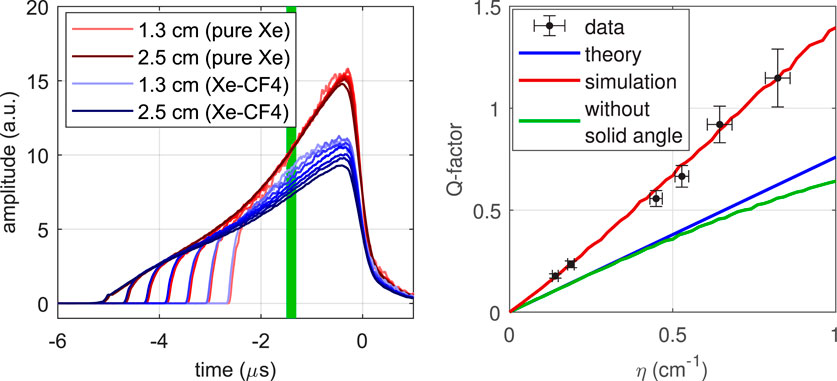
Figure 11. Experimental
For small attachment values, analytical theory predicts
The simulation follows individual electrons through the EL region, where each electron’s attachment position is generated according to an exponential probability distribution governed by the attachment coefficient. We integrate the photon yield along each electron’s trajectory, weighted by the solid angle subtended by the PMT from each position, until either attachment occurs or the electron reaches the anode. The simulation outputs both the mean detected photon yield and its statistical distribution, enabling direct calculation of
Our simulation results (also shown in Figure 11) demonstrate excellent agreement with experimental data, validating our understanding of the underlying physical processes. Importantly, the simulation revealed that detector geometry significantly influences attachment effects. The sharply increasing solid angle as electrons approach the PMT causes the
3.4.2 Scintillation probability
The electroluminescence yield in noble gases exhibits an approximately linear relationship with the reduced electric field, expressed as
Molecular additives influence this relationship through three distinct mechanisms: (1) electron cooling, which primarily affects the
Figure 12 presents both raw and attachment-compensated EL yield curves for two Xe-
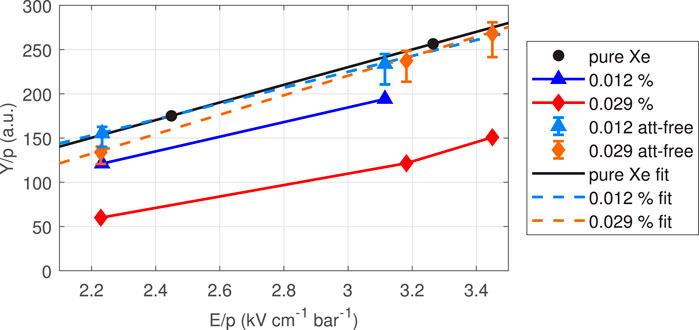
Figure 12. Raw and attachment-free EL yield curves for two Xe-
Linear regression analysis (also depicted in Figure 12) of these corrected yield curves resulted in
3.4.3 Scintillation probabilities from historical data
Prior to developing the waveform-based methodology described in this paper, we conducted extensive studies on the effects of molecular additives (
As illustrated in Figure 4 (left), the detector pulse-height distribution can be parameterized by a sum of Gaussian functions, each corresponding to a particular X-ray interaction depth. Electron attachment affects both the EL yield and Q-factor (Figure 11), causing distinctive distortions in the shape of the pulse-height distribution. These attachment-induced changes to the centroids (Figure 6) and sigma values of the Gaussian components can be accessed through the simulation framework described in Section 3.4.1. Using this approach, we can construct a fit function with the attachment coefficient being left as a free parameter. By fitting this model to the experimental pulse-height distributions, the EL yield, energy resolution and attachment coefficient can be obtained. A more detailed description of this methodology can be found in (Henriques, 2019; Henriques et al., 2019).
Using these roughly estimated attachment coefficients, we applied appropriate corrections to the previously measured EL yield curves using the simulated relationship between
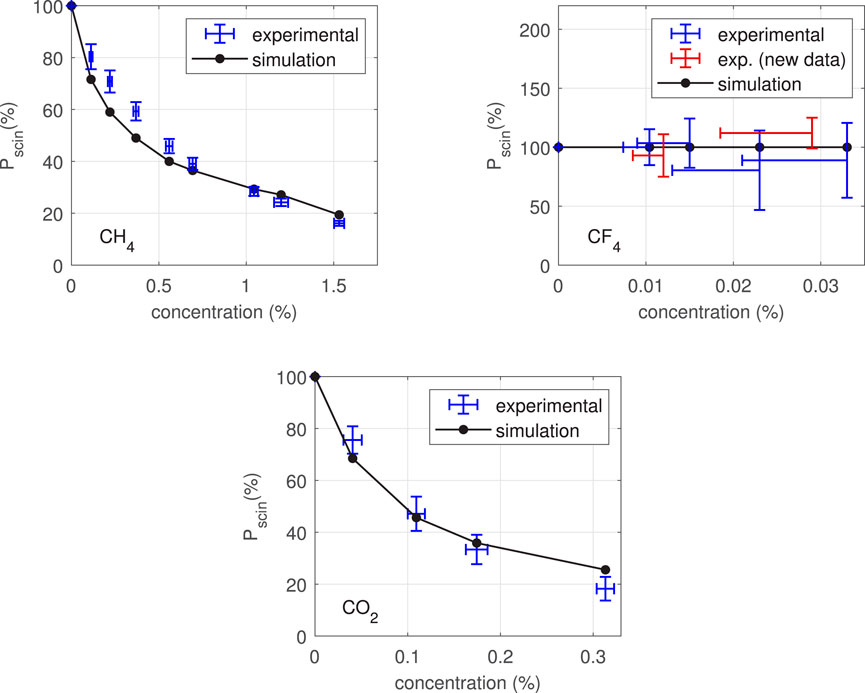
Figure 13. Scintillation probabilities obtained from the reanalysis of previous experimental data: Xe-
The uncertainty analysis reveals that for
The results confirm our theoretical expectations: quenching of excited xenon states is substantial in both
4 Conclusion
This work establishes a comprehensive experimental framework to measure electron transport and electroluminescence parameters in xenon and xenon-molecular mixtures using photosensor waveform analysis. This approach provides detailed understanding of the impact of molecular additives on noble gas detector performance, enabling position resolution optimizations in various applications.
We extensively studied the driftless Gas Proportional Scintillation Counter response, including X-ray penetration effects. This allowed energy spectrum reconstruction using temporal waveform information, achieving an exceptional energy resolution of (7.42
Electron drift velocity and longitudinal electron diffusion were measured in pure xenon across various electric fields. The excellent agreement between our experimental results and state-of-the-art simulation predictions validates our measurement methodology. This approach establishes a foundation for future investigations of how molecular additives affect these transport parameters, which are crucial for improving TPCs position resolution.
We developed a precise method to measure electron attachment coefficients by exploiting the X-ray penetration effect characteristic of dGPSC detectors. By analyzing waveforms from various interaction depths in Xe-
Finally, we developed a method to isolate electron attachment effects from other processes degrading electroluminescence yield, including the electron cooling effect. This approach enabled measurement of the scintillation probability in Xe-
The EL performance of these molecular species can be compared considering the concentrations required to achieve equivalent diffusion reduction (a 3-dimensional electron spread of 2.75 mm after 1 m drift):
Our results provide a comprehensive understanding of the impact of molecular additives on noble gas detector performance, offering valuable insights for future detector design and optimization. The experimental framework developed in this work can be readily applied to other gas-based detectors, enabling detailed studies of electron transport and electroluminescence properties in a wide range of experimental conditions.
Data availability statement
The datasets presented in this article are not readily available because it is confidential. Requests to access the datasets should be directed toaGVucmlxdWVzQHVjLnB0.
Author contributions
CH: Data curation, Funding acquisition, Validation, Resources, Conceptualization, Visualization, Project administration, Investigation, Supervision, Writing – review and editing, Methodology, Writing – original draft, Formal Analysis, Software. LF: Supervision, Writing – review and editing. PS: Software, Writing – review and editing. DG-D: Methodology, Writing – review and editing, Software. CA: Software, Writing – review and editing. JS: Project administration, Writing – review and editing. CM: Supervision, Writing – review and editing.
Funding
The author(s) declare that financial support was received for the research and/or publication of this article. This work is supported by FCT, I.P, Lisbon, through projects 2023.13742.PEX, PTDC/FIS-NUC/3933/2021, UIDB/FIS/04559/2020 (LIBPhys) and UIDP/FIS/04559/2020 (LIBPhys), funded through FCT by national funds and PRR, measure RE-C06-i06.m02.
Conflict of interest
The authors declare that the research was conducted in the absence of any commercial or financial relationships that could be construed as a potential conflict of interest.
The author(s) declared that they were an editorial board member of Frontiers, at the time of submission. This had no impact on the peer review process and the final decision.
Generative AI statement
The author(s) declare that no Generative AI was used in the creation of this manuscript.
Publisher’s note
All claims expressed in this article are solely those of the authors and do not necessarily represent those of their affiliated organizations, or those of the publisher, the editors and the reviewers. Any product that may be evaluated in this article, or claim that may be made by its manufacturer, is not guaranteed or endorsed by the publisher.
Footnotes
1At higher electric fields, EL gain fluctuations increase due to ionization processes, while at lower fields, electron-ion recombination can also affect these fluctuations. Consequently, the dependence of
References
Aalbers, J., Akerib, D., Akerlof, C., Al Musalhi, A., Alder, F., Alqahtani, A., et al. (2023). First dark matter search results from the LUX-ZEPLIN (LZ) experiment. Phys. Rev. Lett. 131, 041002. doi:10.1103/PhysRevLett.131.041002
Abe, K., Hiraide, K., Ichimura, K., Kishimoto, Y., Kobayashi, K., Kobayashi, M., et al. (2016). Search for two-neutrino double electron capture on 124Xe with the XMASS-I detector. Phys. Lett. B 759, 64–68. doi:10.1016/j.physletb.2016.05.039
Adams, C., Álvarez, V., Arazi, L., Arnquist, I. J., Azevedo, C. D. R., Bailey, K., et al. (2021). Sensitivity of a tonne-scale NEXT detector for neutrinoless double beta decay searches. J. High Energy Phys. 2021, 164. doi:10.1007/JHEP08(2021)164
Albert, J. , Anton, G., Badhrees, I., Barbeau, P., Bayerlein, R., Beck, D., et al. (2018). Search for neutrinoless double-beta decay with the upgraded EXO-200 detector. Phys. Rev. Lett. 120, 072701. doi:10.1103/PhysRevLett.120.072701
Aprile, E., Aalbers, J., Abe, K., Ahmed Maouloud, S., Althueser, L., Andrieu, B., et al. (2025). First search for light dark matter in the neutrino fog with XENONnT. Phys. Rev. Lett. 134, 111802. doi:10.1103/PhysRevLett.134.111802
Aprile, E., Aalbers, J., Agostini, F., Alfonsi, M., Althueser, L., Amaro, F. D., et al. (2019). Observation of two-neutrino double electron capture in 124Xe with XENON1T. Nature 568, 532–535. doi:10.1038/s41586-019-1124-4
Azevedo, C. D. R., Fernandes, L. M. P., Freitas, E. D. C., Gonzalez-Diaz, D., Monrabal, F., Monteiro, C. M. B., et al. (2016). An homeopathic cure to pure xenon large diffusion. JINST 11, C02007. doi:10.1088/1748-0221/11/02/C02007
Azevedo, C. D. R., González-Díaz, D., Biagi, S., Oliveira, C., Henriques, C., Escada, J., et al. (2018). Microscopic simulation of xenon-based optical TPCs in the presence of molecular additives. Nucl. Instrum. Methods Phys. Res. Sect. A Accel. Spectrom. Detect. Assoc. Equip. 877, 157–172. doi:10.1016/j.nima.2017.08.049
Biagi, S. (2025). Magboltz – transport of electrons in gas mixtures. Available online at: https://magboltz.web.cern.ch/magboltz (Accessed March 12, 2025).
Biagi, S. F. (1999). Monte carlo simulation of electron drift and diffusion in counting gases under the influence of electric and magnetic fields. Nucl. Instrum. Methods Phys. Res. Sect. A Accel. Spectrom. Detect. Assoc. Equip. 421, 234–240. doi:10.1016/S0168-9002(98)01233-9
Bo, Z., Chen, W., Chen, X., Chen, Y., Cheng, Z., Cui, X., et al. (2025). Dark matter search results from 1.54 tonne·year exposure of PandaX-4T. Phys. Rev. Lett. 134, 011805. doi:10.1103/PhysRevLett.134.011805
Cui, X., Abdukerim, A., Chen, W., Chen, X., Chen, Y., Dong, B., et al. (2017). Dark matter results from 54-Ton-Day exposure of PandaX-II experiment. Phys. Rev. Lett. 119, 181302. doi:10.1103/PhysRevLett.119.181302
Dias, T., Dos Santos, J., Rachinhas, P., Santos, F., Conde, C., and Stauffer, A. (1997). Full-energy absorption of X-ray energies near the Xe L- and K-photoionization thresholds in xenon gas detectors: simulation and experimental results. J. Appl. Phys. 82, 2742–2753. doi:10.1063/1.366105
Dias, T., Santos, F., Stauffer, A., and Conde, C. (1993). Monte carlo simulation of X-ray absorption and electron drift in gaseous xenon. Phys. Rev. A 48, 2887–2902. doi:10.1103/physreva.48.2887
do Carmo, S. J., Borges, F. I., Vinagre, F. L., and Conde, C. A. (2008). Experimental study of the w-values and fano factors of gaseous xenon and Ar–Xe mixtures for X-rays. IEEE Trans. Nucl. Sci. 55, 2637–2642. doi:10.1109/tns.2008.2003075
dos Santos, J. M. F., Lopes, J. A. M., Veloso, J., Simões, P. C. P. S., Dias, T., Santos, F., et al. (2001). Development of portable gas proportional scintillation counters for X-ray spectrometry. X-Ray Spectrom. 30, 373–381. doi:10.1002/xrs.510
Enterprises Limited (2025). Official website. Available online at: https://et-enterprises.com/images/data_sheets/9266B.pdf (Accessed June 30, 2025).
Escada, J., Dias, T., Santos, F., Rachinhas, P., Conde, C., and Stauffer, A. (2011). A monte carlo study of the fluctuations in Xe electroluminescence yield: pure Xe vs Xe doped with CH4 or CF4 and planar vs cylindrical geometries. J. Instrum. 6, P08006. doi:10.1088/1748-0221/6/08/p08006
Ferrario, P., Laing, A., López-March, N., Gómez-Cadenas, J. J., Álvarez, V., Azevedo, C. D. R., et al. (2016). First proof of topological signature in the high pressure xenon gas TPC with electroluminescence amplification for the NEXT experiment. J. High Energy Phys. 2016, 104. doi:10.1007/JHEP01(2016)104
Fujii, K., Endo, Y., Torigoe, Y., Nakamura, S., Haruyama, T., Kasami, K., et al. (2015). High-accuracy measurement of the emission spectrum of liquid xenon in the vacuum ultraviolet region. Nucl. Instrum. Methods Phys. Res. Sect. A Accel. Spectrom. Detect. Assoc. Equip. 795, 293–297. doi:10.1016/j.nima.2015.05.065
Gando, A., Gando, Y., Hachiya, T., Hayashi, A., Hayashida, S., Ikeda, H., et al. (2016). Search for majorana neutrinos near the inverted mass hierarchy region with KamLAND-Zen. Phys. Rev. Lett. 117, 082503. doi:10.1103/PhysRevLett.117.082503
Gavrilyuk, Y. M., Gangapshev, A. M., Kazalov, V. V., Kuzminov, V. V., Panasenko, S. I., Ratkevich, S. S., et al. (2015). A technique for searching for the 2K capture in124Xe with a copper proportional counter. Phys. Atomic Nucl. 78, 1563–1566. doi:10.1134/S1063778815130098
González-Díaz, D., Álvarez, V., Borges, F., Camargo, M., Cárcel, S., Cebrián, S., et al. (2015). Accurate γ and MeV-electron track reconstruction with an ultra-low diffusion Xenon/TMA TPC at 10 atm. Nucl. Instrum. Methods Phys. Res. Sect. A Accel. Spectrom. Detect. Assoc. Equip. 804, 8–24. doi:10.1016/j.nima.2015.08.033
Gonzalez-Diaz, D., Monrabal, F., and Murphy, S. (2018). Gaseous and dual-phase time projection chambers for imaging rare processes. Nucl. Instrum. Methods Phys. Res. Sect. A Accel. Spectrom. Detect. Assoc. Equip. 878, 200–255. doi:10.1016/j.nima.2017.09.024
Henriques, C. , Amedo, P., Teixeira, J., González-Díaz, D., Azevedo, C., Para, A., et al. (2022). Neutral bremsstrahlung emission in xenon unveiled. Phys. Rev. X 12, 021005. doi:10.1103/PhysRevX.12.021005
Henriques, C. A. O. (2019). Studies of xenon mixtures with molecular additives for the NEXT electroluminescence TPC. Ph.D. thesis. Available online at: https://hdl.handle.net/10316/87464.
Henriques, C. A. O., Freitas, E., Azevedo, C., González-Díaz, D., Mano, R., Jorge, M., et al. (2017). Secondary scintillation yield of xenon with sub-percent levels of CO2 additive for rare-event detection. Phys. Lett. B 773, 663–671. doi:10.1016/j.physletb.2017.09.017
Henriques, C. A. O., Monteiro, C. M. B., González-Díaz, D., Azevedo, C. D. R., Freitas, E. D. C., Mano, R. D. P., et al. (2019). Electroluminescence TPCs at the thermal diffusion limit. J. High Energy Phys. 2019, 027. doi:10.1007/JHEP01(2019)027
Henriques, C. A. O., Teixeira, J. M. R., Silva, P. A. O. C., Mano, R. D. P., dos Santos, J. M. F., and Monteiro, C. M. B. (2024). Understanding the xenon primary scintillation yield for cutting-edge rare event experiments. J. Cosmol. Astropart. Phys. 2024, 041. doi:10.1088/1475-7516/2024/06/041
Luscher, R., Farine, J., Boehm, F., Gabathuler, K., Gervascio, G., Lou, K., et al. (1998). Search for beta beta decay in Xe-136: new results from the gotthard experiment. Phys. Lett. B 434, 407–414. doi:10.1016/S0370-2693(98)00906-X
Mao, F. M., and Leck, J. (1987). The Quadrupole mass spectrometer in practical operation. Vacuum 37, 669–675. doi:10.1016/0042-207X(87)90053-4
Monteiro, C. M. B., Fernandes, L. M. P., Lopes, J. A. M., Coelho, L. C. C., Veloso, JFCA, Santos, J. M., et al. (2007). Secondary scintillation yield in pure xenon. JINST 2, P05001. doi:10.1088/1748-0221/2/05/P05001
Novella, P., Sorel, M., Usón, A., Adams, C., Almazán, H., Álvarez, V., et al. (2023). Demonstration of neutrinoless double beta decay searches in gaseous xenon with NEXT. J. High Energy Phys. 2023, 190. doi:10.1007/JHEP09(2023)190
Nygren, D. R. (2013). Columnar recombination: a tool for nuclear recoil directional sensitivity in a xenon-based direct detection WIMP search. J. Phys. Conf. Ser. 460, 012006. doi:10.1088/1742-6596/460/1/012006
Oliveira C., C., Sorel, M., Martin-Albo, J., Gomez-Cadenas, J., Ferreira, A., and Veloso, J. (2011). Energy resolution studies for NEXT. J. Instrum. 6, P05007. doi:10.1088/1748-0221/6/05/p05007
Oliveira, C. A. B., Schindler, H., Veenhof, R., Biagi, S., Monteiro, C., dos Santos, J., et al. (2011). A simulation toolkit for electroluminescence assessment in rare event experiments. Phys. Lett. B 703, 217–222. doi:10.1016/j.physletb.2011.07.081
Renner, J., Díaz López, G., Ferrario, P., Hernando Morata, J. A., Kekic, M., Martínez-Lema, G., et al. (2019). Energy calibration of the NEXT-white detector with 1% resolution near Qββ of136Xe. J. High Energy Phys. 2019, 230. doi:10.1007/JHEP10(2019)230
Renner, J., Farbin, A., Vidal, J. M., Benlloch-Rodríguez, J., Botas, A., Ferrario, P., et al. (2017). Background rejection in NEXT using deep neural networks. JINST 12, T01004. doi:10.1088/1748-0221/12/01/T01004
SAES (2025). SAES, st 707 pills and pieces. Available online at: https://www.saesgetters.com/products-functions/products/getters/non-evaporable-getters/pills-pieces (Accessed 01 January, 2023).
Simões, P. C. P. S., Covita, D. S., Veloso, JFCA, dos Santos, J. M. F., and Morgado, R. (2003). A new method for pulse analysis of driftless-gas proportional scintillation counters. Nucl. Instrum. Methods Phys. Res. Sect. A Accel. Spectrom. Detect. Assoc. Equip. 505, 247–251. doi:10.1016/s0168-9002(03)01062-3
Simões, P. C. P. S., Dos Santos, J. M. F., and Conde, C. A. N. (2001). Driftless gas proportional scintillation counter pulse analysis using digital processing techniques. X-Ray Spectrom. 30, 342–347. doi:10.1002/xrs.508
Simons, D. G., and de Korte, P. A. J. (1989). Soft X-ray energy resolution and background rejection in a driftless gas scintillation proportional counter. Nucl. Instrum. Methods Phys. Res. Sect. A Accel. Spectrom. Detect. Assoc. Equip. 277, 642–656. doi:10.1016/0168-9002(89)90799-7
Takahashi, T., Himi, S., Suzuki, M., RuanGen, J. z., and Kubota, S. (1983). Emission spectra from Ar–Xe, Ar–Kr, Ar–N2, Ar–CH4, Ar–CO2 and Xe–N2 gas scintillation proportional counters. Nucl. Instrum. Methods Phys. Res. 205, 591–596. doi:10.1016/0167-5087(83)90028-5
Teixeira, J. M. R., Henriques, C. A. O., Silva, PAOC, Mano, R. D. P., Dos Santos, J. M. F., and Monteiro, C. M. B. (2025). Efficient noble gas purification using hot getters and gas circulation by convection. JINST 20, C02026. doi:10.1088/1748-0221/20/02/C02026
Keywords: electroluminescence, electron transport, electron attachment, scintillation probability, xenon electron diffusion, gas proportional scintillation counter, time projection chamber, neutrinoless double beta decay
Citation: Henriques CAO, Fernandes LMP, Silva PAOC, González-Díaz D, Azevedo CDR, Santos JMFd and Monteiro CMB (2025) Experimental characterization of electron transport and electroluminescence in xenon-molecular mixtures. Front. Detect. Sci. Technol. 3:1614781. doi: 10.3389/fdest.2025.1614781
Received: 19 April 2025; Accepted: 14 July 2025;
Published: 13 August 2025.
Edited by:
Gabriele Croci, University of Milano-Bicocca, ItalyReviewed by:
Francesc Monrabal Capilla, Donostia International Physics Center (DIPC), SpainPiet Verwilligen, National Institute for Nuclear Physics of Bari, Italy
Copyright © 2025 Henriques, Fernandes, Silva, González-Díaz, Azevedo, Santos and Monteiro. This is an open-access article distributed under the terms of the Creative Commons Attribution License (CC BY). The use, distribution or reproduction in other forums is permitted, provided the original author(s) and the copyright owner(s) are credited and that the original publication in this journal is cited, in accordance with accepted academic practice. No use, distribution or reproduction is permitted which does not comply with these terms.
*Correspondence: C. A. O. Henriques, aGVucmlxdWVzQHVjLnB0