 Robert Hammann
 Kai Böse
 Steffen Form
 Luisa Hötzsch
 Teresa Marrodán Undagoitia
- Max-Planck-Institut für Kernphysik, Heidelberg, Germany
Xenon, in both its gaseous and liquid phase, offers excellent scintillation and ionization properties, making it an ideal target medium for rare event searches. We report on measurements performed with a dual-phase xenon time projection chamber sensitive to wavelengths from 170 nm to 1700 nm. In addition to the well-established ultraviolet (UV) scintillation, we observe coincident signals in a photomultiplier tube sensitive to infrared (IR) light, associated with both prompt scintillation in the liquid and electroluminescence in the gas. We study the time response of the IR signals and their dependence on the applied amplification field in the gas. Our findings support the observation of IR emission from electroluminescence and reveal a time response distinct from that previously reported for
1 Introduction
Xenon is widely used as a detector medium in various rare event searches, including dark matter direct detection and neutrinoless double beta decay. Its application spans both liquid xenon (Aprile et al., 2025; Aalbers et al., 2025) and high-pressure gaseous xenon (Adams et al., 2025; Bouet et al., 2024; Chen et al., 2017). The success of xenon in these fields is largely attributed to its high stopping power and strong vacuum ultraviolet (VUV) scintillation, which enables excellent energy resolution.
In addition to the well-studied VUV scintillation, xenon is also known to emit radiation in the infrared (IR) region. However, this IR emission remains relatively unexplored, particularly with regard to its potential implications for detector performance and background discrimination.
A first systematic investigation of IR scintillation in noble gases was conducted by Lindblom and Solin (1988). Around the year 2000, the first studies of xenon’s IR continuum emission identified a broad scintillation peak centered around 1.3 µm (Borghesani et al., 2001), consistent with earlier predictions from potential curve estimates (Mulliken, 1970). Initial measurements were conducted in gaseous xenon (Carugno, 1998), where the IR light yield was found to be comparable in magnitude to that of the UV scintillation (Belogurov et al., 2000). A red shift of the emission peak with increasing pressure was also observed and later modeled (Borghesani et al., 2007a; Borghesani et al., 2007b, Borghesani et al., 2025). Above an electric field of about 500 V/cm in the gas, the IR signal was found to increase roughly in proportion to the ionization charge, consistent with a signal from electroluminescence (Belogurov et al., 2000). IR scintillation has additionally been detected in liquid xenon (Bressi et al., 2000), though with a light yield estimated to be two orders of magnitude lower than in gas. Furthermore, there are indications that the emission spectrum in the liquid is significantly shifted toward shorter wavelengths (Bressi et al., 2001).
To better understand xenon’s IR scintillation properties, we initiated a dedicated R&D program. As a first step, we operated a room-temperature setup using gaseous xenon near atmospheric pressure. Using this setup, we studied the time response and light yield of IR scintillation following
In this paper, we report on the operation of a dual-phase xenon time projection chamber (TPC) instrumented with a UV- and an IR-sensitive PMT, enabling simultaneous measurement of both scintillation components. To our knowledge, this is the first measurement in a TPC with wavelength sensitivities from 170 nm to 1,700 nm.
The document is organized as follows: in Section 2, we describe the experimental setup. Section 3 covers the calibration source, the data acquisition (DAQ), the selection criteria applied to the data, and the analysis procedure. The results are presented in Section 4 and discussed in Section 5.
2 Experimental setup
The measurements presented here were carried out using a small-scale liquid xenon TPC called HeXe (short for Heidelberg Xenon, operated at the Max-Planck-Institut für Kernphysik). The detector consists of a
2.1 The HeXe TPC
The HeXe TPC and the auxiliary systems for its operation are detailed in Jörg et al. (2022). Figure 1 illustrates the TPC configuration used in this work, where the upper PMT has been replaced with an IR-sensitive one, which is described in Section 2.2. The TPC’s electric fields are established by three grid electrodes: the cathode at the bottom, the gate just below the liquid surface, and the anode positioned right above the liquid. Field-shaping rings ensure a homogeneous electric field across the sensitive volume. Polytetrafluoroethylene (PTFE) is used both as a reflector and as a filler material between the cryostat and the target.
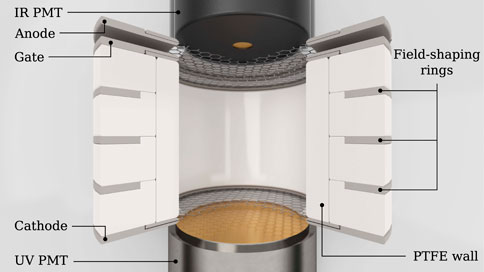
Figure 1. Schematics of the HeXe TPC with the IR-sensitive PMT at the top (aperture opening at the center) and the UV-sensitive PMT at the bottom. The cathode (bottom), gate, and anode (top) electrodes are visible. The 5 cm-high cylindrical TPC is enclosed by a wall made of PTFE. During operation, the liquid xenon level is maintained between the gate and anode.
The drift field is kept constant for all measurements at about 400 V/cm by setting the cathode to
2.2 The infrared-sensitive PMT
To record the IR scintillation light, we employ a 2-inch Hamamatsu R5509-73 PMT. It features a borosilicate entrance window with an opening of 8 mm diameter (see top PMT in Figure 1). Its reflexion-type photocathode, measuring
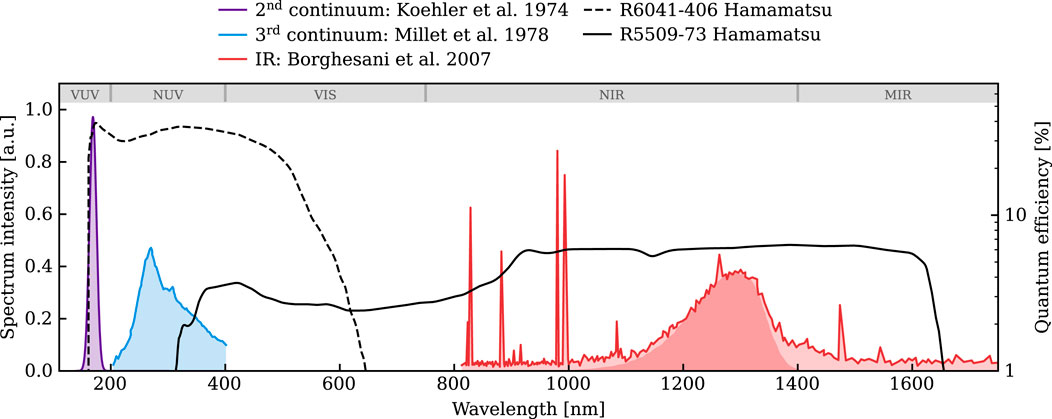
Figure 2. Nominal quantum efficiencies of the PMTs used in this setup: R5509-73 (IR-sensitive, solid black) and R6041-406 (UV-sensitive, dashed black), shown alongside the emission spectra of gaseous xenon at about atmospheric pressure. The UV emission from the second continuum is shown in purple (Koehler et al., 1974), the third continuum emission is shown in blue (Millet et al., 1978), and the IR emission in red (Borghesani et al., 2007a). For the IR emission, the continuum region is indicated by a darker-shaded area. Note that the relative intensities among spectra are arbitrary. For reference, VUV, near-UV (NUV), visible (VIS), near-IR (NIR), and mid-IR (MIR) wavelength bands are indicated. Note that in the liquid phase, clear evidence of emission exists only for the VUV component.
To achieve optimal QE and dark count rate, the photocathode of the specific PMT used in this work must be biased at
2.3 The HeXe gas handling system
A dedicated gas handling system, connected to the TPC, allows xenon storage, the introduction of gaseous calibration sources, and gas purification. During TPC operation, the xenon is continuously purified by circulating it through a hot getter. This is achieved by evaporating xenon from the liquid phase, circulating it as a gas, and then recondensing it on the cold head, from where it drips back into the TPC. Detailed information on the system is provided in Jörg et al. (2022).
The xenon purity is assessed by measuring the “electron lifetime”, a parameter that quantifies the loss of drifting electrons in the liquid due to attachment to electronegative impurities. During this measurement campaign, the electron lifetime varied from about 40 to 50 µs This corresponds to an
3 Calibration source, DAQ, and data selection
The measurements were carried out using an internal 222Rn
Signals were triggered on the UV channel and recorded using a CAEN V1724 digitizer, which has a sampling rate of 100 MS/s and 14-bit resolution. Due to the nanosecond-scale rise and fall times of the IR signals, a timing filter amplifier was employed to shape the IR pulses, in order to maintain detection efficiency. The digitized waveforms were processed to identify peaks, from which key characteristics–such as arrival time, pulse area converted to the number of photoelectrons (PE), and width–were extracted (Cichon, 2021). Peaks in the UV channel were subsequently classified into S1 and S2 signals.
In addition to the nominal fields stated in Section 2.1, the TPC was also operated at different electric field strengths in the gas phase. Electric field values, including the drift and amplification fields above the gate, were determined and verified through COMSOL multiphysics simulations (COMSOL Inc., 2024). These simulations also provide estimates of the associated uncertainties for all field configurations.
For IR pulses, only a peak height threshold is applied to suppress noise. A set of selection criteria is applied to the UV signals to select well-reconstructed
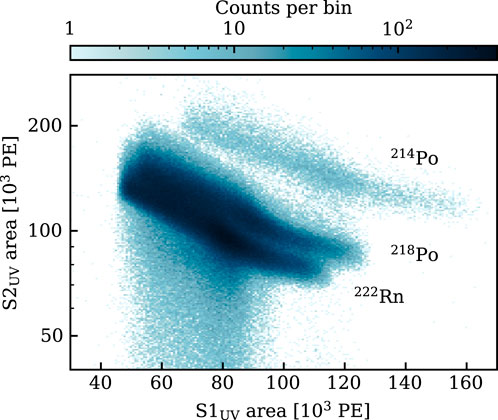
Figure 3. Distribution of 222Rn, 218Po and 214Po events in
4 Results
Owing to the IR PMT’s small entrance window and a nominal quantum efficiency roughly five times lower than that of the UV PMT, its light collection efficiency is orders of magnitude lower. Consequently, S1 and S2 signals of
For each identified IR peak in a waveform, the time differences relative to the
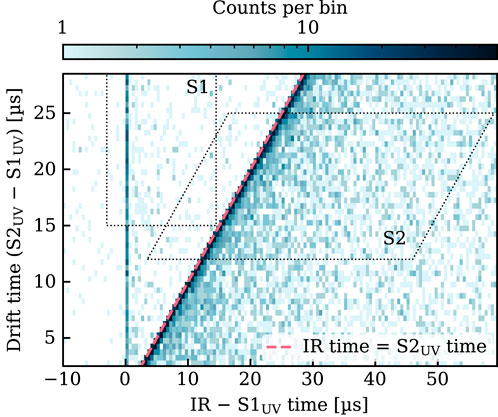
Figure 4. Time distribution of IR signals. The drift time of events with IR signals is plotted against the time difference between the IR signal and the
A small population of IR pulses are very close in time to the
4.1 Signal time structure
We investigated the IR time response after
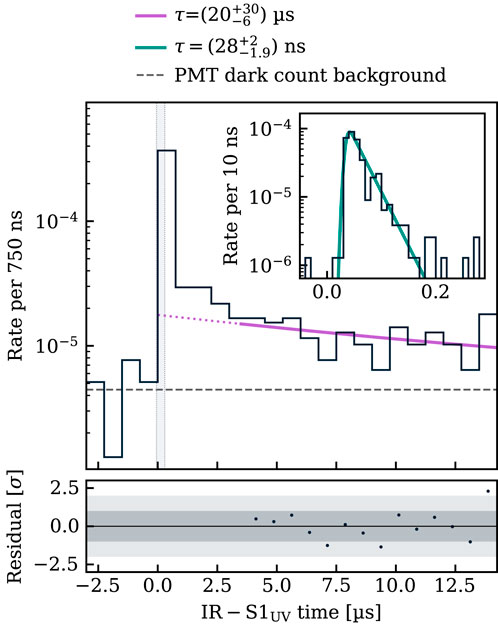
Figure 5. Time distribution of IR signals relative to the
The long IR tail following the
To examine the IR emission associated with the electroluminescence process, we analyzed the arrival times of IR pulses occurring after the
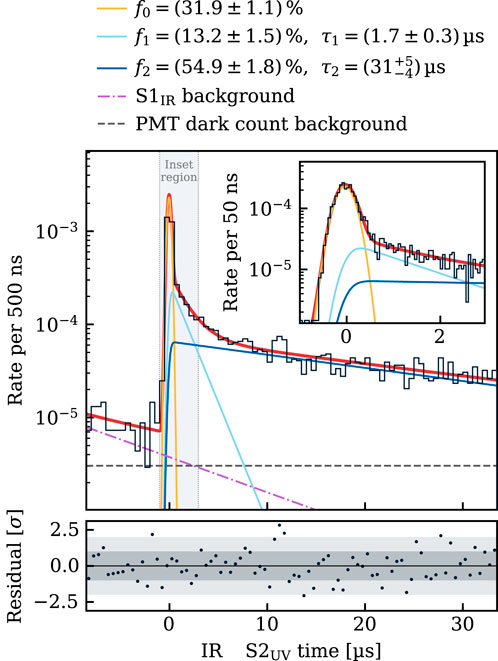
Figure 6. Time distribution of IR signals relative to the
The fastest decay component is not well resolved due to the time smearing and is therefore simply modeled by a Gaussian. Its timescale may be comparable to the few-ns component previously observed in gaseous xenon at room temperature (Piotter et al., 2023; Hammann et al., 2024). The second fastest decay time of approx. 1.7 µs is also similar to the decay time found in previous measurements. The third component of
Figure 7 compares the IR time response to the electroluminescence signal observed in the UV. The average waveform of 500
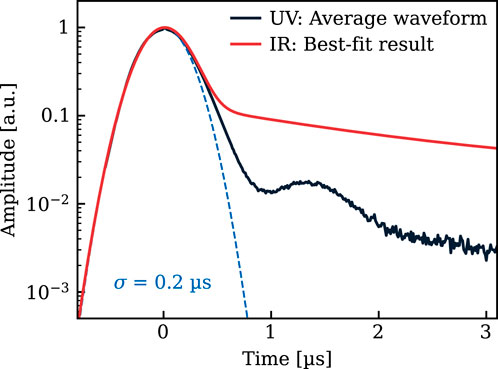
Figure 7. Average
4.2 Electric field dependence
To study the IR emission following
An iterative procedure was employed to determine the liquid level. Electrons generated by photoionization on the gate via bright UV signals were used, which have a drift distance corresponding to the liquid level. Since the electron drift velocity depends on the electric field (Gushchin et al., 1982), which itself is a function of the liquid level, the assumed level was adjusted iteratively until the calculated and observed drift times between the gate and the surface matched. Averaging over all anode voltages and two analysis methods yielded a liquid level of
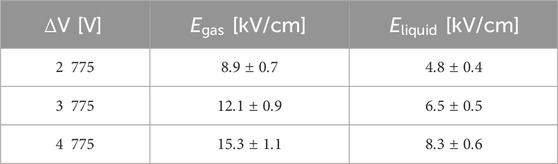
Table 1. Summary of potential differences between anode and gate and electric field values in the gas
To count IR photons associated with the electroluminescence signal, we select those occurring within a time window from
We observe a monotonic increase with the field strength in the IR photon rate, as shown in Figure 8 (top panel). A similar trend was also observed in Belogurov et al. (2000) for lower fields.
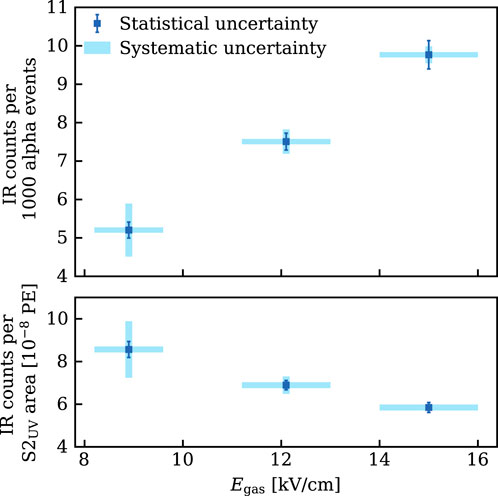
Figure 8. Top: number of IR counts following the
While absolute yields cannot be determined, we compare the observed IR rate to the size of the associated
5 Discussion and outlook
We investigated the scintillation response in a dual-phase xenon TPC in the wavelength range from 170 nm to 1,700 nm. Infrared photons were observed in coincidence with UV scintillation from both the liquid and gas phases, and their time profiles were studied. As expected, increasing the electric field in the gas phase led to an increased number of IR photons associated to the electroluminescence signal.
The origin of the
The IR-sensitive PMT used for the measurements presented here is also sensitive to shorter wavelengths as shown in Figure 2, adding some uncertainty to the interpretation of the results. In particular, it is sensitive to the tail of the third continuum emission which has a decay constant of approximately 8 ns (Millet et al., 1978). This component has so far been measured as part of the primary scintillation light in gaseous xenon for
In the IR time response following both
Although our data is not sensitive to the time constant of the fast IR scintillation component in the gas, it is sensitive to the amplitude of this component. Our past measurements at room temperature showed that, for
The measurements presented here cannot be used to quantify the IR light yield, primarily because the PMT’s quantum efficiency at the applied low bias voltage is unknown. While it remains unclear whether IR scintillation in liquid xenon is sufficiently strong for practical applications, our data support the presence of IR emission from the electroluminescence process in xenon gas, consistent with previous observations. Since previous measurements in gaseous xenon indicate a scintillation yield in the IR comparable to the UV, its application in particle detectors appears promising. One potential application in future dual-phase liquid xenon detectors is the improved discrimination of single-electron S2 signals from S1 signals. Therefore, the ratio of IR and UV signals could eventually improve the rejection of accidental coincidences. Beyond liquid detectors, IR scintillation in xenon gas could also offer advantages for high-pressure gaseous TPCs being developed to search for neutrinoless double beta decay. In such experiments, the additional IR signal could contribute to improved energy resolution – crucial for the experiment’s sensitivity – and may even enable further background suppression via the IR pulse shape, as mentioned above.
Future measurements will help to improve our understanding of the IR emission and enable us to evaluate its feasibility for future low-background experiments. However, new photosensor solutions will be necessary. The current R5509-73 IR PMT is not suitable for low-background applications, as its intrinsic radioactivity (
This first study shows signals in the IR-sensitive channel associated with both
Data availability statement
The raw data supporting the conclusions of this article will be made available by the authors, without undue reservation.
Author contributions
RH: Methodology, Data curation, Visualization, Investigation, Writing – review and editing, Writing – original draft, Formal Analysis. KB: Investigation, Writing – review and editing, Formal Analysis. SF: Investigation, Writing – review and editing. LH: Investigation, Writing – review and editing. TM: Writing – review and editing, Writing – original draft, Project administration, Supervision, Conceptualization.
Funding
The author(s) declare that financial support was received for the research and/or publication of this article. RH and KB acknowledge the financial support of the International Max Planck Research School for Precision Tests of Fundamental Symmetries (IMPRS-PTFS). The project is supported by the Max Planck Society.
Acknowledgments
We gratefully acknowledge the technical services of the Max-Planck-Institut für Kernphysik and thank Yannick Steinhauser for producing the rendered illustration of HeXe. We also thank Edgar Sanchez for valuable discussions.
Conflict of interest
The authors declare that the research was conducted in the absence of any commercial or financial relationships that could be construed as a potential conflict of interest.
Generative AI statement
The author(s) declare that no Generative AI was used in the creation of this manuscript.
Publisher’s note
All claims expressed in this article are solely those of the authors and do not necessarily represent those of their affiliated organizations, or those of the publisher, the editors and the reviewers. Any product that may be evaluated in this article, or claim that may be made by its manufacturer, is not guaranteed or endorsed by the publisher.
References
Aalbers, J., Akerib, D. S., Musalhi, A. K., Alder, F., Amarasinghe, C. S., Ames, A., et al. (2025). Dark matter search results from 4.2 tonne-years of exposure of the LUX-ZEPLIN (LZ) experiment. Phys. Rev. Lett. 135, 1079–7114. doi:10.1103/4dyc-z8zf
Adams, C., Almazán, H., Álvarez, V., Aranburu, A. I., Arazi, L., Arnquist, I. J., et al. (2025). The NEXT-100 detector. doi:10.48550/arXiv.2505.17848
Aprile, E., Alfonsi, M., Arisaka, K., Arneodo, F., Balan, C., Baudis, L., et al. (2014). Observation and applications of single-electron charge signals in the XENON100 experiment. J. Phys. G Nucl. Part. Phys. 41, 035201. doi:10.1088/0954-3899/41/3/035201
Aprile, E., Aalbers, J., Abe, K., Ahmed Maouloud, S., Althueser, L., Andrieu, B., et al. (2025). WIMP dark matter search using a 3.1 tonne × year exposure of the XENONnT experiment. arXiv:2502.18005
Araujo, G. R., Pollmann, T., and Ulrich, A. (2019). Photoluminescence response of acrylic (pmma) and polytetrafluoroethylene (ptfe) to ultraviolet light: limits on low-intensity photoluminescence in support materials of rare-event search experiments. Eur. Phys. J. C 79, 653. doi:10.1140/epjc/s10052-019-7152-2
Bakale, G., Sowada, U., and Schmidt, W. F. (1976). Effect of an electric field on electron attachment to sulfur hexafluoride, nitrous oxide, and molecular oxygen in liquid argon and xenon. J. Phys. Chem. 80, 2556–2559. doi:10.1021/j100564a006
Belogurov, S., Bressi, G., Carugno, G., Conti, E., Iannuzzi, D., and Meneguzzo, A. (2000). Measurement of the light yield of infrared scintillation in xenon gas. Nucl. Instrum. Methods Phys. Res. Sect. A Accel. Spectrom. Detect. Assoc. Equip. 452, 167–169. doi:10.1016/S0168-9002(00)00358-2
Bondar, A., Buzulutskov, A., Dolgov, A., Grebenuk, A., Shemyakina, E., and Sokolov, A. (2012). Study of infrared scintillations in gaseous and liquid argon. part i: methodology and time measurements. J. Instrum. 7, P06015. doi:10.1088/1748-0221/7/06/p06015
Borghesani, A. F., Bressi, G., Carugno, G., Conti, E., and Iannuzzi, D. (2001). Infrared fluorescence of Xe2 molecules in electron/proton beam excited pure Xe gas and in an Ar/Xe gas mixture. J. Chem. Phys. 115, 6042–6050. doi:10.1063/1.1398307
Borghesani, A. F., Carugno, G., and Chiossi, F. (2025). Near-infrared cathodoluminescence of xe2 excimers in dense gaseous mixtures. Front. Detect. Sci. Technol. 3, 3–2025. doi:10.3389/fdest.2025.1580297
Borghesani, A. F., Carugno, G., and Mogentale, I. (2007a). Infrared emission spectrum and potentials of states of Xe2 excimers produced by electron impact. J. Phys. B Atomic, Mol. Opt. Phys. 40, 4551–4560. doi:10.1088/0953-4075/40/24/001
Borghesani, A. F., Carugno, G., and Mogentale, I. (2007b). Low- and high-density features of ir luminescence of xe2 excimers produced by electron impact. Phys. Scr. 76, C84–C89. doi:10.1088/0031-8949/76/3/N13
Bouet, R., Busto, J., Cadiou, A., Charpentier, P., Charrier, D., Chapellier, M., et al. (2025). Simulation of a radial TPC for the detection of neutrinoless double beta decay. The European Physical Journal C. 85, doi:10.1140/epjc/s10052-025-14442-0
Bressi, G., Carugno, G., Conti, E., Iannuzzi, D., and Meneguzzo, A. (2000). Infrared scintillation in liquid Ar and Xe. Nucl. Instrum. Methods Phys. Res. Sect. A Accel. Spectrom. Detect. Assoc. Equip. 440, 254–257. doi:10.1016/S0168-9002(99)01021-9
Bressi, G., Carugno, G., Conti, E., Noce, C., and Iannuzzi, D. (2001). Infrared scintillation: a comparison between gaseous and liquid xenon. Nucl. Instrum. Methods Phys. Res. Sect. A Accel. Spectrom. Detect. Assoc. Equip. 461, 378–380. doi:10.1016/S0168-9002(00)01249-3
Buzulutskov, A., Bondar, A., and Grebenuk, A. (2011). Infrared scintillation yield in gaseous and liquid argon. EPL Europhys. Lett. 94, 52001. doi:10.1209/0295-5075/94/52001
Carugno, G. (1998). Infrared emission in gaseous media induced by ionizing particles and by drifting electrons. Nucl. Instrum. Methods Phys. Res. Sect. A Accel. Spectrom. Detect. Assoc. Equip. 419, 617–620. doi:10.1016/S0168-9002(98)00840-7
Chen, X., Fu, C., Galan, J., Giboni, K., Giuliani, F., Gu, L., et al. (2017). PandaX-III: searching for neutrinoless double beta decay with high pressure 136Xe gas time projection chambers. Sci. China Phys. Mech. Astronomy 60, 061011. doi:10.1007/s11433-017-9028-0
Cichon, D. (2021). Liquid xenon detector physics with XENON1T and HeXe: electric noise stability, background discrimination studies and measurements of the scintillation pulse shape. Ruprecht-Karls-Universität Heidelberg.
Cichon, D., Eurin, G., Jörg, F., Marrodán Undagoitia, T., and Rupp, N. (2022). Scintillation decay-time constants for alpha particles and electrons in liquid xenon. Rev. Sci. Instrum. 93, 113302. doi:10.1063/5.0087216
Gushchin, E., Kruglov, A., and Obodovskii, I. (1982). Electron dynamics in condensed argon and xenon. Sov. Phys. JETP 55, 650.
Hammann, R., Böse, K., Hötzsch, L., Jörg, F., and Marrodán Undagoitia, T. (2024). Investigating the slow component of the infrared scintillation time response in gaseous xenon. JINST 19, C02080. doi:10.1088/1748-0221/19/02/C02080
Henriques, C., Amedo, P., Teixeira, J., González-Díaz, D., Azevedo, C., Para, A., et al. (2022). Neutral bremsstrahlung emission in xenon unveiled. Phys. Rev. X 12, 021005. doi:10.1103/physrevx.12.021005
Jörg, F., Cichon, D., Eurin, G., Hötzsch, L., Marrodán Undagoitia, T., and Rupp, N. (2022). Characterization of alpha and beta interactions in liquid xenon. Eur. Phys. J. C 82, 361. doi:10.1140/epjc/s10052-022-10259-3
Koehler, H. A., Ferderber, L. J., Redhead, D. L., and Ebert, P. J. (1974). Vacuum-ultraviolet emission from high-pressure xenon and argon excited by high-current relativistic electron beams. Phys. Rev. A 9, 768–781. doi:10.1103/PhysRevA.9.768
Lansiart, A., Seigneur, A., Moretti, J.-L., and Morucci, J.-P. (1976). Development research on a highly luminous condensed xenon scintillator. Nucl. Instrum. Methods 135, 47–52. doi:10.1016/0029-554X(76)90824-7
Leardini, S., García, E. S., Amedo, P., Saa-Hernández, A., González-Díaz, D., Santorelli, R., et al. (2022). Time and band-resolved scintillation in time projection chambers based on gaseous xenon. Eur. Phys. J. C 82, 425. doi:10.1140/epjc/s10052-022-10385-y
Lindblom, P., and Solin, O. (1988). Atomic near-infrared noble gas scintillations i. Nucl. Instrum. Methods Phys. Res. Sect. A Accel. Spectrom. Detect. Assoc. Equip. 268, 204–208. doi:10.1016/0168-9002(88)90607-9
Millet, P., Birot, A., Brunet, H., Galy, J., Pons-Germain, B., and Teyssier, J. L. (1978). Time resolved study of the uv and near uv continuums of xenon. J. Chem. Phys. 69, 92–97. doi:10.1063/1.436349
Mulliken, R. S. (1970). Potential curves of diatomic rare-gas molecules and their ions, with particular reference to Xe2. J. Chem. Phys. 52, 5170–5180. doi:10.1063/1.1672756
Piotter, M., Cichon, D., Hammann, R., Jörg, F., Hötzsch, L., and Marrodán Undagoitia, T. (2023). First time-resolved measurement of infrared scintillation light in gaseous xenon. Eur. Phys. J. C 83, 482. doi:10.1140/epjc/s10052-023-11618-4
Shaw, P.-S., Li, Z., Arp, U., and Lykke, K. R. (2007). Ultraviolet characterization of integrating spheres. Appl. Opt. 46, 5119–5128. doi:10.1364/AO.46.005119
Sorensen, P., and Gibbons, R. (2025). Quartz fluorescence backgrounds in rare-event searches. arXiv:2505, 08067. doi:10.48550/arXiv.2505.08067
Keywords: liquid xenon, scintillation, infrared radiation, dark matter, noble gas detectors, time projection chamber
Citation: Hammann R, Böse K, Form S, Hötzsch L and Marrodán Undagoitia T (2025) Operation of a dual-phase xenon detector with wavelength sensitivity from ultraviolet to infrared. Front. Detect. Sci. Technol. 3:1638362. doi: 10.3389/fdest.2025.1638362
Received: 30 May 2025; Accepted: 03 July 2025;
Published: 25 July 2025.
Edited by:
Diego Gonzalez-Diaz, University of Santiago de Compostela, SpainReviewed by:
Carlos Ourivio Escobar, Fermi National Accelerator Laboratory (DOE), United StatesArmando Francesco Borghesani, University of Padua, Italy
Copyright © 2025 Hammann, Böse, Form, Hötzsch and Marrodán Undagoitia. This is an open-access article distributed under the terms of the Creative Commons Attribution License (CC BY). The use, distribution or reproduction in other forums is permitted, provided the original author(s) and the copyright owner(s) are credited and that the original publication in this journal is cited, in accordance with accepted academic practice. No use, distribution or reproduction is permitted which does not comply with these terms.
*Correspondence: Robert Hammann, cm9iZXJ0LmhhbW1hbm5AbXBpLWhkLm1wZy5kZQ==; Kai Böse, a2FpLmJvZXNlQG1waS1oZC5tcGcuZGU=
†Present address: Luisa Hötzsch, Physik-Institut, University of Zürich, Zürich, Switzerland