 Nimra Noor
 Muhammad Bilal
 Saadullah Farooq Abbasi
 Omid Pournik
 Theodoros N. Arvanitis
- 1Department of Artificial Intelligence, Rare Sense Inc, Covina, CA, United States
- 2Department of Electronic, Electrical and Systems Engineering, University of Birmingham, Birmingham, United Kingdom
According to the World Health Organization, cardiovascular diseases (CVDs) account for an estimated 17.9 million deaths annually. CVDs refer to disorders of the heart and blood vessels such as arrhythmia, atrial fibrillation, congestive heart failure, and normal sinus rhythm. Early prediction of these diseases can significantly reduce the number of annual deaths. This study proposes a novel, efficient, and low-cost transformer-based algorithm for CVD classification. Initially, 56 features were extracted from electrocardiography recordings using 1,200 cardiac ailment records, with each of the four diseases represented by 300 records. Then, random forest was used to select the 13 most prominent features. Finally, a novel transformer-based algorithm has been developed to classify four classes of cardiovascular diseases. The proposed study achieved a maximum accuracy, precision, recall, and F1 score of 0.9979, 0.9959, 0.9958, and 0.9959, respectively. The proposed algorithm outperformed all the existing state-of-the-art algorithms for CVD classification.
1 Introduction
Cardiovascular diseases (CVDs) are responsible for almost 18 million deaths annually (1). These CVDs mainly consists of arrhythmia (ARR), atrial fibrillation (AFF), congestive heart failure (CHF), and normal sinus rhythm (NSR). There are multiple factors that are responsible for cardiac diseases, i.e., lifestyle, diet, smoking, poor sleep, etc. Changing these conditions can significantly improve heart health. In addition, early prediction and diagnosis of these heart conditions can significantly reduce the number of deaths. Heart disease classification using electrocardiography (ECG) plays an important role in automatic detection of aforementioned diseases.
After the recent advancements in high-powered processors and graphic processing units (GPUs), deep learning (DL) has been increasingly used in the automatic detection of diseases such as epilepsy (2, 3), sleep disorders (4, 5), and heart diseases (6, 7). Incorporating cardiophysiological prior knowledge into the deep neural network architecture improves the performance of automatic detection of CVDs (8, 9). Common considerations include the analysis of PQRST wave patterns, cardiophysiologically meaningful feature extraction, and the temporal dynamics of ECG signals. According to cardiological studies, different segments of the ECG waveform provide critical insights into various heart conditions. Several deep learning methods (10, 11), leveraging this prior knowledge, have achieved superior heart disease detection performance. ECG electrodes are placed on the chest, forming a structured representation of cardiac activity. Consequently, many studies treat ECG signals using techniques such as convolutional neural networks (CNNs) (12) that respect the sequential nature of the data or even graph-based methods for more complex interdependencies (13). Despite these advancements, there remains additional prior knowledge to be explored. As one of the critical physiological processes, heart function involves intricate processes such as electrical conduction, myocardial contraction, and autonomic regulation. Different heart regions exhibit unique activation patterns under various physiological states, for example, the coordinated activity of the atria and ventricles during a cardiac cycle (14) and the interaction between the sinoatrial node and atrioventricular node in maintaining heart rhythm (15).
A predefined or single learnable matrix is unable to capture the intricate connections between different heart parameters that underlie complex cardiovascular conditions. Additionally, it is well-known that heart signal states associated with heart health can fluctuate continuously over short periods but may not remain consistent over extended periods. There have been very limited studies incorporating this temporal context into understanding the effect of this in CVDs. To address this issue, this study developed a novel transformer-based algorithm for CVD classification. Initially, 56 features were extracted from 1,200 ECG samples. To reduce the computational cost and only add the relevant information, the 13 most prominent features were selected using the random forest algorithm. Finally, these 13 features were tokenized and inserted into the proposed transformer model for training. The proposed algorithm outperformed all the existing algorithms for CVD classification with approximately 100% classification accuracy for the four classes.
The main contributions of the proposed study are as follows:
• To reduce the computational cost and increase efficiency, 13 most prominent features were selected from the dataset using the random forest (RF) algorithm.
• A novel transformer-based algorithm was developed for the classification of four classes of CVD.
• Extensive experiments and a comparison has been presented with existing state-of-the-art studies for validation.
2 Literature review
This section will briefly explain the literature review and is mainly divided into two parts: CVD classification and transformers.
2.1 Transformer neural network
A transformer is a type of deep learning model proposed by Vaswani et al. (16). A transformer offers a significant improvement over CNNs and other existing architectures due to its ability to model long-range dependencies and capture global context through self-attention mechanisms. The self-attention mechanism enables the model to weigh the importance of different input elements dynamically, allowing it to capture more complex and global relationships in the data. Initially, transformer models were used to translate speech and text nearly in real-time. This innovation led to the evolution of large language models such as GPT2 (17) and GPT3 (18). There were two main innovations that the transformer model brought to the market: positional encoding and self-attention. In 2018, bidirectional encoder representations from transformers (BERT) (19) was developed. This revolutionized the large language models, and in 2019, BERT was nearly used for all Google English language searches. In recent years, researchers have proposed different transformer-based algorithms for earthquake detection (20), stock prediction (21), and voltage stability assessment (22). In 2023, these models were explored in biomedical signal classification, including in electroencephalography (EEG) (23) and ECG (24). The property of position encoding and deep self-attention can significantly improve the performance of real-time bio-signal classification, prediction, and diagnosis.
In 2023, Hu et al. proposed a hybrid transformer model (HTM) for epilepsy prediction. The model processes EEG data at multiple levels and uses channel attention to enhance accuracy (25). Their study achieved an optimal sensitivity of 91.7% with a false positive rate of 0.00/h. Automatic sleep apnea (SA) detection using DL and single-lead ECG has been extensively studied. Hu et al. (26) proposed an HTM by exploring the impact of different deep learning model structures and label mapping lengths (LMLs) on personalized transfer learning (TL). The study compared a pure CNN-based model (PCM) with the HTM and evaluated different TL strategies. The results showed that the proposed model achieved an average accuracy of 85.37% and an AUC of 0.9147. The study suggested that increasing LML positively impacts model performance and that using only positive samples is beneficial within the same database, while negative samples are more effective in cross-database TL. However, the study focused only on single-lead ECG data, which may limit its applicability to multimodal approaches. To further improve the personalization of single-lead ECG-based obstructive sleep apnea (OSA) detection, (27) introduced a semi-supervised algorithm for automated fine-tuning. The approach used a CNN-based autoencoder (AE) with an anomaly detection mechanism to assign pseudo-labels to unknown samples, thereby reducing reliance on clinical annotations. The proposed study demonstrated that pseudo-labeling and semi-supervised fine-tuning enhance OSA detection performance while reducing the dependency on annotated clinical data. However, despite these improvements, the approach remains constrained by the limitations of single-lead ECG data and the effectiveness of pseudo-label assignment in highly heterogeneous datasets. Building on the need for enhanced OSA detection, Hu et al. (28) proposed a modality fusion representation enhancement (MFRE) framework to improve diagnostic performance by integrating multiple modalities. Unlike previous single-modal models, this framework used a parallel information bottleneck modality fusion network (IPCT-Net) to extract local–global multi-view representations and eliminate redundant information in fused data. By incorporating multimodal data fusion, this approach addressed the limitations of previous single-modality methods, providing a more robust and clinically relevant AI-assisted OSA screening system.
2.2 Cardiovascular disease classification
Considering that there is no definite diagnosis of heart failure, medical diagnostic methods such as assessing the history of the patient, ECG, and echocardiography are crucial for heart disease detection. Of the abovementioned methods, ECG is considered the only non-invasive and cheapest way to assess the health of the heart. Researchers have proposed numerous classification algorithms for detecting cardiac ailments using ECG signals. These include neural networks (NNs) (29), support vector machines (SVMs) (30), decision trees (DTs) (31), and K-nearest neighbors (KNNs) (32). Among these, neural networks, SVMs, and KNNs are particularly prevalent.
Khalaf et al. (30) utilized principal component analysis (PCA) combined with an SVM to classify different types of arrhythmias based on raw spectral correlation data, achieving an accuracy of 98.60%. Thomas et al. (31) applied dual tree complex wavelet transform (DTCWT) for feature extraction and used a multi-layer back propagation neural network to classify cardiac arrhythmias, resulting in a sensitivity of 94.64%, which outperformed the discrete wavelet transform by 3.41%. Escalona-Morán et al. (33) categorized Massachusetts Institute of Technology-Beth Israel Hospital (MIT-BIH) cardiac arrhythmia data into five beat types, achieving a mean accuracy of 98.43%. Christov et al. (34) classified atrial fibrillation signals from a challenge database, obtaining an F1 score of 85% for atrial fibrillation beats.
Acharya et al. (12) proposed a CNN for arrhythmia diagnosis, which automatically classified five different heartbeat types. The algorithm employed data augmentation to balance the dataset, achieving an accuracy of 94% on the balanced data and 89.07% on the imbalanced data. To enhance accuracy further, Long Short-Term Memory (LSTM) networks, a popular and effective model for sequence learning, have been utilized. Darmawahyuni et al. (35) used LSTM and gated recurrent unit (GRU) classifiers to distinguish myocardial infarction (MI) from normal signals in the PhysioNet PTB Diagnostic ECG Database, achieving an accuracy of 97.56% and a Matthews correlation coefficient (MCC) of 95.32% with the LSTM architecture, which outperformed GRU. Oh et al. (36) proposed a hybrid model combining an CNN and LSTM to diagnose five classes from an MIT-BIH dataset. Their model included convolutional, pooling, LSTM, and fully connected layers. The LSTM layers handle the extraction of temporal information from the feature maps created by the convolutional layers. This model achieved an accuracy of 98.10%.
3 Materials and methods
This section briefly explains the dataset, preprocessing, feature extraction and selection, and the proposed transformer model for CVD classification. The block diagram of the proposed transformer-based classifier is given in Figure 1.
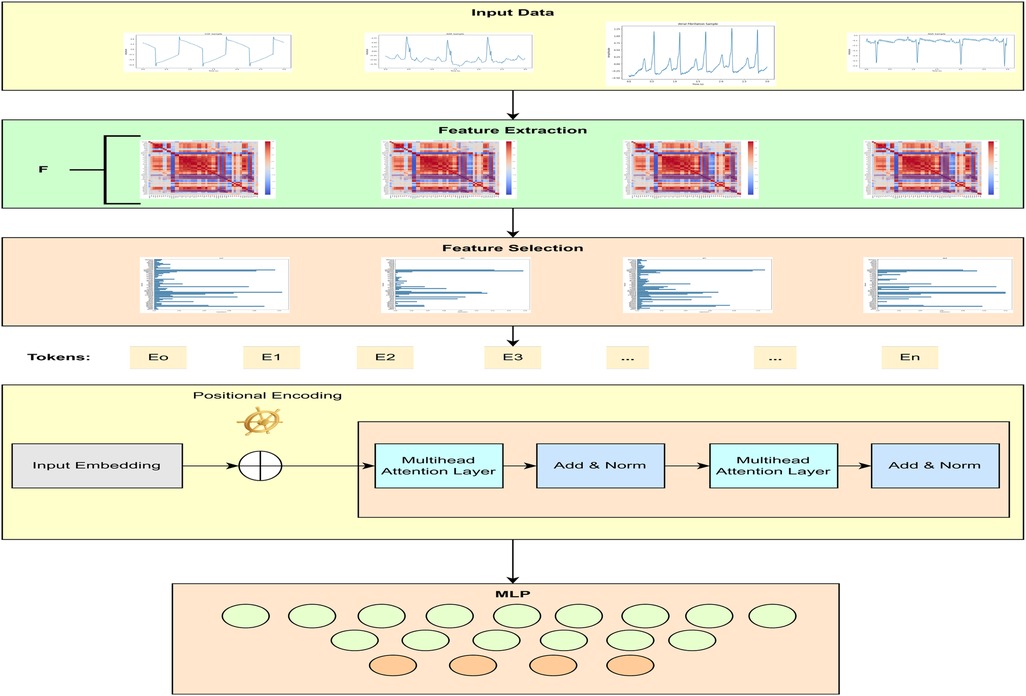
Figure 1. Block diagram of the proposed CVD classifier.
3.1 Dataset and preprocessing
This study used 1,200 ECG recordings from the MIT-BIH PhysioNet database (37) containing 300 samples for each heart disease, i.e., ARR, AFF, CHF, and NSR. All the recordings were extracted using a sampling rate of 250 samples per second. Raw 3 s ECG recordings after applying the Butterworth filter can be seen in Figure 2. During recording and transmission, these ECG recordings were contaminated with noise and artifacts. To remove noise and artifacts, a Butterworth band-pass filter was applied, ensuring the retention of critical ECG components. The Butterworth filter was chosen due to its maximally flat frequency response in the passband, minimizing distortion. A fourth-order Butterworth band-pass filter with cutoff frequencies of 0.5 and 150 Hz was used to eliminate baseline noise and high-frequency noise.

Figure 2. Raw 3 s ECG samples for CVDs.
3.2 Feature extraction and selection
The proposed study used maximal overlap discrete wavelet packet transform (MODWPT) to extract characteristics waves, heart rate variability (HRV), and 54 other features. These features are provided in Table 1. Mathematically, wavelet decomposition using MODWPT is given as in Walden and Cristan (38) (Equations 1, 2):
where are the MODWPT coefficients at time , which are typically associated with frequencies within the interval . The operator denotes the integer part (or floor) operator. Four-level symlet transform has been used to detect the characteristic curves. Based on the four-level structure, the signal yields 16 coefficients, with the initial four utilized for signal reconstruction via inverse MODWPT. The peak value of this reconstructed signal corresponds to the R wave. The subsequent characteristic waves are extracted using a suitable moving window technique.
• 1 feature as Heart beat per minute. In total, we have 54 features;
• 11 morphological features;
• 29 fiducial features;
• 4 statistical features;
• 9 HRV features.
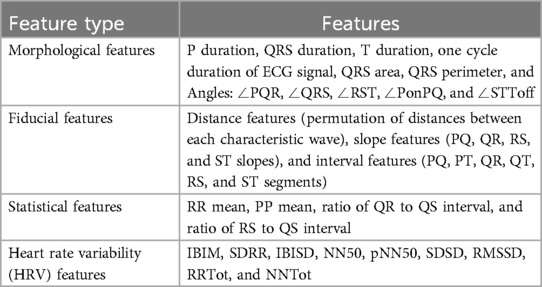
Table 1. Features from each ECG recording.
Utilizing all 54 features for training and testing will significantly increase the computational cost. There are a number of machine learning methods that can be used to compute the feature importance score. However, we have used RF, a method commonly used for multi-class problems and dealing with dense problems (39). RF is an effective technique that requires minimal parameter tuning. RF consists of multiple binary DTs built on randomly chosen subsets. One crucial characteristic of RF is the use of Out-of-Bag (OOB) error estimation. OOB samples are not used in training the current tree, which allows for internal estimation of generalization error, thereby improving classification performance. This feature is also essential for quantifying feature importance.
RF was chosen for feature selection due to its robustness to noise and outliers, as it can handle noisy or non-linearly separable data efficiently, unlike linear techniques such as PCA (40). RF assigns importance scores to features, ranking them based on their contribution to classification accuracy. Additionally, RF requires minimal parameter tuning compared to methods such as least absolute shrinkage and selection operator (LASSO), and it can handle high-dimensional data effectively by modeling complex interactions between features through an ensemble of decision trees, outperforming individual selection methods such as mutual information or univariate filtering.
RF initially estimates the OOB error of each feature . It then replaces the feature value with one of its values in the OOB set and re-estimates the OOB error . The importance score for a feature is defined as the average absolute difference in OOB errors across all trees. Figure 4 shows the feature importance score for each class (Equation 3).
Here, represents the number of trees in the RF ensemble. denotes the OOB error of feature in the th tree, and denotes the corresponding error after swapping the feature value.
3.3 Proposed methodology
This study proposed a novel transformer-based algorithm for the classification of four classes of CVD. A transformer with token mixers is proposed to capture information from temporal textual information using selected ECG features underlying CVD. This study proposed a token mixer for CVD classification. Since the selected feature dataset consists of numerical feature values and textual labels, we first performed PCA to visualize the data in 2D space and select features with importance greater than 0.02, thereby reducing dimensionality. We then converted each row of features into a textual string format (e.g., “QRtoQSdur: 0.001, RStoQSdur: 0.001”). The label encoder was used to convert the cardiac condition categories (such as “ARR”) into numerical values for machine learning. These text strings were tokenized using BERT’s tokenizer, which converts them into numerical token IDs that BERT can process. Finally, the tokenized data were converted into PyTorch tensors, and DataLoaders were created for both training and validation.
3.3.1 Transformer layer formulation
Given the feature set , a transformer block for ECG classification can be expressed as follows (Equations 4, 5):
where denotes the number of layers in the transformer blocks, , and the MLP consists of two linear layers with rectified linear unit (ReLU) activation. Each linear layer is followed by a dropout layer.
3.3.2 Token mixers for classification tasks
For the classification task, the Multi-Head Self-Attention (MHSA) mechanism is used in the TokenMixer. This mechanism emphasizes parts of the feature set that are highly correlated with the cardiovascular state. The tokens in are linearly projected into multiple groups of key (), query (), and value () vectors using learnable parameters (Equation 6):
The scaled dot-product is employed as the attention mechanism to capture long-term dependencies (Equation 7):
where is a scaling factor. The outputs from different heads are stacked together (Equation 8):
Considering the temporal nature of ECG signals, a short-time aggregation (STA) layer follows the MHSA to learn long-term contextual information. The STA layer applies a 2D convolution operation (Equation 9):
where represents a 2D convolution operation, denotes dropout, and is the convolution kernel. The reshaped output is then projected using (Equation 10):
A sample input data format for the transformer model is illustrated in Figure 3. Table 2 shows the details of the hyperparameters used in the proposed study. The AdamW optimizer was chosen for its effectiveness in fine-tuning pre-trained models, handling large parameter spaces, and ensuring stable convergence.
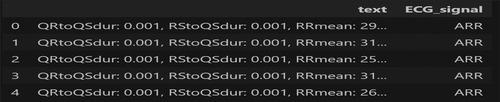
Figure 3. Sample inputs to the proposed transformer model.

Table 2. Training hyperparameters.
3.4 Evaluation metrics
The evaluation metrics for CVD classification are mainly divided into four main types: accuracy (Acc), precision (Pre), recall (Rec), and F1-Score. Mathematically, these metrics are given as (Equation 11)
where
• is the total number of samples.
• is an indicator function that equals 1 if the condition is true and 0 otherwise.
• is the predicted class.
• is the true class.
Precision, recall and F1 score has been calculated for each class. Mathematically, these are given as (Equations 12–14)
where
• is the number of true positives for class .
• is the number of false positives for class .
where
• is the number of false negatives for class .
where
• is the precision for class .
• is the recall for class .
4 Results and discussion
All the experiments were conducted in Python using a 2.50 GHz 12th Gen Intel(R) Core(TM) i9-12900H. In the proposed study, RF was used to calculate the feature importance. First, RF was trained using the training data. The importance of the feature was then calculated and stored. Finally, a reduced number of features were selected on the basis of their importance in each class. The proposed study used a trial-and-error approach, testing various threshold values and selecting 0.02 because it resulted in the highest classification precision while minimizing redundancy. This selection ensured that only the most relevant features were retained for optimal model performance. Figure 4 shows the feature importance scores for each heart disease class.
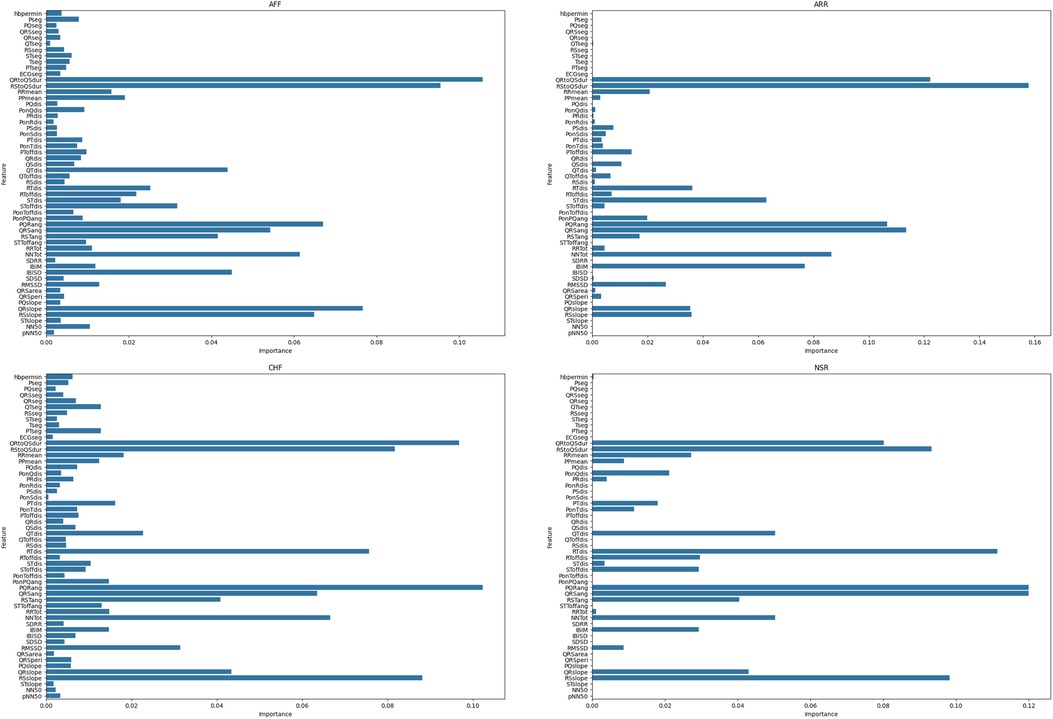
Figure 4. Feature importance score for each heart disease class.
The confusion matrix is shown in Figure 5. The evaluation metrics, calculated using the confusion matrix, are also shown in Table 3. We evaluated the proposed study using the evaluation metrics given in Section 3.4. The proposed study achieved an overall notable test accuracy of 99.79%.
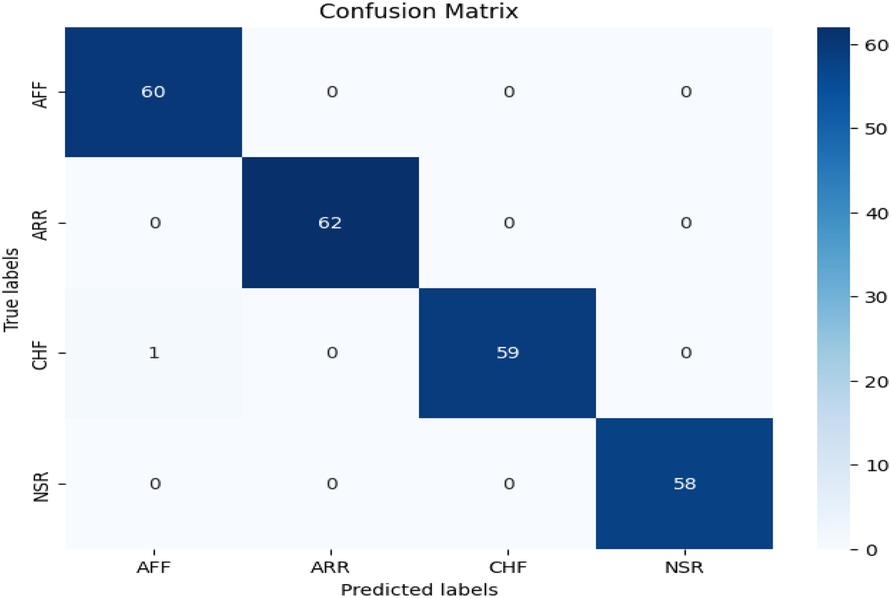
Figure 5. Confusion matrix of the proposed CVD classifier.
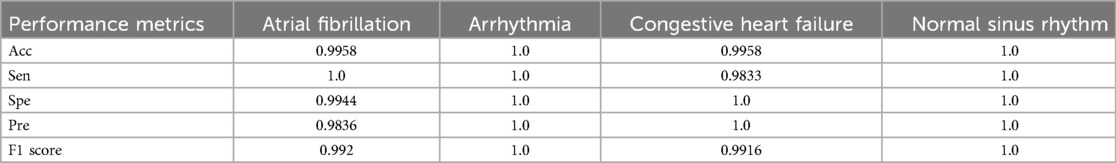
Table 3. Performance metrics for different cardiovascular conditions.
The proposed model avoids overfitting through a 70-10-20 split for training, validation, and testing, to ensure independent evaluation at each stage. The accuracy remained consistent across all three sets, confirming robust generalization without performance degradation. Additionally, to address concerns of overfitting, regularization techniques such as dropout layers and weight decay were applied, ensuring that the model did not rely too heavily on specific patterns.
To demonstrate the necessity of each component in our proposed architecture, we conducted an ablation study by systematically removing or replacing different components. We tested several variations, including a baseline model without feature selection, which used all 56 extracted features without RF-based selection, resulting in an accuracy drop of 2.3%. Additionally, replacing the transformer with a CNN reduced accuracy by 6.28%, highlighting the effectiveness of the transformer model for ECG classification. Furthermore, to validate the claimed improvements, we performed statistical significance tests, comparing our model’s accuracy with existing models such as a multi-layer perceptron (MLP) and a CNN using the paired t-test and the Wilcoxon signed-rank test. The paired t-test resulted in a p-value of 0.0125 for the CNN and 0.0138 for the MLP, indicating that our model’s improvements were statistically significant. The Wilcoxon signed-rank test yielded a p-value of 0.0625 for both the CNN and MLP, further confirming the robustness of our method. These results suggest that the improvements observed in our proposed transformer-based approach are not due to random chance but rather to the architectural choices made in this study.
The area under the receiver operating curve (ROC) provides an aggregate measure of performance across all thresholds. Figure 6 shows the ROC curves for each CVD class on the test set. It can be seen that the area under the ROC is 100%.
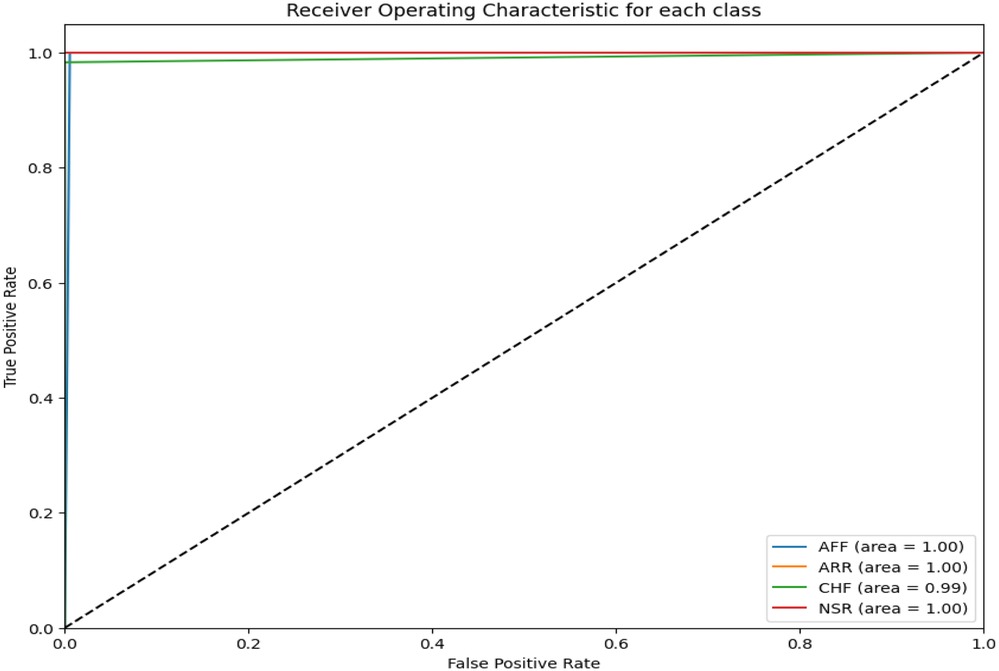
Figure 6. ROC for the proposed CVD classifier.
In addition to the proposed CVD classification performance, Table 4 provides a comparison with existing algorithms. From the table, it can be seen that the proposed algorithm outperformed all existing algorithms for CVD classification. The results of all evaluation metrics are better compared to the previously proposed algorithms.
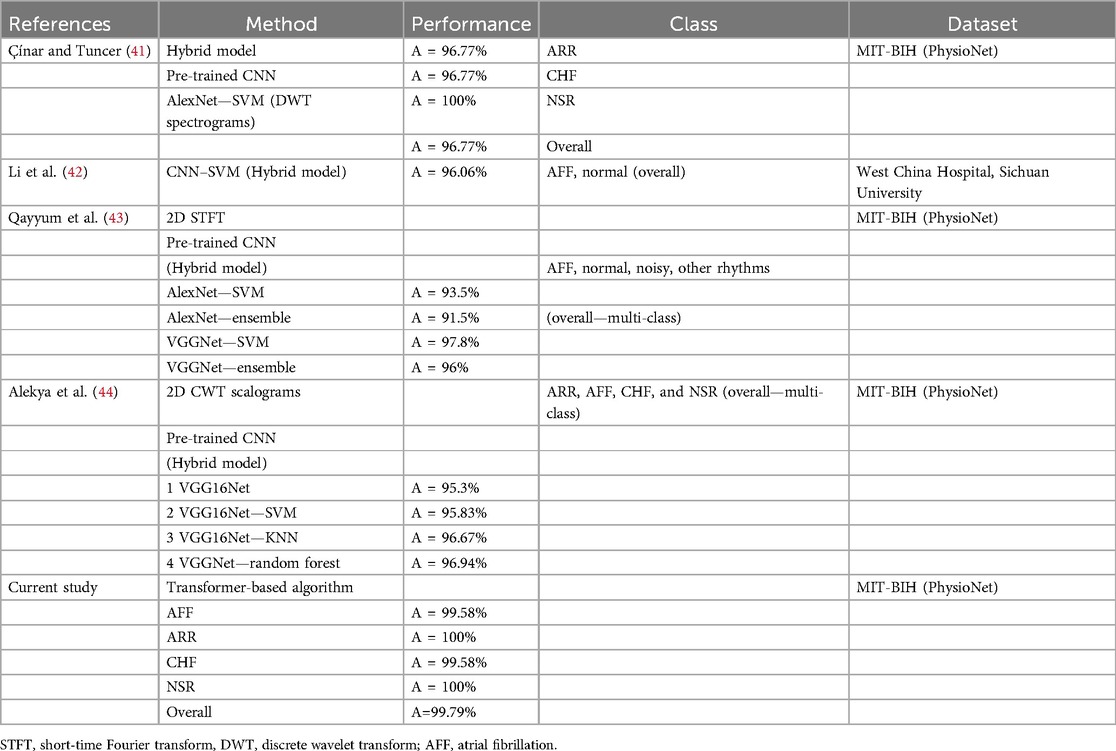
Table 4. Comparison of different methods and their performance metrics.
To assess the feasibility of deploying the proposed model in clinical settings, we analyzed its computational complexity and real-time performance. The average inference time per ECG sample for the transformer model was 0.022776 s for a batch size of 1, increasing to 0.425322 s for a batch size of 64. This indicates that the model is suitable for real-time applications, especially with smaller batch sizes. The memory footprint of the transformer model, which can be considered a limitation, is approximately 2.656 GB. However, the transformer-based model is optimized for parallel processing on GPUs, allowing efficient handling of large-scale ECG datasets.
The proposed algorithm worked very well for cardiovascular disease detection and classification; however, there are some limitations that need to be addressed. First, the proposed study used four cardiovascular diseases; however, there was no normal class, therefore we could not compare the results of a normal class against each class of cardiovascular disease. The exclusion of a normal class limits the model’s ability to distinguish between healthy individuals and those with cardiovascular diseases, potentially leading to false positives if applied to a dataset containing healthy patients. The proposed dataset used in this study is an dataset available online, and it does not contain a normal class, which is the reason for its exclusion from the proposed model. It is recommended to add a normal class along with the diseases to have a broader and real-world example. Second, the proposed study used hand-crafted features extracted from ECG signals. These hand-crafted features, along with feature selection, require computational time and prior subject knowledge. The proposed model can be extended by integrating a 1D CNN to automatically extract features from raw data. This would allow the proposed architecture to function as a hybrid model, combining automatic feature extraction with advanced classification capabilities, making it adaptable to a broader range of real-world applications.
5 Conclusion
The results of the proposed transformer model demonstrate that a transformer-based algorithm can effectively classify four classes of CVD. Initially, 54 morphological, fiducial, statistical, and HRV features were extracted from 3 s ECG data. A random forest algorithm was then used for prominent feature selection. After feature selection, these features were transformed into text and provided as input to the proposed transformer model. The model achieved an impressive accuracy of 99.79%. Due to the absence of a post-processing step, this model is well-suited for real-world applications.
Data availability statement
Publicly available datasets were analyzed in this study. These data can be found here: https://www.kaggle.com/datasets/akki2703/ecg-of-cardiac-ailments-dataset/data.
Author contributions
NN: Conceptualization, Data curation, Formal analysis, Investigation, Methodology, Project administration, Resources, Software, Validation, Visualization, Writing – original draft, Writing – review & editing. MB: Conceptualization, Data curation, Formal analysis, Investigation, Methodology, Project administration, Software, Visualization, Writing – original draft, Writing – review & editing. SA: Conceptualization, Data curation, Formal analysis, Investigation, Methodology, Project administration, Software, Visualization, Writing – original draft, Writing – review & editing, Funding acquisition, Resources, Supervision, Validation. OP: Conceptualization, Investigation, Methodology, Project administration, Software, Visualization, Writing – original draft, Writing – review & editing. TA: Conceptualization, Funding acquisition, Methodology, Resources, Software, Supervision, Validation, Visualization, Writing – review & editing, Writing – original draft.
Funding
The author(s) declare that financial support was received for the research and/or publication of this article. This work is partially funded by both Advanced Security-for-safety Assurance for Medical Device IoT (MedSecurance)—Grant Agreement number: 101095448 and Innovative Applications of Assessment and Assurance of Data and Synthetic Data for Regulatory Decision Support (INSAFEDARE)—Grant Agreement number: 101095661.
Acknowledgments
The authors would like to acknowledge The University of Birmingham’s HPC BlueBear for providing the high-performance computing resources that were essential for conducting this study.
Conflict of interest
NN and MB were employed by Rare Sense Inc.
The remaining authors declare that the research was conducted in the absence of any commercial or financial relationships that could be construed as a potential conflict of interest.
The author(s) declared that they were an editorial board member of Frontiers, at the time of submission. This had no impact on the peer review process and the final decision.
Generative AI statement
The author(s) declare that Generative AI was used in the creation of this manuscript. Generative AI was used to improve the writing. No data were generated from the Generative AI tool.
Publisher's note
All claims expressed in this article are solely those of the authors and do not necessarily represent those of their affiliated organizations, or those of the publisher, the editors and the reviewers. Any product that may be evaluated in this article, or claim that may be made by its manufacturer, is not guaranteed or endorsed by the publisher.
References
1. Ahsan MM, Mahmud MP, Saha PK, Gupta KD, Siddique Z. Effect of data scaling methods on machine learning algorithms and model performance. Technologies. (2021) 9(3):52. doi: 10.3390/technologies9030052
2. Srinivasan S, Dayalane S, Mathivanan SK, Rajadurai H, Jayagopal P, Dalu GT. Detection and classification of adult epilepsy using hybrid deep learning approach. Sci Rep. (2023) 13(1):17574. doi: 10.1038/s41598-023-44763-7
3. Zaid Y, Sah M, Direkoglu C. Pre-processed and combined EEG data for epileptic seizure classification using deep learning. Biomed Signal Process Control. (2023) 84:104738. doi: 10.1016/j.bspc.2023.104738
4. Abbasi SF, Ahmad J, Tahir A, Awais M, Chen C, Irfan M, et al. EEG-based neonatal sleep-wake classification using multilayer perceptron neural network. IEEE Access. (2020) 8:183025–34. doi: 10.1109/ACCESS.2020.3028182
5. Abbasi SF, Abbas A, Ahmad I, Alshehri MS, Almakdi S, Ghadi YY, et al. Automatic neonatal sleep stage classification: a comparative study. Heliyon. (2023) 9:e22195. doi: 10.1016/j.heliyon.2023.e22195
6. Abubaker MB, Babayiğit B. Detection of cardiovascular diseases in ECG images using machine learning and deep learning methods. IEEE Trans Artif Intell. (2022) 4(2):373–82. doi: 10.1109/TAI.2022.3159505
7. Malakouti SM. Heart disease classification based on ECG using machine learning models. Biomed Signal Process Control. (2023) 84:104796. doi: 10.1016/j.bspc.2023.104796
8. Goharrizi MASB, Teimourpour A, Falah M, Hushmandi K, Isfeedvajani MS. Multi-lead ECG heartbeat classification of heart disease based on HOG local feature descriptor. Comput Methods Programs Biomed Update. (2023) 3:100093. doi: 10.1016/j.cmpbup.2023.100093
9. Noroozi Z, Orooji A, Erfannia L. Analyzing the impact of feature selection methods on machine learning algorithms for heart disease prediction. Sci Rep. (2023) 13(1):22588. doi: 10.1038/s41598-023-49962-w
10. Cheng J, Zou Q, Zhao Y. ECG signal classification based on deep CNN and BILSTM. BMC Med Inf Decis Mak. (2021) 21:1–12. doi: 10.1186/s12911-021-01736-y
11. Gündüz AF, Talu MF. Atrial fibrillation classification and detection from ECG recordings. Biomed Signal Process Control. (2023) 82:104531. doi: 10.1016/j.bspc.2022.104531
12. Acharya UR, Oh SL, Hagiwara Y, Tan JH, Adam M, Gertych A, et al. A deep convolutional neural network model to classify heartbeats. Comput Biol Med. (2017) 89:389–96. doi: 10.1016/j.compbiomed.2017.08.022
13. Kutluana G, Türker I. Classification of cardiac disorders using weighted visibility graph features from ECG signals. Biomed Signal Process Control. (2024) 87:105420. doi: 10.1016/j.bspc.2023.105420
14. Klabunde R. Cardiovascular Physiology Concepts. Philadelphia: Lippincott Williams & Wilkins (2011).
15. Boron WF, Boulpaep EL. Medical Physiology: A Cellular and Molecular Approach. Philadelphia: Saunders (2003).
16. Vaswani A, Shazeer N, Parmar N, Uszkoreit J, Jones L, Gomez AN, et al. Attention is all you need. Adv Neural Inf Process Syst. (2017) 30:6000–10. doi: 10.5555/3295222.3295349
17. Lagler K, Schindelegger M, Böhm J, Krásná H, Nilsson T. GPT2: empirical slant delay model for radio space geodetic techniques. Geophys Res Lett. (2013) 40(6):1069–73. doi: 10.1002/grl.50288
18. Floridi L, Chiriatti M. GPT-3: its nature, scope, limits, and consequences. Minds Mach. (2020) 30:681–94. doi: 10.1007/s11023-020-09548-1
19. Devlin J, Chang M-W, Lee K, Toutanova K. BERT: pre-training of deep bidirectional transformers for language understanding. arXiv [Preprint]. arXiv:1810.04805 (2018).
20. Mousavi SM, Ellsworth WL, Zhu W, Chuang LY, Beroza GC. Earthquake transformer—an attentive deep-learning model for simultaneous earthquake detection and phase picking. Nat Commun. (2020) 11(1):3952. doi: 10.1038/s41467-020-17591-w
21. Wang C, Chen Y, Zhang S, Zhang Q. Stock market index prediction using deep transformer model. Expert Syst Appl. (2022) 208:118128. doi: 10.1016/j.eswa.2022.118128
22. Li Y, Cao J, Xu Y, Zhu L, Dong ZY. Deep learning based on transformer architecture for power system short-term voltage stability assessment with class imbalance. Renew Sustain Energy Rev. (2024) 189:113913. doi: 10.1016/j.rser.2023.113913
23. Zeynali M, Seyedarabi H, Afrouzian R. Classification of EEG signals using transformer based deep learning and ensemble models. Biomed Signal Process Control. (2023) 86:105130. doi: 10.1016/j.bspc.2023.105130
24. Hu S, Cai W, Gao T, Wang M. A hybrid transformer model for obstructive sleep apnea detection based on self-attention mechanism using single-lead ECG. IEEE Trans Instrum Meas. (2022) 71:1–11. doi: 10.1109/TIM.2022.3193169
25. Hu S, Liu J, Yang R, Wang YN, Wang A, Li K, et al. Exploring the applicability of transfer learning and feature engineering in epilepsy prediction using hybrid transformer model. IEEE Trans Neural Syst Rehabil Eng. (2023) 31:1321–32. doi: 10.1109/TNSRE.2023.3244045
26. Hu S, Wang Y, Liu J, Yang C. Personalized transfer learning for single-lead ECG-based sleep apnea detection: exploring the label mapping length and transfer strategy using hybrid transformer model. IEEE Trans Instrum Meas. (2023) 72:1–15.37323850
27. Hu S, Liu J, Yang C, Wang A, Li K, Liu W, et al. Semi-supervised learning for low-cost personalized obstructive sleep apnea detection using unsupervised deep learning and single-lead electrocardiogram. IEEE J Biomed Health Inform. (2023) 27(11):5281–92. doi: 10.1109/JBHI.2023.3304299
28. Hu S, Wang Y, Liu J, Cui Z, Yang C, Yao Z, et al. IPCT-Net: parallel information bottleneck modality fusion network for obstructive sleep apnea diagnosis. Neural Netw. (2025) 181:106836. doi: 10.1016/j.neunet.2024.106836
29. Marinho LB, Nascimento NDMM, Souza JWM, Gurgel MV, Filho PPR, de Albuquerque VHC. A novel electrocardiogram feature extraction approach for cardiac arrhythmia classification. Future Gener Comput Syst. (2019) 97:564–77. doi: 10.1016/j.future.2019.03.025
30. Khalaf AF, Owis MI, Yassine IA. A novel technique for cardiac arrhythmia classification using spectral correlation and support vector machines. Expert Syst Appl. (2015) 42(21):8361–8. doi: 10.1016/j.eswa.2015.06.046
31. Thomas M, Das MK, Ari S. Automatic ECG arrhythmia classification using dual tree complex wavelet-based features. AEU Int J Electron Commun. (2015) 69(4):715–21. doi: 10.1016/j.aeue.2014.12.013
32. Kaya Y, Pehlivan H, Tenekeci ME. Effective ECG beat classification using higher order statistic features and genetic feature selection. Biomed Res. (2017) 28(17):7594–603.
33. Escalona-Morán MA, Soriano MC, Fischer I, Mirasso CR. Electrocardiogram classification using reservoir computing with logistic regression. IEEE J Biomed Health Inform. (2015) 19(3):892–8. doi: 10.1109/JBHI.2014.2332001
34. Christov I, Krasteva V, Simova I, Neycheva T, Schmid R. Multi-parametric analysis for atrial fibrillation classification in the ECG. In: Proceedings of the Computers in Cardiology Conference (CinC) (2017). p. 1–4.
35. Darmawahyuni A, Nurmaini S, Caesarendra W, Bhayyu V, Rachmatullah MN. Deep learning with a recurrent network structure in the sequence modeling of imbalanced data for ECG-rhythm classifier. Algorithms. (2019) 12(6):118. doi: 10.3390/a12060118
36. Oh SL, Ng EYK, Tan RS, Acharya UR. Automated diagnosis of arrhythmia using combination of CNN and LSTM techniques with variable length heart beats. Comput Biol Med. (2018) 102:278–87. doi: 10.1016/j.compbiomed.2018.06.002
37. Moody GB. PhysioNet. In: Encyclopedia of Computational Neuroscience. New York, NY: Springer (2022). p. 2806–8.
38. Walden AT, Cristan AC. The phase–corrected undecimated discrete wavelet packet transform and its application to interpreting the timing of events. Proc R Soc London Ser A. (1998) 454(1976):2243–66. doi: 10.1098/rspa.1998.0257
39. Genuer R, Poggi J-M, Tuleau-Malot C. Variable selection using random forests. Pattern Recognit Lett. (2010) 31(14):2225–36. doi: 10.1016/j.patrec.2010.03.014
41. Çınar A, Tuncer SA. Classification of normal sinus rhythm, abnormal arrhythmia and congestive heart failure ECG signals using LSTM and hybrid CNN-SVM deep neural networks. Comput Methods Biomech Biomed Engin. (2021) 24(2):203–14. doi: 10.1080/10255842.2020.1821192
42. Li Z, Feng X, Wu Z, Yang C, Bai B, Yang Q. Classification of atrial fibrillation recurrence based on a convolution neural network with SVM architecture. IEEE Access. (2019) 7:77849–56. doi: 10.1109/ACCESS.2019.2920900
43. Qayyum A, Meriaudeau F, Chan GCY. Classification of atrial fibrillation with pre-trained convolutional neural network models. In: 2018 IEEE-EMBS Conference on Biomedical Engineering and Sciences (IECBES). IEEE (2018). p. 594–9.
Keywords: electrocardiogram, classification, random forest, cardiovascular diseases, transformers, heart diseases
Citation: Noor N, Bilal M, Abbasi SF, Pournik O and Arvanitis TN (2025) A novel transformer-based approach for cardiovascular disease detection. Front. Digit. Health 7:1548448. doi: 10.3389/fdgth.2025.1548448
Received: 19 December 2024; Accepted: 19 March 2025;
Published: 29 April 2025.
Edited by:
Abhirup Banerjee, University of Oxford, United KingdomCopyright: © 2025 Noor, Bilal, Abbasi, Pournik and Arvanitis. This is an open-access article distributed under the terms of the Creative Commons Attribution License (CC BY). The use, distribution or reproduction in other forums is permitted, provided the original author(s) and the copyright owner(s) are credited and that the original publication in this journal is cited, in accordance with accepted academic practice. No use, distribution or reproduction is permitted which does not comply with these terms.
*Correspondence: Saadullah Farooq Abbasi, cy5mLmFiYmFzaUBiaGFtLmFjLnVr
†These authors have contributed equally to this work and share first authorship