 Simon Stoddart1*†
 Alessio Palmisano2†
 David Redhouse3
 Graeme Barker1Giorgia di Paola4Laura Motta5Tom Rasmussen6Troy Samuels5Robert Witcher7
- 1McDonald Institute, University of Cambridge, Cambridge, United Kingdom
- 2Department of Ancient History, LMU Munich, Munich, Germany
- 3Department of Archaeology, University of Cambridge, Cambridge, United Kingdom
- 4Soprintendenza Archeologia, Belle Arti e Paesaggio per le Province di Caserta e Benevento, Caserta, Italy
- 5Kelsey Museum, University of Michigan, Ann Arbor, MI, United States
- 6School of Arts, Languages, and Cultures, University of Manchester, Manchester, United Kingdom
- 7Department of Archaeology, University of Durham, Durham, United Kingdom
This paper examines the patterns of Etruscan urbanism by the innovative use of newly available rural data, employing rank size, and indices of centralization. The detailed case study looks at the development of urbanism of pre-Roman Etruria where both robust and delicate urbanism were present alongside one another. To achieve this end, the paper will draw on the complementary features of two recent articles—Redhouse and Stoddart (2011) and Palmisano et al. (2018)—to provide a synthesis that both examines the large places and the supporting rural settlement. The territorial boundaries of the major urban places were predicted by the XTENT model in the first article. The cumulative numbers of rural settlement (and other proxies of population) over time were examined in the second article. This paper will look at the regional variation in landscape organization within the predicted territorial boundaries of the major robust centres and the more delicate transitory centres, as well as the buffer zones in between. At least three phases of boundary development can be examined, equivalent broadly to the Iron Age, Orientalizing/Archaic and Post Archaic periods, seeking to match these with the correspondingly dated rural settlement. The results will be critically examined in terms of broader knowledge of the economic and political development from current fieldwork in Etruria. The ethnographic analysis of Kopytoff (1989) will also be applied to assess the application of the internal African frontier to the central Italian context. In this way, the quantitative will be matched with the qualitative to provide a deeper understanding of urban development in an under-assessed example within the Mediterranean world.
Introduction
Background
The Etruscan settlement pattern analyzed here belonged to rich communities living in an area generally defined as Tyrrhenian central Italy during the first millennium BC. These were the communities that competed with the Latins to the south of the Tiber, and were later absorbed into the Roman empire (Figure 1A). That means that they lived principally between the river Arno to the north at 44° North, the river Tiber to the south at 40° North and toward the south east, and the Mediterranean to the west. At the beginning of the Early Iron Age (1,020–900 BC), small dispersed sites (ca. 2–3 ha, up to 15 ha) often on tuff outcrops were abandoned and new large proto-urban centres on larger plateaux (ca. 50–185 ha) were occupied (Guidi, 1989, 2010; Pacciarelli, 2000; Peroni, 2000; Bonghi Jovino, 2005; Milletti et al., 2010; Fulminante, 2014, p. 44–47; Alessandri, 2015, 2016; Stoddart, 2016). In the Late Iron Age/Orientalizing (750/725–580 BC) and Archaic periods (580–480 BC), the settlements reached full urbanization and the political landscape was divided into several competing city-states distributed at an average radial distance of 15–25 km, accompanied by increased intensity of rural settlement.
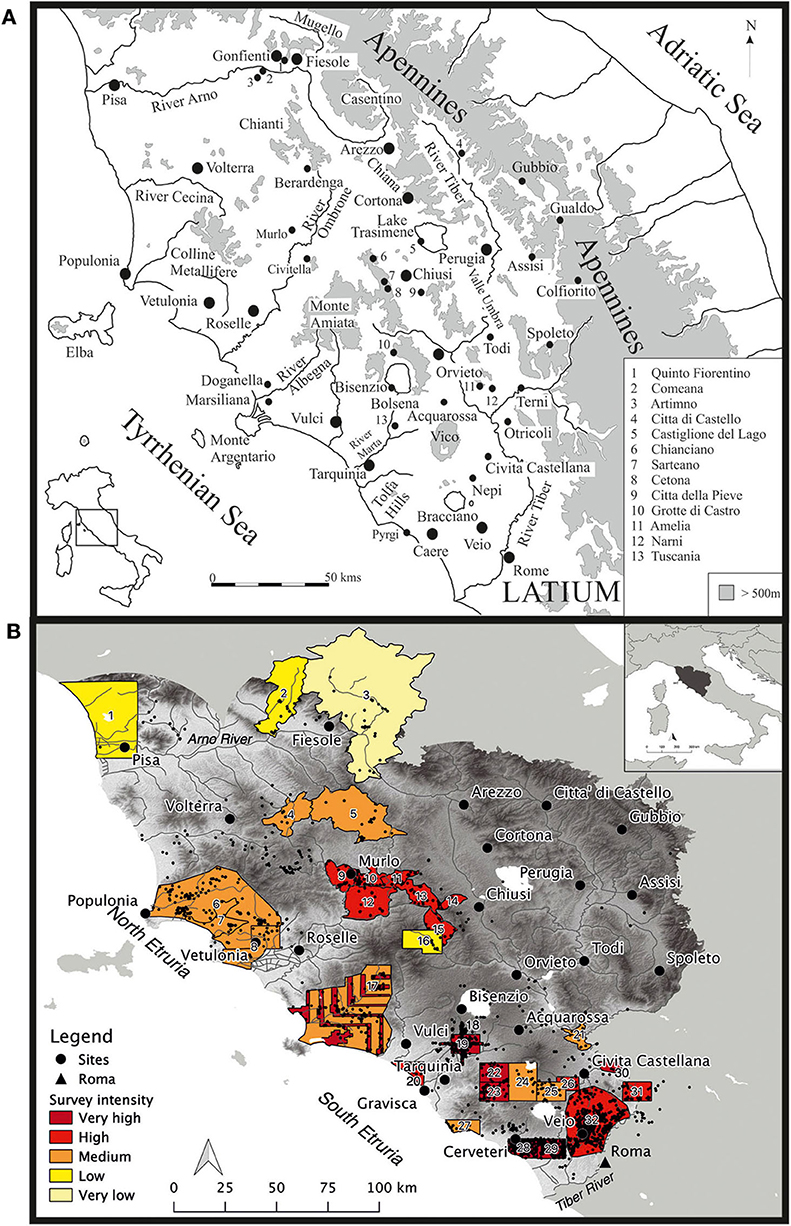
Figure 1. (A) Map illustrating the location of Etruria and the places and regions mentioned in the text. (B) The region of Etruria, showing the survey zones and the recovered rural settlement. The numbered surveys are indicated as follows: (1) Neppi Modona (1953); (2) Perazzi and Poggesi (2011); (3) Chellini (2012); (4) Valenti (1999); (5) Valenti (1995); (6) unpublished, courtesy of Di Paola; (7) Cucini (1985); (8) Curri (1978); (9) Campana (2001); (10) Cenni (2010); (11) Felici (2012); (12) Campana (2013); (13) Felici (2004); (14) Paolucci and Francovich (2007); (15) Botarelli (2004); (16) Cambi (1996); (17) Carandini et al. (2002); (18) Quilici Gigli (1970); (19) unpublished, courtesy of (Barker and Rasmussen, 1998); (20) Corsi (2000); (21) Nardi (1980); (22) Quilici Gigli (1976); (23) Hemphill (2000); (24) Andreussi (1977); (25) Morselli (1980); (26) Rajala (2013); (27) Gianfrotta (1972); (28) Enei (2001); (29) Tartara (1999); (30) Verga (2006); (31) Muzzioli (1980); (32) Patterson et al. (2020).
The position of Etruria in the central Mediterranean gave these communities privileged access to the efficiencies of maritime transport and trade, once technological advances in shipping had reduced the risks of sea travel to a level that granted these communities considerable advantage. The benefit of communication was enhanced by access to at least four significant rivers penetrating into the intermontane valleys of the foothills of the Apennines: the Tiber, the Arno, the Ombrone, and the Albegna. These rivers assisted the extraction of resources from the mountainous uplands of the Apennines, providing a complementarity between the fertile volcanic agricultural soils and metal resources of the relative lowlands and the pastoral zones of the uplands. In this way, geopolitics underlay the landscape configuration of the Etruscans and this paper explores and extends that logic.
The distinctive urban culture of the Etruscans has long been known as an elite strategy, understood through material culture, particularly the study of pottery, and larger scale visual culture (Stoddart, 2020a). This is the rich analysis undertaken by a series of distinguished authors (e.g., Ampolo, 1980; Bettelli, 1997; Bartoloni, 2003; Smith, 2014; and many others), but that is not our approach here. The underlying settlement structure that supported this urban culture has been less explored, in spite of the considerable potential availability of settlement data from the study of cities and cemeteries since the nineteenth century, and from regional landscape survey concentrated in the second half of the twentieth century.
More recently, the synthesis of the promising urban landscape data has been made possible by a series of converging factors: a strong survey tradition, the provision of raw data from these surveys and the modeling of city territories. Early steps before the fully digital age (Stoddart, 1987; Rendeli, 1993; Pacciarelli, 2000; Cifani, 2003) have provided a foundation for the full assembly of published survey data (Palmisano et al., 2017, 2018), now for the first time combined with four other prominent systematically collected survey data: Cecina valley (Samuels and Terrenato, unpublished data), Populonia (Di Paola, 2018), Tuscania (Barker and Rasmussen, 1998), and the Tiber Valley Project [British School at Rome, Patterson et al. (2020)] yet to be fully published. Whereas, syntheses have been assembled and interpreted for the subsequent Roman period (e.g., Patterson, 1987; Launaro, 2011; Sewell and Witcher, 2015), the same analysis has never been achieved for the formative Etruscan phase and this is the focus of the current urban analysis, one that deserves comparison with many other classic case studies of state formation in the ancient world.
The study of the apparently dominant centres of power (Redhouse and Stoddart, 2011; Stoddart, 2020b) and their implications for the differential organization of the countryside has already been achieved. For this preceding study, we have what amounts to a nearly complete sample, since no sampling strategy can easily ignore the major urban foci surrounded by their cemeteries (Dennis, 1848). However, even here some caution should be observed about the completeness of archaeological samples, since some very large urban centres have been discovered in relatively recent times: e.g., Doganella (Perkins and Walker, 1990), Marsiliana d'Albegna (Zifferero, 2010), Gonfienti (Poggesi et al., 2005). Inevitably, some characteristics of this sample are open to debate, including even basic features such as size, internal density and thus population, but we do have a fairly complete data set of settlements larger than 10 ha.
What has never been achieved before is to combine these powerful places with the rural settlement from their territories. These amount to 1894 sites dating from the ninth to the fifth century BC, uncovered by systematic field survey. The combination of these two data sets provides an innovative comparison of the strategies of the individual urban centres. This, in turn, provides the living backdrop to, and infrastructure for, the different urban cultures which have been known for a much longer period, as first recognized by Banti (1960). In spite of the relatively large data set, as we discuss further below, we do not have anything that can be characterized as a complete sample, and the source criticism of any such archaeological data set is an important prererequisite before drawing any sound conclusions.
The careful characterization of these data nevertheless allows new interpretations of the multiple strategies employed by the citizens of urban Etruria. The urban centres were in broad equilibrium until the sack of Veio and the arrival of Rome, but they varied considerably in size of centre, size of territory, and density of occupation of the landscape. One important outcome is to be able to outline the dynamism of the urban landscape. The central points of the landscape were generally long-lasting (“robust”; cf. Stoddart, 2016), but as these central points strengthened they prevailed over frontier areas that were more delicate in their organization. This robust urbanism is based on urban centres which endured for at least 400 or 500 years. This is an urbanism with well-defined practices, often institutions, which passed on authority and power from one generation to the next beyond the memory and charisma of the individual, apparently without repeated crisis. In contrast, we can observe what Stoddart has termed “delicate” urbanism (Stoddart, 2017), involving short-lived urban centres which lasted little more than a few generations and perhaps lacked well-rehearsed practices for passing on power and authority or, if attempting to develop comparable practices, were caught in a geopolitical trap, pressured by their nearest large neighbours. Such delicate urban centres may be relatively substantial, but the nucleated populations dispersed after relatively short periods of few hundred years. In Etruria, both forms—robust and delicate—were, for a time, contiguous, and direct comparison between them can be made within a broadly similar cultural landscape.
In this paper, our analysis has been achieved by combining several techniques in combination as explained in more detail below. First, hypothesized territories have been defined for the major urban centres using the mathematical modeling of XTENT (Renfrew and Level, 1979) sensitized to the physiography of the landscape (Redhouse and Stoddart, 2011; Stoddart, 2020b). Secondly, the rural settlement has been allocated to these territories and the degree of hierarchization, centralization, and density of settlement assessed quantitatively. Three broad chronological phases of boundary development will be examined, equivalent broadly to the Iron Age/Orientalizing (ca. 1,020/1,000–580 BC), Archaic (ca. 580–480 BC), and Post-Archaic (ca. 480–350 BC) periods, seeking to match these with the correspondingly dated rural settlement. These time frames have been chosen because they reflect the level of accuracy of datable surface material—mainly pottery collected from the ploughsoil by different survey projects—although they are of unequal length. The results show the multiple strategies employed by the agents of urbanism in Etruria.
The Archaeological Data and Case Study
The high intensity of field archaeological investigation (e.g., excavations, surveys) in a relatively dry arable landscape makes central Italy an excellent case study for assessing demographic trends (Barker, 1988; Potter and Stoddart, 2001; Stoddart, 2007), and the first millennium BC which forms the focus of this study has a consistency of recovery only exceeded by the Roman period. For many years, these projects have remained separate datasets. This situation changed when Palmisano et al. (2018) collected a comprehensive dataset of archaeological sites in central Italy. For this, they conducted a comprehensive review and harmonization of settlement data from archaeological survey reports covering an overall extent of ca. 10,000 sq. km and a chronological scope spanning from the Late Mesolithic to the fall of the Roman Empire (ca. 8000 BC–500 AD).
For the current exercise in the restricted period (first millennium BC) and region (Tyrrhenian central Italy), this data set has been augmented by the inclusion of new data from published sources and four important unpublished data sets kindly made available for this publication leading to a final total of 549 Iron Age/Orientalizing, 1,248 Archaic sites, and 914 Post-Archaic sites. Settlement data were recorded as georeferenced points (unprojected WGS84). In the present paper, the term “site” refers only to those places identified as dwelling places by excluding cemeteries, temporary activity areas (e.g., campsites) and industrial zones (e.g., mines). One major new set, that of Veio (Tiber Valley Project), lacks the systematic measurement of size and therefore the new data cannot be included in the full set of analyses. We remain dependent on a smaller set of size data from this territory (Rajala, 2013). Further work could also be undertaken on local publications particularly those of local groups, the grey literature of the Superintendencies and by including the well researched, empty, parts of landscape (e.g., Ceccarelli and Stoddart, in press), but this data set nevertheless comprises the most complete data set yet assembled of Etruscan rural data. The archaeological settlement data used in this paper are presented spatially in Figure 1B.
These data sets must necessarily be approached with caution since they conceal multiple methodological strategies for the recovery of archaeological material with varying levels of interest, knowledge and specialization and differing local site formation processes. These issues have been extensively studied by fieldworkers (di Gennaro and Stoddart, 1982; Stoddart and Whitehead, 1991; Terrenato, 1996; Bintliff and Sbonias, 1999; Francovich et al., 2000; Mattingly, 2000), but will not be deeply analyzed here. We nevertheless maintain that the large size of the data set does enable the detection of trends even at the more localized level of comparing different territories.
The most important differences to be noted are the degree to which individual city territories have been comprehensively covered by survey. It is rare to find a strategy of 100% coverage for all sorts of practical reasons. Veio, Nepi, and Murlo stand out for their more comprehensive coverage, which is substantially complete. The coverage around Cerveteri, Tuscania, Marsiliana d'Albegna, Doganella, and Chiusi is extensive, but incomplete, often structured by the choice of survey area and project sampling and collection strategies, matters explicitly set out in the survey reports. Other urban centres such as Acquarossa, Populonia, Vetulonia, and Fiesole have less detailed coverage, often built up from many sources of information.
Methods For Defining Territories, Settlement Hierarchies, and Regional Centralization
XTENT Model
As outlined in the 2011 paper (Redhouse and Stoddart, 2011), the XTENT model was devised by Renfrew and Level (1979) to overcome a number of simplifications faced by the Thiessen (1911) polygon or Voronoi polygon analysis used in the original Early State Module (ESM) analysis of Renfrew (1975). The main simplification is that the original ESM analysis divided up territory equally between centres regardless of size or of any physical barriers in the landscape. Instead, XTENT is based on the simple assumption that territorial extents are related both to the size and the distance between urban centres. In particular, the influence exerted by a centre on a specific location of the landscape can be modeled according to the relative size of that centre and its distance away from that given location. Therefore, this technique permits the prediction of buffer zones of unallocated political space that can be detected cross-culturally in developing political landscapes (cf. Marcus and Feinman, 1998). In the present analysis, the calculation of the territorial extent is measured against the “friction” of the physiography of the landscape by introducing a Digital Elevation Model (DEM) into the equation (cf. Ducke and Kroefges, 2008; Bevan, 2010). In this way, the formula of XTENT is contextualized to the specific physical environment.
In the particular case of Etruria (Figure 2), the methodology executed was as follows. Within the boundaries of the sea and the River Tiber (an important cultural boundary), political boundaries were calculated in all directions from each major primate centre using the following mathematical reasoning:
Where I is a measure of influence at a given location, C is a measure of size of the centre, d is a measure of distance from the centre, and k is a constant. A centre C1 will dominate a centre C2 if I1 > I2 at C2, that is if:
The constant k, representing the fall-off of influence was, following Renfrew and Level (1979), investigated empirically, using their suggestions and previous experience with the technique. In the original unpublished analyses by Harrison and Stoddart, the Distance d was measured as a simple linear distance. In the revised analysis, the distance was transformed to register travel time by taking into account varieties of terrain.
The first equation can in that case be written as:
Where w represents a transformation to take account of varieties of terrain. Implementing this model requires the following:
1. A tool that will determine the cost of traveling from a site to any point within the area of interest, in other words a routine for calculating d × w
2. A tool that will calculate the value of I, based on the value of d × w
3. A tool that will determine based upon the above, for a group of sites, which has the greatest I at a given point.
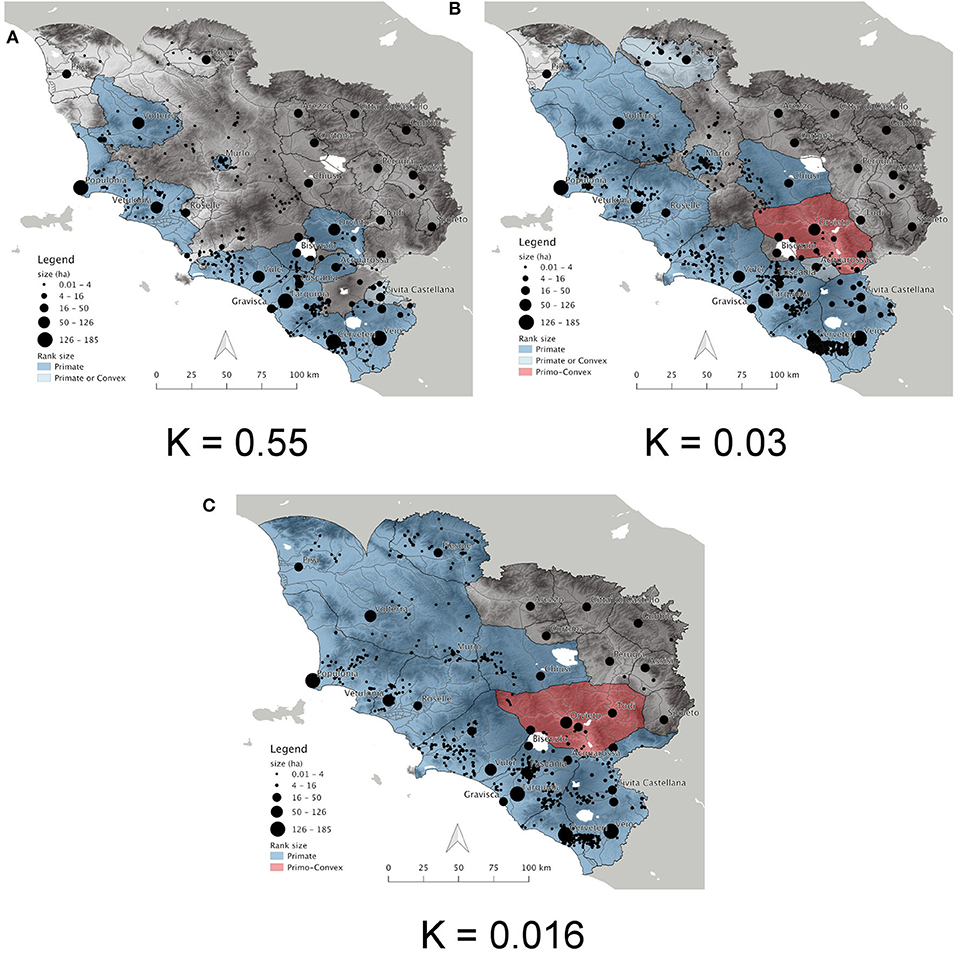
Figure 2. The open access rural data inserted into the territorial landscape defined by XTENT. (A) Iron Age/Orientalizing data. (B) Archaic data. (C) Post-Archaic data.
The ArcInfo GRID function pathdistance() (Environmental Systems Research Institute, 2001) calculates a least-accumulated cost model accounting for surveyor's distance and horizontal and vertical cost factors. This provides us with, for a given location within the area of interest, the value of d × w with respect to a particular site. Simple map algebra within GRID permits the calculation of I at all locations within the area of interest, for a given site. The ArcInfo GRID function upos() (Environmental Systems Research Institute, 2001) generates from a set of input grids an output indicating which grid has the highest value at a given location. The procedure requires as inputs a list of archaeological sites with co-ordinates, site names, site sizes (C), and a DEM. A least-accumulated cost model, in the form of a grid extending to the limits of the area of interest, is generated for each archaeological site. The influence I for each site is calculated using the least-accumulated cost models. A grid covering the area of interest with all cells = 0 is also generated. The grids containing I for each site, and the grid consisting entirely of zeroes are used as inputs to the upos() function.
The resulting output records the site with the greatest value of I at each location, or zero if all of the sites have a negative I at a particular location. The least-accumulated cost model does not presently incorporate any consideration of rivers, lakes, and the coast. The least-accumulated cost model only considers the cost of traveling away from an archaeological site. It should also be recognized that the resolution of the DEM was only 80 m. Further development of the model could take these factors into account. Nevertheless, we think that this resolution works reasonably well at the regional scale of analysis.
In the present exercise, the latitude and longitude were established using the Getty Thesaurus of Geographic Names Online or calculated at an appropriate level of precision from a map. As Etruscan specialists will know, there is much controversy considering the values of site sizes for Etruscan and Umbrian sites founded in the period 900–600 BC, since many of the estimates are based merely on topographic location. Where possible, the starting nucleation point in the Iron Age was taken, drawing on Pacciarelli (2000) for up-to-date consideration of this issue. Comparison was also made with the two main rank size studies of Etruria (Judson and Hemphill, 1981; Guidi, 1985) and, where information was still not forthcoming, the estimates provided by Mansuelli (1985). These estimates still left considerable gaps, and estimates have been made for Murlo, Pisa, Gubbio, Assisi, Città di Castello, Spoleto, and Todi based on personal experience. Given the fieldwork strategy at Murlo and the heavily wooded terrain it is difficult to be more precise. The estimate for Pisa recognizes the considerable fieldwork undertaken there in recent years, although it is very difficult to be precise about site size. The estimate for Chiusi has increased in recent years and the figure employed here is a compromise figure to reflect the greater understanding of its earlier history, including its polyfocality, than was understood before. The Umbrian site territories are of repeatedly similar size in lake basin catchments so the estimates give a reasonable illustration of the settlement process. The nature of the primate organization of Etruscan settlement permits the analysis of relatively small number of sites since these were generally dominant in their landscape, and the results would not have been affected by the introduction of the rural sites now available. However, there are some sites which could be included in further work, including Gualdo Tadino and Colfiorito on the Apennine margins, and, more importantly, Amelia and Terni in southern Umbria. One great advantage of XTENT is that the mapping can be repeated using different values to explore the consequences, and clearly the results of these changed values should be implemented in future work. These sizes were assimilated with those provided by Palmisano et al. (2017, 2018) and combined with the four unpublished data sets, and the data deployed are included as supplementary on-line open access information (where the contributing authors are ready to release them).
In any spatial analysis, boundary issues are a key consideration. The area of study was defined by the Tyrrhenian sea to the west, and the Apennines to the north and the east. To the south, the Tiber was taken as the key cultural boundary, and thus the effect of Latin and Sabine centres was not considered. Equally as already mentioned above, southern Umbria was only partly included in the analysis and the centres of Terni, Amelia, Narni, and Otricoli have not been included, but their presence has been predicted by the XTENT results as a political vacuum, filled by Veio in their absence. After these decisions, the area of interest for the purpose of the XTENT analysis was defined by buffering the sites at 2 × the mean nearest neighbour distance and then clipping this polygon with the Italian coastline and the course of the Tiber. The DEM was created by obtaining elevation data from the Shuttle Radar Topography Mission (Rosen et al., 2000) transforming it to a Transverse Mercator projection re-projecting it in point form to IT_ED50/UTM, and then generating an elevation model using topogrid (Environmental Systems Research Institute, 2001). The energy-cost model was based upon the measurements of the cost of traversing slopes by Minetti et al. (2002).
Rank-Size Analysis
The classic geographical approach to rank size is to plot the rank of sites against their size on logarithmic axes. Modern urban geographers noted that in well-developed urban systems this produced a straight (or lognormal) line, following the so-called rank size or lognormal rule where the second ranked site was half the size of the largest, the third ranked sites was one third the size of the largest, and so on (cf. Auerbach, 1913; Zipf, 1949). This simple observation has gradually attracted both interpretations and quantification. Interpretation has emphasized the tendency of mature urban systems toward the lognormal (Savage, 1997; Cristelli et al., 2012; Fulminante, 2014; Jiang et al., 2015). Rank-size graphs are plotted on a logarithmic scale and the Zipf's Law appears as a straight line from the upper left to the lower right corner of the plot (Figure 3AA). Settlement size distributions of archaeological sites rarely conform to the Zipf's Law and they can be shallower (convex distribution, Figure 3AB) or steeper (primate distribution, Figure 3AC). Heavily centralized urban systems, characterized by one or very few large centres and many smaller settlements, are considered primate (Johnson, 1977; Paynter, 1982; Ades and Glaeser, 1995; Falconer and Savage, 1995, p. 40; Drennan and Peterson, 2004). Less centralized systems, generally prior to urbanism, are described as convex and show settlements of equal size (Johnson, 1980; Paynter, 1982; Peterson and Drennan, 2011; Crema, 2013, 2014; Duffy, 2015). Besides, convex distributions can be the results of pulling two or more settlement systems of independent communities within the same spatial window of analysis (Johnson, 1977; Palmisano, 2017). The primo-convex distribution (Figures 3AD) could, instead, indicate the co-presence of a strongly centralized settlement system (primate distribution) imposed on a loosely integrated one (Johnson, 1977, 1980; Falconer and Savage, 1995, p. 41).
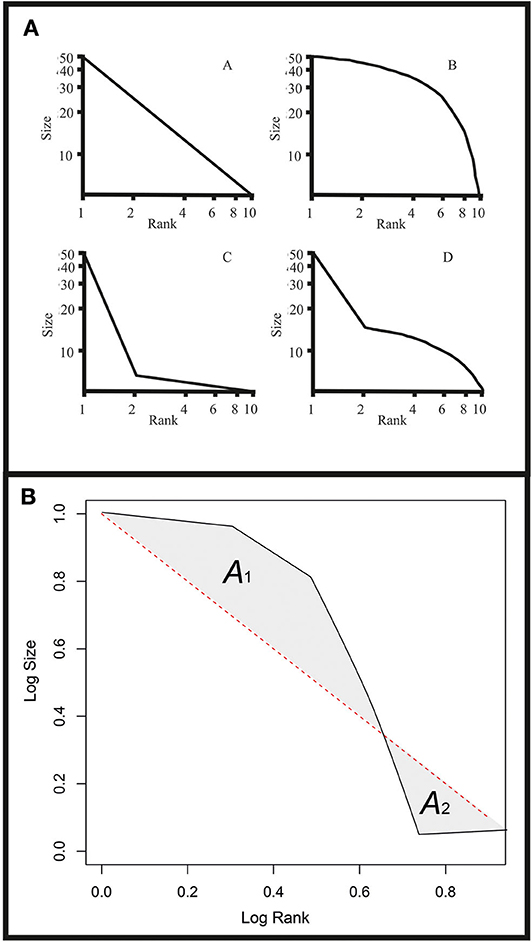
Figure 3. (A) Different types of Rank size curve. (A) Log normal Zipfian. (B) Convex. (C) Primate. (D) Primo convex. (B) Areas in a rank-size graph used as positive (A1) and negative (A2) components of the coefficient A. The red dashed line indicates the Zipf-Law.
Moreover, one very real problem of rank size analysis is that its results are profoundly affected by the boundaries of the system under analysis. This is a problem in archaeology because it is impossible to define the exact boundaries of a past polity or settlement system. In addition, the spatial scale of analysis affects the results in different settlement size distributions (cf. Drennan and Peterson, 2004, p. 535–539; Palmisano, 2017). Hence, we deploy XTENT as one solution to this problem, since XTENT defines the major, most probably politically independent, nucleations in any given landscape, and provides territories for them by following clearly specified principles.
One of the most useful aspects of the rank size analysis is as a measure of centralization, and a series of quantitative measures have been developed by Drennan and Peterson (2004) to establish indices of centralization and the degree of significance, an update on the earlier statistical Rank Size Index (RSI) (Johnson, 1981). They propose an A-coefficient, which calculates the proportion of the area between the Zipf's Law line and the observed rank-size curves (see also Crema, 2013, 2014; Palmisano, 2017 for the application of this method; Figure 3B). Hence, the area above and below the Zipf's Law will have, respectively, positive (A1) and negative (A2) values (Figure 3B). The maximum value for A1 is by definition 1, while A2 could exceed −1 for strongly primate systems where one or more observed settlements are smaller than the expected smallest settlement predicted by the Zipf's Law. As a result, convex curves will show positive A-coefficient values, while primate patterns negative values. In addition, a bootstrap method has been enabled to test the statistical significance of the A values (cf. Drennan and Peterson, 2004, p. 539–543). This technique calculates the 95% confidence interval of A values by resampling with replacement the observed settlement sizes with 1,000 samples randomly selected. By way of illustration, the rank-size of a putative XTENT-defined territory with 20 sites would be repeated with 1,000 random samples of 20 sites that can be compared with the observed original dataset. In this way, alternative patterns can be tested against the observed patterns. In each graph, the simulated samples (grey lines) are plotted against the observed patterns (dark line), such that a narrower envelope emerges for more certain outcomes and a wider envelope for less certain outcomes.
Measuring Centralization
A further analysis for measuring regional centralization consists of calculating the proportion of the total population within each concentric ring (or “donut”) radiating from a given urban centre. This exercise allows the calculation of the B-coefficient (see Drennan and Peterson, 2008), where the B value ranges between 0 and 1 (0 = no centralization at all; 1 = maximum centralization). The B-coefficient is calculated as follows. First, the territory of a given polity is divided into 10 concentric rings moving away from a given urban centre at a fixed distance of 1 km between rings. In the strongest possible centralized scenario, the innermost ring would contain the 100% of population (or the total estimated settlement's size) and the sum of the cumulative proportions would be 100 × 10 (n. of rings) = 1,000. In a non-centralized settlement system, the population would be distributed evenly and each ring would contain the 10% of the polity's population (or total estimated size) and the sum of the cumulative proportion would be 550 (= 10 + 20 + 30 + 40 and so on). The difference between the sum of cumulative proportions with maximum centralization (1,000) and no centralization at all (550) by using 10 concentric rings is 450. Therefore, the B-coefficient is calculated by subtracting 550 to the sum of the observed cumulative proportion and dividing the remainder by 450.
We used the R free software environment (version 3.6.1) for performing the rank-size analysis and measuring regional centralization (see Appendix A).
Results
Mapping the ESM Model
One of the predictions of the ESM model is that Voronoi [or Thiessen (1911)] polygons might represent the territories of the individual centres, and that an area of 1,500 sq km would be a likely surface area of individual territories (or polities in later literature). As a first step toward the analysis, the areas of the territory of individual centres were calculated on this basis in the 2011 article. The size of the territories relates to the level of packing (space for territory) in the landscape. As a consequence, in South Etruria, very few centres reach the 1,500 sq km threshold. Of the two that do, Veio is very understandable, but the power of Civita Castellana (Falerii Veteres) is greatly increased compared with expectations (although rivals such as Nepi and Narce were not included in this analysis). In North Etruria, the more spacious conditions permit seven out of 11 centres to achieve the predicted territory size. However, although Volterra's status is quite understandable, the role of Fiesole, Murlo, and Pisa was greatly increased compared with expectations. Interestingly it is the Umbrian fringe that conforms most consistently to the predictions, because it is here that equal spacing is most consistently followed in a sequence of lake basins. The match would probably be even better if Gualdo Tadino and Terni were brought into consideration (with a corresponding decrease in the area of Gubbio and Spoleto).
Presentation of the XTENT Results
For the comparative and heuristic purposes, we outline here the essence of the original 2011 article (Redhouse and Stoddart, 2011). Renfrew and Level argue that variations in the constant value k permit the mimicking of the developing political landscape and this principle was applied to Etruria. In this analysis nine values of k (0.1, 0.08, 0.07, 0.055, 0.03, 0.02, 0.018, 0.016, and 0.014) were applied while holding the f(C) constant at 0.5. For simplicity, three values of k (0.055, 0.03, and 0.016) are again presented here, although the full plots are presented elsewhere (Stoddart, 2020b). Higher values present very small territories. Lower values present the collapse of the political structure of the landscape, ominously suggesting the encroachment of power from the south by Rome, here represented by Veio, since Rome is not considered in the present exercise, and, if included, its size would have presented an even greater threat under the conditions of the XTENT model.
The complete sequence of three “phases” (Figures 2A–C) shows a number of interesting developments: the emergence of corridors of political vacuum, often anchored on river valleys, lakes, and prominent mountains; the survival of key intermediate-sized centres in the interstices between the major centres; a more rapidly maturing political landscape in the south of Etruria compared with the more widely spaced north; and a contrast between the developing disparities of territory size in the south and the regularities of territory size in the inner parts of Etruria and Umbria. For prehistorians, it is also useful to note that the independence of these large primate centres can be predicted from the use of XTENT without any resort to literary sources (cf. Spivey and Stoddart, 1990). For the purposes of the analysis in the present paper, the Iron Age/Orientalizing is hypothesized to match K = 0.055, the Archaic K = 0.03, and the Post-Archaic K = 0.016 (see Figure 2).
Under this analysis, the individual territories of Etruria and Umbria present some strikingly different trajectories. In South Etruria, three megacentres (Veio, Orvieto, and Vulci) present expansionist trajectories, although only Veio appears unstoppable in its development. History, of course, checked this occurrence by action from south of the Tiber, in the form of Rome. The territorial development of Tarquinia, and even to a greater extent of Cerveteri, was checked by enclosing polities. The check was such that Cerveteri could not achieve the 1,500 sq. km threshold unlike all the other large centres. Finally, three centres, Acquarossa, Civita Castellana, and Bisenzio were eliminated by their larger rivals during the Archaic (ca. 680–480 BC) and Post-Archaic (ca. 480–350 BC) periods. Of these predictions only that of Civita Castellana is controversial and is discussed more below. The contrast between the life histories of different centres and their accompanying territories is made explicit by the different developments of Acquarossa and Veio.
In North Etruria, long term development is dominated by the expansion of Volterra, unrivaled in its control of the hinterland of North Etruria and able to penetrate to the sea through the Arno valley during the Archaic and Post-Archaic periods (Figures 2B,C). Five other centres (Chiusi, Vetulonia, Populonia, Arezzo, and Fiesole) conform very well to the ESM predictions, and indeed enter some form of equilibrium just above the 1,500 sq. km level. Four other centres (Murlo, Roselle, Cortona, and Pisa) were eliminated or squeezed from the political landscape. Of these results that of Roselle is the most controversial and discussed more below. The contrast in trajectories is made clearest by comparing Chiusi's expansion with Murlo's decline during the Archaic and Post-Archaic periods. In eastern Etruria and Umbria, there is much more of an equilibrium. Five out of the six centres settle at a level in the region below the 1,500 sq km prediction of the ESM model, although there is some variation between Assisi, hemmed in by rival polities, and Gubbio with less marked constraints. The only centre whose demise is predicted is that of Todi under pressure from Orvieto from the east. An interesting contrast is visible in the development of Gubbio and Perugia. Perugia's territorial development is forced into a plateau, restrained by the packed nature of her political environment. Gubbio, still one of the largest modern local government districts today, had greater freedom to expand, only limited by the Apennines to the north and east (although Gualdo Tadino to the east was not considered in this analysis and may have provided check in this direction).
A more detailed analysis of the plot produced by the k = 0.03 (Figure 2B) value demonstrates the potential of the integration of XTENT as a heuristic technique for confronting archaeological and historical information. It is the errors as much as the predictions that are insightful. A brief analysis of the landscape from south to north reveals the following observations which build on an earlier analysis (Stoddart, 1990; Redhouse and Stoddart, 2011). The technique suggests that Veio is cut off from the sea by the territory of Cerveteri and that the Faliscan territory is taken over by Veio to the north during the Archaic Period (ca. 580–480 BC). These are both widely debated political issues. Some authors emphasize the overwhelming power of Veio (di Gennaro and Schiappelli, 2004; Cifani, 2005) whereas others prefer to emphasize the independent identity of the Faliscan territory (Colonna, 1990). This is a debate between demographic and spatial logic, and cultural and historical tradition. Further north, the patterns make good, and uncontroversial, geographical, and historical sense. The territory of Tarquinia neatly fits the catchment of the Marta river and is restricted by the medium-sized centres of Bisenzio and Acquarossa in the hinterland. The territory of Vulci has encroached on the Albegna valley to the north west, and is restricted by the medium-sized centre of Bisenzio and the high ground of Monte Amiata. This territory adjoins the border region of the Albegna valley which was a zone of instability in the early development of the Etruscan landscape, a point noted by the presence of unallocated political corridor when higher k values of XTENT are applied. It is in this corridor that, first a series of small unstable settlements—e.g., Marsiliana d'Albegna (Zifferero, 2010)—developed, and then the massive entrepot of Doganella (Perkins and Walker, 1990) precisely on the XTENT boundary.
Further north, the territory of Vetulonia has overtaken the territory of Roselle. In historical reality, the centre of Vetulonia went into decline and Roselle took over the more prominent role in the local area. This is the one instance where the results of XTENT clearly contravene the patterns of historical development, because the general patterns of spacing of primate centres are also contravened in this case. Local political conditions led to the changed concentration of power in these two centres. One contributing reason may be the importance of lagoonal areas and of the local river (Ombrone) in the development of Roselle and its communications with the interior. These are factors not considered in the present analysis. Another interesting prediction lies in the penetration of Populonia's power up the coast of Etruria into the Cecina valley (exploiting the low relief up the coast) and threatening Volterra's access to the sea. This is clearly another buffer area of unstable political centres, particularly during the Orientalizing period in an area which has been subject to recent field research (Terrenato, 1992; Regoli and Terrenato, 2000).
In the inland area of Etruria, three political territories and one upland area from south to north, Acquarossa, Bisenzio, Monte Amiata, and Murlo form a buffer zone between the coastal states and the inland states. Interestingly this buffer strip converges and overlaps with the line of volcanic lakes Bracciano, Vico, Bolsena that straddle the political boundaries to the south and, at a smaller scale, are also associated with small boundary centres such as Grotte di Castro. Behind this screen of political centres threatened by larger neighbours, there is the final large scale territory of Orvieto. Only this centre, straddling the river valley to the north, has the same scale of territory as some of the territories of its coastal rivals. This centre is crucial in providing the corresponding political pressure on Bisenzio and Acquarossa which went into decline and were replaced by the formal ritualization of political boundaries (Riva and Stoddart, 1996; Zifferero, 2002) once these centres had been absorbed into the larger territories.
Murlo to the north is a more controversial centre (Phillips, 1970; Cristofani, 1975; Torelli, 1983; Stoddart, 1995), in part because of the particular methodology of its exploration, in part because of a smaller scale of political operation. Recent work has shown that the centre, extensively explored as a source of material culture (Phillips, 1970, 1993; Phillips and Talocchini, 1980; Tuck et al., 2006; Shipley, 2017), did not operate in isolation (Campana, 2001) and was part of a small scale local network of sites (incorporated in the analysis below). This centre was also on a sensitive political boundary that stretched north to Castelnuovo di Berardenga (Mangani, 1985) and south to Poggio Civitella (Donati and Ceccarelli, 2002). The status of this boundary changed from a string of independent political entities (in the Orientalizing and Archaic) to a series of fortified sites between major political states (in the Hellenistic period); this phenomenon is best indicated by the changed role of Poggio Civitella to the south from small settlement to fortress, but also by the foundation of other fortified sites in the north Chianti region (Becker, 2002, 2008) that replaced sites such as Castelnuovo di Berardenga.
A series of sites—Chiusi, Cortona, Arezzo, and Fiesole—occupied the communication route up the Chiana river and extended along the Arno river reaching, after a further phase of political expansion, to Fiesole which in turn guarded access through the Apennines to the Po valley by means of the Mugello. The newly discovered Etruscan site at Gonfienti (Poggesi et al., 2005) appears to be yet another short-lived “boundary” site in succession to earlier centres at Artimino and Quinto Fiorentino. Although there is some recent discussion over the size of Chiusi (Cappuccini, 2010), which shows signs of expansion under the current reconstruction, all these centres were relatively small compared with the centres to the south and west. A combination of dense packing in the available space and size has led to a distinctively different arrangement of territories. To the east, a prominent landscape feature, the lake of Trasimene, again acted as a frontier. In this case, the lake was bisected by the boundaries of three states which underwent a comparable transition towards ritualization in the later phases (Paolucci, 2002). Perugia, the frontier Etruscan city (Ceccarelli and Stoddart, in press), supported by its greater demographic weight, and facilitated by the morphology of the Valle Umbra, projected east with a slightly larger territory, surrounded by smaller “Umbrian” neighbours. To the north and east, the Apennines provided a distinct physical boundary nicely emphasized by XTENT. In the south of Umbria, there appears to be a political vacuum which would be occupied by Terni were it to be included in the analysis. The inclusion of Terni and Amelia, as well as other smaller centres, would also block the advance of Veio into this area predicted by XTENT without their inclusion.
Settlement Hierarchy From Simple Site Size Histograms
The next step has been to provide simple presentational statistics of the site size frequency for the whole of Etruria combining the primate centres (from XTENT) and rural farmsteads (from the systematic surveys) (Figure 4). The results show the contrast between the profusion of small rural settlement and the small number of larger centres, already suggesting substantial primacy and regional centralization in the configuration of urbanism. The subsequent step is to show the same data (where size data have been collected) for each of the territories (Figure 5). These generally confirm the dominance of the primate centres during the Archaic period, which then evolved into full-scale urbanized societies. This analysis also shows that some of the data sets (Fiesole, Vetulonia, Orvieto, Tarquinia, and Veio) have potentially different administrative levels, adding an element of variation in the relationship between different cities and their rural populations. It must be noted these data sets conceal differences in data quality. One particular issue we will discuss later is that, whereas many of these territories have relatively good rural data sets and relatively good evidence for the size of the primate centre, the centres of intermediate size are not always captured within the survey area. Notably, we will return to the case of Chiusi later, where this problem is most critical.
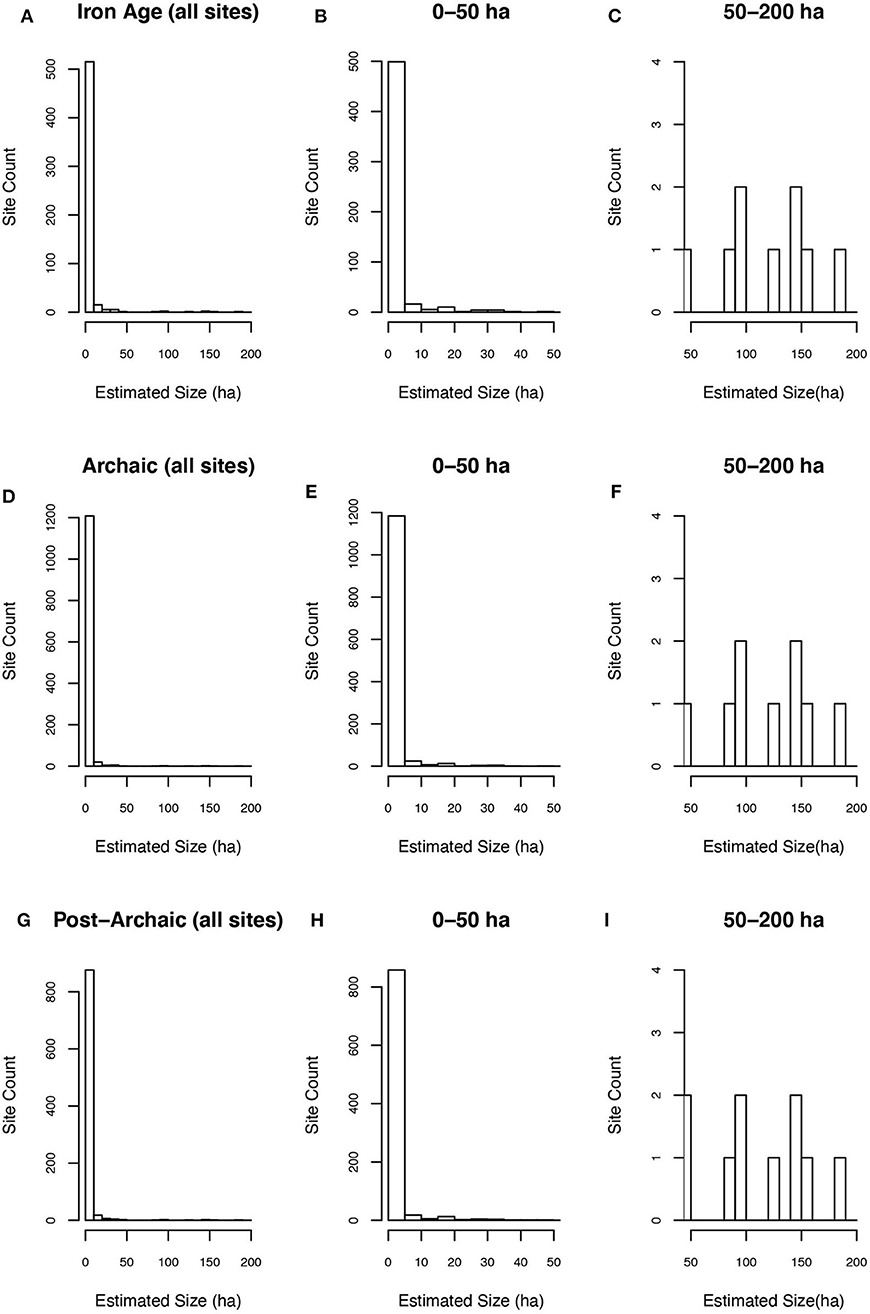
Figure 4. Histograms of site size frequency for Etruria by period. (A) All sites in the Iron Age and Orientalizing. (B) Iron Age and Orientalizing sites measuring 0–50 hectares. (C) Iron Age and Orientalizing sites measuring 50–200 hectares. (D) All sites in the Archaic Period. (E) Archaic sites measuring 0–50 hectares. (F) Archaic sites measuring 50–200 hectares. (G) All Post-Archaic sites. (H) Post-Archaic sites measuring 0–50 hectares. (I) Post-Archaic sites measuring 50–200 hectares.
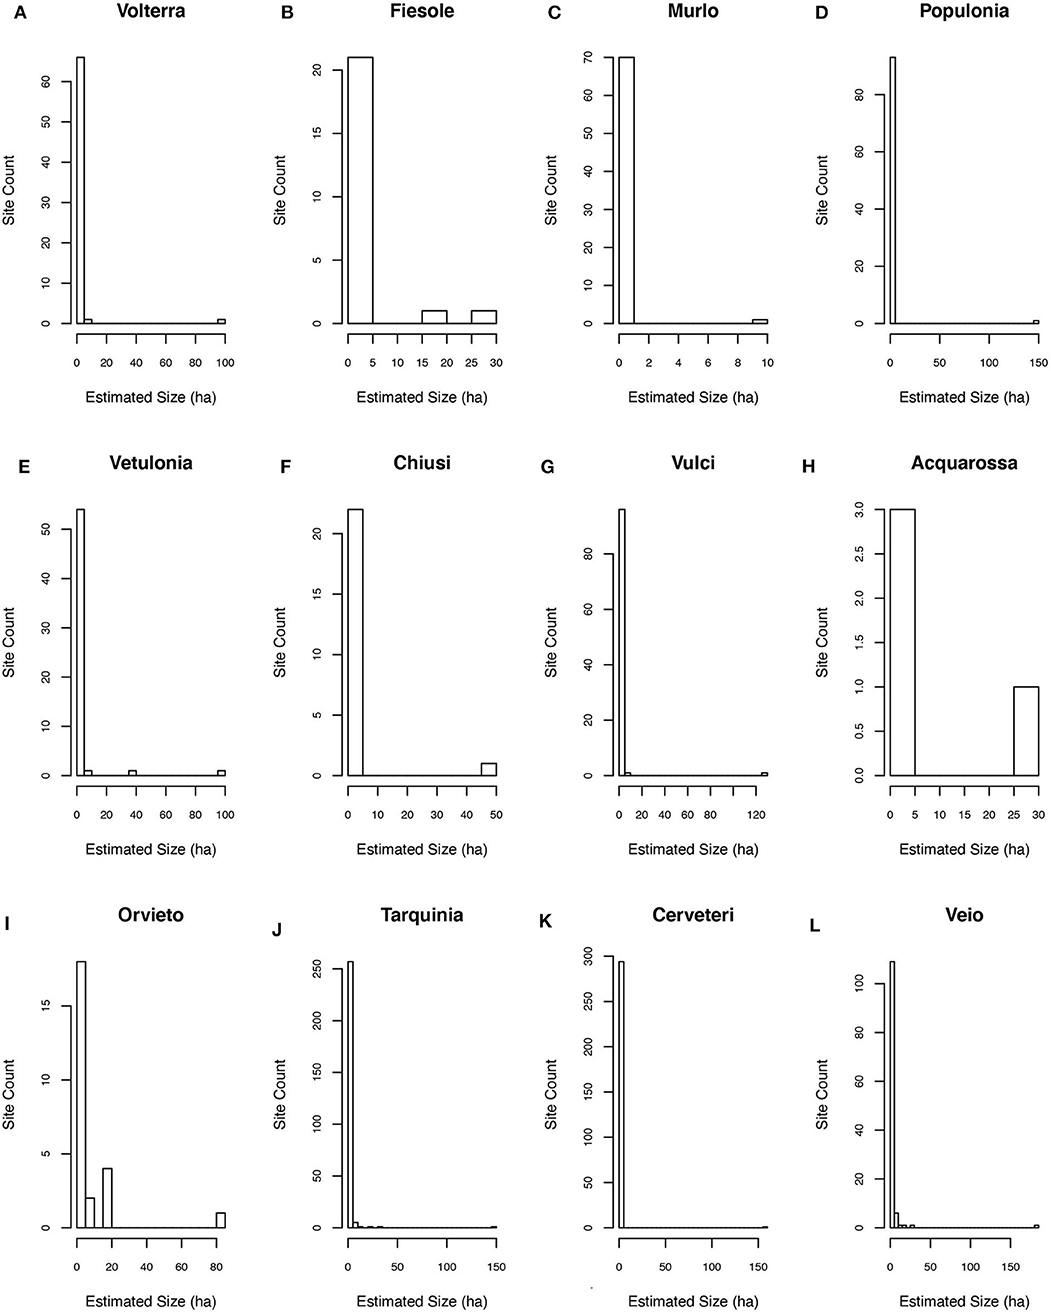
Figure 5. Histograms of settlement size for each city territory for the Archaic period. (A) Volterra, (B) Fiesole, (C) Murlo, (D) Populonia, (E) Vetulonia, (F) Chiusi, (G) Vulci, (H) Acquarossa, (I) Orvieto, (J) Tarquinia, (K) Cerveteri, (L) Veio.
Settlement Hierarchy Derived From Rank-Size Analysis
Table 1 provides a picture for Etruria of the central tendency and dispersion of settlements size (ha) in each period. We can see that the inter-quartile ranges (the 50% of values between the 3rd and the 1st quartiles values, that is between 0.07 and 0.5 ha) and the median between the Archaic and Post-Archaic periods differ only minimally, as confirmed by a Whitney–Wilcoxon test (p = 0.95). On the other hand, the interquartile range, and the mean between the Iron Age and the other two periods suggest general differences in settlement size distributions, as also confirmed by a Whitney-Wilcoxon test (p < 0.01). A notable difference in the Archaic period is the considerable increase in smaller rural settlement leading to the lower mean and a smaller standard deviation of site size. As a general trend, there was clearly more management of the countryside from within these smaller settlements.

Table 1. Summary of central tendency and dispersion of settlements size (ha) in Etruria.
Figures 6A–C shows rank-size analyses by using all the sites for each period. At a first glance, the size distributions appear similarly convex. The calculation of A-coefficients (Tables 2A–C) and the 95% confidence error ranges from the bootstrap method tell us that the rank-size curve is convex (Tables 2A–C). We can thus say confidently that the pattern is convex. As an extra precaution, since the rank-size in Figures 6A–C has a lower tail of very few settlements with size approximately equal to 0.1–0.01, the results might be distorted. Conventionally, urban geographers use the first 50/100 ranked sizes in a given area in order to avoid this “lower tail effect” (Hodder and Orton, 1976; Cristelli et al., 2012). For this reason, the analysis has been repeated for sites larger than 0.5 ha (Figures 6D–F). This provides better results and also avoids the distortion provided by a too skewed distribution arising out of very small sites. In this second scenario, the results show a more marked convex pattern (Tables 2D–F). On this basis, the results show convex curves in all the three periods. These results indicate that there was little political and economic integration among different competing city-states in Etruria between 1,000 and 350 BC. Literary evidence is not necessary to establish the differentiated political structure, since the convex curve of the rank-size provides convincing independent evidence on quantitative grounds.
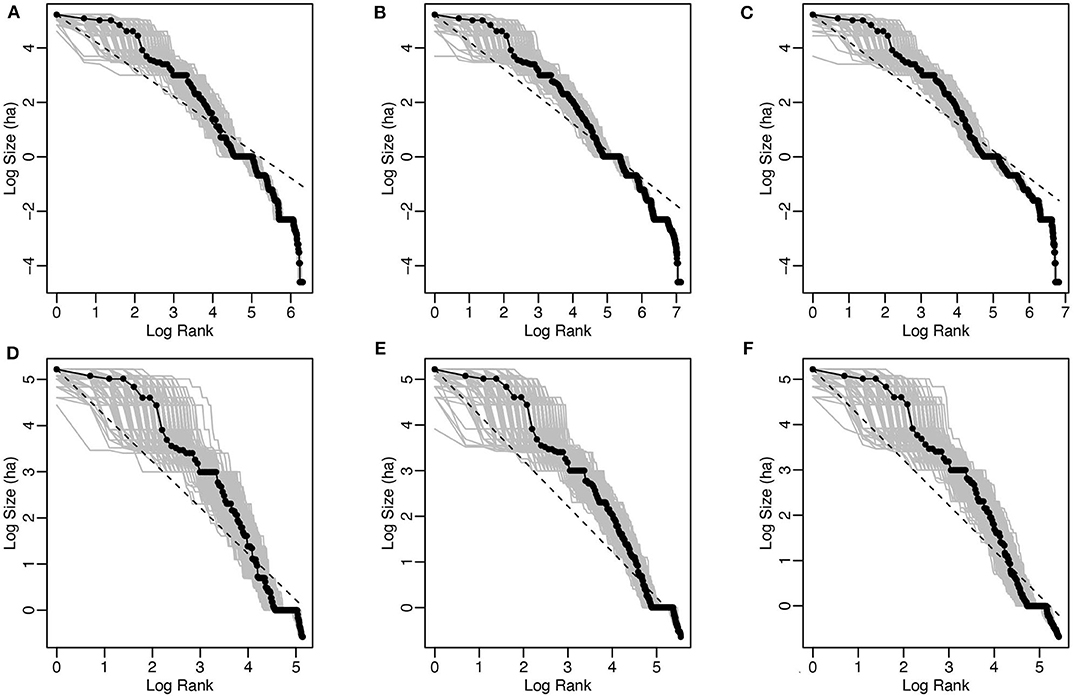
Figure 6. Rank size in Etruria. (A) All sites in the Iron Age and Orientalizing. (B) All sites in the Archaic period. (C) All sites in the Post-Archaic Period. (D) All sites larger than 0.5 ha. in the Iron Age and Orientalizing. (E) All sites larger than 0.5 ha. in the Archaic period. (F) All sites larger than 0.5 ha. in the Post-Archaic period. The dark line represents the observed data. The grey lines represent the bootstrap results performed on random samples of sites.
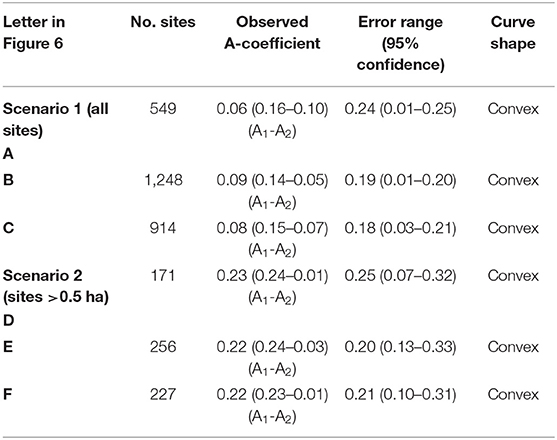
Table 2. A-coefficient values and bootstrapped error ranges for log scale rank-size curves in Etruria during the Iron Age/Orientalizing (Figures 6A,D), Archaic (Figures 6B,E), and Post-Archaic periods (Figures 6C,F).
After performing the above analysis on the whole of Etruria, we employ the XTENT model-defined territories in order to break down the study area into smaller political windows of analysis to investigate how settlement size distributions changed at the local scale. For this reason, we performed rank-size analyses for each XTENT model defined territories during the Iron Age/Orientalizing, Archaic and Post-Archaic periods. However, we were unable to run the analyses in all the territories because some of them do not contain sufficient data of both higher order settlement and rural settlement given the patchiness of the spatial coverage granted by the archaeological surveys carried out to date (or made available in open access, see Appendix A) in Etruria (see Figure 1B).
The rank-size analyses performed for the XTENT-defined territories during the Iron Age/Orientalizing period (ca. 1,020/1,000–580 BC) show strong primate patterns (Figure 7) and both the observed A-coefficients and the 95% confidence intervals show negative values (A2) exceeding −1, indicating that more than one observed settlements are smaller than the expected smallest settlement predicted by the Zipf's Law (see Table 3). Nevertheless, the results concerning Civita Castellana (Figure 7L) should be interpreted more cautiously given that their corresponding 95% confidence interval comprises also positive values which may indicate the possibility of a convex settlement pattern (see Table 3L).
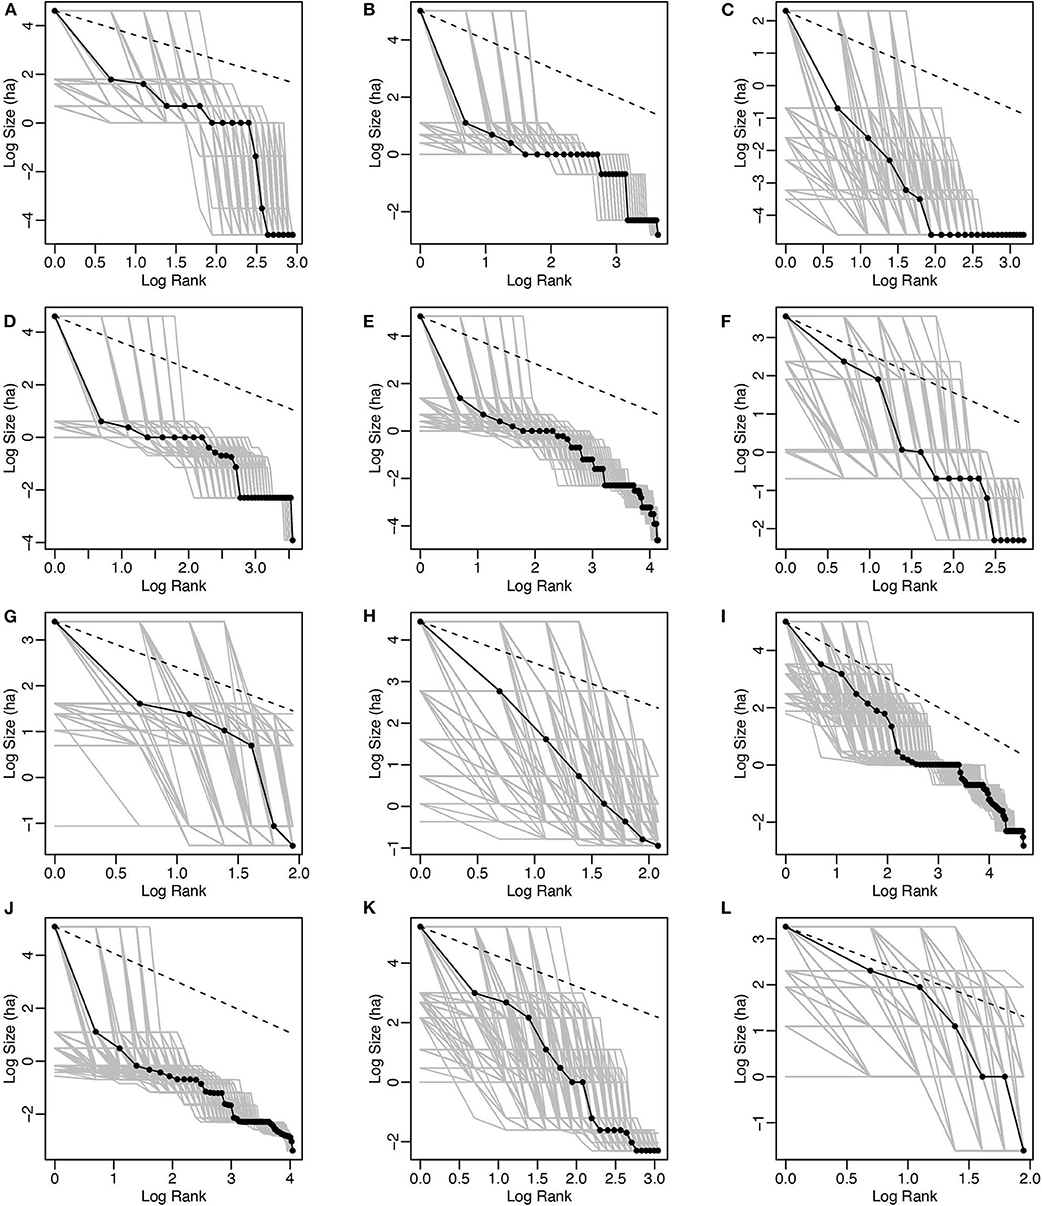
Figure 7. Rank size for the territories of Iron Age/Orientalizing centres with sufficient data points. (A) Volterra, (B) Populonia, (C) Murlo, (D) Vetulonia, (E) Vulci, (F) Bisenzio, (G) Acquarossa, (H) Orvieto, (I) Tarquinia, (J) Cerveteri, (K) Veio, (L) Civita Castellana. The dark line represents the observed data. The grey lines represent the bootstrap results performed on random samples of sites.
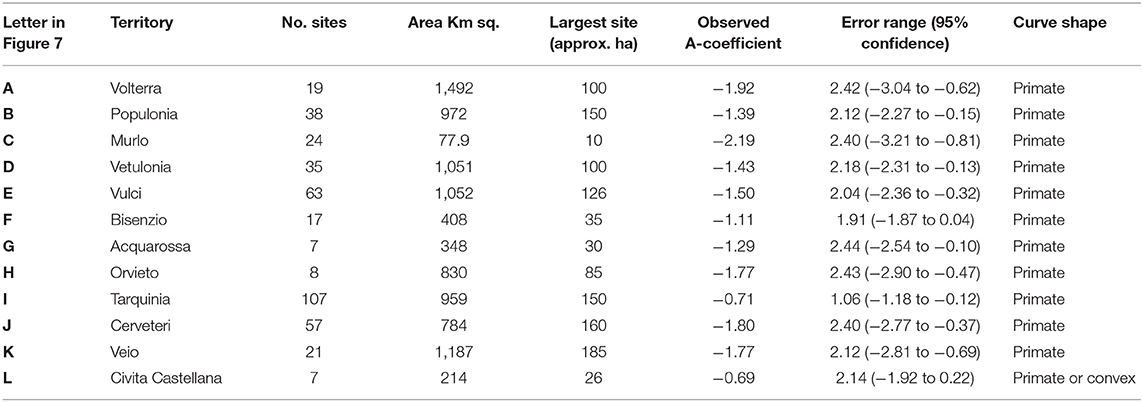
Table 3. A-coefficient values and bootstrapped error ranges for log scale rank-size curves of the XTENT-defined territories in Etruria in the Iron Age/Orientalizing.
The rank-size analyses performed for the XTENT-defined territories during the Archaic Period (ca. 580–480 BC) show similar strong primate patterns to the ones detected in the earlier periods (Figure 8 and Table 4). In this scenario, Fiesole (Figure 8B) and Acquarossa (Figure 8H) show patterns not as significantly primate, as suggested by the positive values in the 95% confidence interval (Tables 4B,H). Furthermore, the territory of Orvieto shows a primo-convex distribution (Figure 8I) with the overall A-coefficient (−0.51) resulting as the difference between the positive A1 values of the convex curve and the negative A2 values of the primate curve (Table 4I). The 95% confidence error range for A1 (0–0.37) and A2 (−0.22 to −0.95) indicates that the rank-size curve is significantly primo-convex (Table 4I). Finally, during the Post-Archaic period almost the totality of the XTENT defined territories show a strong primate pattern (see Figure 9 and Table 5) with the exception of Orvieto that is resilient with its primo-convex settlement system (Figure 9G and Table 5G).
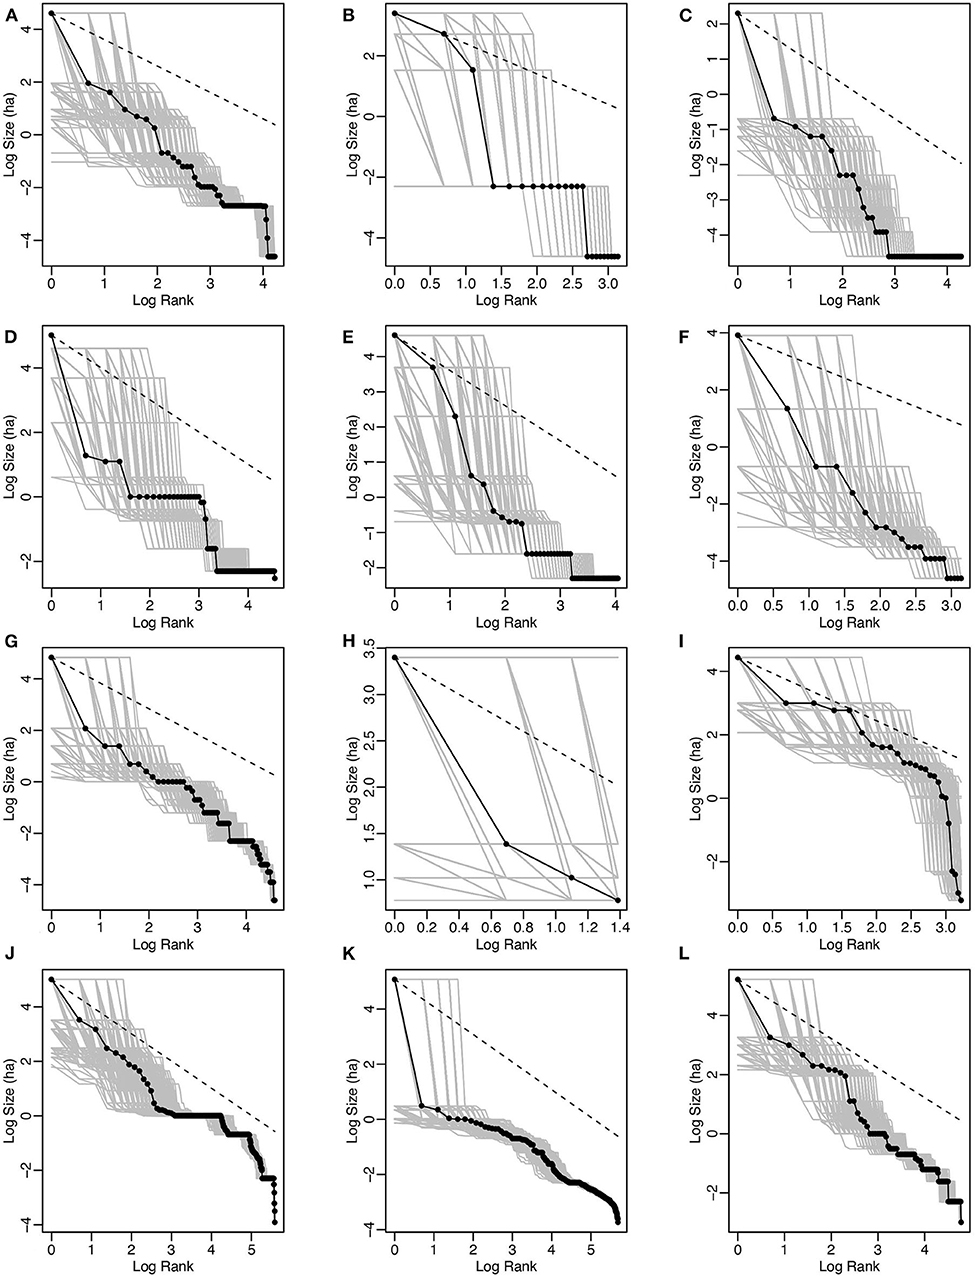
Figure 8. Rank size for the territories of Archaic centres with sufficient data points. (A) Volterra, (B) Fiesole, (C) Murlo, (D) Populonia, (E) Vetulonia, (F) Chiusi, (G) Vulci, (H) Acquarossa, (I) Orvieto, (J) Tarquinia, (K) Cerveteri, (L) Veio. The dark line represents the observed data. The grey lines represent the bootstrap results performed on random samples of sites.
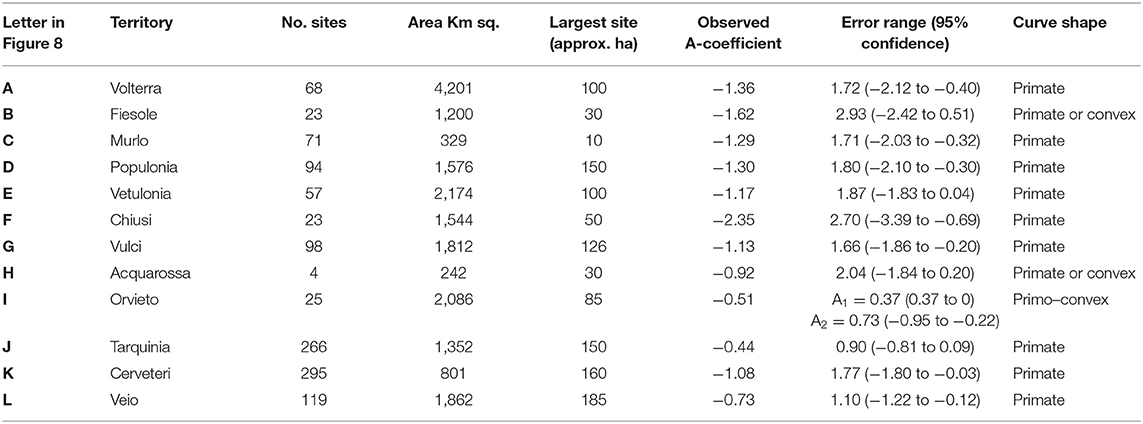
Table 4. A-coefficient values and bootstrapped error ranges for log scale rank-size curves of the XTENT-defined territories in Etruria in the Archaic period.
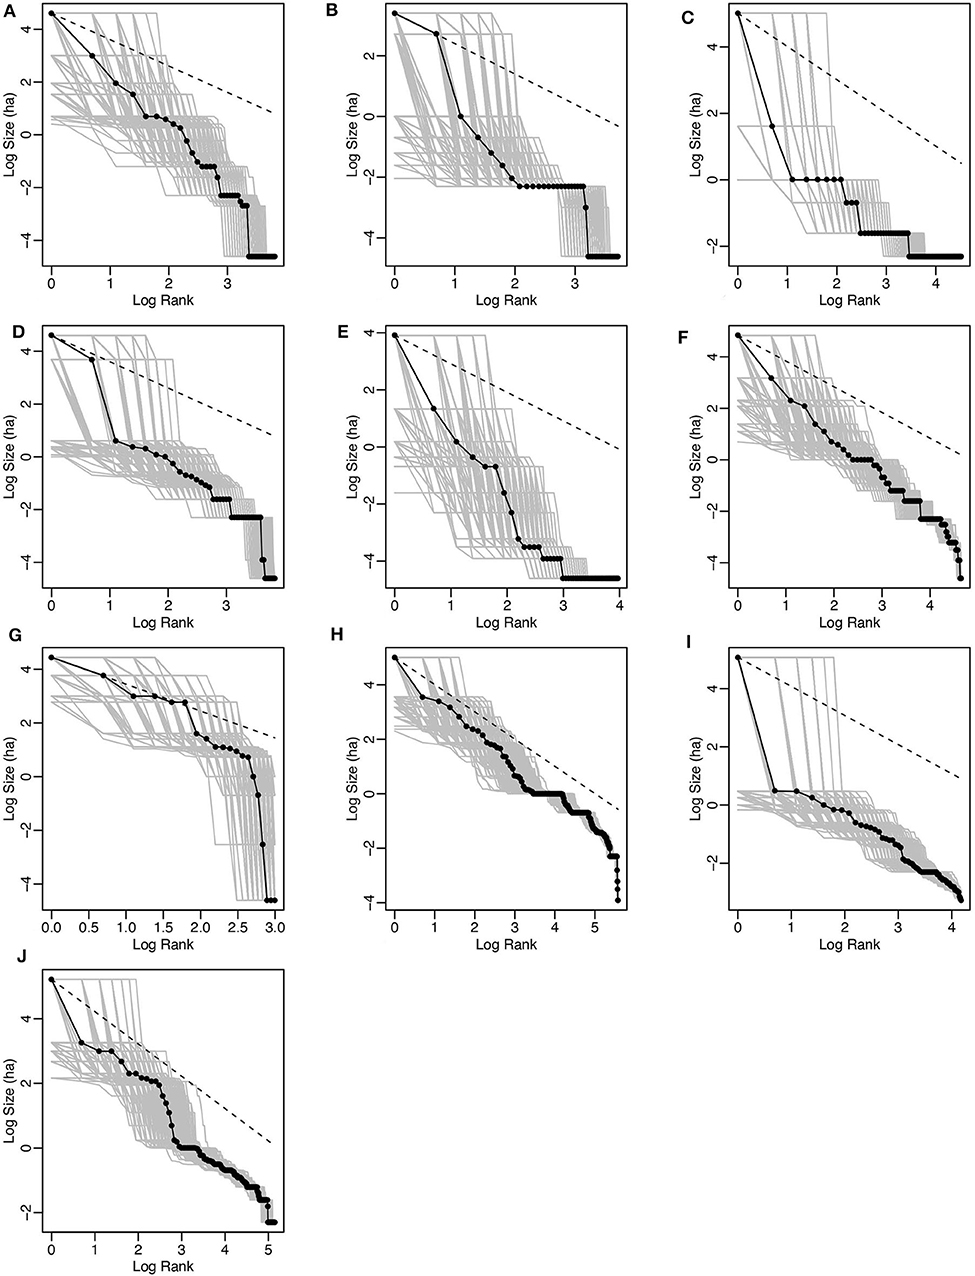
Figure 9. Rank size for the territories of Post-Archaic centres with sufficient data points. (A) Volterra, (B) Fiesole, (C) Populonia, (D) Vetulonia, (E) Chiusi, (F) Vulci, (G) Orvieto, (H) Tarquinia, (I) Cerveteri, (J) Veio. The dark line represents the observed data. The grey lines represent the bootstrap results performed on random samples of sites.
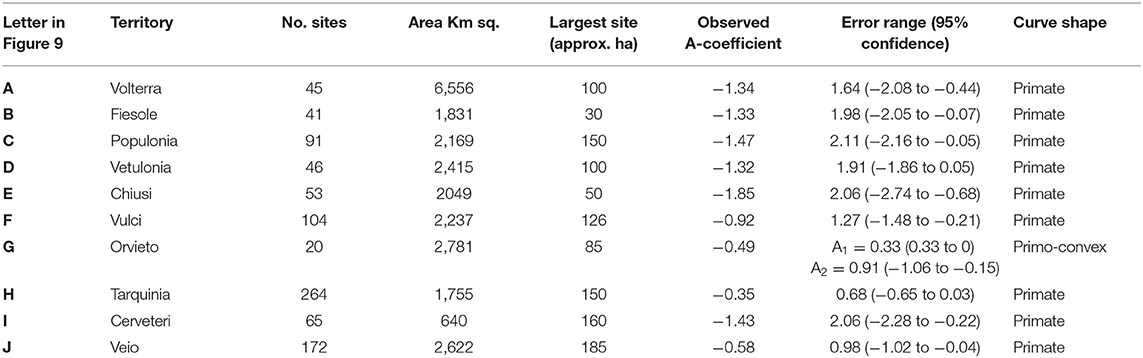
Table 5. A-coefficient values and bootstrapped error ranges for log scale rank-size curves of the XTENT-defined territories in Etruria in the Post-Archaic period.
Overall, it seems that in Etruria most XTENT-defined territories show a high settlement primacy from the early Iron Age to the Hellenistic period, which is typical of city-states (see Figure 2). We can conclude that first millennium BC and pre-Roman Etruria was marked by a fragmented landscape of politically independent and competing polities, in which each exerted a strong centralized form of control within its own territory. It is also significant to note that even the smaller, “delicate” centres that existed in the interstices between the larger urban centres for the most part had a similar primate organization.
These results, taken at face value, whilst all primate, show the considerable variability in the relationship between different Etruscan cities and their countrysides. In early cultural research, scholars had pointed out the considerable variation in the cultural identity of Etruscan cities (Stoddart, 2020a). Many later scholars (Haynes, 2000; Pacciarelli, 2000; Bartoloni, 2003; Riva, 2010; Gliwitzky, 2015; Bell and Carpino, 2016; Naso, 2017; Shipley, 2017; Smith and Lulof, 2017) have built on the recognition of this fact, but it was Banti (1960) who was the first to express this effectively and succinctly. Earlier spatial work (Redhouse and Stoddart, 2011), using XTENT as outlined above, has concluded that the territorial size of each city varied considerably as a response to their geopolitical position. More recent research has shown the differing densities and disposition of medium-sized centres around the primate centres (Stoddart, 2016, 2020b). The systematic inclusion of rural settlement reinforces this interpretation. The density of rural settlement in the surrounds of the Etruscan cities varied from the high density in an area like Cerveteri to the very low density in an area like Perugia, with substantial variation in the spatially intervening centres.
The rank size data reveal similarly variable patterns. The main cities are substantially primate in their profile, whereas those on the margins and in the weaker buffer zones (e.g., Bisenzio and Civita Castellana in the Iron Age; Acquarossa in the Archaic; and Orvieto on the margins of the main Etruscan distribution in the Archaic and Post-Archaic period) tend to have a primo convex profile, suggesting a different relationship between centre and territory.
There is also a considerable range in the degree of centralization as measured by the A-coefficient. Veio was the most expansionist of urban centres, starting as a highly primate centre (−1.77; Table 3K) that extracted population from its hinterland (Ceccarelli and Stoddart, 2007), thereafter moving toward a less strong primacy as its territory expanded (−0.73 and −0.58; Tables 4L, 5J). Cerveteri (−1.8; −1.08; −1.43; see Tables 3–5), its closest neighbour to the south east, had a territory hedged not only by the sea but by the powerful neighbours Tarquinia and Veio. This led to a notably more primate profile, where population was much more gathered within the precincts of the city and where perhaps the outlook was even more than Tarquinia toward the sea. This profile also fluctuated through time. The degree of centralization of buffer settlements, defined as those that do not survive the full sequence into the third phase (Civita Castellana, Bisenzio, Acquarossa, and Murlo), shows a much greater variability (−0.69 to −2.19), suggesting a wide gamut of strategies to survive in the political clutches of larger urban entities.
Regional Centralization
We measured local regional centralization for three urban centres providing robust settlement data from quite intensive archaeological surveys: Cerveteri, Murlo, and Tuscania. Figure 10 shows 10 concentric rings radiating out from these three urban centres and the graphed proportions of the total estimated settlement size within each ring (or “donut”). Cerveteri and Murlo show that most of the population concentrates in the innermost ring, while the successive rings (from the second onwards) show very low proportions of values (see Tables 6–10). Above all during the Iron Age and Post-Archaic period almost the total population is concentrated in the innermost ring (Tables 6, 8, 9). The high lines on the left side of the graph and the B-coefficient values ranging from 0.70 to 0.94 indicate that Murlo and Cerveteri exerted a high centralized control over the farming communities of their immediate surrounding hinterlands (Figures 10A,B). By contrast, Tuscania shows a more even distribution of the population across the 10 concentric rings. The lack of a very large urban centre superimposed on a tier of many smaller sites is indicated by very low B-coefficient values ranging from 0.06 to 0.24 (Figure 10C and Tables 12–14).
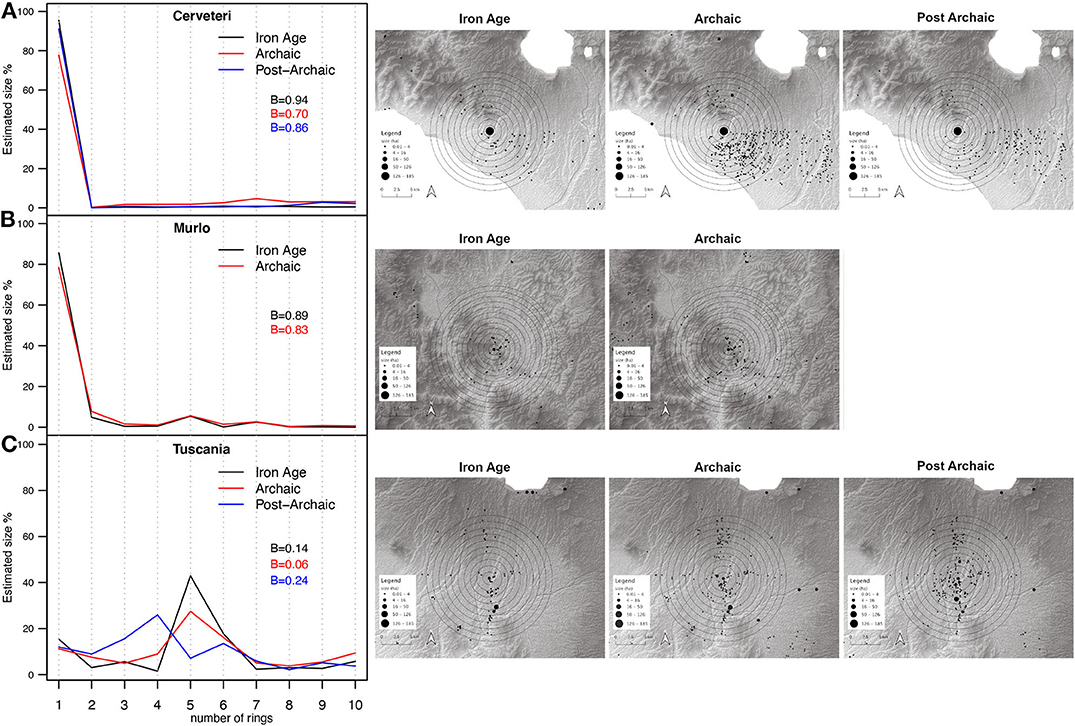
Figure 10. Graphs (left) and maps (right) showing the distribution of estimated settlements size across 10 concentric rings surrounding Cerveteri (A), Murlo (B), and Tuscania (C). The rings are ordered from innermost to outermost (left to right). Veio is not included in this analysis because of the absence of robust site size data. Murlo was not occupied in the Post-Archaic period.
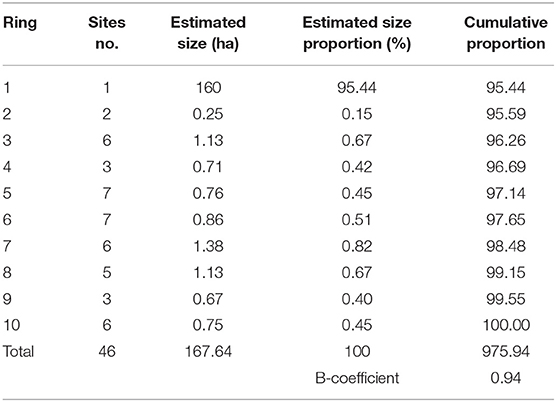
Table 6. Calculation of B-coefficient for Cerveteri in the Iron Age/Orientalizing period.
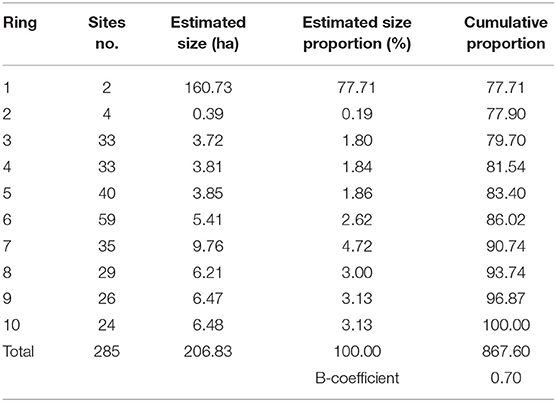
Table 7. Calculation of B-coefficient for Cerveteri in the Archaic period.
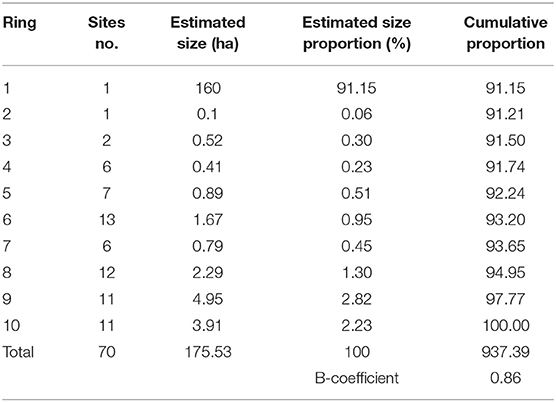
Table 8. Calculation of B-coefficient for Cerveteri in the Post-Archaic period.
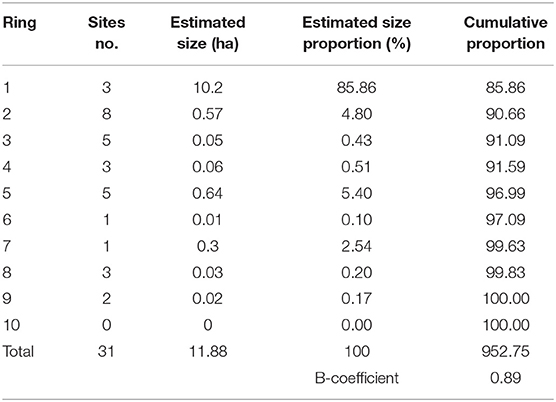
Table 9. Calculation of B-coefficient for Murlo in the Iron Age/Orientalizing period.
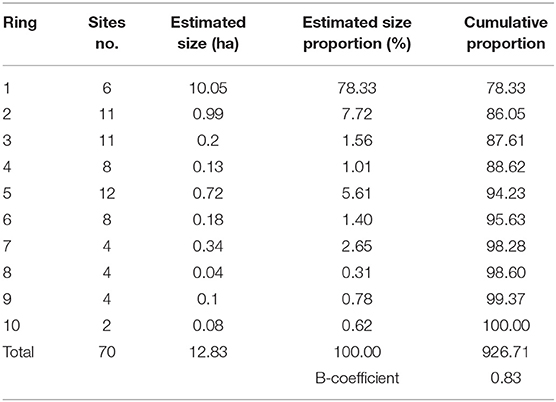
Table 10. Calculation of B-coefficient for Murlo in the Archaic period.

Table 11. Calculation of B-coefficient for Tuscania in the Iron Age/Orientalizing period.
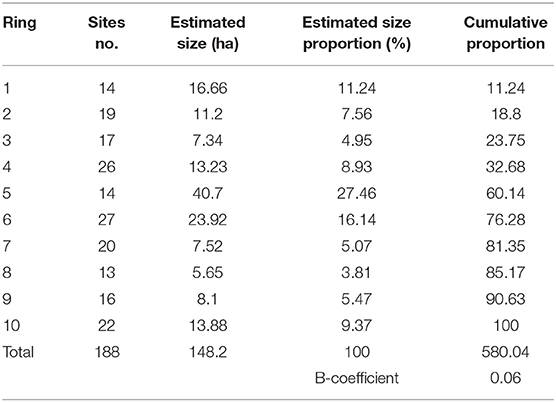
Table 12. Calculation of B-coefficient for Tuscania in the Archaic period.
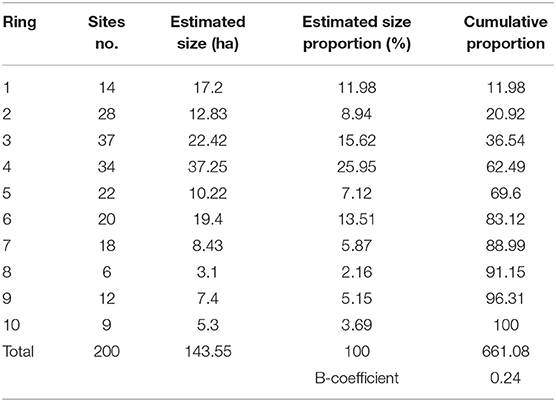
Table 13. Calculation of B-coefficient for Tuscania in the Post-Archaic period.

Table 14. A-coefficient values and bootstrapped error ranges for log scale rank-size curves of the XTENT-defined territories for updated data for Chiusi and Cerveteri in the Archaic period. See Figure 12B for reference.
Discussion
Data Assessment and Self-Critique
As can be seen in Figure 1B, and briefly mentioned above, the availability of data varies across the territorial landscapes defined by spatial coverage and intensity of the archaeological surveys carried out in the area, providing a current limit to the historical validity of the data. By comparison with the classic studies of state formation in the arid areas of the Near East, Mesoamerica, and South America (covered in Drennan et al., 2015), where similar techniques to ours have been applied, 100% survey in the Mediterranean is much more difficult to achieve. It will be immediately noted that data are unavailable for the eastern Etruscan territories of Arezzo, Cortona, and Perugia. In the first two cases, a systematic data extraction from disparate grey literature probably would provide some data infill for Figures 2B,C. By contrast, the lack of rural settlement in the territory of Perugia is much closer to historical reality and Figure 2C would be little changed if the data were provided (Ceccarelli and Stoddart, in press). The pattern for the Umbrian centres of Todi, Gubbio, Assisi, and Spoleto also matches the current picture, since rural settlement was almost completely absent in the periods under study, and the main features of the landscape would have been upland sanctuaries and hillforts (Stoddart and Redhouse, 2014), much closer to the networks of Samnium found in upland areas of central Italy. At the other extreme, the data collection for Cerveteri is much more comprehensive because the important south east quadrant of the territory has been subjected to systematic survey in a largely open agricultural area immediately adjacent to the urban centre (Enei, 2001). We can be fairly confident that we have a representative transect extending from the urban centre (surrounded by cemeteries) out into the countryside and the territorial boundary, most probably marked by sanctuaries (Riva and Stoddart, 1996). A similar confidence can be applied to Murlo where, in spite of the difficult wooded terrain above the river valleys, a systematic survey has been conducted by the University of Siena (Campana, 2001). This work provides an invaluable understanding of the territory that is complementary to the monument focused excavation at its centre (Phillips, 1993).
The data availability for Tarquinia, Vulci, and Chiusi lies somewhere between these extremes. In all these cases the main focus of survey recovery is at the limits of the territory toward the tentatively defined frontier even though the work is generally of high quality (Tarquinia: Quilici Gigli, 1970; Vulci: Carandini et al., 2002; Chiusi: Paolucci and Francovich, 2007). A crucial addition has been the acquisition of the more recent survey of Tuscania, defined as resting in the territory of Tarquinia by XTENT (Barker and Rasmussen, 1988). Equally crucial is the availability of data from the important region of Veio, gathered for many years by the British School at Rome (Patterson et al., 2000a) and now re-analyzed (Patterson et al., 2020). This complements the later work of Rajala (2007, 2013) around Nepi. At an interregional scale (e.g., Judson and Hemphill, 1981; Guidi, 1985; Palmisano et al., 2017, 2018) large data sets may allow general patterns to be detected even if there is data loss at a local level. At a more local level, such as analysis of individual territories, the impact of data loss and spatial skewing needs to be taken into account since these factors can affect satisfactory interpretation. On a selective basis we now take steps to illustrate the detection and rectification of this loss of information.
It must be emphasized that these results at the regional level require considerable attention to detail in order to assess political reality. It has already been noted that the sampling for rural settlement is sometimes poorly located within the territory and that an unsupervised presentation of the results even of relatively large data sets can create unexpected results. One example is the profile of Chiusi. The results presented by the data purely from the XTENT data and the rural survey data led to the unexpected result discussed earlier that Chiusi is expressed as consistently the most primate territorial organization of Etruria during the Archaic and Post-Archaic periods (A coefficient = −2.35 and −1.85, Tables 4F, 5E). A closer examination reveals that the data are composed of small rural settlements at the limits of the territory and that there was no inclusion of the intermediate size centres which have to be inferred from cemeteries ringing medieval and modern settlement closer to Chiusi (e.g., Castiglione del Lago, Città della Pieve, Cetona, Sarteano, Montepulciano, and Chianciano).
As an illustration of the rectification of this issue, new data for intermediate-sized settlement have been introduced for two urban centres, Chiusi and Cerveteri, drawing on Stoddart (2020b) for informed guesstimates of some of the missing data. For Cerveteri, the work has drawn on Guidi (1985) and Judson and Hemphill (1981) to gauge the best response. For Chiusi, a judicious combination of Bianchi Bandinelli (1927) and Google Earth has been deployed to the area of likely settlement areas associated with known cemeteries. The reworked data are presented here for both the territories of Chiusi and Cerveteri in the Archaic period as an illustration of the diagnostic procedures required when employing large data sets at a local level. These results are shown spatially (Figure 11) and as simple size classes (Figure 12A) and as rank size (Figure 12B). Similar problems most probably affect other territorial profiles to a less severe degree, but the situation with Chiusi illustrates the problem most clearly since the interpretation of political power within the territory changes completely. Chiusi is now close to Zipfian lognormal (Table 14) suggesting a much more balanced degree of centralization compared with most of the other Etruscan centres. It also has a newly deciphered stepped hierarchy of settlement (Figure 12Ba), raising questions of the relationship between Zipfian patterns and Christaller's (1933) ideal models. Cerveteri, by contrast, retains its status as a very powerful place distant in size from the next largest settlement (Figure 12Bb).
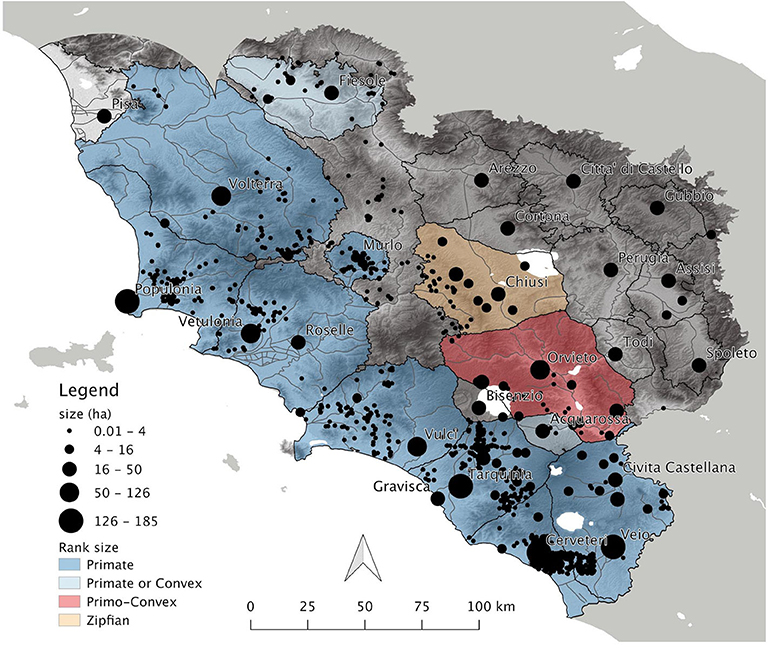
Figure 11. Presentation of new data for Chiusi (f) and Cerveteri (k) in spatial form.
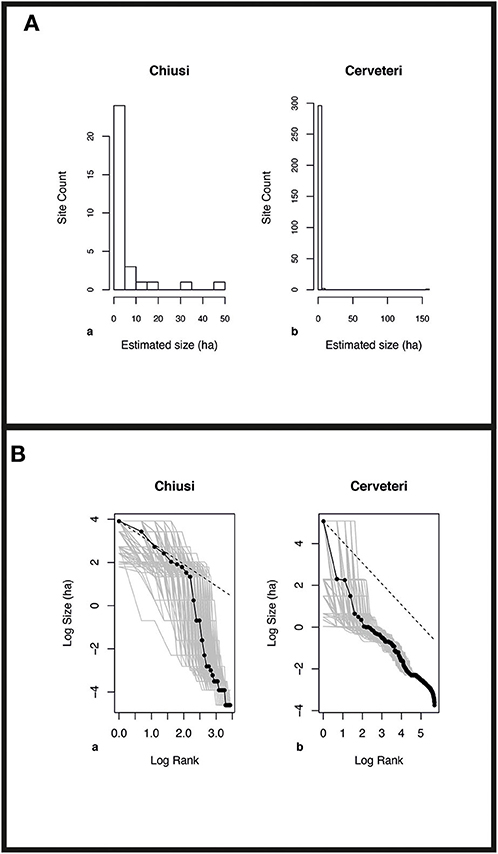
Figure 12. (A) Presentation of new data for Chiusi (a) and Cerveteri (b) as histograms of site size frequency. (B) Presentation of new data for Chiusi (a) and Cerveteri (b) as Rank Size.
Other problems can arise from boundary problems and system closure. In circumstances where more than one settlement system is pulled into the same analysis, a convex distribution of sizes may well result. The multi-scalar approach adopted here with the recognition of all the more significant nucleations, both the primate and the second-order nucleations, with boundaries determined by the XTENT technique, goes some way toward overcoming this potential problem.
The statistical (bootstrapping) approach taken here also guards against problems of statistical uncertainty. Where the simulated examples show a wide range between positive and negative value of the coefficient A, we should be more cautious of the interpretation. We can note that our qualitative observations about the data for Tarquinia (good) and Chiusi (less good) are substantiated by the statistical observations on this basis. In both the qualitative and quantitative assessments Tarquinia seems to be both statistically most robust and culturally clear. By contrast, Chiusi appears to be at the other extreme with the wide error range and to be counter intuitive to what might be expected culturally. As a variation on this theme, Civita Castellana, Fiesole, and Acquarossa show envelopes that cross the log normal boundary between convexity and primacy, suggesting another form of uncertainty (Tables 3L, 4B,H).
A further analysis was undertaken on the three most spatially robust data sets: Cerveteri (after the enhancement above), Tuscania (after the addition of the new data set), and Murlo. These are very different centres (as already discussed) but share similar qualities of data. Buffering of concentric areas moving away from the urban centre has been able to demonstrate the density of rural settlement (by number and area) as one moves away from the centre of urban power (Figure 10 and Tables 6–14). From this analysis, it appears that both the highly centralized primate centre (Cerveteri) and the opportunistic nucleated centre (Murlo), that ultimately failed to endure, were engaged in similarly strong strategies of centralization. By contrast, Tuscania, a subsidiary centre, was much less strongly nucleated.
More tentatively we can assess, in four cases, the distribution of the number of sites at increasing distance from the centre (Figures 13, 14). These latter results are affected by the survey sampling zones, but do reveal interesting differences in scale, clustering, and potential buffer zones, building on initial indications given by Rendeli (1993). These results are presented in two forms, the first (Figure 13) normalized on a scale from 0 to 1 in order to compare profiles independent of the very different sizes of the settlement in the three cases, the second (Figure 14) as raw densities, which we must caution may also be affected by the research intensity. The two primate centres show different profiles in the normalized results. Cerveteri presents a more concentrated profile of rural settlement (particularly before the Post-Archaic), perhaps constrained by its smaller terrestrial territory (Figure 13A). By contrast, Veio exhibits its expansionist territorial ambitions by a wider distribution of rural settlement (Figure 13D). The two smaller settlements, one subsidiary (Tuscania), the other “delicate” (Murlo) present a much more locally clustered profile, particularly if one bears in mind that Murlo itself did not exist in the Post-Archaic (Figures 13B,C). This profiling is supplemented by the evidence for the absolute density of settlement around these centres (Figure 14). These show the greatest density around the subsidiary centre of Tuscania, followed in turn by Cerveteri and Murlo, whereas Veio generally has the lightest density, compensated by its greater extension of higher density away from the urban centre. However, this picture is biased by the research intensity of the archaeological surveys carried out in the region. Unlike in the case of the other three centres, the area around Tuscania was intensively surveyed by using field-walking transects (cf. Barker and Rasmussen, 1988). Cerveteri and Veio have a halo of low density of rural settlement close to the urban centres perhaps partly occupied by cemeteries. In the case of Cerveteri, this takes the form of a denser band in the Archaic period at a distance between 3 and 6 km from the urban centre (Figures 14A,D). Although not covered in these diagrams, this is also the place to note the very low levels of density of Etruscan rural settlement in intensively surveyed areas such as the Cecina valley, at the limits of some northern Etruscan urban territories.
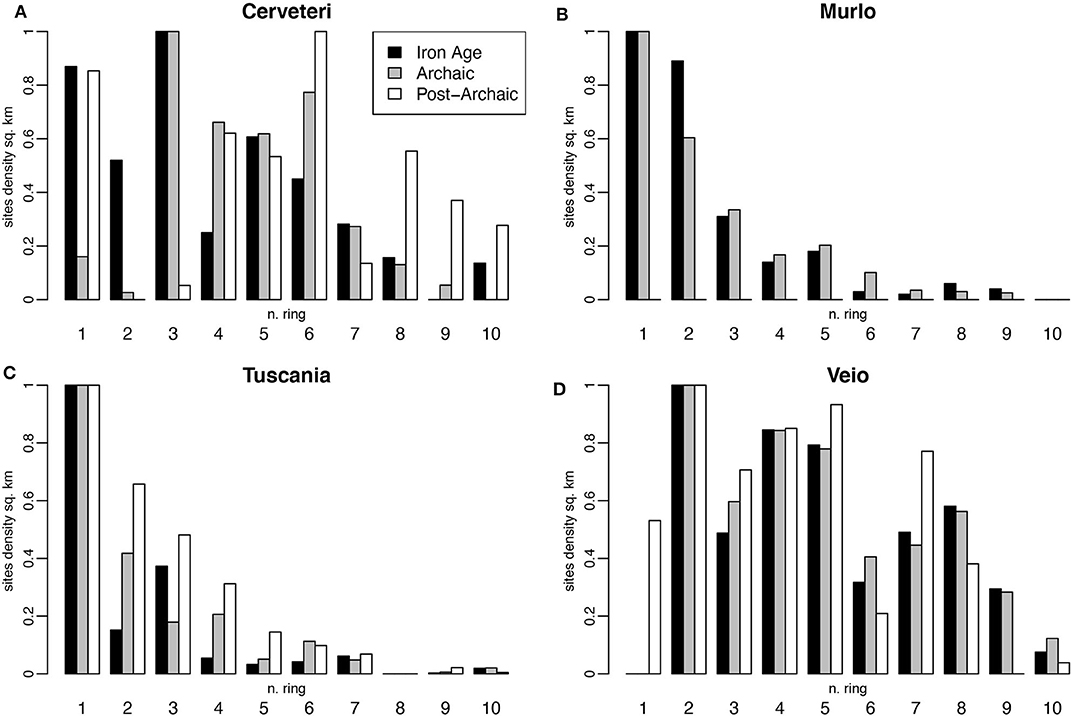
Figure 13. Normalized sites density at increasing distance (concentric rings) from Cerveteri (A), Murlo (B), Tuscania (C), and Veio (D). Murlo was not occupied in the Post-Archaic period.
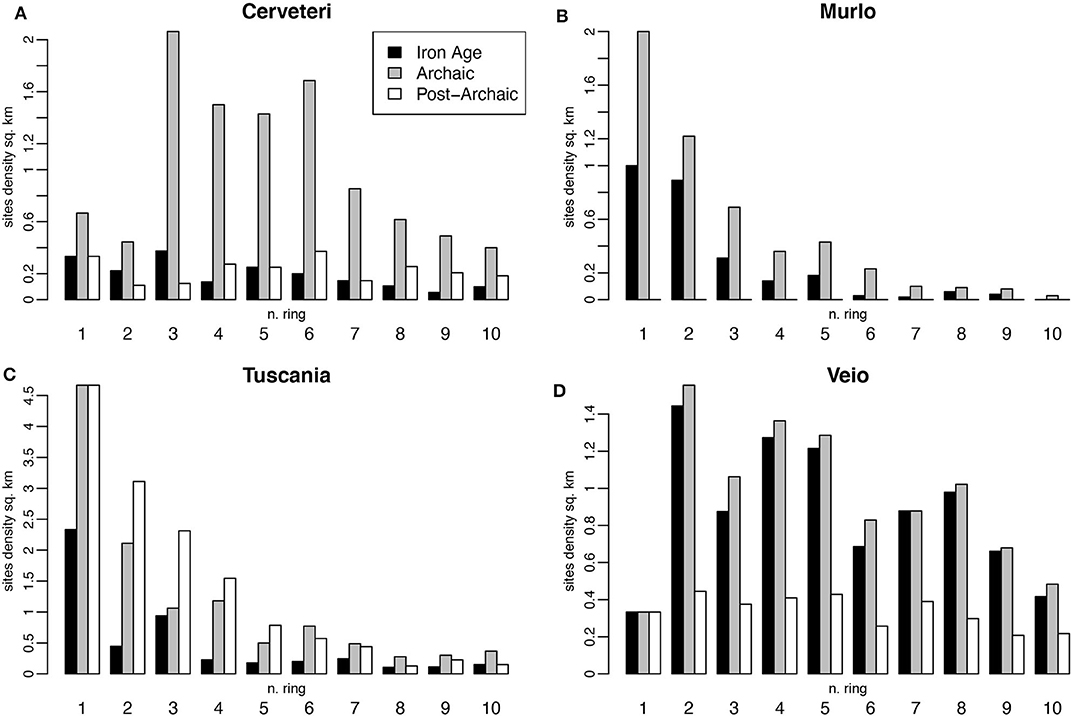
Figure 14. Sites density at increasing distance (concentric rings) from Cerveteri (A), Murlo (B), Tuscania (C), and Veio (D). Murlo was not occupied in the Post-Archaic period.
Finally, we performed a multi-scalar spatial statistics technique known as Ripley' K function to assess if the major 25 urban centres of Etruria were spatially clustered or segregated (see Ripley, 1976). We used Monte Carlo simulations of random point distributions to build a 95 per cent confidence envelope of the null hypothesis of complete spatial randomness (CSR) by carrying out 1,000 iterations (Bevan and Conolly, 2006, p. 220; Palmisano, 2013, p. 351). These estimates were then compared with the observed values of K (L) in order to obtain a statistically robust measure of a clustered or even point distribution in our study area (Figure 15). Sites are clustered when the solid line is above the grey envelope and evenly distributed when the line is below the grey envelope. From this analysis, it can be seen that the major centres are evenly distributed at a radial distance between 15 and 30 km. This would confirm the idealized pictures provided about the radius of 15–30 km of city–states (e.g., Hansen, 2000) and also informs us that the major centres shared the space evenly and established well-defined individual catchments, probably on the basis of land holdings, subsistence strategies, and local political identity. This analysis shows the general trends of Etruria at a supra-regional scale compared with the detailed variation shown by XTENT at the local/regional scale.
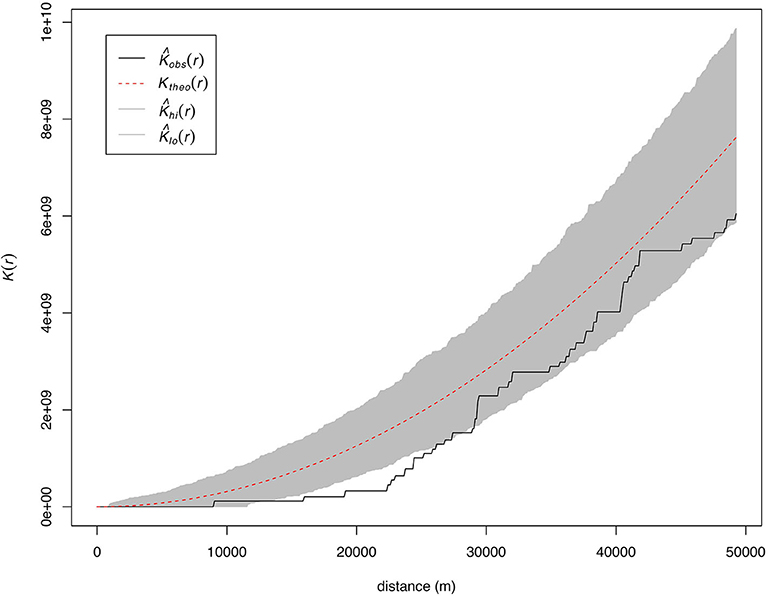
Figure 15. Multi-scalar point pattern analysis of the 25 major centres to assess clustering or evenness of spatial distribution. The black solid line describes the observed patterns. The grey envelope represents randomly generated points with a 95% confidence interval. The red dotted curve indicates the theoretical complete spatial randomness.
From Large Data to Urban Anthropology
These results point to the general processes of expanding territories from their centres and yet multiple local origins and outcomes in the development of Etruscan urbanism (Stoddart, 2018). We know enough of the economic infrastructure to establish the importance of a number of common factors. The first is the Mediterranean polyculture of cereals, vine and olive. The annual cycle of grain agriculture had been present for five millennia, but the longer term care of tree crops necessitated a protection of the landscape that tied in well with urbanism in more ways than simply providing a potable component for the feast (Stoddart et al., 2019). It required protection of a perennial resource close to the urban centre. The landscape was not opened up as much as in the Roman period, but pollen studies show that, at least at a local level, the vegetation was manipulated not only to provide cereal and tree crops, but also grazing for sheep, cattle, and pigs (Stoddart et al., 2019). In the area around the city of Veio, watercourses were manipulated to ensure the provision of sufficient water for crops, and many cities show the construction of wells and drainage systems to maintain a high living standard (Judson and Kahane, 1963). Some cities such as Veio in the south and probably Chiusi in the north specialized in agricultural production. Other cities, such as Populonia in the north, located close to the ore-bearing hills ranging toward Elba, specialized in iron production. Further cities, notably the coastal city of Cerveteri to the south, focused on trading activity. These essential developments enabled the foundation and maintenance of the stable nucleated centres, lasting very many generations, in contrast with a number of other contemporaneous civilizations, and yet setting up essential variations between them in the organization of their territories.
As we have seen from the XTENT analysis, there was one Etruscan city which could have created a different classical history: Veio, the most southerly Etruscan city. If it had defeated Rome, it is conceivable that a Veian empire would have come down to us today as the contemporary rival to the Han Empire of China, not the Roman empire every European citizen knows. If history had been different, we would have had an Etruscan historiography, that no doubt would have made disparaging comments about the defeated Romans, that would have given us a detailed mythological genealogy of Etruscan city foundations similar to Romulus and Remus, that would have outlined in some detail the great families through time (the descent groups of anthropology) and the politics of the time. It is no accident that these two rival cities, Veio and Rome, Etruscan and Latin, faced each other across the Tiber, displaced from the spatial centre of their respective cultures. Since each was dominant in its own political world, one was likely to prevail.
At the risk of social determinism, there was little risk of such an Etruscan empire. The reason lies in another account of Etruscan origins. This account derives from the specific nature of the political decision to move from a village society to one of nucleation or urbanism. This decision took place almost simultaneously between 1,000 and 900 BC in all five major cities—Veio, Orvieto, Cerveteri, Tarquinia, and Vulci—of Southern Etruria. We have seen it played out in the political landscape discussed above. The outcome was a relative equilibrium of like-sized and like-politicized communities (Figures 2, 15), where an internal tension existed between descent groups and community and an external tension between the urban communities themselves. But for the presence of Rome, Veio might have surfaced pre-eminent from this dynamic equilibrium; however the sack of Veio in 396 BC (according to the Romans) truncated this potential. The more probable outcome, even in the absence of Rome, would have been a long-standing rivalry between equally ranked cities, where no individual city was able to overcome its equally large neighbour. This is a pattern imprinted on the political landscape, as we have seen earlier in the paper (compare also discussion in Fulminante and Stoddart, 2013; Fulminante et al., 2017; Prignano et al., 2019; Fulminante, in press).
Some Etruscan origins were, however, unsuccessful, even before the intervention of Rome. The powerful stable centres outlined above had empty frontier zones at the edges of their territories that gave opportunity to other political origins. In these zones, particularly during the Orientalizing period, independently minded groups experimented with their own political organization, to varying degrees of success. This dynamic pattern had substantial similarity to the patterns of state formation noted in Africa by Kopytoff (1989), a process that he defined as the internal frontier. The dramatic image of a weather map where highs are surrounded by troughs offered opportunities for the discontented, those inflicted with witchcraft, to develop their own independent political opportunism. The political landscape of Etruria was anchored to the powerful places, but, with varying degrees of success, other centres attempted to forge their own political presence. Three zones can be identified where origins were failures at different scales. In the south, two relatively large centres, Bisenzio and Acquarossa, sheltered by a series of volcanic lakes, managed to maintain themselves for several centuries before they were squeezed out of existence by their even more powerful neighbours: Veio, Cerveteri, Orvieto, and Tarquinia. At the juncture between North and South Etruria, the Albegna valley system beyond the easy reach of Vetulonia to the north and Vulci to the south gave opportunity to two centres which followed one another in turn: Marsiliana in the eighth and seventh century and Doganella in the sixth century BC. Their origins were too unstable to prevail against the greater power of their neighbours or against Rome. Finally, in the Chianti zone of North Etruria, Murlo, and Castelnuovo Berardenga were small nucleated centres of great flamboyance, but destroyed, in the case of Murlo, on at least two occasions. In this latter case the origins of the Etruscans in the interstices between more powerful cities was fleeting and temporary.
As viewed from a perspective of modern social anthropology, origins are related to the construction of an identity at any given moment in time. What the Etruscans themselves saw as their own origins is one substantive answer to the question of where they came from. An understanding of this approach is restricted by the lack of their own literature to frame exactly their response, although many constructive attempts have been made from their visual culture. What archaeologists can reconstruct as an economic and political sequence is another valid approach and this is what this paper has achieved for the political landscape. Here scholars are on much stronger ground as new research on the individual cities and territories has become more sophisticated, filling previous gaps in research. A synthesis can draw on both approaches, since they form two perspectives of the same picture. Thus, it is clear that every city had its own individual identity, differing in economic specialization, funerary practice, degree of centralization, and territorial control. More tentatively from sources that include iconography, we can establish that each of these cities had their own mythological account, sometimes drawing on local legitimization, in the form of figures such as Tarchon for Tarquinia, sometimes drawing on exotic ambiguous figures such as Ajax, whose exploits Etruscans claimed from an external world. Language and, to a certain extent ritual, point to a wider cultural unity, but in a secondary sense. Late Etruscan accounts project a suspiciously detailed self-professed understanding of their construction of time that ranged from the organization of 8-day weeks into 8-month years and 10 saecula that started in 1,201 BC and continued until 83 BC (following the scheme of Pfiffig, 1975). Such detail was only possible, once they were part of the Roman world which offered their elite better opportunities.
Conclusion
This paper has combined multiple approaches of spatial analysis to investigate patterns of urbanism focussed in a sub-region, Etruria, and a sub-period, the central section of the first millennium BC. The approach we have employed is an amplification, improvement, and complementary extension of past work (Stoddart, 1987, 2016, 2020a,b). The innovation here has been to use a large dataset of rural settlement (Table 1) from Palmisano et al. (2017, 2018) and four further unpublished data sets to explore the spatial characteristics of Etruscan urbanism in a more comprehensive, systematic, quantitative, and questioning way than has been possible hitherto, to add to the focus of previous authors (e.g., Rendeli, 1993) on urbanism processes as manifested by the evidently powerful places of urban inhabitation. We can write about many origins of the Etruscans. Each of the large urban communities clearly had a profound sense of its origin which was also politically orchestrated through religion and sense of place, and space. There were many powerful places and thus many origins, some of which emasculated the origins and indeed existence of smaller places. The greatest place was ultimately and historically Rome, which produced its own annalistic account of its own and others' origins. These others included the Etruscans who were classified by the Romans as military rivals, pre-occupied with religion, overly fat, and characterised by powerful women. Nevertheless, by concentrating on the landscape dimension of Etruscan urbanism, we hope that this study can also contribute usefully to wider discussions of the archaeology of early urbanism, moving beyond the “Mediterranean myopia” that some New World Scholars (e.g., Blanton, 2001) have suggested to be present in the local tradition of research.
Data Availability Statement
All datasets generated for this study are included in the Appendix A of the paper.
Author Contributions
SS has taken the lead in proposing the project and synthesizing the results. AP whose previous work inspired the paper, provided the main body of rural data from his recent studies (Palmisano et al., 2017, 2018) within the territories defined by XTENT. He also executed the presentational statistics, rank size analyses, statistical assessments, and verification. DR previously worked with SS in completing a more sophisticated DEM-sensitive implementation of XTENT for the Etruscan area than the ones implemented previously by Harrison and Stoddart. The other co-authors have kindly contributed data on the Cecina Valley, Populonia, Tuscania, and Veio, substantially swelling the data set with systematically collected data. All authors contributed to the structure and argument of the paper.
Conflict of Interest
The authors declare that the research was conducted in the absence of any commercial or financial relationships that could be construed as a potential conflict of interest.
Acknowledgments
The publication of this paper was funded via an OPEN-AIRE grant to Dr. Francesca Fulminante through the University of Rome (Marie Curie Sklodowska Fellowship 628818- Past-People-Nets 2014–2016).
References
Ades, A. F., and Glaeser, E. L. (1995). Trade and circuses: explaining urban giants. Q. J. Econ. 110, 195–227.
Alessandri, L. (2015). Exploring territories: bubble model and minimum number of contemporary settlements. A case study from Etruria and Latium Vetus from the early bronze age to the early iron age. Origini 37, 175–199.
Alessandri, L. (2016). “Hierarchical and federative polities in protohistoric Latium Vetus. An analysis of bronze age and early iron age settlement organization,” in Early States, Territories and Settlements in Protohistoric Central Italy, (Corollaria Crustumina 2), eds P. Attema J. Seubers and S. Willemsen (Groningen: Groningen Institute of Archaeology), 67–82.
Barker, G., and Rasmussen, T. (1988). The archaeology of an Etruscan polis: a preliminary report on the Tuscania project. 1986 and 1987 seasons. Papers Br. Sch. Rome 56, 25–42.
Bartoloni, G. (2003). Le Società dell'Italia Primitiva: lo Studio delle Necropoli e la Nascita delle Aristocrazie. (Studi superiori 419). Roma: Carocci.
Becker, H. (2002). The Etruscan castellum: fortified settlements and regional autonomy in Etruria. Etrusc. Stud. 9, 85–95. doi: 10.1515/etst.2002.9.1.85
Becker, H. (2008). “Urbs, oppidum, castellum, vicus: settlement differentiation and landscape nomenclature in Etruria,” in La Città Murata in Etruria. Atti del XXV Convegno di Studi Etruschi ed Italici. Chianciano Terme. Sarteano. Chiusi. 30 Marzo - 3 Aprile (2005), ed. G. Camporeale (Pisa-Roma: Fabrizio Serra Editore), 73–80.
Bettelli, M. (1997). Roma: la Città Prima della Città: i Tempi di una Nascita: la Cronologia delle Sepolture ad Inumazione di Roma e del Lazio nella Prima Età del Ferro. Roma: “L'Erma” di Bretschneider.
Bevan, A. (2010). Political geography and palatial Crete. J. Mediterr. Archaeol. 23, 27–54. doi: 10.1558/jmea.v23i1.27
Bevan, A., and Conolly, J. (2006). “Multiscalar approaches to settlement pattern analysis,” in Confronting Scale in Archaeology, eds G. Lock and B. L. Molyneaux (New York, NY: Springer), 217–234.
Bianchi Bandinelli, R. (1927). Foglio 121 (Montepulciano). (Edizione archeologica della Carta d'Italia al 100,000). Firenze: Reale Istituto Geografico Militare.
Bintliff, J., and Sbonias, K. (1999). Reconstructing Past Population Trends in Mediterranean Europe (3000 B.C.-A.D. 1800). Oxford: Oxbow Books.
Bonghi Jovino, M. (2005). “Città e territorio. Veio, Caere, Tarquinia, Vulci: appunti e riconsiderazioni,” in Dinamiche di Sviluppo Delle Città Nell'etruria Meridionale. Veio, Caere, Tarquinia, Vulci. Atti del XXIII Convegno di Studi Etruschi ed Italici, Roma, Veio, Cerveteri/Pyrgi, Tarquinia, Tuscania, Vulci, Viterbo, 1 - 6 ottobre (2001), ed O. Paoletti (Pisa: Istituti editoriali e poligrafici internazionali), 27–58.
Botarelli, L. (2004). Radicofani. (Carta Archeologica della Provincia di Siena 7). Siena: Nuova Immagine Editrice.
Cambi, F. (1996). Il Monte Amiata (Abbadia San Salvatore). (Carta Archeologica della Provincia di Siena 2). Siena: Nuova Immagine Editrice.
Campana, S. (2013). Montalcino. (Carta Archeologica della Provincia di Siena 12). Siena: Nuova Immagine Editrice.
Cappuccini, L. (2010). “Dinamiche insediative a Chiusi nel VII e nel VI sec. A.C,” in L'Étrurie et l'Ombrie avant Rome. Cité et territoire. Actes du Colloque International Louvain-la-Neuve Halles Universitaires, Sénat académique 13-14 février 2004, ed. P Fontaine (Rome: Belgisch Historisch Instituut te Rome), 63–81.
Carandini, A., Cambi, F., Celuzza, M., and Fentress, E. (2002). Paesaggi d'Etruria. Roma: Edizioni di Storia e Letteratura.
Ceccarelli, L., and Stoddart, S. (2007). “The Faliscans,” in Ancient Italy. Regions without Boundaries, eds C. Riva, G. J. Bradley, and E. Isayev (Exeter: Exeter University Press), 131–60.
Ceccarelli, L., and Stoddart, S. (in press). “Perugia: the frontier city,” in Making Cities. Economies of Production Urbanisation in Mediterranean Europe 1000–500 BCE, eds J. Cutler, B. Dimova, B. Marin Aguilera, M. Gleba (Cambridge: McDonald Institute).
Cenni, F. (2010). Buonconvento. (Carta Archeologica della Provincia di Siena 8). Siena: Nuova Immagine Editrice.
Christaller, W. (1933). Die zentralen Orte in Süddeutschland. Eine ökonomisch-geographische Untersuchung über die Gesetzmäßigkeit der Verbreitung und Entwicklung der Siedlungen mit städtischen Funktionen. Jena: Gustav Fischer.
Cifani, G. (2003). Storia di una Frontiera. Dinamiche Territoriali e Gruppi Etnici nella Media Valle Tiberina dalla Prima Età del Ferro alla Conquista Romana. (Archeologia del territorio). Roma: Libreria dello Stato. Istituto Poligrafico e Zecca dello Stato.
Cifani, G. (2005). “I confini settentrionali del territorio veiente,” in Dinamiche di Sviluppo delle Città nell'Etruria Meridionale. Veio, Caere, Tarquinia, Vulci. Atti del XXIII Convegno di Studi Etruschi ed Italici, Roma, Veio, Cerveteri/Pyrgi, Tarquinia, Tuscania, Vulci, Viterbo, 1 - 6 ottobre (2001), ed O. Paoletti (Pisa: Istituti editoriali e poligrafici internazionali), 151–61.
Colonna, G. (1990). “Corchiano, Narce e il problema di Fescennium in la civiltà dei falisci,” in Atti XV Convegno di Studi Etruschi ed Italici (1987), eds G. Maetzke, O. Paoletti, and L. Tamagno Perna (Firenze: Olschki), 111–26.
Corsi, C. (2000). L'insediamento rurale di età romana e tardoantica nel territorio tra Tarquinia e Vulci. II parte. J. Ancient Topogr. 10, 205–276.
Crema, E. R. (2013). Cycles of change in Jomon settlement: a case study from eastern Tokyo Bay. Antiquity 87, 1169–1181.
Crema, E. R. (2014). A simulation model of fission–fusion dynamics and long-term settlement change. J. Archaeol. Method Theory 21, 385–404. doi: 10.1007/s10816-013-9185-4
Cristelli, M., Batty, M., and Pietronero, L. (2012). There is more than a power law in Zipf. Sci. Rep. 2:812. doi: 10.1038/srep00812
Cucini, C. (1985). “Topografia del territorio delle valli del Pecora e dell'Almo,” in Scarlino I. Storia e Territorio, ed R. Francovich (Firenze: All'Insegna del Giglio), 147–320.
di Gennaro, F., and Schiappelli, A. (2004). “Protohistoric Veii,” in Bridging the Tiber: Approaches to Regional Archaeology in the Middle Tiber Valley, ed H. Patterson (London: British School at Rome), 14–5.
di Gennaro, F., and Stoddart, S. (1982). A review of the evidence for prehistoric activity in part of South Etruria. Papers Br. Sch. Rome 50, 1–21.
Di Paola, G. (2018). Central place and liminal landscape in the territory of Populonia. Land 7:94. doi: 10.3390/land7030094
Donati, L., and Ceccarelli, L. (2002). Poggio Civitella (Montalcino, Siena). Le ricerche sull'insediamento etrusco. Rassegna Archeol. Classica Postclassica 19b, 9–43.
Drennan, R., and Peterson, C. E. (2004). Comparing archaeological settlement systems with rank-size graphs: a measure of shape and statistical confidence. J. Archaeol. Sci. 31, 533–549. doi: 10.1016/j.jas.2003.10.002
Drennan, R. D., Berrey, C. A., and Peterson, C. E. (2015). Regional Settlement Demography in Archaeology. New York, NY: Eliot Werner Publications, Inc.
Drennan, R. D., and Peterson, C. E. (2008). “Centralized communities, population and social complexity after sedentarization,” in The Neolithic Demographic Transition and Its Consequences, eds J.-P. Bocquet-Appel and O. Bar-Yosef (New York, NY: Springer Verlag), 359–86.
Ducke, B., and Kroefges, P. C. (2008). “From points to areas: constructing territories from archaeological site patterns using an enhanced Xtent model,” in Layers of Perception: Proceedings of the 35th International Conference on Computer Applications and Quantitative Methods in Archaeology (CAA), Berlin, Germany, April 2–6, (2007). (Kolloquien zur Vor- und Frühgeschichte 10), eds A. Posluschny, K. Lambers, and I. Herzog (Bonn: Dr. Rudolf Habelt GmbH), 245–251.
Duffy, P. R. (2015). Site size hierarchy in middle-range societies. J. Anthropol. Archaeol. 37, 85–99. doi: 10.1016/j.jaa.2014.12.001
Enei, F. (2001). Progetto Ager Caeretanus. Il Littorale di Alsium. (Ricognizioni archeologiche nel territorio di Ladispoli, Cerveteri e Fiumicino). Ladispoli: Comune di Ladispoli - Regione Lazio.
Environmental Systems Research Institute (2001). ArcInfo 8.0.1 for Solaris. Redlands, California: Environmental Systems Research Institute.
Falconer, S. E., and Savage, S. H. (1995). Heartlands and hinterlands: alternative trajectories of early urbanization in Mesopotamia and the southern Levant. Am. Antiquity 60, 37–58.
Felici, C. (2012). San Giovanni d'Asso. (Carta archeologica della Provincia di Siena 10) Siena: Nuova Immagine.
Francovich, R., Patterson, H., and Barker, G. (2000). Extracting Meaning from Ploughsoil Assemblages. Oxford: Oxbow.
Fulminante, F. (2014). The Urbanisation of Rome and Latium Vetus. From the Bronze Age to the Archaic Era. Cambridge: Cambridge University Press.
Fulminante, F. (in press). “Nucleated settlements as assemblages: a regional network approach to built environments,” in What If We Build This Here? Spatial Patterns, Community Organization, and Identity at Nucleated Settlements, (IEMA Distinguished Monograph Series), eds A. Gyucha and R. B. Salisbury (Buffalo: SUNY Press).
Fulminante, F., Prignano, L., Morer, I., and Lozano, S. (2017). Coordinated and unbalanced power. How Latin cities shaped their terrestrial transportation network. Front. Digit. Humanit. 4:4. doi: 10.3389/fdigh.2017.00004
Fulminante, F., and Stoddart, S. (2013). “Indigenous political dynamics and identity from a comparative perspective: Etruria and Latium Vetus,” in Exchange Networks and Local Transformations. Interactions and Local Changes in Europe and the Mediterranean from the Bronze Age to the Iron Age, eds E. Alberti and S. Sabatini (Oxbow: Oxford), 117–33.
Gliwitzky, C. (2015). Die Etrusker. Von Villanova bis Rom. Munich: Staatliche Antikesammlungen und Glyptotek München.
Guidi, A. (1985). “An application of the rank size rule to protohistoric settlements in the middle Tyrrhenian area,” in Papers in Italian Archaeology IV. Vol. 3. Patterns in Protohistory, eds C. Malone and S. Stoddart (Oxford: British Archaeological Reports), 217–42.
Guidi, A. (1989). “Alcune osservazioni sull'origine delle città etrusche,” in Atti del Secondo Congresso Internazionale Etrusco. Firenze 26 maggio - 2 giugno, (1985), eds G. Maetzke, M. G. Marzi Costagli, M. Iozzo, O. Paoletti, and E. J. Shepherd (Roma: Giorgio Bretschneider Editore), 285–92.
Guidi, A. (2010). Archaeology of the early state in Italy: new data and acquisitions. Soc. Evol. Hist. 9, 1–26.
Hansen, M. H. (2000). A Comparative Study of Thirty City-state Cultures: an Investigation. Copenhagen: Kongelige Danske Videnskabernes Selskab.
Hemphill, P. (2000). Archaeological investigations in southern Etruria. The Civitella Cesi survey. Skrifter Utgivna Svenska Inst. Rom 28, 1–150.
Hodder, I., and Orton, C. (1976). Spatial Analysis in Archaeology. Cambridge: Cambridge University Press.
Jiang, B., Yin, J., and Liu, Q. (2015). Zipf's law for all the natural cities around the world. Int. J. Geogr. Inform. Sci. 29, 498–522.
Johnson, G. A. (1977). Aspects of regional analysis in archaeology. Annu. Rev. Anthropol. 6, 479–508.
Johnson, G. A. (1980). Rank-size convexity and system integration: a view from archaeology Econ. Geogr. 56, 234–247.
Johnson, G. A. (1981). “Monitoring complex system integration and boundary phenomena with settlement size data,” in Archaeological Approaches to the Study of Complexity, ed S. E. Van der Leeuw (Amsterdam: Albert Egges Van Giffen Instituut voor Prae-en Protohistorie), 143–88.
Judson, S., and Hemphill, P. (1981). Sizes of Settlements in Southern Etruria. 6th-5th Centuries B.C., Vol. 49. Firenze: Studi Etruschi, 193–202.
Judson, S., and Kahane, A. (1963). Underground drainageways in southern Etruria and northern Latium. Papers Br. Sch. Rome 31, 74–99.
Kopytoff, I. (1989). The African Frontier: The Reproduction of Traditional African Societies Bloomington, IN: Indiana University Press.
Launaro, A. (2011). Peasants and Slaves: The Rural Population of Roman Italy (200 BC to AD 100). Cambridge: Cambridge University Press.
Mangani, E. (1985). “Castelnuovo Berardenga,” in Case e palazzi d'Etruria, ed. S. Stopponi (Milano: Electa - Regione Toscana), 155–63.
Mansuelli, G. (1985). “L'organizzazione del territorio e della città,” in Civiltà degli Etruschi. (Catalogo della Mostra), ed M. Cristofani (Milano: Electa), 111–20.
Mattingly, D. (2000). “Methods of collection, recording and quantification,” in Extracting Meaning from Ploughsoil Assemblages, eds R. Francovich, H. Patterson and G. Barker (Oxford: Oxbow), 5–15.
Milletti, M., Galluzz, G., Palone, V., and Pitzalis, F. (2010). “Scavi sulla sommità nord-orientale del Poggio del Telegrafo (POP): campagne 2007-2008,” in Materiali per Populonia 9, eds G. Baratti and F. Fabiani (Pisa: Edizioni ETS), 7–26.
Minetti, A. E., Moia, C., Roi, G. S., Susta, D., and Ferretti, G. (2002). Energy cost of walking and running at extreme uphill and downhill slopes. J. Appl. Physiol. 93, 1039–1046. doi: 10.1152/japplphysiol.01177.2001
Pacciarelli, M. (2000). Dal Villaggio alla Città: la Svolta Protourbana del 1000 a.C. nell'Italia Tirrenica. (Grandi Contesti e Problemi Della Protostoria Italiana 4). Firenze: All'insegna del Giglio.
Palmisano, A. (2013). “Zooming patterns among the scales: a statistics technique to detect spatial patterns among settlements,” in Archaeology in the Digital Era. Papers from the 40th Annual Conference of Computer Applications and Quantitative Methods in Archaeology (CAA), Southampton, 26-29 March (2012), eds G. Earl, T. Sly A. Chrysanthi P. Murrieta-Flores, C. Papadopoulos, I. Romanowska, and D. Wheatley (Amsterdam: Amsterdam University Press), 248–256.
Palmisano, A. (2017). Confronting scales of settlement hierarchy in state-level societies: upper Mesopotamia and central Anatolia in the Middle Bronze Age. J. Archaeol. Sci. Rep. 14, 220–240. doi: 10.1016/j.jasrep.2017.05.029
Palmisano, A., Bevan, A., and Shennan, S. (2017). Comparing archaeological proxies for long-term population patterns: an example from central Italy. J. Archaeol. Sci. 87, 59–72. doi: 10.1016/j.jas.2017.10.001
Palmisano, A., Bevan, A., and Shennan, S. (2018). Regional demographic trends and settlement patterns in central Italy: archaeological sites and radiocarbon dates. J. Open Archaeol. Data 6:2. doi: 10.5334/joad.43
Paolucci, G. (2002). “A ovest del Lago Trasimeno: note di archeologia e di topografia,” in Perugia Etrusca. Atti del IX Convegno Internazionale di studi sulla storia e l'Archeologia dell'Etruria, ed G. M. Della Fina (Roma: Annali della Fondazione per il Museo “Claudio Faina”), 1, 163–228.
Paolucci, G., and Francovich, R. (2007). Chianciano Terme. (Carta Archeologica della Provincia di Siena 9). Siena: Nuova Immagine.
Patterson, H., di Gennaro, F., di Giuseppe, H., Fontana, S., Gaffney, V., Harrison, A., et al. (2000a). The Tiber Valley project: the Tiber and Rome through two millennia. Antiquity 74, 395–403.
Patterson, H., Witcher, R. E., and Di Giuseppe, H. (2020). The Changing Landscapes of Rome's Northern Hinterland: The British School at Rome's Tiber Valley Project. Oxford: Archaeopress.
Patterson, J. R. (1987). Crisis, what crisis? Rural change and urban development in imperial Apennine Italy. Papers Br. Sch. Rome 21, 81–117.
Paynter, R. W. (1982). Models of Spatial Inequality: Settlement Patterns in Historical Archaeology. New York, NY: Academic Press.
Perazzi, P., and Poggesi, G. (2011). Carta Archeologica della Provincia di Prato. Firenze: All'Insegna del Giglio.
Perkins, P., and Walker, L. (1990). Field survey of the Etruscan city at Doganella. Papers Br. Sch. Rome 58, 1–144.
Peroni, R. (2000). “Formazione e sviluppi dei centri protourbani medio-tirrenici,” in Roma. Romolo, Remo e la Fondazione della Città. (Catalogo della Mostra), eds A. Carandini and R. Cappelli (Milano: Electa), 26–30.
Peterson, C. E., and Drennan, R. D. (2011). “Patterned variation in regional trajectories of community growth,” in The Comparative Archaeology of Complex Societies, ed M. Smith (Cambridge: Cambridge University Press), 88–137.
Phillips, K. M. (1970). “Speculations on Poggio Civitate,” in The Archaic Etruscan Sanctuary. (Catalogo della Mostra), eds K. M. Phillips and A. Talocchini (Florence: Olschki), 79–80.
Phillips, K. M. (1993). In the Hills of Tuscany. Recent Excavations at the Etruscan site of Poggio Civitate (Murlo, Siena). Philadelphia, PA: The University Museum of Pennsylvania.
Phillips, K. M., and Talocchini, A. (1980). Poggio Civitate. (Catalogo della Mostra). Firenze: Olschki.
Poggesi, G., Donati, L., Bocci, E., Millenacci, G., Pagnini, L., and Pallecchi, P. (2005). “Prato Gonfiente: un nuovo centro etrusco sulla via per Marzabotto,” in Culti, Forma Urbana e Artigianato a Marzabotto. Nuove Prospettive di Ricerca. Atti del Convegno di Studi. Bologna, S. Giovanni in Monte 3-4 giugno (2003), eds G. Sassatelli and E. Gori (Bologna: Ante Quem), 267–300.
Potter, T. W., and Stoddart, S. (2001). A century of prehistory and landscape studies at the British School at Rome. Papers Br. Sch. Rome 69, 3–34.
Prignano, L., Morer, I., Fulminante, F., and Lozano, S. (2019). Modelling terrestrial route networks to understand inter-polity interactions. A case-study from Southern Etruria. J. Archaeol. Sci. 105, 46–58. doi: 10.1016/j.jas.2019.02.007
Quilici Gigli, S. (1976). Blera. Topografia Antica della Città e Territorio. Mainz: Verlag Philipp von Zabern.
Rajala, U. (2007). The bronze and iron age finds from Il Pizzo (Nepi, VT): the results of the intensive survey in 2000. Papers Br. Sch. Rome 75, 1–37.
Rajala, U. (2013). The concentration and centralization of late prehistoric settlement in central Italy: the evidence from the Nepi survey. Papers Br. Sch. Rome 81, 1–38. doi: 10.1017/S0068246213000032
Redhouse, D., and Stoddart, S. (2011). “Mapping Etruscan state formation,” in State formation in Italy and Greece. Questioning the Neoevolutionist paradigm, eds N. Terrenato and D. Haggis (Oxford: Oxbow), 161–78.
Regoli, E., and Terrenato, N. (2000). Guida al Museo Archeologico di Rosignano Marittimo. Paesaggi e Insediamenti in Val di Cecina. Siena: Nuova immagine editrice.
Rendeli, M. (1993). Città aperte. Ambiente e paesaggio Rurale Organizzato nell'Etruria Meridionale Costiera durante l'Età Orientalizzante e Arcaica. Roma: Gruppi Editoriali Internazionali.
Renfrew, A. C. (1975). “Trade as action at a distance: questions of interaction and communication,” in Ancient Civilisations and Trade, eds J. A. Sabloff and C. C. Lamberg-Karlovsky (Albuquerque: School of American Research - University of New Mexico), 3–59.
Renfrew, A. C., and Level, E. V. (1979). “Exploring dominance: predicting polities from centres,” in Transformations, Mathematical Approaches to Culture Change, eds C. Renfrew and K. L. Cooke (New York, NY: Academic Press), 145–68.
Ripley, B. D. (1976). The second-order analysis of stationary point process. J. Appl. Probabil. 13, 255–266.
Riva, C. (2010). The Urbanisation of Etruria: Funerary Practices and Social Change, 700–600 bc. Cambridge: Cambridge University Press.
Riva, C., and Stoddart, S. (1996). “Ritual landscapes in archaic Etruria,” in Approaches to the Study of Ritual. Italy and the Mediterranean, ed J. B. Wilkins (London: Accordia), 91–109.
Rosen, P. A., Hensley, S., Joughin, I. R., Li, F. K., Madsen, S. N., Rodriguez, E., et al. (2000). Synthetic aperture radar interferometry. Proc. Inst. Elect. Electron. Eng. 88, 333–382.
Savage, S. H. (1997). Assessing departures from log-normality in the rank-size rule. J. Archaeol. Sci 24, 233–244.
Sewell, J. P., and Witcher, R. E. (2015). Urbanism in ancient peninsular Italy: developing a methodology for a database analysis of higher order settlements (350 BCE to 300 CE). Internet Archaeol. 40. doi: 10.11141/ia.40.2
Smith, C. J., and Lulof, P. S. (2017). “The age of Tarquinius Superbus: central italy in the late 6th century,” in Proceedings of the Conference ‘The Age of Tarquinius Superbus, A Paradigm Shift?’ Rome, 7–9 November 2013, (Babesch, Suppl. 29), Leuven: Peeters Publishers.
Stoddart, S. (1987). Complex polity formation in North Etruria and Umbria 1200-500 BC (Ph.D. thesis). University of Cambridge, Cambridge, United Kingdom.
Stoddart, S. (2007). The impact of landscape and surface survey on the study of the Etruscans. Etrusc. Stud. 10, 239–245. doi: 10.17863/CAM.27609
Stoddart, S. (2016). “Power and place in Etruria,” in Eurasia at the Dawn of History: Urbanization and Social Change, eds M. Fernández-Götz and D. Krausse (Cambridge: Cambridge University Press), 304–18.
Stoddart, S. (2017). Delicate Urbanism in Context: the Case of Pre-Roman German Urbanism. Cambridge: McDonald Institute.
Stoddart, S. (2020a). An Etruscan urban agenda: the weaving together of traditions. J. Urban Archaeol. 1, 88–121.
Stoddart, S. (2020b). Power and Place in Etruria. The Spatial Dynamics of a Mediterranean Civilisation. 1200-500 B.C. Cambridge: Cambridge University Press.
Stoddart, S., and Redhouse, D. (2014). “The Umbrians: an archaeological perspective,” in Entre Archéologie et Histoire: Dialogues sur Divers Peuples de l'Italie Préromaine, eds M. Aberson, M. C. Biella, M. Wullschleger, and M. Di Fazio (Genève: Université de Genève - Faculté des Lettres - Département des Sciences de l'Antiquité), 107–24.
Stoddart, S., and Whitehead, N. (1991). “Cleaning the Iguvine stables: site and off-site analysis from a central Mediterranean perspective,” in Interpreting Artefact Scatters. Contributions to Ploughzone Archaeology, ed A. J. Schofield (Oxford: Oxbow), 141–8.
Stoddart, S., Woodbridge, J., Palmisano, A., Mercuri, A.-M., Mensing, S., Colombaroli, D., et al. (2019). Tyrrhenian central Italy: regional land cover, vegetation and settlement. Holocene 29, 761–75.
Terrenato, N. (1992). “La ricognizione della Val di Cecina,” in Archeologia del Paesaggio, ed M. Bernardi (Firenze: Insegna del Giglio), 561–5.
Terrenato, N. (1996). Visibility and site recovery in the Cecina valley survey, Italy. J. Field Archaeol. 23, 91–109.
Torelli, M. (1983). “Polis e palazzo. Architettura, ideologia e artigianato greco in Etruria tra VII e VI sec. a.C,” in Actes du Colloque International Organisé par le Centre National de la Recherche Scientifique et L'École Francaise de Rome. (Rome 2-4 décembre 1980). Architecture e Société de l'Archaïsme Grec à la Fin de la République Romaine, (Paris-Rome: Centre National de la Recherche Scientifique - École Française de Rome, Palais Farnese), 471–99.
Tuck, A. S., Brunk, J., Huntsman, T., and Tallman, H. (2006). An Archaic Period Well From Poggio Civitate (Murlo). Available online at: http://www.ase.tufts.edu/archaeology/murlo/ (accessed October 2006).
Valenti, M. (1995). Chianti Senese (Castellina in Chianti, Castelnuovo Berardenga, Gaiole in Chianti, Radda in Chianti). (Carta Archeologica della Provincia di Siena 1). Siena: Nuova Immagine Editrice.
Valenti, M. (1999). La Valdelsa (Comuni di Colle Val d'Elsa e Poggibonsi). (Carta Archeologica della Provincia di Siena 3). Siena: Nuova Immagine Editrice.
Zifferero, A. (2002). “The geography of ritual landscapes in complex societies,” in New Developments in Italian Landscape Archaeology, eds P. Attema, G.-J. Burgers, E. van Joolen, M. van Leusen, and B. Mater (Oxford: British Archaeological Reports), 246–65.
Zifferero, A. (2010). Nuovi dati dall'agro vulcente: il progetto Marsiliana d'Albegna (2002–2009); new data from the territory of Vulci: the Marsiliana d'Albegna project (2002-2009). Archeol. Uomo Territorio 29, 1–44.
Zipf, G. K. (1949). Human Behaviour and the Principle of Least Effort. Cambridge, MA: Addison-Wesley.
Appendix A: Reproducibility and Supplementary Data
The raw dataset and the supplementary materials used in the present article have been deposited on the free accessible online repository Zenodo: https://zenodo.org/record/3735665. The digital archive related to this paper provides reproducible analysis in the form of six scripts written in R statistical computing language. The present repository contains also a R Markdown tutorial to drive step by step any practitioner interested in running some analytical tools to assess regional centralization and settlement hierarchies: site-size histograms, rank-size graphs, A-coefficient, and B-coefficient.
Keywords: urban—rural, urban development, Etruria, Mediterranean, city
Citation: Stoddart S, Palmisano A, Redhouse D, Barker G, di Paola G, Motta L, Rasmussen T, Samuels T and Witcher R (2020) Patterns of Etruscan Urbanism. Front. Digit. Humanit. 7:1. doi: 10.3389/fdigh.2020.00001
Received: 15 January 2019; Accepted: 05 June 2020;
Published: 02 September 2020.
Edited by:
Francesca Fulminante, University of Bristol, United KingdomReviewed by:
Ioanna N. Koukouni, Independent Researcher, Athens, GreeceFranco Cambi, University of Siena, Italy
Copyright © 2020 Stoddart, Palmisano, Redhouse, Barker, di Paola, Motta, Rasmussen, Samuels and Witcher. This is an open-access article distributed under the terms of the Creative Commons Attribution License (CC BY). The use, distribution or reproduction in other forums is permitted, provided the original author(s) and the copyright owner(s) are credited and that the original publication in this journal is cited, in accordance with accepted academic practice. No use, distribution or reproduction is permitted which does not comply with these terms.
*Correspondence: Simon Stoddart, c3MxNkBjYW0uYWMudWs=
†These authors have contributed equally to this work