 Joseph McDermott1*Drew Sturtevant1
 Umesh Kathad1*Sudhir Varma2*Jianli Zhou1Aditya Kulkarni1Neha Biyani1Caleb Schimke1
 William C. Reinhold2Fathi Elloumi2Peter Carr1Yves Pommier2Kishor Bhatia1
- 1Lantern Pharma Inc., Dallas, TX, United States
- 2Laboratory of Molecular Pharmacology, Developmental Therapeutics Branch, National Cancer Institute, Bethesda, MD, United States
Over the last decade the next-generation sequencing and ‘omics techniques have become indispensable tools for medicine and drug discovery. These techniques have led to an explosion of publicly available data that often goes under-utilized due to the lack of bioinformatic expertise and tools to analyze that volume of data. Here, we demonstrate the power of applying two novel computational platforms, the NCI’s CellMiner Cross Database and Lantern Pharma’s proprietary artificial intelligence (AI) and machine learning (ML) RADR® platform, to identify biological insights and potentially new target indications for the acylfulvene derivative drugs LP-100 (Irofulven) and LP-184. Analysis of multi-omics data of both drugs within CellMinerCDB generated discoveries into their mechanism of action, gene sets uniquely enriched to each drug, and how these drugs differed from existing DNA alkylating agents. Data from CellMinerCDB suggested that LP-184 and LP-100 were predicted to be effective in cancers with chromatin remodeling deficiencies, like the ultra-rare and fatal childhood cancer Atypical Teratoid Rhabdoid Tumors (ATRT). Lantern’s AI and ML RADR® platform was then utilized to build a model to test, in silico, if LP-184 would be efficacious in ATRT patients. In silico, RADR® aided in predicting that, indeed, ATRT would be sensitive to LP-184, which was then validated in vitro and in vivo. Applying computational tools and AI, like CellMinerCDB and RADR®, are novel and efficient translational approaches to drug discovery for rare cancers like ATRT.
Introduction
The National Cancer Institute’s (NCI) NCI-60 human tumor cell line screens have been used in early-stage drug development since 1990 and have allowed researchers to identify, characterize, and assess the anti-tumor activities of drug compounds in 60 tumor cell lines across nine cancer types (Shoemaker, 2006). Using integrated metabolomic and Next Generation Sequencing technologies, the NCI-60 cell lines have been extensively characterized under basal conditions as well as in response to over 20,000 drug compounds (Rajapakse et al., 2018). The CellMiner Cross Database (Luna et al., 2020) was developed by the NCI to facilitate the exploration and analysis of the drug response data from the NCI-60 cell line screens. The online CellMinerCDB portal can map integrated drug responses and processed multi-omic data to each of the NCI-60 cell lines (Reinhold et al., 2017; Reinhold et al., 2019; Luna et al., 2020) including levels of RNA expression, proteomics, DNA methylation, genetic mutations, copy number variations, metabolomics, and microRNAs. Through the CellMinerCDB web portal, researchers can also conduct analysis such as drug-molecular feature correlation, drug activity comparison, and biomarker identification. These tools have facilitated a better understanding of existing and newly developed compounds with preclinical data by benchmarking and in-depth comparisons of drug response (Reinhold et al., 2017; Reinhold et al., 2019; Luna et al., 2020).
Although the NCI-60 screen has been critical for understanding the underlying biology and drug response of major cancer types, it does not contain cancer cell lines for all cancer types including rare and ultra-rare cancers. There is an urgent and unmet clinical need for therapies for these cancers as they often lack efficacious standard of care treatments and research funding to study them. Computational tools-based drug discovery could potentially accelerate drug development for rare diseases therapies by providing insights into a drug, Mechanism of Action (MoA), correlated biomarkers, or gene expression patterns. These insights could be generated from data from CellMinerCDB and may be generalized beyond the NCI-60 cell lines. However, additional computational tools are needed to transform cell line-based discoveries to patient-centered insights (Warren et al., 2021).
Lantern Pharma’s Response Algorithm for Drug Positioning and Rescue (RADR®) artificial intelligence (AI) and machine learning (ML) platform (https://www.lanternpharma.com/ai-platform) was developed to integrate data from pre-clinical and clinical data sources, like CellMinerCDB (Rajapakse et al., 2018), the Cancer Genome Atlas (TCGA) (Tomczak et al., 2015), the Catalogue of Somatic Mutations in Cancer (COSMIC) (Tate et al., 2018), Gene Omnibus (GEO) (Edgar et al., 2002; Barrett et al., 2013), patient data, and publications to generate insights for preclinical and clinical research. RADR® harbors robust drug response ML models derived from drug response and large-scale genomic data. RADR® ML model development utilizes feature reduction steps to reduce the 20,000 + features often found in “omic” data to a small number of features and identifies the best performing algorithm with these features by testing dozens of ML algorithm implementations. The reduced number of features of an ML model can serve as a drug response “gene signature,” which can function as a biomarker panel. Using biomarkers/MoA identified from CellMinerCDB and drug response models built by RADR® machine learning pipelines, the RADR® platform can predict patient groups that are more likely to respond to the compound of interest. By associating predicted responsive patients with their disease types, querying biomarkers, and/or compound MoA, RADR® can be leveraged to uncover new indications from under-studied cancers and identify populations of patients where certain treatment may be more effective.
Here, we investigated Lantern Pharma’s drug candidates LP-184 and LP-100 (Irofulven) as case studies to explore how CellMinerCDB and RADR® could be leveraged together to identify new MoA and discover new drug indications. LP-184, the negative stereoisomer of N-hydroxy-N-(methylacylfulvene) urea, and LP-100 (6-hydroxymethylacylfulvene) belong to the acylfulvene class of anti-cancer drug molecules. The chemical structures of both drugs are given in Supplementary Figure S1. Acylfulvenes are known to be converted to their active forms in vivo by the NADPH-dependent oxidoreductase Prostaglandin Reductase 1 (PTGR1) or by leukotriene B4 12-hydroxydehydrogenase (LTB4DH) (Dick et al., 2004). Once activated acylfulvenes can induce cell arrest or apoptosis through nucleotide or protein alkylation. Cells that overexpress PTGR1, in vitro or in vivo, have been previously shown to be significantly more sensitive to acylfulvene treatment compared to controls (Yu et al., 2012). Additionally, upregulation of PTGR1 expression is known to be associated with poor cancer prognosis in several cancer types including pancreatic, head and neck, lung, liver, gastric and triple-negative breast cancers (Wang et al., 2021), indicating that these cancer types are likely more susceptible to LP-184 or LP-100 treatment.
After activation by PTGR1, acylfulvenes can act as DNA damaging agents by alkylating various cellular components, including DNA, RNA, and proteins, with the most well-characterized action occurring through the N3 alkylation of adenine and N3/N7 alkylation of guanine (Herzig et al., 1999; Cai et al., 2009). Once alkylated, DNA monoadducts can be formed which may stall DNA replication, RNA transcription, and can cause cell-cycle arrest and apoptosis unless repaired by the DNA Damage Repair (DDR) system (Woynarowski et al., 1997; Koeppel et al., 2004; Wang et al., 2007). The DDR system is important in maintaining genome stability in normal cells, but is frequently impaired in certain cancer cells or cancer types (Chae et al., 2016). There are at least five DNA repair pathways in the DDR system including: transcription coupled-nucleotide excision repair (TC-NER), homologous recombination repair (HR), base excision repair (BER), mismatch repair (MMR), and non-homologous end joining (NHEJ). One or multiple of these pathways can be activated upon DNA damage and depend on the type of DNA damage received and the cell cycle stage of the cell (Chatterjee and Walker, 2017). Cancer cells with impaired DDR can no longer repair damages caused by DNA damaging agents, like LP-184 and LP-100, and can become more sensitive to cancer therapies.
There are several types of alkylating agents which can vary in mechanism of action (MoA) including, size of DNA adduct, location of alkylation, and the cancer cells DDR to resolve the alkylation, these differences suggest reasons for why one agent outperforms another in specific indications (Kondo et al., 2010). For example, cisplatin is one of the most effective alkylating agents in treating solid tumors. It introduces intrastrand crosslinks that can be repaired by NER and MMR, (Basu and Krishnamurthy, 2010). Carmustine is another alkylating agent commonly used in cancers related to the nervous system. Carmustine causes both intrastrand and interstrand crosslinks and has also been reported to be synthetic lethal with cells lacking kinases such as MARK3 (Owusu et al., 2019). The activities of many alkylating agents are correlated with the gene Schlafen-11 (SLFN-11), a putative component of DNA damage response that induces cell cycle arrest and apoptosis upon DNA damage (Zoppoli et al., 2012). The small DNA lesions caused by LP-100 are preferentially removed by Transcription-Coupled Nucleotide Excision (TC-NER) pathways (Jaspers et al., 2002; Koeppel et al., 2004). LP-100 is also known to cause double-strand DNA breaks, which in turns activates the ATM-mediated cell cycle arrest and HR repair pathways (Wang et al., 2004; Wang et al., 2007; Wiltshire et al., 2007). The activity of LP-184 has also been previously shown to be synthetic lethal in cancer subtypes with HR deficiencies (Kulkarni et al., 2021).
In the current study, we leveraged CellMinerCDB and RADR® to understand and distinguish mechanisms of LP-184 and LP-100 response from other alkylating agents. The CellMinerCDB platform has an abundant array of drug response data that is associated with expression data in a cell line panel. Here we utilized this data to characterize drug activity patterns in association with gene expression through Gene Set Enrichment Analysis (GSEA) using expression that is ranked by correlation to LP-184 and other drugs. Distinguishing features of acylfulvene response could lead to identification of indications where the particular mechanisms of LP-184 and LP-100 alkylation will be highly efficacious. Indeed, these features could also suggest favorable responses in rare indications that are not present in the NCI-60 cell lines and would otherwise go overlooked.
Materials and methods
CellMiner data were downloaded from CellMinerCDB (Reinhold et al., 2019). We used the mRNA microarray log2 expression, RNA-seq log2 FPKM + 1 transcript expression, mutation summary, methylation levels and drug response data for the NCI60. We matched the NCI60 cell line names to the cell lines used in testing LP-184 IC50s, which was used in a −log10 IC50 (Molar) form with analyses and ML modeling. The entire workflow is given in Supplementary Figure S2.
Correlation with PTGR1 and GSEA
We correlated the overall expression as well as individual transcript expressions of PTGR1 to the cell line response to LP-184, LP-100, Carmustine and Cisplatin using the Spearman correlation coefficient.
To clarify the biological functions and pathways that differentiate the response between the different drugs, we used GSEA (Subramanian et al., 2005). Firstly, we downloaded gene sets relating to various molecular and biological pathways from the Molecular Signatures Database (Liberzon et al., 2011; Liberzon et al., 2015). To that we added several custom gene lists from the Laboratory of Molecular Pharmacology. The LMP gene membership can be found in the Supplementary Table S1.
Then we used the R package fgsea (Korotkevich et al., 2021) to do the GSEA analysis for the ranked correlations for each drug. We selected a minimum gene set size of 10 and a maximum of 319 (to accommodate one of the LMP gene sets) and did the analysis with 1,00,000 permutations.
GSEA computes a Normalized Enrichment Score (NES), which is a measure of the overall correlation of the genes belonging to that gene set. A negative NES implies an overall negative correlation of the genes in that gene set to the drug response and vice versa for a positive NES. In addition, GSEA also calculates a p-value and adjusted p-value for the observed NES. The NES for the LMP gene sets were used to cluster the drugs and gene sets that are similar to each other based on Euclidean distance.
Comparison of LP-184 and LP-100 with other alkylating agents
We wanted to compare the NIC60 response pattern of LP-184 and LP-100 with the other alkylating agents present on the CellMinerCDB platform, in order to identify scenarios where LP-184/LP-100 can be applied when other alkylating agents fail. There are a total of 20 FDA approved alkylating agents in the CellMinerCDB platform, with some duplicates (under different NSC numbers). We averaged the drug’s response patterns of the same drug belonging to different NSC numbers. Using the response pattern, we identified the group of cell lines that are resistant to a particular alkylating agent and asked if those cell lines are especially sensitive to LP184/LP-100. For each alkylating agent, we chose cell lines that have z-score <0 as resistant and z-score >0 as sensitive. We used the same criteria to split cell lines into sensitive and resistant to LP-184 and LP-100. Then we used a Fisher Exact test to find out if there is a statistically significant odds ratio less than one between the two conditions.
Drug—drug correlation and SLFN11 expression correlations
We use the CellMinerCDB portal to query the LP-100 and LP-184 drugs individually against all the 23,765 drugs available in the portal. Out of which, we only considered the drugs having Clinical trial and FDA approved Clinical status. We used the pattern comparison function from the portal to find the correlation between IC50 values of the query drug and IC50 of all the drugs from the portal individually. Pattern comparison is an easy function that allows correlating our query drug response to all the available data which include expression, methylation, mutation, Copy Number Variation, Drug activity (IC50) etc.
We analyzed the correlation of LP-184 and other alkylating agents to SLFN11 under the condition of abundant PTGR1 mRNA. We selected cell lines that had an above average expression of PTGR1 (Z-score > 0). For those cell lines we looked at the correlation between SLFN11 expression and drug response.
LP-184 response machine learning model
We used the RADR® platform to train the machine learning model for prediction of standardized z-score of −log10 Molar IC50 values for various cell lines (Supplementary Table S2). We first used iterative feature reduction of RNA-seq expression values. Gene expression values included publicly available CCLE data and NCI60 expression values (downloaded from CellMiner), and proprietary data on ex vivo PDX-derived 3D models available through the Lumin Bioinformatics Software Suite of Champions Oncology. Initial gene sets were filtered to remove the zero-variance genes and only to include genes available from each data source. Random forest algorithms from the randomForest R package (Breiman, 2001), implemented through the caret R package [installed via CRAN, (Kuhn, 2008)], with cross validation, were tuned by random search and trained to select the best performing model on the training dataset. Feature reduction used the top-ranked feature importance scores using the varImp() function. To reduce features, we implemented an iterative feature reduction process where initial model training with all available genes was used and the features estimated to be important were taken to the next step. Features were reduced 4 times before reaching a set of 10 genes, which are shown in Supplementary Figure S3. Multiple algorithms were evaluated for their performance, including glmnet, random forest, xgboost, support vector machine, and neural networks.
After feature selection, various different algorithms were tested with the final 10 features and compared for performance in a blind validation test set which had been held out from prior steps. Sample-wise normalization of expression values were performed prior to model training. With the 10-gene expression values of each sample, values were normalized by applying the formula [x-min(x)]/[max(x) − min(x)] to each sample. Trained models were compared for performance in Root Mean Squared Error (RMSE), a common ML metric for evaluating regression models, and accuracy. Accuracy was defined using a classification framework, where prediction of a sample as either above or below the average IC50 of the training set were considered classified as “sensitive” and those below as “resistant,” with accuracy representing the total of correctly predicted categories divided by the total number of samples. RMSE was used to select the best hyperparameters during model training, and different combinations of the mtry and ntree parameters were evaluated. The cforest (conditional inference forest) model demonstrated the best performance, with an RMSE of 0.426 [−log10 IC50 (M)], and an accuracy of 0.714.
To use the cforest (Hothorn et al., 2006; Strobl et al., 2007; Strobl et al., 2008) model to make predictions, RNA expression values for the 10 genes were subsetted into an individual data frame and sample-wise normalization (such that the max value was 1.0 and minimum value was 0.0, as described above) was performed. ATRT clinical sample RNA-seq was downloaded after accessing their corresponding GSE identifiers at the GEO website (https://www.ncbi.nlm.nih.gov/geo/). Expression values were converted to FPKM log2 + 1 values if necessary, then were normalized before predictions using the cforest model were made.
Validation case study—ATRT
CHLA-06 cell culture, animal housing, and drug delivery, was all performed by Rincon Bioscience (SLC, UT). 4-week old NOD.SCID mice were purchased from Jackson Laboratories (Bar Harbor, ME). Mice were fed Teklad irradiated (sterilized) mouse diet and bedded with Teklad irradiated (sterilized) corncob bedding from Envigo (Indianapolis, IN). Mice were housed in Optimice carousel sterile quarters with filtered air supply in disposable cages from Animal Care Systems, Inc. (Centennial, CO). A 12-h light/12-h dark light cycle is observed, with animal handling only taking place during the light cycle.
CHLA-06 cell cultures at 70% confluency were trypsinized and pellets were resuspended in RPMI medium, at 2 × 10⁸ cells/ml density and diluted with an equal volume of Matrigel. 100 uL (1 × 10⁷ cells) was injected into the right hind flank of 4-week old NOD.SCID mice (strain 001303, Jackson Laboratories). Subcutaneous xenograft volume was monitored with calipers, and treatment was initiated when reaching an average volume of 150 mm3.
LP-184 was dissolved in ethanol and diluted in saline until reaching 5% EtOH. Vehicle or LP-184, at 2 mg/kg or 4 mg/kg, was delivered by tail vein injection. Dosing schedule consisted of two cycles of five every-other-day injections, with the second cycle continuing after a 5-day holiday, i.e., drug administration on days 0, 2, 4, 6, 8, 14, 16, 18, 20, and 22.
Statistical tests
Comparisons between tumor volumes used a two-sided T-test. Multi-group comparisons of predicted LP-184 response in patient data used ANOVA. The p-values of Pearson correlations uses a t-distribution with n − 2 degrees of freedom to estimate a p with Fisher’s Z transform, as implemented by cor.test() in R.
Results
Validation of PTGR1 activation of LP-100 and LP-184
The NCI-60 screen was previously used to test the drug responses of LP-184 and LP-100, and data from these experiments were stored within the CellminerCDB. As both of these drugs are known to be activated by PTGR1, a correlation analysis was performed within CellminerCDB to test the drug sensitivity of LP-184 and LP-100 against PTGR1 mRNA expression, protein expression, methylation, and copy number variants (CNV). PTGR1 mRNA expression was significantly and highly correlated with cancer cell sensitivity to LP-184 (Figure 1A; r = 0.87, p = 2.2e-16) and LP-100 (Figure 1B; r = 0.64, p = 1.7e-07). Additionally, both LP-184 and LP-100 were significantly positively correlated with PTGR1 protein expression (LP-184: r = 0.52, p = 3.5e-05; LP-100: r = 0.51, p = 5.3e-05) and significantly negatively correlated with PTGR1 methylation (LP-184: r = -0.75, p = 8.2e-12; LP-100: r = -0.53, p = 2.5e-05). There was no correlation between drug response of LP-184 (r = 0.1, p = 0.46) or LP-100 (r = 0.14, p = 0.28) and the PTGR1 CNVs (Table 1). In these analysis PTGR1 mRNA expression was more significantly and strongly correlated with LP-184 than LP-100, suggesting that overall the NCI-60 cell lines were more rapidly likely to convert LP184 to an active drug and that this might translate in the increased sensitivity to LP-184 than LP-100.
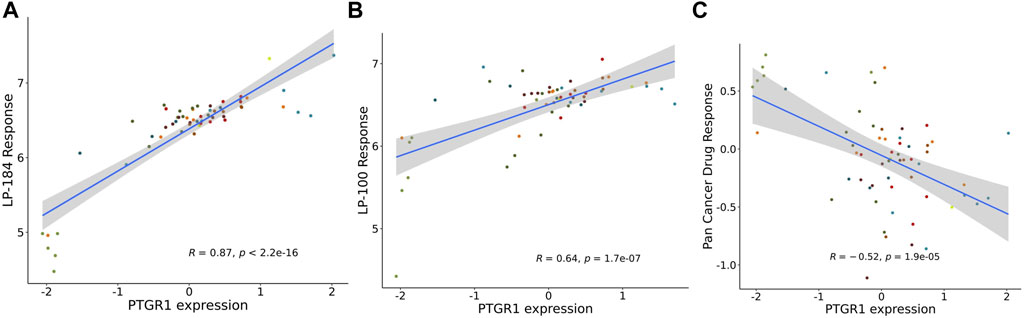
FIGURE 1. PTGR1 correlation with LP-184, LP-100, and pan cancer compound response. PTGR1 mRNA expression correlation with (A) LP-184 drug sensitivity response (B) LP-100 drug sensitivity response, and (C) the pan cancer compound sensitivity response across the NCI60 cell lines.

TABLE 1. PTGR1 omics correlation with drug sensitivity.
In addition to NCI-60 cell line responses to LP-184 and LP-100, the CellminerCDB has integrated the NCI-60 responses from more than 20,000 drugs representing numerous drug classes. These data were leveraged to calculate the correlation of the PTGR1 mRNA expression levels with the summary of the responses from each of the cell lines for about 20,000 compounds, which is called the Pan Compound Response (PCR) (Reinhold et al., 2014). In contrast to the highly significant and positive correlation of PTGR1 mRNA expression to cancer cell sensitivity to LP-184 and LP-100, PTGR1 mRNA expression was significantly negatively correlated (r = −0.52, p = 1.9e-05) with the PCR (Figure 1C). These results indicated that the PTGR1 mRNA expression was a significant factor for driving the cell sensitivity responses for LP-184 and LP-100, whereas it has significant negative correlation with PCR.
LP-100 and LP-184 activities are independent of SLFN11 expression
The gene Schlafen Family Member 11 (SLFN11), is a putative DNA/RNA helicase and whose gene expression is known to be positively correlated with DNA Damaging Agents (DDAs), like DNA alkylation, and is considered to be a predictive marker of DDA response (Zoppoli et al., 2012). In order to understand how LP-184 and LP-100 sensitivity compared to other DDAs, a correlation analysis was conducted comparing SLFN11 gene expression to 19 known DDAs. SLFN11 gene expression was significantly and positively correlated for 13 out of 19 DDA (Figure 2A; Table 2), with correlation coefficient values that ranged from 0.33 to 0.77 and a mean correlation coefficient of 0.57. Confirming that a majority of the known alkylating agents were significantly positively correlated with SLFN11 gene expression.
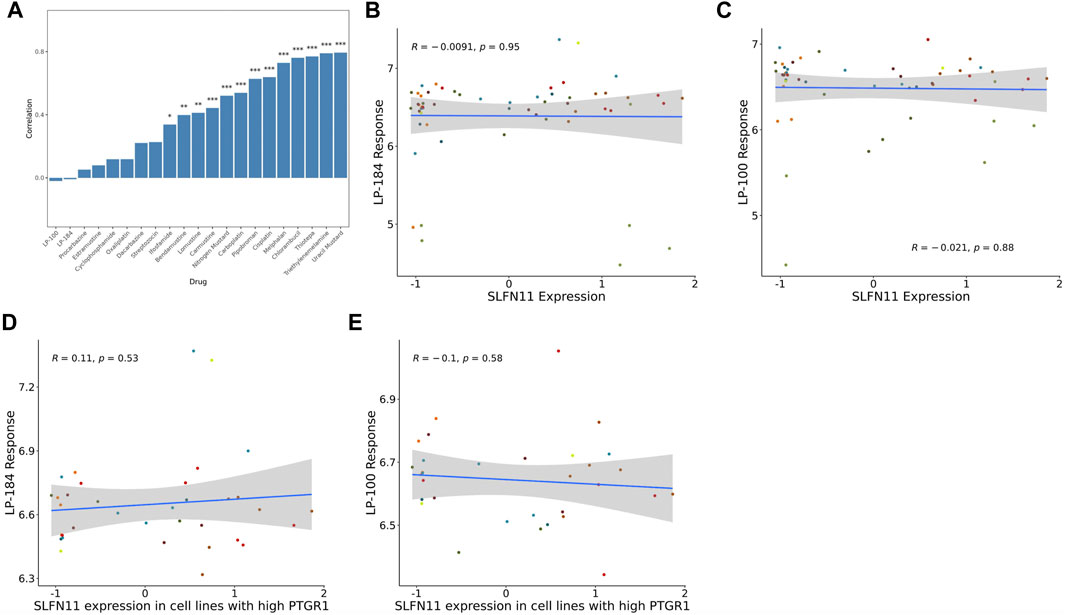
FIGURE 2. SLFN11 correlation with Alkylating agents and query drugs. (A) Bar graph showing majority of the Alkylating drugs are significantly positively correlated with SLFN11 mRNA expression levels. Correlations of SLFN11 mRNA expression with (B) LP-184 response or (C) LP-100 response in treated NCI60 cell lines. Correlations of SLFN11 mRNA expression with (D) LP-184 response or (E) LP-100 response in treated NCI60 cell lines with high PTGR1 mRNA expression.
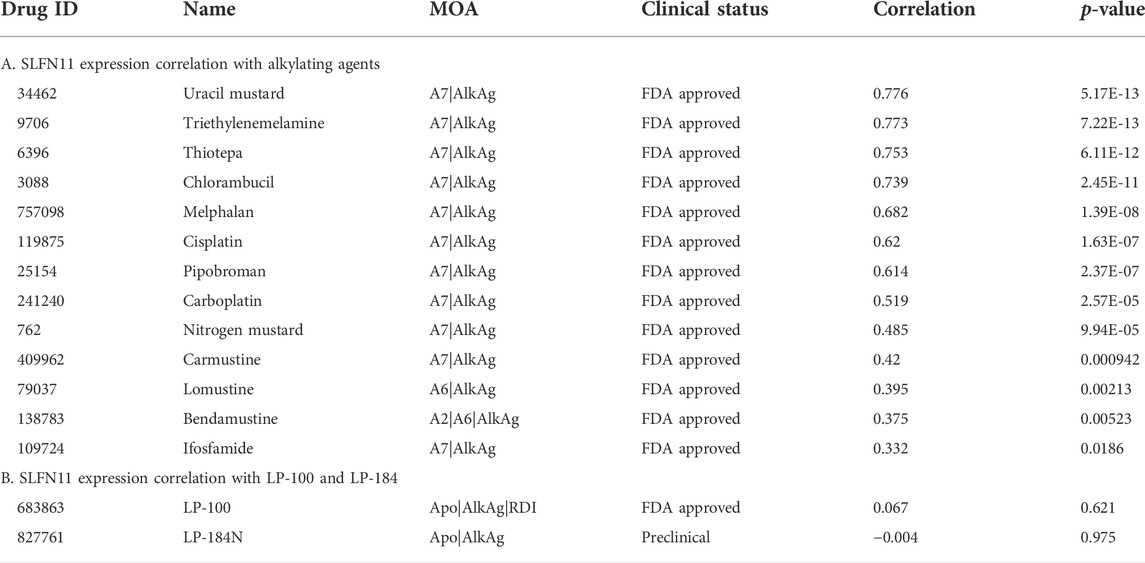
TABLE 2. SLFN11 correlation with drug sensitivity.
In contrast to the other alkylating agents in CellMinerCDB, LP-184 and LP-100 were not correlated with SLFN11 gene expression (Figures 2B,C, LP-184: r = −0.0091, p = 0.95; LP-100: r = −0.021, p = 0.88; Table 2), suggesting that LP-184 and LP-100’s mechanism of action (MoA) is independent of SLFN11 gene expression. As PTGR1 expression is needed for activation of LP-184 and LP-100, an additional correlation analysis was performed removing all cell lines with low expression of PTGR1 (expression z-score < mean) to see if the correlation between SLFN11 gene expression and LP-184 and LP-100 response would be altered. After removal of cell lines with low PTGR1 expression, the correlation of SLFN11 gene expression to LP-184 and LP-100 responses remained insignificant (Figures 2D,E; LP-184: r = 0.11, p = 0.53; LP-100: r = −0.1, p = 0.58). The full table of SLFN11 expression correlation with drug’s sensitivity is given in Supplementary Table S3. It was surprising neither LP-184 or LP-100 were correlated with SLFN11 gene expression as both have been previously demonstrated to be DNA damaging agents (Zoppoli et al., 2012; Luan et al., 2019; Murai et al., 2019). Considering this result, a drug-drug correlation analysis was performed to identify what other drugs sensitivity response correlates with LP-184 and LP-100.
Drug—drug correlation analysis
As LP-184 and LP-100 are known alkylating agents (Staake et al., 2016), we specifically compared their drug sensitivity to the response of other drugs with similar MoA. The pattern comparison tab from CellMinerCDB was used to generate Pearson correlations comparing the drug sensitivity of each LP-184 and LP-100 to the drug sensitivity of the same nineteen alkylating agents previously mentioned. Overall, the drug sensitivity responses of LP-184 and LP-100 were negatively correlated, or not correlated to all of the 19 other alkylating agents. LP-184 was significantly (p < 0.01) negatively correlated to seven alkylating agents (average r = −0.50), whereas LP-100 was significantly (p < 0.01) negatively correlated to six alkylating agents (Table 3; average r = −0.38). As all of the known alkylating agents were either negatively correlated or not correlated with LP-184 or LP-100 sensitivity response, it is likely that both LP-184 and LP-100 have additional MoA that contribute to their efficacy and cell sensitivity response.
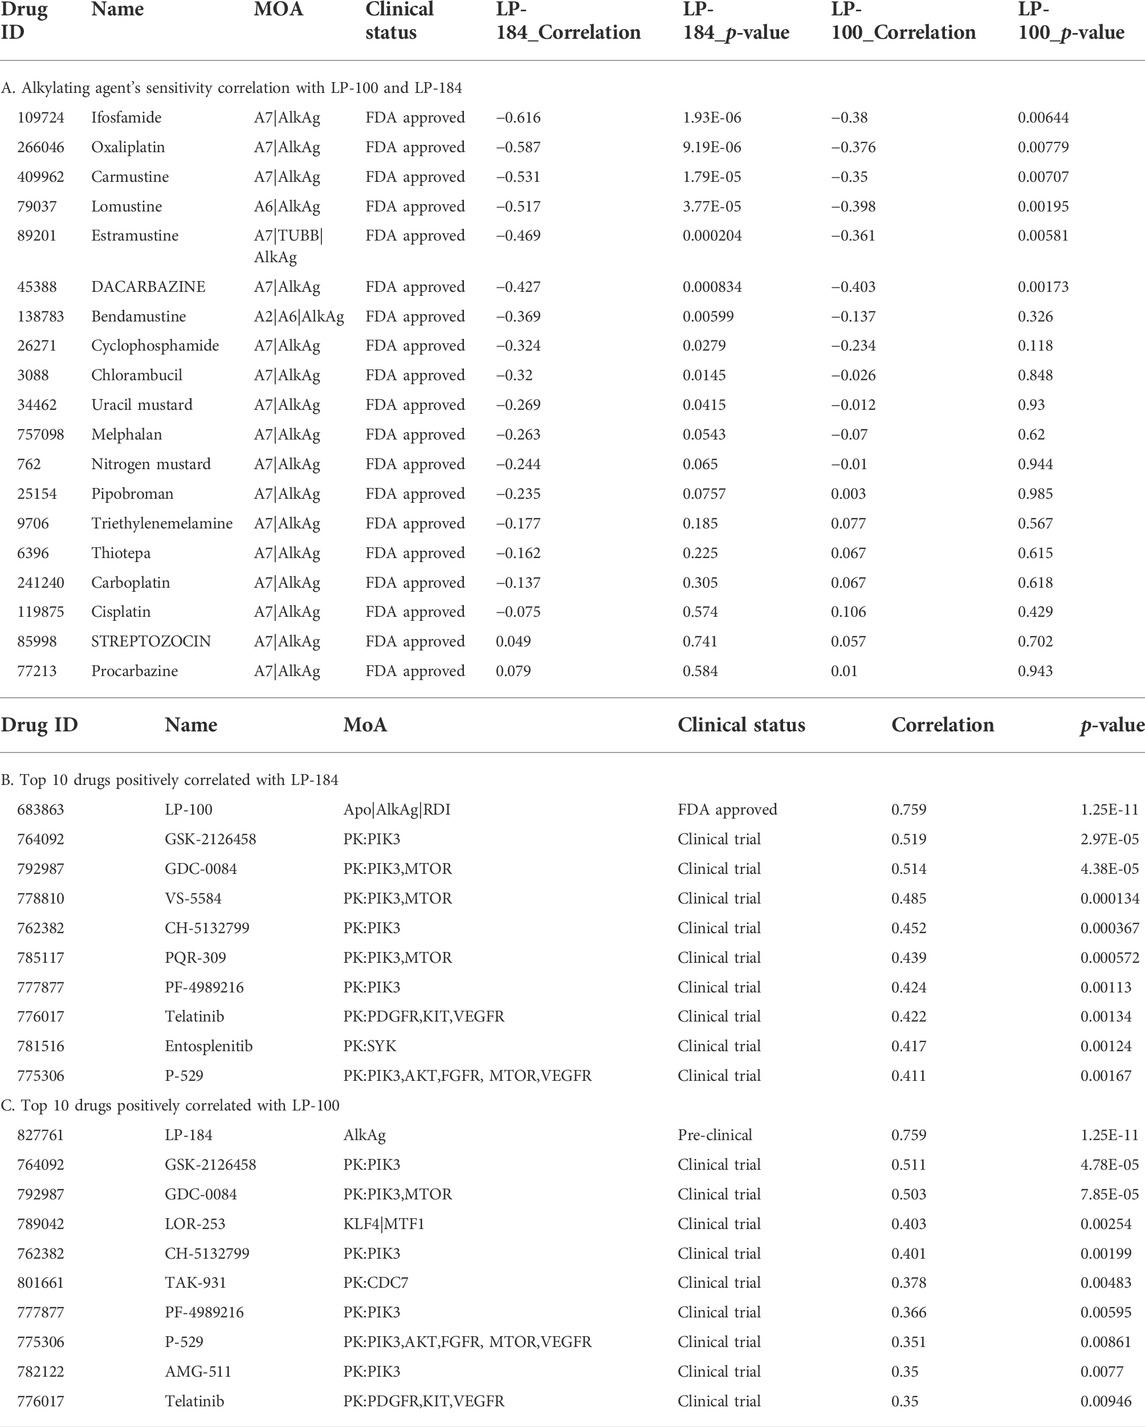
TABLE 3. Drug-drug sensitivity correlations.
The CellMinerCDB has drug sensitivity information for over 20,000 compounds, which includes many FDA approved and clinical trial drugs. We sought to make an additional comparison of these FDA approved and clinical trial drugs to potentially identify drugs with significant positive correlations to LP-184 and LP-100 and that may provide evidence for additional MoA for LP-184 and LP-100. The pattern comparison function in CellMinerCDB was used to generate Pearson correlations comparing the cell sensitivity response of the CellMinerCDB drugs to LP-184 and LP-100. Table 3 list the top 10 positively correlated drugs to LP-184 and LP-100, respectively. The most positive and significant drug-drug correlation was found between LP-184 and LP-100 (Table 3), which was anticipated considering the chemical similarity between the two molecules.
Considering these findings and differences within the alkylating agent class of drugs led us to investigate further and compare the LP-184 and LP-100 with other Alkylating agents to see any difference at the gene set/pathway level.
Gene sets involved in MoA of LP-100 and LP-184
Gene set enrichment analysis (GSEA) can be used to understand the role of gene sets to aid in identification of an unknown MoA of a drug. Here, 12,169 gene sets were used as an input to the GSEA analysis in CellMinerCDB. We used gene expression and drug sensitivity Pearson’s correlation to derive ranked gene sets and calculate gene set enrichment. Figure 3A shows enrichment comparison between LP-184 and LP-100 and nineteen other alkylating agents. Negative (blue) Normalized Enrichment Score (NES) represent negative gene set expression association with drug sensitivity, whereas positive (red) NES represent positive gene set expression correlation with sensitivity of drugs. Based on the GSEA hierarchical clustering in Figure 3A, there were two clear clusters of drug compounds, one with four drugs and another with 15 drugs. A detailed view of the GSEA results are shown in the DNA repair and Chromatin remodeling pathways for LP-184 and Carmustine (Figure 3B), and an unbiased overview of the most significant positive and negative GSEA results are shown in Figure 3C. The cluster of four drugs, containing LP-184 and LP-100 and two additional nitrosurea alkylating agents, Procarbazine and Streptozocin, whereas the second cluster included 15 other established alkylating agents which included Cisplatin, Oxaliplatin, and Caramustine. It is important to note that enrichment direction (NES) of LP-184 and LP-100 opposed the majority of the alkylating agent’s enrichment direction for most of the enrichment categories, even though they share a similar MoA for DNA damage. There was only one drug (out of 19), Procarbazine, that closely matched the enrichment patterns of LP-184 and LP-100.
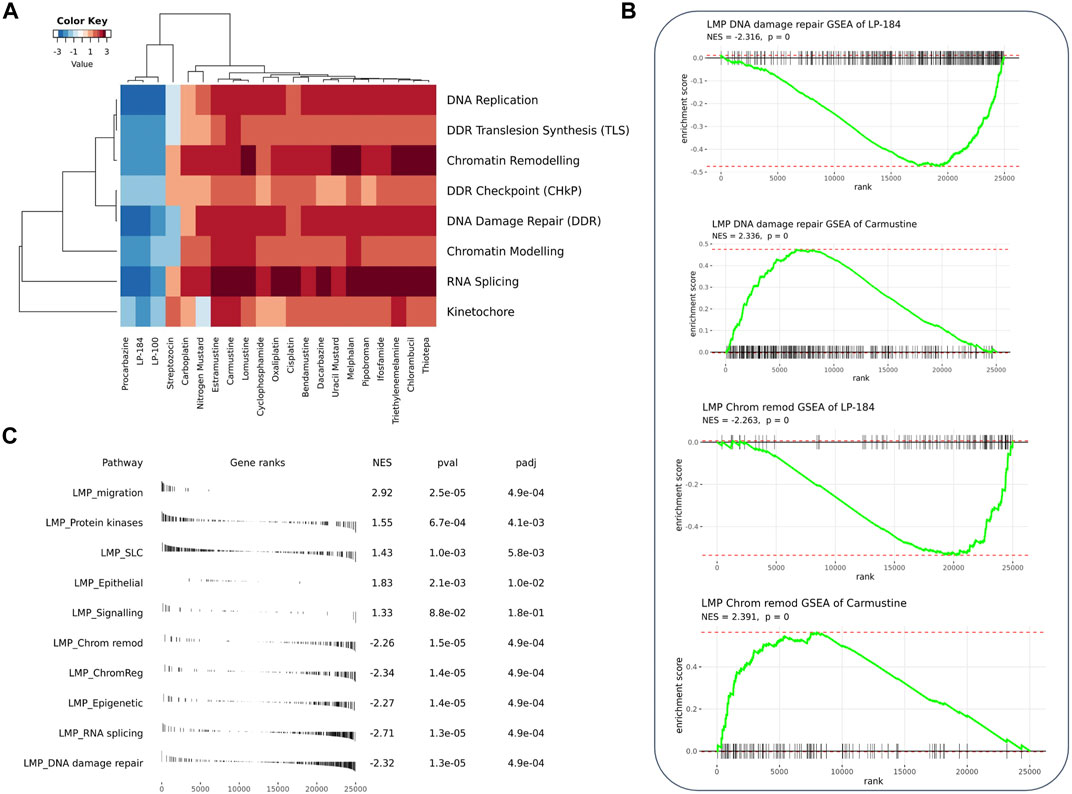
FIGURE 3. GSEA analysis of the correlated genes. (A) Heatmap from GSEA analysis of the top correlated gene sets involved with DNA, RNA, and chromatin with LP-184 and LP-100 and other known alkylating agents (B) GSEA plots for LP-184 and carmustine in chromatin remodeling and DNA repair pathways (C) The top five pathways ranked by p-value were extracted from the GSEA results of LP-184 gene ranks in LMP pathways.
From the GSEA analysis, LP-184 and LP-100 showed negative NES for DNA replication, DDR translesion synthesis, chromatin remodeling, DDR checkpoint, DNA damage repair, chromatin modeling, RNA splicing and kinetochore gene sets. The high degree of similarity in category enrichment demonstrates that there is a common sensitivity pattern for both drugs, a notion that is further confirmed by the strongly correlated drug responses between LP-184 and LP-100. Based on the NES color annotation, some categories like DDR, chromatin modeling, and RNA splicing have more negative NES for LP-184 compared to LP-100, which indicates that LP-184 may provide higher sensitivity to tumors with deficiency in these categories. These analyses and enrichment patterns led us to investigate additional cancer indications that are deficient in these pathways that would therefore be hypothesized to have sensitivity to LP-184 and LP-100.
In silico identification of LP-184 efficacy in cancers deficient in the SWI/SNF chromatin remodeling complex
The GSEA analysis results found one of the distinct NES differences between LP-184/LP-100 and the other alkylating agents was a significant negative association of the genes in the chromatin remodeling/modeling pathways, suggesting that LP-184 and LP-100 could be efficacious in cancers deficient in these gene expression patterns. Chromatin remodeling is a fundamental process involved in epigenetic regulation (Kumar et al., 2016), and is directly and indirectly related to DNA damage repair. As alteration of chromatin remodelers is involved in oncogenesis and cancer progression in numerous cancers, this relationship may help identify cancers sensitive to LP-184 or LP-100.
There are prominent examples of cancers with loss-of-function somatic gene mutations in the SWI/SNF chromatin remodeling complex, including atypical teratoid rhabdoid tumors (ATRT), caused by mutations in SMARCB1, and various additional rhabdoid tumors, that harbor mutations in SMARCA4 (Holdhof et al., 2021; Hasselblatt et al., 2022). In addition to these cancer types, the NCI-60 mutation data were checked to examine if there were any cell lines with mutations in SMARCB1 or SMARCA4. However, none of the NCI-60 cell lines had loss of function mutations in either of these genes. As there were no NCI-60 cell lines with loss of function mutations, a Pearson’s correlation analysis was performed to test LP-184 drug sensitivity to SMARCB1 or SMARCA4 gene expression levels in the NCI-60 cell lines. Significant negative Pearson correlations were found when comparing LP-184 drug sensitivity to the gene expression of SMARCB1 (Figure 4A; r = −0.33, p = 0.011) and SMARCA4 (Figure 4B; r = −0.3, p = 0.025). When controlling for PTGR1 expression and only examining these correlations in cells with above-average PTGR1 expression level, SMARCB1 correlation decreased to −0.17 (p = 0.35), and SMARCA4 changed to −0.21 (p = 0.24). This suggests part of the association observed was likely due to association with PTGR1 rather than being independent effects. Additional correlations were made between Carmustine, a drug that has been used clinically to treat ATRT patients, and Cisplatin, a common therapeutic agent, with SMARCB1 and SMARCA4 gene expression (10). In contrast to LP-184, Carmustine response was significantly positively correlated with SMARCB1 (Figure 4C; r = 0.26, p = 0.043) and SMARCA4 (Figure 4D; r = 0.39, p = 0.0019). Cisplatin response was not correlated with either SMARCB1 (Figure 4E; r = 0.088, p = 0.51) or SMARCA4 (Figure 4F; r = 0.03, p = 0.82). Although Carmustine has shown favorable efficacy in preclinical studies to treat ATRT (Lünenbürger et al., 2010), its positive correlation with SMARCB1 and SMARCA4 gene expression, and positive GSEA NES score with Chromatin remodeling pathways (Figure 3B), suggests that Carmustine efficacy will not be optimal in tumors with SWI/SNF-deficient molecular characteristics. Conversely, as LP-184 response was significantly negatively correlated with SMARCB1 and SMARCA4 expression levels, we hypothesized LP-184 could be an effective therapeutic agent for cancers deficient in SWI/SNF chromatin remodeling complex. As several of the in silico experiments shown here indicated that LP-184 would be more potent than LP-100, we only proceeded with LP-184 for the remaining in silico, in vitro, and in vivo experiments.
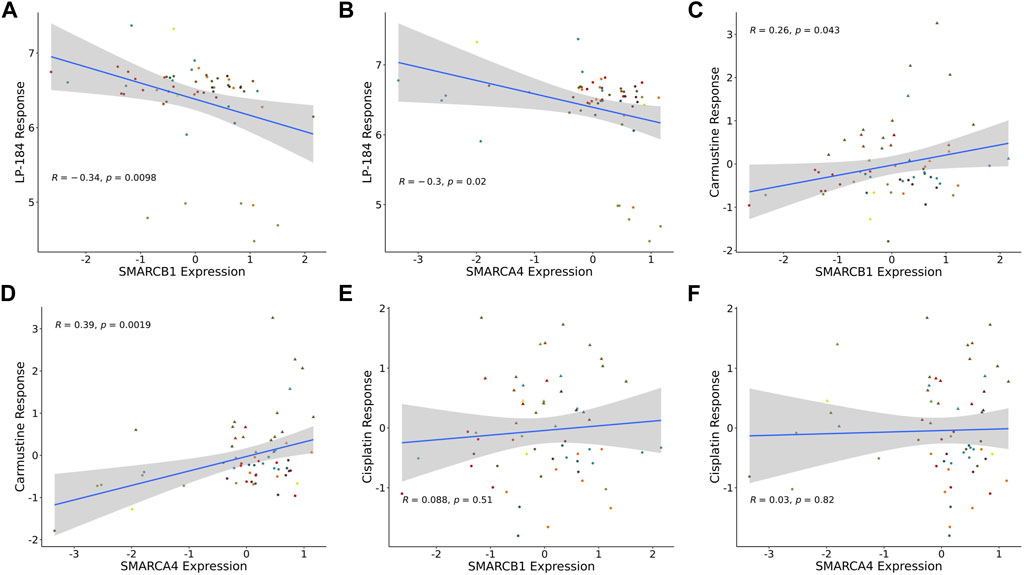
FIGURE 4. SMARCB1 and SMARCA4 correlations with drugs response in NCI60 cell lines. Expression correlation of (A) LP-184 sensitivity and SMARCB1 mRNA expression, (B) LP-184 sensitivity and SMARCA4 mRNA expression, (C) Caramustine sensitivity and SMARCB1 mRNA expression, (D) Caramustine sensitivity and SMARCA4 mRNA expression, (E) Cisplatin sensitivity and SMARCB1 mRNA expression, and (F) Cisplatin sensitivity and SMARCA4 mRNA expression in NCI60 cell lines.
LP-184 sensitivity prediction on patient data
Based on the significant and negatively correlated relationship between LP-184 and SMARCB1 and SMARCA4 gene expression, we leveraged Lantern Pharma’s AI and ML learning platform RADR® to predict if patients diagnosed with ATRT would have sensitivity to LP-184 treatment. The RADR® “10-gene” model used here was trained and tuned using cell line and patient derived xenograft gene expression data and the ML model used 10 signature genes to generate predictions. This 10-gene model is modified from our previously published 16-gene ML model which showed performance of this ML model on LP-184 sensitivity in a blind validation set composed of 37 CCLE cell lines (Kathad et al., 2021). The validation of the “10-gene” model’s performance is provided in Supplementary Figure S3 using a similar blind validation set and additional samples from PDX-derived 3D cell cultures and was significantly correlated with LP-184 sensitivity in the prediction of 42 samples in a blind validation set (p = 0.000026; r = 0.6).
The 10-gene ML model was used to predict the sensitivity of LP-184 in several ATRT patient gene expression datasets from the Gene Expression Omnibus (GEO). First, LP-184 sensitivity was tested, in silico, using gene expression data from a cohort of ATRT patients (GSM1587795 and GSE160748) for which patients were stratified by either SMARCB1 or SMARCA4 mutations. Patients without SMARCB1 mutations and classified as “ATRT-like” had normal SMARCB1 status, but otherwise met diagnosis criteria for ATRT (Ho et al., 2015). In both cases the 10-gene model predicted that ATRT patients with mutations in either gene were sensitive to LP-184. The patients with SMARCB1 mutations had an average predicted LP-184 IC50 of 128 nM, where the patients with SMARCA4 had an average predicted LP-184 IC50 of 207 nM (Figure 5; Table 4). The mean IC50s in both groups were lower than the mean IC50s in our training dataset, supporting that these mutations enhance LP-184 sensitivity. Patient tumor samples with no SMARCB1 or SMARCA4 mutation, which were classified as ATRT-like, had a higher mean IC50 of 230.6 nM (above average relative to training set IC50s).
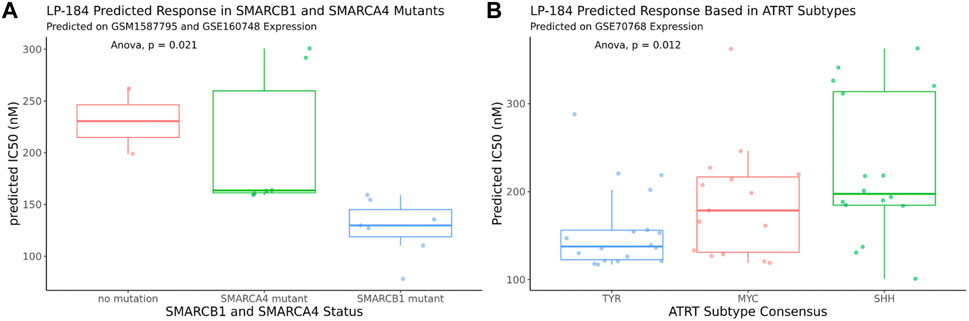
FIGURE 5. In silico LP-184 Predicted Sensitivity in SMARCB1 and SMARCA4 mutants and in ATRT genetic subtypes. Machine-learning LP-184 model prediction of LP-184 sensitivity in (A) ATRT patients with either no SMARC mutation, a SMARCB1 mutation, or SMARCA4 mutation or (B) ATRT patients with different genetic SMARCB1 genetic subtypes.

TABLE 4. LP-184 predicted IC50 on publicly available ATRT datasets.
ATRT patients with SMARCB1 mutations are likely to have one of the three common subtypes, SHH, MYC, and TYR, which can vary in tumor location, severity, genetic mutations, and molecular signatures (Ho et al., 2019). Using an ATRT gene expression dataset that was stratified by ATRT subtype (GSE70678), the 10-gene ML model was used to predict whether each of these subtypes were predicted to be sensitive to LP-184 and if there were predicted differences in LP-184 sensitivity across all three subtypes. Subtype consensus classifications were based on profile clustering previously reported (Johann et al., 2016; Chun et al., 2019). Each subtype was predicted to have nano-molar IC50 sensitivity to LP-184 and there were significant differences in sensitivity across all three subsets (Anova, p = 0.012). The mean LP-184 IC50 of the SHH, MYC, and TYR subtypes were 234, 195, and 161 nM, respectively. Considering LP-184 had predicted nano-molar IC50 sensitivity across numerous patient cohorts and multiple ATRT subtypes, we sought to validate these in silico results in the wet lab.
In vitro validation of LP-184 efficacy in ATRT cell lines
This in vitro hypothesis was tested by treating ATRT cell lines deficient in SMARCB1 expression (CHLA-02, CHLA-05, and CHLA-06) with LP-184 (Doucet-O’Hare et al., 2021). CHLA-02 and CHLA-04 have been characterized as belonging to the group 1 ATRT subtype by Torchia et al. (2016), and CHLA-06 as group 2A/B, which were identified to respond differently to BMP and NOTCH pathway targeting, with group 1 sensitive to BMP inhibition, and group 2 sensitive to NOTCH inhibition. The IC50s of the LP-184 treated ATRT cell lines CHLA-02, CHLA-04, and CHLA-06 cell lines were 1748.0, 160.2, and 37.4 nM, respectively (Figure 6A). Overall, all of the ATRT cell lines had near nanomolar potency to LP-184 treatment, and CHLA-06 had one of the lowest IC50s that has been observed after treatment by LP-184 (Kathad et al., 2021). Carmustine and Thiotepa are clinically used to treat ATRT and their IC50s have been previously reported to be 72.1 and 94.7 μM (Lünenbürger et al., 2010) respectively, which are between ∼40 and 3,000 times higher than the IC50s LP-184. These in vitro results confirmed our in silico hypothesis that ATRT cells deficient in SMARCB1 would be sensitive to LP-184, and that cells treated with LP-184 would be more sensitive than Carmustine (Lünenbürger et al., 2010).
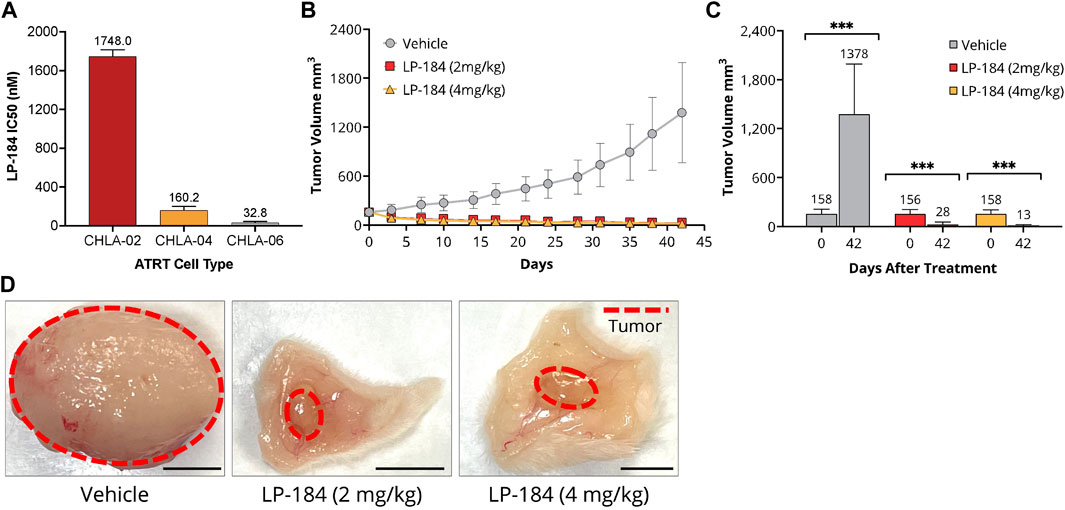
FIGURE 6. In vitro and In vitro LP-184 Testing of ATRT Models. (A) In vitro LP-184 IC50 values (nM) of ATRT Cell Lines CHLA-02, CHLA-04, and CHLA-06 treated with LP-184. (B) Time-course of tumor volumes (mm3) of CHLA-06 cell derived xenografts (CDX) treated with either I.V. Vehicle, LP-184 (2 mg/kg), or LP-184 (4 mg/kg). (C) Comparison of CHLA-06 CDX tumor volumes after treatment on day 0 and day 42 with either vehicle, LP-184 (2 mg/kg) or LP-184 (4 mg/kg). (D) Representative images of excised CHLA-06 CDX tumors after 42 days from mice injected with vehicle, LP-184 (2 mg/kg), or LP-184 (4 mg/kg).
In vivo validation case study—ATRT
As the ATRT cell lines tested were highly sensitive to LP-184 in vitro, we sought to validate this result in vivo. Non-Obese Diabetic/Severe Combined Immuno Deficiency (NOD/SCID) mice that were implanted with subcutaneous cell-derived xenografts from the ATRT cell line CHLA-06 and treated with LP-184 (i.v.) or vehicle for 4 weeks after implantation or when the tumors reached a group average volume of 1,500 mm3. The treatment schedule consisted of five i.v. injections every other day, followed by a 5-day holiday and a final round of five i.v. treatments every other day. Two dosages of LP-184 were tested, one at 2 mg/kg and one at 4 mg/kg, which were both lower than the previously used dose 5 mg/kg found to be effective in NSCLC xenografts (Kulkarni et al., 2021). Near complete tumor regression was observed in both the 2 mg/kg and 4 mg/kg LP-184 treated groups at the end of the study period on day 42 (Figures 6B–D) and almost no tumor regrowth was observed in the final 20 days of extended monitoring following the final injection. Two out of ten mice in the 4 mg/kg LP-184 treatment group were virtually tumor-free at study termination (tumor volume <0.5 mm3). Tumor growth inhibition of 112% was observed with LP-184 treatment relative to control in this study. There was slight reversible weight loss (∼10% of starting average mouse body weight) at the beginning of 4 mg/kg LP-184 treatments, but no weight loss/tolerability issues were observed at 2 mg/kg (Supplementary Figure S4). Tumor volume was reduced in the 4 mg/kg treatment group compared to the 2 mg/kg group at day 42, with respective tumor volumes of 28.1 mm3 and 14.64 mm3, though this was not significant (p = 0.147, two-sided T test). The complete tumor regression and lack of tumor recurrence after LP-184 treatment demonstrates in vivo efficacy of LP-184 in this indication. In the prospective works (in vivo and clinical trials), it will be important to monitor the weight loss as a possible side effect of this treatment. Together, these preclinical results validated our in silico hypothesis that ATRT cancer cell lines and cancer cell line derived xenograft models are susceptible and sensitive to LP-184 treatment.
Discussion
In this study, we used the CellMinerCDB platform in conjunction with Lantern Pharma’s proprietary RADR® AI and ML platform to identify ATRT as a novel indication for the DNA damaging agent LP-184. The cell lines of the NCI60 panel do not contain rhabdoid tumors, like ATRT, but our pan-cancer analysis of molecular patterns was able to identify relevant expression pathways that suggest drivers of LP-184 response in tumor types not explicitly represented, leading to the RADR® assisted identification of ATRT as a target indication. This represents an efficient strategy for identifying candidate drugs to treat rare disease. ATRT is an exceedingly rare pediatric cancer with very poor outcomes and no established standard of care treatment (Ginn and Gajjar, 2012; Johann et al., 2016; Baliga et al., 2021). Disease rarity and correspondingly low market size both negatively impact the testing of new drugs and investment in basic research for new treatment options. Our findings demonstrate that the CellMinerCDB and Lantern Pharma’s RADR® platforms provided strong in silico supporting evidence for further developing LP-184 for ATRT.
Insights from both CellMinerCDB and RADR® assisted in the identification of ATRT as a target indication for LP-184. First, PTGR1 was confirmed as a key and unique biomarker for LP-100 and LP-184. Our findings are consistent with previous studies where PTGR1 was found to activate acylfulvenes and the naturally-derived Illudin drugs into active metabolites (Yu et al., 2012; Pietsch et al., 2013). Elevated PTGR1 is normally associated with increased reactive oxygen species (Sánchez-Rodríguez et al., 2017) and poor prognosis (Tapak et al., 2015; Wang et al., 2021). It was found that higher PTGR1 expression is associated with resistance to the combination of redox-modulating molecule auranofin (AUF) and vitamin C (VC) in breast cancer cells (Hatem et al., 2019). Consistently, increased PTGR1 levels correlates with lower sensitivities to non-acylfulvene pan-cancer compounds in the CellMinerCDB platform. The unique positive correlation with PTGR1 opens opportunities for LP-100 and LP-184 to precisely kill cancer cells with elevated PTGR1, which may be resistant to other drugs.
Our findings are also consistent with the fact that tumor response to alkylating agents such as LP-100 and LP-184 depends on DNA repair status (Jaspers et al., 2002; Koeppel et al., 2004; Kulkarni et al., 2021). The diversity of DNA repair genes and the relative importance of each DNA repair pathway in each tumor cell and cancer type limit the likelihood of identifying markers using expression of individual DNA repair genes alone. Enrichment analysis offered a method to examine the general status of many genes in the same pathway. As expected, several DNA repair pathways were significantly and strongly negatively correlated with LP-100 and LP-184 response. Though mutations in the DDR pathway are found to associate with better response to most alkylating agents, it is surprising that the NES of DDR pathways are negative for most other alkylating agents such as Cisplatin and Carmustine (Figure 3). A further examination revealed that 210 of the 310 DNA damage repair genes were negatively correlated with LP-184 and positively correlated with both Cisplatin and Carmustine, whereas only 29 genes were positively correlated with LP-184 and negatively correlated with both Cisplatin and Carmustine (Supplementary Table S3). It is possible that LP-184 is a better target therapeutic agent than cisplatin or carmustine for cancers with reduced DDR pathway expression. GSEA results suggest that having access to only the transcriptomic data of patient tumors may enable highly personalized LP-100 and LP-184 treatment.
Since LP-100 and LP-184 exhibited opposite DDR expression correlation patterns to Cisplatin and Carmustine, it is possible that they may be distinct from other alkylating agents in terms of possible biomarkers. Previous CellMinerCDB-based studies identified a pan-cancer alkylating agent marker, SLFN11 (Zoppoli et al., 2012), whose expression is positively correlated with responses to alkylating agents. Though SLFN11 is an important and effective marker for response with most alkylating agents (Table 2), SLFN11 expression was not correlated with LP-100 or LP-184 response even after the confounding effect of PTGR1 was removed (Figures 2D,E). Interestingly, GSEA and clustering analysis suggest that LP-184, along with LP-100 and Procarbazine, showed distinct correlation with pathways from the other alkylating agents (Figure 3). These analyses help distinguish where alkylating agents will be most useful. The negative association with DNA replication, damage response, and chromatin remodeling indicate a niche where these cellular processes are compromised. These results suggest that alkylating agents vary substantially in the underlying molecular pathways which make them effective. It also opens the possibility to test LP-100 and LP-184 in cancer types such as brain tumors where procarbazine has been used (Solimando and Waddell, 2017).
One of the strongest negative correlations from the GSEA analysis was chromatin remodeling pathway and LP-184 response, which prompted us to explore LP-184 in cancers with deficient SWI/SNF chromatin remodeling complex. ATRTs are rare pediatric brain tumors known to be associated with defects in chromatin remodeling pathway, primarily mutations in SMARCB1, or rarely, SMARCA4, which are components of the SWI/SNF chromatin remodeling complex. As the NCI60 tumor cell lines do not have ATRT cell lines or tumors with inactivating mutations in SMARCB1 or SMARCA4, a ML model was built and applied using RADR® to predict LP-184’s sensitivity in publicly available ATRT patient data. In two digital cohorts RADR® assisted in predicting that LP-184 show differences in sensitivity across patients whether they harbored mutations in SMARCB1 or SMARCA4, or whether they had mutations in one of the known and defined ATRT subtypes, MYC, TYR, or SHH. However, irrespective of the differences in either cohort, the predicted IC50 sensitivities of LP-184 for all was lower than 400 nM, meaning that each of these subtypes are predicted to be highly sensitive to LP-184. An important aspect of generating AI and ML insights is to validate them in vitro and/or in vivo. Here, using both in vitro and in vivo experiments, we validated insights from RADR® that ATRT cells were sensitive to LP-184 at low nM levels highly similar to values that were predicted in silico.
Ultra-rare and fatal cancers such as ATRT, which are estimated to be diagnosed in 60 patients per year in the US (Ostrom et al., 2014), often do not receive adequate research funds or attention due to its small market and population size. Deploying computational, AI, and ML tools represents a novel and translational approach for identifying indications efficiently and cost-effectively for novel or existing drugs and for improving treatment approaches that otherwise will not exist. In identifying LP-184 as a potential agent for ATRT patients in silico, we significantly expedited the timeline that it typically takes for preclinical drug development. It is noteworthy that the current approach (Supplementary Figure S2) is based on drug-induced cell survival data. Structure-activity relationship-based approaches also play important roles in drug design and development, especially at filtering out inactive compounds. The topic on the concepts and datasets has been discussed extensively by López-López et al. (2022) and will not be expanded here. Alterations in SWI/SNF members occur frequently, and SMARCA4 in particular is altered in numerous other tumor types (Mehta et al., 2021; Ngo and Postel-Vinay, 2022). This suggests that LP-184 could have similar anti-tumor activity as observed with ATRT in a wide range of tumors deficient in SWI/SNF activity.
Taken together, our case study suggests that cancer patients with high expression levels of PTGR1 and/or compromised DDR pathways are more likely to respond to LP-100 and LP-184 treatment than other DNA damaging agents. More importantly, using GSEA, drug comparison, and RADR® patient response predictions, we expanded LP-184’s indication to the rare cancer disease ATRT, which was further validated in vitro and in vivo. CellMinerCDB and Lantern’s AI and ML RADR® platform are novel tools to guide researchers to utilize niches and design further preclinical studies for drug development.
Data availability statement
Publicly available datasets were analyzed in this study. This data can be found here: CellminerCDB = https://discover.nci.nih.gov/rsconnect/cellminercdb/ Gene Expression Omnibus = GSE70678 (https://www.ncbi.nlm.nih.gov/geo/query/acc.cgi?acc=GSE70678) Gene Expression Omnibus = GSM1587795 (https://www.ncbi.nlm.nih.gov/geo/query/acc.cgi?acc=GSM1587795) Gene Expression Omnibus = GSE160748 (https://www.ncbi.nlm.nih.gov/geo/query/acc.cgi?acc=GSE160748) Code and Data to reproduce the result available at figshare—https://figshare.com/projects/Artificial_intelligence_platform_RADR_aids_in_the_discovery_of_DNA_damaging_agent_for_the_ultra-rare_cancer_atypical_teratoid_rhabdoid_tumors_ATRT_/149689.
Ethics statement
The animal study was reviewed and approved by the Institutional Animal Care and Use Committees of Rincon Bioscience.
Author contributions
Data analysis: JM, SV, UK, and JZ. Writing—original draft: JM, DS, UK, SV, JZ, AK, and CS. Writing—review and editing: NB, WR, FE, YP, PC, KB, JM, DS, UK, SV, JZ, AK, and CS. Supervision: KB and PC.
Funding
This study received funding from Lantern Pharma Inc. The funder had the involvement with the study design, data collection and analysis, decision to publish, and preparation of the manuscript. CellminerCDB studies are supported by the Intra-mural Program of the NCI, Center for Cancer Research (ZIC BC 011475).
Conflict of interest
Authors JM, DS, UK, JZ, AK, NB, CS, PC, and KB were employed by the company Lantern Pharma Inc.
The remaining authors declare that the research was conducted in the absence of any commercial or financial relationships that could be construed as a potential conflict of interest.
Publisher’s note
All claims expressed in this article are solely those of the authors and do not necessarily represent those of their affiliated organizations, or those of the publisher, the editors and the reviewers. Any product that may be evaluated in this article, or claim that may be made by its manufacturer, is not guaranteed or endorsed by the publisher.
Supplementary material
The Supplementary Material for this article can be found online at: https://www.frontiersin.org/articles/10.3389/fddsv.2022.1033395/full#supplementary-material
SUPPLEMENTARY FIGURE S1 | 2D structure of LP-100 and LP-184. 2D chemical structure of the LP-184 and LP-100 drug.
SUPPLEMENTARY FIGURE S2 | Workflow overview. Workflow showing how the analysis done and connected with each other.
SUPPLEMENTARY TABLE S1 | Single gene and drug response correlation. A table having Pearson correlation of single gene expression and drug response.
SUPPLEMENTARY TABLE S2 | LP-184 predicted sensitivity on ATRT datasets. Predicted LP-184 response on different ATRT datasets from GEO.
SUPPLEMENTARY FIGURE S3 | LP-184 model training and testing performance with feature importance. (A) Model performance on training data, (B) model performance on testing data, (C) feature importance.
SUPPLEMENTARY TABLE S3 | SLFN11 correlation with drug’s sensitivity. Pearson correlation of drug sensitivity with SLFN11 expression.
SUPPLEMENTARY FIGURE S4 | Weight loss measurement after LP-184 treatment. Weight loss comparison from LP-184 2 mg/kg vs. 4 mg/kg.
Abbreviations
CCLE, cancer cell line encyclopedia; DDA, DNA damaging agents; DDR, DNA damage repair; GDSC, genomics of drug sensitivity in cancer; MoA, mechanism of action; NCI, National cancer institute; NES, normalized enrichment score; RADR®, response algorithm for drug positioning and rescue.
References
Baliga, S., Gandola, L., Timmermann, B., Gail, H., Padovani, L., Janssens, G. O., et al. (2021). Brain tumors: Medulloblastoma, ATRT, ependymoma. Pediatr. Blood Cancer 68 (S2), e28395. doi:10.1002/pbc.28395
Barrett, T., Wilhite, S. E., Ledoux, P., Evangelista, C., Kim, I. F., Tomashevsky, M., et al. (2013). NCBI GEO: Archive for functional genomics data sets—update. Nucleic Acids Res. 41 (D1), D991–D995. doi:10.1093/nar/gks1193
Basu, A., and Krishnamurthy, S. (2010). Cellular responses to cisplatin-induced DNA damage. J. Nucleic Acids 2010, 201367. doi:10.4061/2010/201367
Cai, X., Gray, P. J., and Hoff, D. D. V. (2009). DNA minor groove binders: Back in the groove. Cancer Treat. Rev. 35 (5), 437–450. doi:10.1016/j.ctrv.2009.02.004
Chae, Y. K., Anker, J. F., Carneiro, B. A., Chandra, S., Kaplan, J., Kalyan, A., et al. (2016). Genomic landscape of DNA repair genes in cancer. Oncotarget 7 (17), 23312–23321. doi:10.18632/oncotarget.8196
Chatterjee, N., and Walker, G. C. (2017). Mechanisms of DNA damage, repair, and mutagenesis. Environ. Mol. Mutagen. 58 (5), 235–263. doi:10.1002/em.22087
Chun, H.-J. E., Johann, P. D., Milne, K., Zapatka, M., Buellesbach, A., Ishaque, N., et al. (2019). Identification and analyses of extra-cranial and cranial rhabdoid tumor molecular subgroups reveal tumors with cytotoxic T cell infiltration. Cell Rep. 29 (8), 2338–2354. e7. doi:10.1016/j.celrep.2019.10.013
Dick, R. A., Yu, X., and Kensler, T. W. (2004). NADPH alkenal/one oxidoreductase activity determines sensitivity of cancer cells to the chemotherapeutic alkylating agent irofulven. Clin. Cancer Res. 10 (4), 1492–1499. doi:10.1158/1078-0432.ccr-03-0162
Doucet-O’Hare, T. T., DiSanza, B. L., DeMarino, C., Atkinson, A. L., Rosenblum, J. S., Henderson, L. J., et al. (2021). SMARCB1 deletion in atypical teratoid rhabdoid tumors results in human endogenous retrovirus K (HML-2) expression. Sci. Rep. 11 (1), 12893. doi:10.1038/s41598-021-92223-x
Edgar, R., Domrachev, M., and Lash, A. E. (2002). Gene expression Omnibus: NCBI gene expression and hybridization array data repository. Nucleic Acids Res. 30 (1), 207–210. doi:10.1093/nar/30.1.207
Ginn, K. F., and Gajjar, A. (2012). Atypical teratoid rhabdoid tumor: Current therapy and future directions. Front. Oncol. 2, 114. doi:10.3389/fonc.2012.00114
Hasselblatt, M., Thomas, C., Federico, A., Nemes, K., Johann, P. D., Bison, B., et al. (2022). SMARCB1-deficient and SMARCA4-deficient malignant brain tumors with complex copy number alterations andTP53Mutations may represent the first clinical manifestation of Li-fraumeni syndrome. Am. J. Surg. Pathology 46, 1277–1283. doi:10.1097/pas.0000000000001905
Hatem, E., Azzi, S., Banna, N. E., He, T., Heneman-Masurel, A., Vernis, L., et al. (2019). Auranofin/vitamin C: A novel drug combination targeting triple-negative breast cancer. J. Natl. Cancer Inst. 111 (6), 597–608. doi:10.1093/ije/djy149
Herzig, M. C. S., Arnett, B., MacDonald, J. R., and Woynarowski, J. M. (1999). Drug uptake and cellular targets of hydroxymethylacylfulvene (HMAF). Biochem. Pharmacol. 58 (2), 217–225. doi:10.1016/s0006-2952(99)00085-4
Ho, B., Johann, P. D., Grabovska, Y., Andrianteranagna, M. J. D. D., Yao, F. P., Frühwald, M., et al. (2019). Molecular subgrouping of atypical teratoid/rhabdoid tumors-a reinvestigation and current consensus. Neuro. Oncol. 22 (5), 613–624. doi:10.1093/neuonc/noz235
Ho, D. M.-T., Shih, C.-C., Liang, M.-L., Tsai, C.-Y., Hsieh, T.-H., Tsai, C.-H., et al. (2015). Integrated genomics has identified a new AT/RT-like yet INI1-positive brain tumor subtype among primary pediatric embryonal tumors. BMC Med. Genomics 8 (1), 32. doi:10.1186/s12920-015-0103-3
Holdhof, D., Johann, P. D., Spohn, M., Bockmayr, M., Safaei, S., Joshi, P., et al. (2021). Atypical teratoid/rhabdoid tumors (ATRTs) with SMARCA4 mutation are molecularly distinct from SMARCB1-deficient cases. Acta Neuropathol. 141 (2), 291–301. doi:10.1007/s00401-020-02250-7
Hothorn, T., Bühlmann, P., Dudoit, S., Molinaro, A., and Laan, M. J. V. D. (2006). Survival ensembles. Biostatistics 7 (3), 355–373. doi:10.1093/biostatistics/kxj011
Jaspers, N. G. J., Raams, A., Kelner, M. J., Ng, J. M. Y., Yamashita, Y. M., Takeda, S., et al. (2002). Anti-tumour compounds illudin S and Irofulven induce DNA lesions ignored by global repair and exclusively processed by transcription- and replication-coupled repair pathways. DNA Repair 1 (12), 1027–1038. doi:10.1016/s1568-7864(02)00166-0
Johann, P. D., Erkek, S., Zapatka, M., Kerl, K., Buchhalter, I., Hovestadt, V., et al. (2016). Atypical teratoid/rhabdoid tumors are comprised of three epigenetic subgroups with distinct enhancer landscapes. Cancer Cell 29 (3), 379–393. doi:10.1016/j.ccell.2016.02.001
Kathad, U., Kulkarni, A., McDermott, J. R., Wegner, J., Carr, P., Biyani, N., et al. (2021). A machine learning-based gene signature of response to the novel alkylating agent LP-184 distinguishes its potential tumor indications. BMC Bioinforma. 22 (1), 102. doi:10.1186/s12859-021-04040-8
Koeppel, F., Poindessous, V., Lazar, V., Raymond, E., Sarasin, A., and Larsen, A. K. (2004). Irofulven cytotoxicity depends on transcription-coupled nucleotide excision repair and is correlated with XPG expression in solid tumor cells. Clin. Cancer Res. 10 (16), 5604–5613. doi:10.1158/1078-0432.ccr-04-0442
Kondo, N., Takahashi, A., Ono, K., and Ohnishi, T. (2010). DNA damage induced by alkylating agents and repair pathways. J. Nucleic Acids 2010, 543531. doi:10.4061/2010/543531
Korotkevich, G., Sukhov, V., Budin, N., Shpak, B., Artyomov, M. N., and Sergushichev, A. (2021). Fast gene set enrichment analysis. bioRxiv. doi:10.1101/060012
Kuhn, M. (2008). Building predictive models in R using the caret package. J. Stat. Softw. 28 (5). doi:10.18637/jss.v028.i05
Kulkarni, A., Restifo, D., Astsaturov, I. A., Kathad, U., McDermott, J., Bhatia, K., et al. (2021). Synthetic lethality of LP-184, a next generation acylfulvene, in ex vivo PDX models with homologous recombination defects. J. Clin. Oncol. 39 (15), e15064. doi:10.1200/jco.2021.39.15_suppl.e15064
Kumar, R., Li, D.-Q., Müller, S., and Knapp, S. (2016). Epigenomic regulation of oncogenesis by chromatin remodeling. Oncogene 35 (34), 4423–4436. doi:10.1038/onc.2015.513
Liberzon, A., Birger, C., Thorvaldsdóttir, H., Ghandi, M., Mesirov, J. P., and Tamayo, P. (2015). The Molecular Signatures Database (MSigDB) hallmark gene set collection. Cell Syst. 1 (6), 417–425. doi:10.1016/j.cels.2015.12.004
Liberzon, A., Subramanian, A., Pinchback, R., Thorvaldsdóttir, H., Tamayo, P., and Mesirov, J. P. (2011). Molecular signatures database (MSigDB) 3.0. Bioinformatics 27 (12), 1739–1740. doi:10.1093/bioinformatics/btr260
López-López, E., Fernández-de Gortari, E., and Medina-Francoa, J. L. (2022). Yes SIR! On the structure\x{2013}inactivity relationships in drug discovery. Drug Discovery Today. 27 (8), 2353–2362. doi:10.1016/j.drudis.2022.05.005
Luan, J., Gao, X., Hu, F., Zhang, Y., and Gou, X. (2019). SLFN11 is a general target for enhancing the sensitivity of cancer to chemotherapy (DNA-damaging agents). J. Drug Target. 28 (1), 33–40. doi:10.1080/1061186x.2019.1616746
Luna, A., Elloumi, F., Varma, S., Wang, Y., Rajapakse, V. N., Aladjem, M. I., et al. (2020). CellMiner Cross-Database (CellMinerCDB) version 1.2: Exploration of patient-derived cancer cell line pharmacogenomics. Nucleic Acids Res. 49 (D1), D1083–D1093. doi:10.1093/nar/gkaa968
Lünenbürger, H., Lanvers-Kaminsky, C., Lechtape, B., and Frühwald, M. C. (2010). Systematic analysis of the antiproliferative effects of novel and standard anticancer agents in rhabdoid tumor cell lines. Anticancer. Drugs 21 (5), 514–522. doi:10.1097/cad.0b013e3283375d5c
Mehta, A., Bansal, D., Tripathi, R., and Jajodia, A. (2021). SMARCA4/BRG1 protein-deficient thoracic tumors dictate re-examination of small biopsy reporting in non–small cell lung cancer. J. Pathol. Transl. Med. 55 (5), 307–316. doi:10.4132/jptm.2021.05.11
Murai, J., Thomas, A., Miettinen, M., and Pommier, Y. (2019). Schlafen 11 (SLFN11), a restriction factor for replicative stress induced by DNA-targeting anti-cancer therapies. Pharmacol. Ther. 201, 94–102. doi:10.1016/j.pharmthera.2019.05.009
Ngo, C., and Postel-Vinay, S. (2022). Immunotherapy for SMARCB1-deficient sarcomas: Current evidence and future developments. Biomedicines 10 (3), 650. doi:10.3390/biomedicines10030650
Ostrom, Q. T., Chen, Y., Blank, P. M., Ondracek, A., Farah, P., Gittleman, H., et al. (2014). The descriptive epidemiology of atypical teratoid/rhabdoid tumors in the United States, 2001–2010. Neuro. Oncol. 16 (10), 1392–1399. doi:10.1093/neuonc/nou090
Owusu, M., Bannauer, P., Ferreira da Silva, J., Mourikis, T. P., Jones, A., Májek, P., et al. (2019). Mapping the Human Kinome in Response to DNA Damage. Cell reports 26 (3), 555–563. doi:10.1016/j.celrep.2018.12.087
Pietsch, K. E., Midwoud, P. M., Villalta, P. W., and Sturla, S. J. (2013). Quantification of acylfulvene– and illudin S–DNA adducts in cells with variable bioactivation capacities. Chem. Res. Toxicol. 26 (1), 146–155. doi:10.1021/tx300430r
Rajapakse, V. N., Luna, A., Yamade, M., Loman, L., Varma, S., Sunshine, M., et al. (2018). CellMinerCDB for integrative cross-database genomics and pharmacogenomics analyses of cancer cell lines. IScience 10, 247–264. doi:10.1016/j.isci.2018.11.029
Reinhold, W. C., Varma, S., Sousa, F., Sunshine, M., Abaan, O. D., Davis, S. R., et al. (2014). NCI-60 whole exome sequencing and pharmacological CellMiner analyses. PLoS ONE 9 (7), e101670. doi:10.1371/journal.pone.0101670
Reinhold, W. C., Varma, S., Sunshine, M., Elloumi, F., Ofori-Atta, K., Lee, S., et al. (2019). RNA sequencing of the NCI-60: Integration into CellMiner and CellMiner CDB. Cancer Res. 79 (13), 3514–3524. doi:10.1158/0008-5472.can-18-2047
Reinhold, W. C., Varma, S., Sunshine, M., Rajapakse, V., Luna, A., Kohn, K. W., et al. (2017). The NCI-60 methylome and its integration into CellMiner. Cancer Res. 77 (3), 601–612. doi:10.1158/0008-5472.can-16-0655
Sánchez-Rodríguez, R., Torres-Mena, J. E., Quintanar-Jurado, V., Chagoya-Hazas, V., Castillo, E. R., Yauner, L., et al. (2017). Ptgr1 expression is regulated by NRF2 in rat hepatocarcinogenesis and promotes cell proliferation and resistance to oxidative stress. Free Radic. Biol. Med. 102, 87–99. doi:10.1016/j.freeradbiomed.2016.11.027
Shoemaker, R. H. (2006). The NCI60 human tumour cell line anticancer drug screen. Nat. Rev. Cancer 6 (10), 813–823. doi:10.1038/nrc1951
Solimando, D. A., and Waddell, J. A. (2017). Procarbazine, lomustine, and vincristine (PCV) regimen for central nervous system tumors. Hosp. Pharm. 52 (2), 98–104. doi:10.1310/hpj5202-98
Staake, M. D., Kashinatham, A., McMorris, T. C., Estes, L. A., and Kelner, M. J. (2016). Hydroxyurea derivatives of irofulven with improved antitumor efficacy. Bioorg. Med. Chem. Lett. 26 (7), 1836–1838. doi:10.1016/j.bmcl.2016.02.028
Strobl, C., Boulesteix, A.-L., Kneib, T., Augustin, T., and Zeileis, A. (2008). Conditional variable importance for random forests. BMC Bioinforma. 9 (1), 307. doi:10.1186/1471-2105-9-307
Strobl, C., Boulesteix, A.-L., Zeileis, A., and Hothorn, T. (2007). Bias in random forest variable importance measures: Illustrations, sources and a solution. BMC Bioinforma. 8 (1), 25. doi:10.1186/1471-2105-8-25
Subramanian, A., Tamayo, P., Mootha, V. K., Mukherjee, S., Ebert, B. L., Gillette, M. A., et al. (2005). Gene set enrichment analysis: A knowledge-based approach for interpreting genome-wide expression profiles. Proc. Natl. Acad. Sci. U. S. A. 102 (43), 15545–15550. doi:10.1073/pnas.0506580102
Tapak, L., Saidijam, M., Sadeghifar, M., Poorolajal, J., and Mahjub, H. (2015). Competing risks data analysis with high-dimensional covariates: An application in bladder cancer. Genomics Proteomics Bioinforma. 13 (3), 169–176. doi:10.1016/j.gpb.2015.04.001
Tate, J. G., Bamford, S., Jubb, H. C., Sondka, Z., Beare, D. M., Bindal, N., et al. (2018). COSMIC: The Catalogue of somatic mutations in cancer. Nucleic Acids Res. 47, D941–D947. doi:10.1093/nar/gky1015
Tomczak, K., Czerwińska, P., and Wiznerowicz, M. (2015). The cancer genome Atlas (TCGA): An immeasurable source of knowledge. Contemp. Oncol. 19 (1A), A68–A77. doi:10.5114/wo.2014.47136
Torchia, J., Golbourn, B., Feng, S., Ho, K. C., Sin-Chan, P., Vasiljevic, A., et al. (2016). Integrated (epi)-Genomic analyses identify subgroup-specific therapeutic targets in CNS rhabdoid tumors. Cancer Cell 30 (6), 891–908. doi:10.1016/j.ccell.2016.11.003
Wang, J., Wiltshire, T., Wang, Y., Mikell, C., Burks, J., Cunningham, C., et al. (2004). ATM-Dependent CHK2 activation induced by anticancer agent, irofulven. J. Biol. Chem. 279 (38), 39584–39592. doi:10.1074/jbc.m400015200
Wang, X., Yin, G., Zhang, W., Song, K., Zhang, L., and Guo, Z. (2021). Prostaglandin Reductase 1 as a potential therapeutic target for cancer therapy. Front. Pharmacol. 12, 717730. doi:10.3389/fphar.2021.717730
Wang, Y., Wiltshire, T., Senft, J., Reed, E., and Wang, W. (2007). Irofulven induces replication-dependent CHK2 activation related to p53 status. Biochem. Pharmacol. 73 (4), 469–480. doi:10.1016/j.bcp.2006.10.023
Warren, A., Chen, Y., Jones, A., Shibue, T., Hahn, W. C., Boehm, J. S., et al. (2021). Global computational alignment of tumor and cell line transcriptional profiles. Nat. Commun. 12 (1), 22. doi:10.1038/s41467-020-20294-x
Wiltshire, T., Senft, J., Wang, Y., Konat, G. W., Wenger, S. L., Reed, E., et al. (2007). BRCA1 contributes to cell cycle arrest and chemoresistance in response to the anticancer agent irofulven. Mol. Pharmacol. 71 (4), 1051–1060. doi:10.1124/mol.106.029504
Woynarowski, J. M., Napier, C., Koester, S. K., Chen, S.-F., Troyer, D., Chapman, W., et al. (1997). Effects on DNA integrity and apoptosis induction by a novel antitumor sesquiterpene drug, 6-hydroxymethylacylfulvene (HMAF, MGI 114). Biochem. Pharmacol. 54 (11), 1181–1193. doi:10.1016/s0006-2952(97)00321-3
Yu, X., Erzinger, M. M., Pietsch, K. E., Cervoni-Curet, F. N., Whang, J., Niederhuber, J., et al. (2012). Up-regulation of human Prostaglandin Reductase 1 improves the efficacy of hydroxymethylacylfulvene, an antitumor chemotherapeutic agent. J. Pharmacol. Exp. Ther. 343 (2), 426–433. doi:10.1124/jpet.112.195768
Keywords: Lantern Pharma, RADR®, NCI, CellMinerCDB, ATRT, LP-184, rare disease, machine learning
Citation: McDermott J, Sturtevant D, Kathad U, Varma S, Zhou J, Kulkarni A, Biyani N, Schimke C, Reinhold WC, Elloumi F, Carr P, Pommier Y and Bhatia K (2022) Artificial intelligence platform, RADR®, aids in the discovery of DNA damaging agent for the ultra-rare cancer Atypical Teratoid Rhabdoid Tumors. Front. Drug. Discov. 2:1033395. doi: 10.3389/fddsv.2022.1033395
Received: 31 August 2022; Accepted: 27 September 2022;
Published: 11 October 2022.
Edited by:
José L. Medina-Franco, National Autonomous University of Mexico, MexicoReviewed by:
Luca Pinzi, University of Modena and Reggio Emilia, ItalyJosé J. Naveja, Johannes Gutenberg University Mainz, Germany
Edgar López-López, Instituto Politécnico Nacional de México (CINVESTAV), Mexico
Miquel Duran-Frigola, Ersilia Open Source Initiative, United Kingdom
Copyright © 2022 McDermott, Sturtevant, Kathad, Varma, Zhou, Kulkarni, Biyani, Schimke, Reinhold, Elloumi, Carr, Pommier and Bhatia. This is an open-access article distributed under the terms of the Creative Commons Attribution License (CC BY). The use, distribution or reproduction in other forums is permitted, provided the original author(s) and the copyright owner(s) are credited and that the original publication in this journal is cited, in accordance with accepted academic practice. No use, distribution or reproduction is permitted which does not comply with these terms.
*Correspondence: Joseph McDermott, am9zZXBoQGxhbnRlcm5waGFybWEuY29t; Umesh Kathad, dW1lc2hAbGFudGVybnBoYXJtYS5jb20=; Sudhir Verma, c3VkaGlyLnZhcm1hQGhpdGhydS5jb20=