 Greta L. Chappell
 William L. Nelson1,2
 Ryan E. Baumbach
- 1National High Magnetic Field Laboratory, Florida State University, Tallahassee, FL, United States
- 2Department of Physics, Florida State University, Tallahassee, FL, United States
Studies that control the unit cell volume and electronic composition have been useful in revealing what factors lead to hidden order and superconductivity in the strongly correlated electron system URu2Si2. For example, isoelectronic tuning that increases the hybridization between the f and conduction electron states (i.e., applied pressure and Ru → Fe/Os chemical substitution) 1) converts hidden order into antiferromagnetism and 2) destroys the superconductivity. The impact of nonisoelectronic chemical substitution has been less clear, but several unifying trends have recently emerged for chemical substitution vectors that qualitatively add electrons (e.g., Ru → Rh/Ir and Si → P). This includes 1) the rapid destruction of hidden order and superconductivity, 2) composition regions where the underlying Kondo lattice is preserved but does not harbor an ordered state, and 3) the emergence of complex magnetism at large substitutions. In order to assess the limits of this perspective, we have investigated the series U(Ru1−xPtx)2Si2 for x ≲ 0.19, where the Ru and Pt d-shells differ substantially from each other. Magnetic susceptibility, electrical resistivity, and heat capacity measurements unexpectedly reveal a phase diagram with notable similarities to those of other electron doping series. This result reinforces the viewpoint that there is a quasi-universal affect that results from electron doping in this material, and we anticipate that an understanding of these trends will be useful to isolate what factors are foundational for hidden order and superconductivity.
1 Introduction
The heavy fermion superconductor (Tc = 1.4 K) URu2Si2 has attracted sustained interest since its discovery in 1985, owing mainly to the enigmatic hidden order (HO) phase that it enters through a second-order phase transition at T0 = 17.5 K (Palstra et al., 1985; Maple et al., 1986; Schlabitz et al., 1986). Like many of the related UT2X2 (T = transition metal and X = Si, Ge) compounds (Żołnierek and Mulak, 1995), URu2Si2 crystallizes in the ubiquitous ThCr2Si2-type tetragonal structure and exhibits Kondo-lattice hybridization of the f electrons with the conduction electrons (Endstra et al., 1993). However, in contrast to these chemical/structural analogs, many of which exhibit more conventional low-temperature behavior (e.g., antiferromagnetism in URh2Si2 (Umarji et al., 1987) and Pauli paramagnetism in UFe2Si2 (Szytuka et al., 1988)), extensive investigations have not yet led to a definitive understanding of hidden order, why it is able to host superconductivity, and what factors are key in promoting its unique behavior.
A productive strategy for addressing these questions has been to perturb the electronic state and structure using tuning parameters such as applied pressure (McElfresh et al., 1987; Motoyama et al., 2003; Hassinger et al., 2008; Butch et al., 2010), magnetic fields (De Boer et al., 1986; Nieuwenhuys, 1987; Kim et al., 2003a; Kim et al., 2003b), and chemical substitution (Amitsuka et al., 1988; Dalichaouch et al., 1989; Dalichaouch et al., 1990a; Dalichaouch et al., 1990b; Miyako et al., 1991; Kawarazaki et al., 1994; Yokoyama et al., 2004; Bauer et al., 2005; Jeffries et al., 2007; Yokoyama and Amitsuka, 2007; Butch and Maple, 2009; Butch and Maple, 2010; Kanchanavatee et al., 2011; Kanchanavatee et al., 2014; Das et al., 2015; Ran et al., 2016; Wilson et al., 2016). Applied pressure (McElfresh et al., 1987; Motoyama et al., 2003; Hassinger et al., 2008; Butch et al., 2010) and isoelectronic chemical substitution at the Ru site [Ru → Fe, Os (Kanchanavatee et al., 2011; Kanchanavatee et al., 2014; Das et al., 2015; Ran et al., 2016; Wilson et al., 2016)] produce similar results: as the hybridization strength increases, HO is first enhanced, and then it is converted to antiferromagnetism (LMAFM). Superconductivity is only observed within the HO region. Nonisoelectronic substitution at the Ru site is less straightforward: Ru → Mn, Tc, Re substitution (Dalichaouch et al., 1989; Dalichaouch et al., 1990a; Dalichaouch et al., 1990b; Bauer et al., 2005; Jeffries et al., 2007; Butch and Maple, 2009; Butch and Maple, 2010) (effectively removing electrons) suppresses HO and stabilizes complex ferromagnetism, while Ru → Rh, Ir (Amitsuka et al., 1988; Dalichaouch et al., 1990a; Miyako et al., 1991; Kawarazaki et al., 1994; Yokoyama et al., 2004; Yokoyama and Amitsuka, 2007) (effectively adding electrons) suppresses HO, stabilizes a region with no long range magnetic order, and eventually gives rise to a new antiferromagnetically ordered state. More recently, studies have shown that Si → P substitution produces a similar phase diagram (Gallagher et al., 2016a; Gallagher et al., 2016b; Chappell et al., 2020). This raises the possibility that nonisoelectronic chemical substitution that effectively adds electrons, regardless of how it is accomplished, may result in a unified phase diagram. This is unexpected given the differences between 1) substitution at the Ru or Si sites, which are crystallographically distinct, and 2) differences between substitution of 3d, 4d, 5d, and s/p electrons, which have differing valence-electron wave functions and may impact hybridization in different ways.
In order to probe the possibility that some nonisoelectronic substitution series share related phase diagrams, we investigated the chemical substitution series
2 Experimental Methods
Polycrystalline samples of
Magnetization measurements were done using a Quantum Design Magnetic Property Measurement System in an applied magnetic field H = 5 kOe and at temperatures T = 1.8–300 K. The samples that were used for these measurements were crushed into powder in order to measure the polycrystalline average magnetic susceptibility χavg = (χc + 2χab)/3. Electrical resistivity ρ(T) measurements were done using a standard four-wire resistance probe in a Quantum Design Physical Property Measurement System (PPMS) at temperatures T = 1.8–300 K using a He4 cryostat and also for T = 0.14–20 K with an adiabatic demagnetization refrigerator PPMS insert. Heat capacity measurements were conducted using the thermal relaxation method in a PPMS for T = 1.8–55 K. Magnetoresistivity measurements were carried out for semi-aligned large grain specimens using a resistive magnet at the NHMFL facility in Tallahassee FL at T ≈ 0.39 K and with the applied field H ≤ 41 T parallel to the crystallographic c axis.
3 Results
The powder x-ray diffraction patterns for
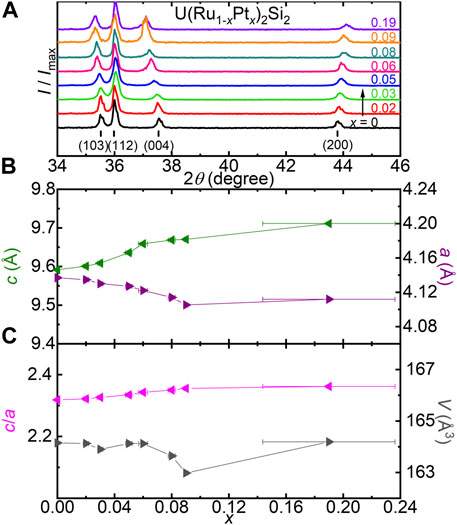
FIGURE 1. (A) The powder x-ray diffraction intensity normalized to the maximum value I/Imax vs. scattering angle 2θ for
Results for the polycrystalline average magnetic susceptibility χavg(T) = (χc + 2χab)/3 are shown in Figure 2. The curve for x = 0 shows the expected Curie-Weiss behavior at elevated temperatures, a Kondo coherence maximum at
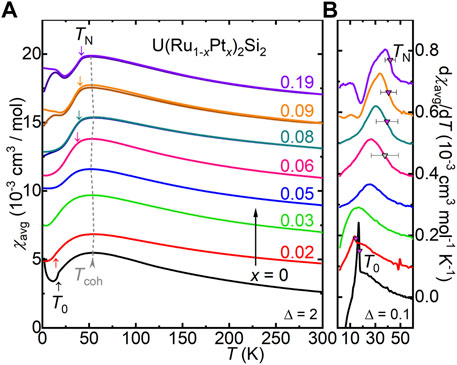
FIGURE 2. (A) Polycrystalline average magnetic susceptibility χavg = (χc + 2χab)/3 vs. temperature T for
Temperature-dependent electrical resistivity ρ/ρ300K(T) results are shown in Figure 3. The expected behavior is seen for x = 0 (Maple et al., 1986; Schlabitz et al., 1986; Baumbach et al., 2014; Palstra et al., 1986), where ρ/ρ300K(T) first increases with decreasing temperature and subsequently goes through a maximum near Tcoh,ρ ≈ 75 K as the coherent Kondo lattice forms. Similar behavior persists for x ≲ 0.05, where there is little change in Tcoh,ρ. As is seen in χavg(T), the HO transition (defined as the local minimum in d(ρ/ρ300K)/dT, Figure 3B) shifts to lower T for x ≈ 0.02 and is not present for larger concentrations. Although x ≈ 0.02 exhibits ordering that connects to the hidden order phase boundary, measurements as low as 280 mK reveal no evidence for superconductivity (SC) (Figure 3C, inset). This is distinct from what is seen in other substitution series (e.g., Si → P (Gallagher et al., 2016a; Gallagher et al., 2016b) and Ru → Fe (Kanchanavatee et al., 2011)), where hidden order hosts SC even for chemically substituted specimens. The reason for the absence of SC is not clear, but it may suggest that, instead of enabling a smooth suppression of hidden order, Pt substitution stabilizes a magnetic phase that is similar to the antiferromagnetism that is seen at low x in the Ru → Rh series (Dalichaouch et al., 1990a; Amitsuka et al., 1988; Miyako et al., 1991; Kawarazaki et al., 1994; Yokoyama et al., 2004; Yokoyama and Amitsuka, 2007) or the parasitic small moment antiferromagnetism that occurs due to defects in the parent compound (Niklowitz et al., 2010). Recent results also suggest that antiferromagnetism intervenes in the Si → P substitution series at the boundary of the hidden order phase (Chappell et al., 2020). Once the low-x ordering is suppressed, there is no evidence for an ordered state for x ≈ 0.03–0.05 at temperatures above 140 mK. In ρ/ρ300K(T) at large x, the antiferromagnetic ordering appears as a subtle humplike feature that is followed by a reduction of the resistivity at low temperatures. These features are more evident in the derivative of the data (Figure 3B), and this characteristic shape is observed for x ≳ 0.06. The transition temperature, defined as the midpoint of the upturn in d(ρ/ρ300K)/dT (star symbols and bars to indicate the temperature widths, Figure 3B), shifts to slightly higher temperature with increasing x and is in agreement with the values of TN that are seen in χavg(T). Also noteworthy is that the shape of the anomaly in ρ/ρ300K(T) evolves, becoming gradually more humplike at larger x. This could indicate that a change in the magnetic ordering is taking place. Over the large-x range, Tcoh,ρ is difficult to define, because it occurs at temperatures that are similar to that of the magnetic ordering; however, it appears to roughly remain constant. Finally, we note that the residual resistivity increases strongly with increasing x. This may be due to disorder effects, but note that over similar x ranges in other substitution series (e.g., URu2−xRhxSi2 (Dalichaouch et al., 1990a), URu2−x(Fe,Os)xSi2 (Kanchanavatee et al., 2011; Kanchanavatee et al., 2014), and URu2Si2−xPx (Gallagher et al., 2016a; Gallagher et al., 2016b)) this effect is much weaker. Therefore, we speculate that this could instead be associated with an intrinsic electronic effect.

FIGURE 3. (A) The electrical resistivity normalized to the room temperature value ρ/ρ300K vs. log(T) for
The heat capacity results are shown in Figure 4 and Supplementary Figure S4. The peak that is associated with the HO transition decreases for x ≈ 0.02 and is removed for x ≈ 0.03 (Figure 4A). Similar to the Si → P (Gallagher et al., 2016a; Gallagher et al., 2016b) and Ru → Rh (Amitsuka et al., 1988) substitution series, the height of the peak decreases and the low temperature value of C/T increases over this x region. In the region x ≈ 0.03–0.05, there is no evidence for an ordered state, but Fermi-liquid behavior is observed where the electronic component γ remains enhanced. The AFM transition for x ≈ 0.06 (Figure 4B) develops from a broad peak to a more pronounced peak for x ≈ 0.19 and is similar to the AFM transition seen in the phosphorus-substituted series (Gallagher et al., 2016a; Gallagher et al., 2016b). TN is taken as the midpoint of the local minimum and maximum, and the bars indicate the temperature widths of the transitions. We also note that for specimens that exhibit antiferromagnetism, the low-temperature value of C/T is reduced from what is seen at lower x.
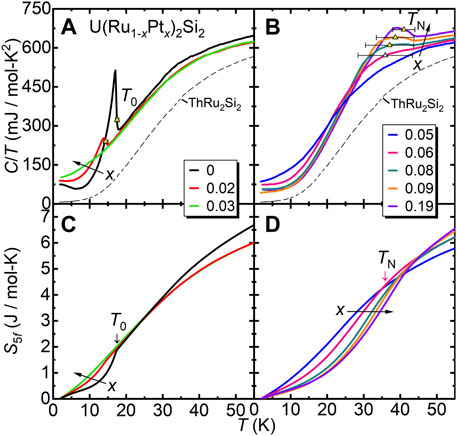
FIGURE 4. The heat capacity divided by temperature C/T vs. T for
In Figures 4C,D, the magnetic entropy S5f is shown, which is calculated by subtracting C/T of the nonmagnetic analog ThRu2Si2 (gray-dashed curve) and integrating from 1.8 − 55 K. As seen earlier for the Si → P series (Gallagher et al., 2016a; Gallagher et al., 2016b), the entropy associated with the HO transition is reduced for the chemically substituted sample. For samples with AFM, S5f gradually increases overall, and the reduction following TN is consistent with the loss of entropy due to the magnetic ordering. The behavior of S5f(T) and its value at TN is comparable to what is seen for the Si → P series at large x.
Finally, results for electrical resistivity measurements under applied magnetic fields are shown in Figure 5. The behavior for x = 0 is well known (De Boer et al., 1986; Nieuwenhuys, 1987; Kim et al., 2003a; Kim et al., 2003b), where a complex family of high-field ordered states was previously described. For x ≈ 0.02, the curve is reminiscent of what is seen for the parent compound: there is initially a strong increase and broad peak around 31 T that is abruptly followed by a cascade of transitions, and an eventual strong reduction in the resistivity near 38 T when the system enters the high-field polarized phase. The behavior for x ≈ 0.03 is distinct from what is seen in the HO x region. Here, the initial increase in ρ/ρ300K is weak and there is an abrupt increase near 31 T that is followed by an abrupt decrease at 38 T. This square shape curve is reminiscent of what was previously seen in Si → P (Wartenbe et al., 2017; Huang et al., 2019) and Ru → Rh (Kuwahara et al., 2013) substitution series within the x range that hosts a paramagnetic Kondo lattice without long-range ordered ground states. Finally, for x ≈ 0.19, ρ/ρ300K decreases weakly with H until it undergoes a more rapid reduction near 33 T, indicating the occurrence of a metamagnetic phase transition. This is similar to what was earlier seen in the antiferromagnetic x region for the Si → P series (Wartenbe et al., 2017; Huang et al., 2019), although the critical field is substantially reduced.
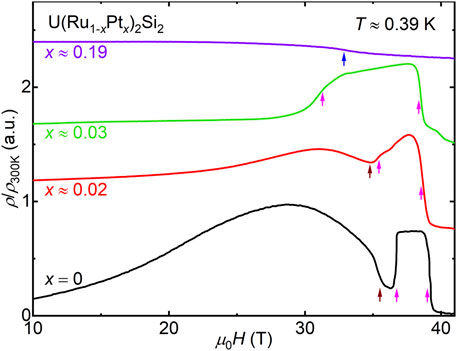
FIGURE 5. The magnetoresistivity normalized to the room temperature value ρ/ρ300K vs. applied magnetic field μ0H for
4 Discussion
The phase diagram for U(Ru1−xPtx)2Si2 x ≲ 0.19, constructed from χavg(T), ρ/ρ300K(T), and C/T(T) is shown in Figure 6. The HO transition is suppressed for x ≲ 0.02 and abruptly collapses before x ≈ 0.03 (red shaded region). Superconductivity is only observed for the parent compound, which may suggest that hidden order is rapidly converted to antiferromagnetism, similar to what is seen in the Ru → Rh substitution series (Dalichaouch et al., 1990a; Amitsuka et al., 1988; Miyako et al., 1991; Kawarazaki et al., 1994; Yokoyama et al., 2004; Yokoyama and Amitsuka, 2007) and under applied pressure (McElfresh et al., 1987; Motoyama et al., 2003; Hassinger et al., 2008; Butch et al., 2010; Niklowitz et al., 2010). This is followed by a region (0.03 ≲ x ≲ 0.05) with a paramagnetic (PM) Kondo lattice with a heavy-Fermi-liquid ground state that is similar to the high-temperature behavior for x = 0, but no ordering is seen down to low temperatures (arrows). Finally, magnetic order with an antiferromagnetic character emerges and strengthens for 0.06 ≲ x ≲ 0.19 (blue shaded region). The data for x ≈ 0.06 are highlighted in gray because the phase transition is difficult to detect and is only distinguished in the heat capacity measurement. Also noteworthy is that there is an evolution in the large-x magnetic behavior, which is characterized by the appearance of hysteresis in χavg(T) and a change in the shape of the ρ/ρ300K(T) curve. Finally, the Kondo coherence temperature Tcoh in χavg(T) (dashed gray line in Figures 2A, 6) appears to remain constant, or slightly decreases with increasing x, suggesting that the Kondo lattice itself is nearly insensitive to doping. Taken together, these results reveal a strong similarity between the Ru → Pt phase diagram and those for the Ru → Rh (Amitsuka et al., 1988; Dalichaouch et al., 1990a; Miyako et al., 1991; Kawarazaki et al., 1994; Yokoyama et al., 2004; Yokoyama and Amitsuka, 2007) and Si → P (Gallagher et al., 2016a; Gallagher et al., 2016b) substitution series, all of which feature an evolution from the HO to NO to AFM regions with increasing x and a robust Kondo-lattice energy scale that is somewhat insensitive to chemical substitution. Furthermore, the evolution of the field induced phases in the various regions resembles earlier results in other series. These similarities are unexpected, given that in each case 1) the lattice tuning is distinct and 2) the type of electrons that are being added differ substantially from each other. By clarifying the reasons for this similarity, it may be possible to further understand the factors that lead to the stability of hidden order in this distinct region of the electronic phase space. One attempt to do this was recently seen for the Si → P series, where tight-binding Hartree-Fock calculations show 1) that the radial probability distributions for the phosphorus ions are more tightly bound than that of the silicon and 2) that the energy difference between the orbitals decreases with increasing x (Chappell et al., 2020). The cumulative effect is that Si → P substitution decreases the hybridization strength, which correlates with the weakening of HO. At larger x, electrical charge tuning has been proposed to play an important role in determining the ground-state behavior. From this perspective, it might be proposed that Ru → Rh and Pt substitution also evolve along similar tuning axes, where decreasing hybridization strength and addition of charge carriers simultaneously tune the behavior. We note that this scenario is supported by earlier work studying trends in the UT2X2 (T = transition metal and X = Si,Ge) family, which suggest that the hybridization strength tends to decrease going from the Fe column towards the Cu column. Furthermore, all examples in the Co, Ni, and Cu columns exhibit magnetic ordering due to the uranium ions. (Endstra et al., 1993).
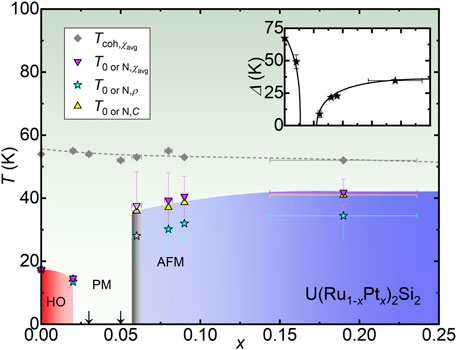
FIGURE 6. The transition temperature T vs. x phase diagram for
Finally, in order to gain further insight into the different regions of the phase diagram, fits to the low-temperature-normalized resistivity were done using the expression,
where ρ0/ρ300K is the normalized residual resistivity, AT2 is the Fermi-liquid term, and the final term represents electron-magnon scattering due to spin excitations with an energy gap Δ (Figure 7) (McElfresh et al., 1987; Hassinger et al., 2008; Chappell et al., 2020; Palstra et al., 1986; Jeffries et al., 2008; Motoyama et al., 2008). It is already established that this expression merely provides a phenomenological description of the data and does not suggest that the hidden ordering is due to simple magnetism. We nonetheless use it in order to make a direct comparison to earlier studies, where Δ is associated with an energy gap that opens over the Fermi surface; e.g., as seen in measurements such as the heat capacity (Maple et al., 1986), inelastic neutron scattering (Wiebe et al., 2007), and angle-resolved photo-emission spectroscopy (ARPES) (Santander-Syro et al., 2009; Yoshida et al., 2010; Meng et al., 2013; Bareille et al., 2014). The best fits to the data were determined by varying the maximum temperature of the fit range Tmax, and evaluating the maximum of the goodness of the fits R. For concentrations exhibiting HO (x ≲ 0.02) or AFM (0.06 ≲ x ≲ 0.19) the maximum in R is greater than 0.999. For concentrations with no ordering (0.03 ≲ x ≲ 0.05) fits to the data using Eq. 1 yielded Δ = 0 (Figure 7B). Results for the energy gap Δ are shown in the inset of Figure 6, where Δ decreases with increasing x in the HO region, mirroring the HO phase boundary. In the AFM x-region, Δ grows with increasing x and saturates near 35 K. These trends are similar to what was earlier seen for Si → P, where Δ decreases from 70 to 40 K in the HO region (Gallagher et al., 2016a; Gallagher et al., 2016b; Chappell et al., 2020). However, the absolute value of Δ differs from what was seen for the Si → P series, where Δ saturates at a larger value near 100 K. This provides some evidence that this type of magnetic ordering is distinct from that seen in other tuning series.
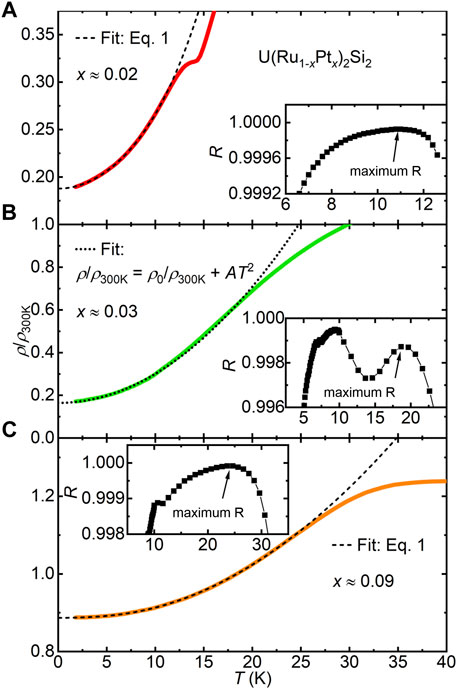
FIGURE 7. ρ/ρ300K vs. T for U(Ru1−xPtx)2Si2 x ≈ (A) 0.02, (B) 0.03, and (C) 0.09. The dashed and dotted lines are the best fits to the data as described in the text. Insets: Goodness of fit R vs. the maximum temperature of the fit range Tmax.
5 Conclusion
We have introduced the phase diagram for U(Ru1−xPtx)2Si2 x ≲ 0.19 constructed from χ(T), ρ(T), and C(T) measurements. The HO transition is suppressed and abruptly collapses before x ≈ 0.03. Superconductivity is only observed for the parent compound, which may suggest that HO is rapidly converted to magnetic order by x ≈ 0.02. For 0.03 ≲ x ≲ 0.05, no ordering is observed for T ≳ 280 mK and there is a PM Kondo lattice with a heavy-Fermi-liquid ground state. For 0.06 ≲ x ≲ 0.19, magnetic order with an antiferromagnetic character and hysteresis for T < TN emerges and strengthens with increasing x. The similarity of this phase diagram with those of the Si → P (Gallagher et al., 2016a; Gallagher et al., 2016b) and Ru → Rh (Amitsuka et al., 1988; Dalichaouch et al., 1990a; Miyako et al., 1991; Kawarazaki et al., 1994; Yokoyama et al., 2004; Yokoyama and Amitsuka, 2007) chemical substitution series is noteworthy. To explain this, we suggest that their phase diagrams are controlled by a semi-universal combination of weakening hybridization strength and electron substitution. In order to fully understand this series, it will be useful to investigate single-crystal specimens of this series in order to determine the anisotropy in ρ(T) and χ(T), and to carry out more detailed studies of the Fermi surface and magnetic ordering in order to make comparisons to the P and Rh doped compounds.
Data Availability Statement
The raw data supporting the conclusion of this article will be made available by the authors, without undue reservation.
Author Contributions
RB designed the project, supervised its completion, contributed to data analysis and wrote the manuscript. GC synthesized the specimens, carried out measurements, contributed to data analysis and wrote the manuscript. WN contributed to synthesis and experiments. DG contributed to measurements in high magnetic fields. All co-authors reviewed the data analysis and manuscript.
Funding
This work was performed at the National High Magnetic Field Laboratory, which is supported by National Science Foundation Cooperative Agreement No. DMR-1644779 and the State of Florida. Synthesis of crystalline materials and their characterization were supported by the Center for Actinide Science and Technology (CAST), an Energy Frontier Research Center (EFRC) funded by the US. Department of Energy (DOE), Office of Science, Basic Energy Sciences (BES), under Award No. DE-SC0016568.
Conflict of Interest
The authors declare that the research was conducted in the absence of any commercial or financial relationships that could be construed as a potential conflict of interest.
Publisher’s Note
All claims expressed in this article are solely those of the authors and do not necessarily represent those of their affiliated organizations, or those of the publisher, the editors and the reviewers. Any product that may be evaluated in this article, or claim that may be made by its manufacturer, is not guaranteed or endorsed by the publisher.
Supplementary Material
The Supplementary Material for this article can be found online at: https://www.frontiersin.org/articles/10.3389/femat.2022.861448/full#supplementary-material
References
Amitsuka, H., Hyomi, K., Nishioka, T., Miyako, Y., and Suzuki, T. (1988). Specific Heat and Susceptibility of U(Ru1−xRhx)2Si2. J. Magnetism Magn. Mater. 76-77, 168–170. doi:10.1016/0304-8853(88)90354-x
Bareille, C., Boariu, F. L., Schwab, H., Lejay, P., Reinert, F., and Santander-Syro, A. F. (2014). Momentum-resolved Hidden-Order gap Reveals Symmetry Breaking and Origin of Entropy Loss in URu2Si2. Nat. Commun. 5, 4326. doi:10.1038/ncomms5326
Bauer, E. D., Zapf, V. S., Ho, P.-C., Butch, N. P., Freeman, E. J., Sirvent, C., et al. (2005). Non-Fermi-Liquid Behavior within the Ferromagnetic Phase in URu2−x RexSi2. Phys. Rev. Lett. 94, 046401. doi:10.1103/physrevlett.94.046401
Baumbach, R. E., Fisk, Z., Ronning, F., Movshovich, R., Thompson, J. D., and Bauer, E. D. (2014). High Purity Specimens of URu2Si2produced by a Molten Metal Flux Technique. Philos. Mag. 94, 3663–3671. doi:10.1080/14786435.2014.895876
Butch, N. P., Jeffries, J. R., Chi, S., Leão, J. B., Lynn, J. W., and Maple, M. B. (2010). Antiferromagnetic Critical Pressure in URu2 Si2 under Hydrostatic Conditions. Phys. Rev. B 82, 060408. doi:10.1103/physrevb.82.060408
Butch, N. P., and Maple, M. B. (2009). Evolution of Critical Scaling Behavior Near a Ferromagnetic Quantum Phase Transition. Phys. Rev. Lett. 103, 076404. doi:10.1103/physrevlett.103.076404
Butch, N. P., and Maple, M. B. (2010). The Suppression of Hidden Order and the Onset of Ferromagnetism in URu2Si2via Re Substitution. J. Phys. Condens. Matter 22, 164204. doi:10.1088/0953-8984/22/16/164204
Chappell, G. L., Gallagher, A., Graf, D. E., Riseborough, P., and Baumbach, R. E. (2020). Influence of Hydrostatic Pressure on Hidden Order, the Kondo Lattice, and Magnetism in URu2Si2−xPx. Phys. Rev. B 102, 245152. doi:10.1103/physrevb.102.245152
Dalichaouch, Y., Maple, M. B., Chen, J. W., Kohara, T., Rossel, C., Torikachvili, M. S., et al. (1990a). Effect of Transition-Metal Substitutions on Competing Electronic Transitions in the Heavy-Electron compoundURu2Si2. Phys. Rev. B 41, 1829–1836. doi:10.1103/physrevb.41.1829
Dalichaouch, Y., Maple, M. B., Guertin, R. P., Kuric, M. V., Torikachvili, M. S., and Giorgi, A. L. (1990b). Ferromagnetism and Heavy Electron Behavior in URu2−xMxSi2(M = Re, Tc and Mn). Physica B: Condensed Matter 163, 113–116. doi:10.1016/0921-4526(90)90141-g
Dalichaouch, Y., Maple, M. B., Torikachvili, M. S., and Giorgi, A. L. (1989). Ferromagnetic Instability in the Heavy-Electron compoundURu2Si2doped with Re or Tc. Phys. Rev. B 39, 2423–2431. doi:10.1103/physrevb.39.2423
Das, P., Kanchanavatee, N., Helton, J. S., Huang, K., Baumbach, R. E., Bauer, E. D., et al. (2015). Chemical Pressure Tuning of URu2 Si2 via Isoelectronic Substitution of Ru with Fe. Phys. Rev. B 91, 085122. doi:10.1103/physrevb.91.085122
De Boer, F. R., Franse, J. J. M., Louis, E., Menovsky, A. A., Mydosh, J. A., Palstra, T. T. M., et al. (1986). High-magnetic-field and High-Pressure Effects in Monocrystalline URu2Si2. Physica B+C 138, 1–6. doi:10.1016/0378-4363(86)90486-9
Endstra, T., Nieuwenhuys, G. J., and Mydosh, J. A. (1993). Hybridization Model for the Magnetic-Ordering Behavior of Uranium- and Cerium-Based 1:2:2 Intermetallic Compounds. Phys. Rev. B 48, 9595–9605. doi:10.1103/physrevb.48.9595
Gallagher, A., Chen, K.-W., Moir, C. M., Cary, S. K., Kametani, F., Kikugawa, N., et al. (2016a). Unfolding the Physics of URu2Si2 through Silicon to Phosphorus Substitution. Nat. Commun. 7, 10712. doi:10.1038/ncomms10712
Gallagher, A., Chen, K.-W., Cary, S. K., Kametani, F., Graf, D., Albrecht-Schmitt, T. E., et al. (2016b). Thermodynamic and Electrical Transport Investigation of URu2Si2−xPx. J. Phys. Condens. Matter 29, 024004. doi:10.1088/0953-8984/29/2/024004
Hassinger, E., Knebel, G., Izawa, K., Lejay, P., Salce, B., and Flouquet, J. (2008). Temperature-pressure Phase Diagram ofURu2Si2from Resistivity Measurements and Ac Calorimetry: Hidden Order and Fermi-Surface Nesting. Phys. Rev. B 77, 115117. doi:10.1103/physrevb.77.115117
Huang, K., Chen, K.-W., Gallagher, A., Lai, Y., Nelson, L., Graf, D., et al. (2019). Instability of the F -electron State in URu2Si2−xPx Probed Using High Magnetic fields. Phys. Rev. B 99, 235146. doi:10.1103/physrevb.99.235146
Jeffries, J. R., Butch, N. P., Yukich, B. T., and Maple, M. B. (2007). Competing Ordered Phases inURu2Si2: Hydrostatic Pressure and Rhenium Substitution. Phys. Rev. Lett. 99, 217207. doi:10.1103/physrevlett.99.217207
Jeffries, J. R., Butch, N. P., Yukich, B. T., and Maple, M. B. (2008). The Evolution of the Ordered States of Single-crystal URu2Si2under Pressure. J. Phys. Condens. Matter 20, 095225. doi:10.1088/0953-8984/20/9/095225
Kanchanavatee, N., Janoschek, M., Baumbach, R. E., Hamlin, J. J., Zocco, D. A., Huang, K., et al. (2011). Twofold Enhancement of the Hidden-Order/large-Moment Antiferromagnetic Phase Boundary in the URu2−xFexSi2system. Phys. Rev. B 84, 245122. doi:10.1103/physrevb.84.245122
Kanchanavatee, N., White, B. D., Burnett, V. W., and Maple, M. B. (2014). Enhancement of the Hidden Order/large Moment Antiferromagnetic Transition Temperature in the URu2−xOsxSi2system. Philos. Mag. 94, 3681–3690. doi:10.1080/14786435.2014.886022
Kawarazaki, S., Kobashi, Y., Taniguchi, T., Miyako, Y., and Amitsuka, H. (1994). Frozen-In Devil's Staircase in U(Ru1-xRhx)2Si2Mixed Compound System as Studied by Neutron Diffraction. J. Phys. Soc. Jpn. 63, 716–725. doi:10.1143/jpsj.63.716
Kim, K. H., Harrison, N., Jaime, M., Boebinger, G. S., and Mydosh, J. A. (2003a). Magnetic-Field-Induced Quantum Critical Point and Competing Order Parameters inURu2Si2. Phys. Rev. Lett. 91, 256401. doi:10.1103/physrevlett.91.256401
Kim, K. H., Harrison, N., Jaime, M., Boebinger, G. S., and Mydosh, J. A. (2003b). Publisher's Note: Magnetic-Field-Induced Quantum Critical Point and Competing Order Parameters inURu2Si2[Phys. Rev. Lett.91, 256401 (2003)]. Phys. Rev. Lett. 91, 269902. doi:10.1103/physrevlett.91.269902
Kuwahara, K., Yoshii, S., Nojiri, H., Aoki, D., Knafo, W., Duc, F., et al. (2013). Magnetic Structure of Phase II inU(Ru0.96Rh0.04)2Si2Determined by Neutron Diffraction under Pulsed High Magnetic Fields. Phys. Rev. Lett. 110, 216406. doi:10.1103/physrevlett.110.216406
Lee, J., Matsuda, M., Mydosh, J. A., Zaliznyak, I., Kolesnikov, A. I., Süllow, S., et al. (2018). Dual Nature of Magnetism in a Uranium Heavy-Fermion System. Phys. Rev. Lett. 121, 057201. doi:10.1103/physrevlett.121.057201
Lee, J., Prokeš, K., Park, S., Zaliznyak, I., Dissanayake, S., Matsuda, M., et al. (2020). Charge Density Wave with Anomalous Temperature Dependence in UPt2 Si2. Phys. Rev. B 102, 041112. doi:10.1103/physrevb.102.041112
Luo, H., Klimczuk, T., Müchler, L., Schoop, L., Hirai, D., Fuccillo, M. K., et al. (2013). Superconductivity in the Cu(Ir1−xPtx)2Se4spinel. Phys. Rev. B 87, 214510. doi:10.1103/physrevb.87.214510
Maple, M. B., Chen, J. W., Dalichaouch, Y., Kohara, T., Rossel, C., Torikachvili, M. S., et al. (1986). Partially Gapped Fermi Surface in the Heavy-Electron superconductorURu2Si2. Phys. Rev. Lett. 56, 185–188. doi:10.1103/physrevlett.56.185
McElfresh, M. W., Thompson, J. D., Willis, J. O., Maple, M. B., Kohara, T., and Torikachvili, M. S. (1987). Effect of Pressure on Competing Electronic Correlations in the Heavy-Electron systemURu2Si2. Phys. Rev. B 35, 43–47. doi:10.1103/physrevb.35.43
Meng, J.-Q., Oppeneer, P. M., Mydosh, J. A., Riseborough, P. S., Gofryk, K., Joyce, J. J., et al. (2013). Imaging the Three-Dimensional Fermi-Surface Pairing Near the Hidden-Order Transition inURu2Si2Using Angle-Resolved Photoemission Spectroscopy. Phys. Rev. Lett. 111, 127002. doi:10.1103/physrevlett.111.127002
Miyako, Y., Kawarazaki, S., Amitsuka, H., Paulsen, C. C., and Hasselbach, K. (1991). Magnetic Properties of U(Ru1−xRhx)2Si2single Crystals (0≤x≤1). J. Appl. Phys. 70, 5791–5793. doi:10.1063/1.350162
Motoyama, G., Nishioka, T., and Sato, N. K. (2003). Phase Transition between Hidden and Antiferromagnetic Order inURu2Si2. Phys. Rev. Lett. 90, 166402. doi:10.1103/physrevlett.90.166402
Motoyama, G., Yokoyama, N., Sumiyama, A., and Oda, Y. (2008). Electrical Resistivity and Thermal Expansion Measurements of URu2Si2 under Pressure. J. Phys. Soc. Jpn. 77, 123710. doi:10.1143/jpsj.77.123710
Nieuwenhuys, G. J. (1987). Crystalline Electric Field Effects inUPt2Si2andURu2Si2. Phys. Rev. B 35, 5260–5263. doi:10.1103/physrevb.35.5260
Niklowitz, P. G., Pfleiderer, C., Keller, T., Vojta, M., Huang, Y.-K., and Mydosh, J. A. (2010). Parasitic Small-Moment Antiferromagnetism and Nonlinear Coupling of Hidden Order and Antiferromagnetism inURu2Si2Observed by Larmor Diffraction. Phys. Rev. Lett. 104, 106406. doi:10.1103/physrevlett.104.106406
Palstra, T. T. M., Menovsky, A. A., Berg, J. v. d., Dirkmaat, A. J., Kes, P. H., Nieuwenhuys, G. J., et al. (1985). Superconducting and Magnetic Transitions in the Heavy-Fermion System URu2Si2. Phys. Rev. Lett. 55, 2727–2730. doi:10.1103/physrevlett.55.2727
Palstra, T. T. M., Menovsky, A. A., and Mydosh, J. A. (1986). Anisotropic Electrical Resistivity of the Magnetic Heavy-Fermion superconductorURu2Si2. Phys. Rev. B 33, 6527–6530. doi:10.1103/physrevb.33.6527
Ptasiewicz-Ba̧k, H., Leciejewicz, J., and Zygmunt, A. (1985). Solid State Communications, 55. Pergamon Press, 601.
Rahn, M. C., Gallagher, A., Orlandi, F., Khalyavin, D. D., Hoffmann, C., Manuel, P., et al. (2021). Collinear Antiferromagnetic Order in URu2Si2−xPx Revealed by Neutron Diffraction. Phys. Rev. B 103, 214403. doi:10.1103/physrevb.103.214403
Ran, S., Wolowiec, C. T., Jeon, I., Pouse, N., Kanchanavatee, N., White, B. D., et al. (2016). Phase Diagram and thermal Expansion Measurements on the System URu 2− X Fe X Si 2. Proc. Natl. Acad. Sci. U.S.A. 113, 13348–13353. doi:10.1073/pnas.1616542113
Santander-Syro, A. F., Klein, M., Boariu, F. L., Nuber, A., Lejay, P., and Reinert, F. (2009). Fermi-surface Instability at the 'hidden-Order' Transition of URu2Si2. Nat. Phys 5, 637–641. doi:10.1038/nphys1361
Schlabitz, W., Baumann, J., Pollit, B., Rauchschwalbe, U., Mayer, H. M., Ahlheim, U., et al. (1986). Superconductivity and Magnetic Order in a Strongly Interacting Fermi-System: URu2Si2. Z. Physik B - Condensed Matter 62, 171–177. doi:10.1007/bf01323427
Szytuka, A., Siek, S., Leciejewicz, J., Zygmunt, A., and Ban, Z. (1988). Neutron Diffraction Study of UT2X2 (T = Mn, Fe, X = Si, Ge) Intermetallic Systems. J. Phys. Chem. Sol. 49, 1113–1118. doi:10.1016/0022-3697(88)90162-x
Umarji, A. M., Yakhmi, J. V., Tomy, C. V., Iyer, R. M., Gupta, L. C., and Vijayaraghavan, R. (1987). “Resistivity Studies on UM2Si2 (M = Rh, Ir, Ru and Os),” in Theoretical and Experimental Aspects of Valence Fluctuations and Heavy Fermions. Editors L. C. Gupta, and S. K. Malik (Boston, MA: Springer US), 341–344. doi:10.1007/978-1-4613-0947-5_39
Wartenbe, M. R., Chen, K.-W., Gallagher, A., Harrison, N., McDonald, R. D., Boebinger, G. S., et al. (2017). Role of Band Filling in Tuning the High-Field Phases of URu2 Si2. Phys. Rev. B 96, 085141. doi:10.1103/physrevb.96.085141
Wiebe, C. R., Janik, J. A., MacDougall, G. J., Luke, G. M., Garrett, J. D., Zhou, H. D., et al. (2007). Gapped Itinerant Spin Excitations Account for Missing Entropy in the Hidden-Order State of URu2Si2. Nat. Phys 3, 96–99. doi:10.1038/nphys522
Wilson, M. N., Williams, T. J., Cai, Y.-P., Hallas, A. M., Medina, T., Munsie, T. J., et al. (2016). Antiferromagnetism and Hidden Order in Isoelectronic Doping of URu2 Si2. Phys. Rev. B 93, 064402. doi:10.1103/physrevb.93.064402
Yokoyama, M., and Amitsuka, H. (2007). Evolution of Heterogeneous Antiferromagnetic State in URu2Si2: Study of Hydrostatic-Pressure, Uniaxial-Stress and Rh-Dope Effects. J. Phys. Soc. Jpn. 76, 136–139. doi:10.1143/jpsjs.76sa.136
Yokoyama, M., Amitsuka, H., Itoh, S., Kawasaki, I., Tenya, K., and Yoshizawa, H. (2004). Neutron Scattering Study on Competition between Hidden Order and Antiferromagnetism in U(Ru1-xRhx)2Si2(x≤0.05). J. Phys. Soc. Jpn. 73, 545–548. doi:10.1143/jpsj.73.545
Yoshida, R., Nakamura, Y., Fukui, M., Haga, Y., Yamamoto, E., Ōnuki, Y., et al. (2010). Signature of Hidden Order and Evidence for Periodicity Modification inURu2Si2. Phys. Rev. B 82, 205108. doi:10.1103/physrevb.82.205108
Zhu, X., Han, F., Mu, G., Cheng, P., Tang, J., Ju, J., et al. (2010). Superconductivity Induced by Doping Platinum inBaFe2As2. Phys. Rev. B 81, 104525. doi:10.1103/physrevb.81.104525
Keywords: hidden order in URu2Si2, unconventional superconducivity, Kondo lattice and heavy fermions, chemical substitution, magnetism
Citation: Chappell GL, Nelson WL, Graf DE and Baumbach RE (2022) Electronic Tuning in URu2Si2 Through Ru to Pt Chemical Substitution. Front. Electron. Mater. 2:861448. doi: 10.3389/femat.2022.861448
Received: 24 January 2022; Accepted: 07 March 2022;
Published: 07 April 2022.
Edited by:
Vidya Madhavan, University of Illinois at Urbana-Champaign, United StatesReviewed by:
John Tranquada, Brookhaven National Laboratory (DOE), United StatesHuixia Luo, Sun Yat-sen University, China
Copyright © 2022 Chappell, Nelson, Graf and Baumbach. This is an open-access article distributed under the terms of the Creative Commons Attribution License (CC BY). The use, distribution or reproduction in other forums is permitted, provided the original author(s) and the copyright owner(s) are credited and that the original publication in this journal is cited, in accordance with accepted academic practice. No use, distribution or reproduction is permitted which does not comply with these terms.
*Correspondence: Ryan E. Baumbach, YmF1bWJhY2hAbWFnbmV0LmZzdS5lZHU=