 Tianren Zhao1
 Yanhui Zhang
- 1Shenzhen Institutes of Advanced Technology, Chinese Academy of Sciences, Shenzhen, China
- 2University of Macau, Taipa, Macao SAR, China
- 3Northeast Electric Power University, Jilin, China
With the widespread application of lithium-ion batteries in electric vehicles and energy storage systems, health monitoring and remaining useful life prediction have become critical components of battery management systems. To address the challenges posed by the high nonlinearity and long-term dependency in battery degradation modeling, this paper proposes a deep hybrid architecture that integrates Long Short-Term Memory networks with Transformer mechanisms, aiming to improve the accuracy and robustness of RUL prediction. Firstly, time-series samples are constructed from raw battery data, and physically consistent temperature-derived features—including average temperature, temperature range, and temperature fluctuation—are engineered. Data preprocessing is performed using standardization and Yeo-Johnson transformation. The model employs LSTM modules to capture local temporal patterns, while the Transformer modules extract global dependencies through multi-head self-attention mechanisms. These complementary features are fused to enable joint modeling of battery health states. The regression task is optimized using the Mean Squared Error loss function and trained with the Adam optimizer. Experimental results on the MIT battery dataset demonstrate the proposed model achieves excellent performance in a 7-step multi-point prediction task, with a Root Mean Square Error of 0.0085, Mean Absolute Percentage Error of 0.0200, and a coefficient of determination of 0.9902. Compared with alternative models such as MC-LSTM and XGBoost-LSTM, the proposed model exhibits superior accuracy and stability. Residual analysis and visualization further confirm the model’s unbiased and stable predictive capability. This study shows that the LSTM-Transformer hybrid architecture offers significant potential in modeling complex battery degradation processes and enhancing RUL prediction accuracy, providing effective technical support for the development of intelligent battery health management systems.
1 Introduction
With the global transition toward cleaner energy and the rapid advancement of electrification technologies, lithium-ion batteries have emerged as essential energy storage components in electric vehicles, renewable energy storage systems, and portable electronic devices (Wang et al., 2023). Owing to their high energy density, long cycle life, and low self-discharge rate, lithium-ion batteries have become increasingly important. However, their performance inevitably degrades over time due to repeated charge-discharge cycles, leading to capacity fade and a shortened remaining useful life (RUL) (Wang et al., 2021). Accurate prediction of battery state of health (SOH) and RUL is crucial for optimizing battery management, extending service life, reducing maintenance costs, and ensuring system safety (Elmahallawy et al., 2022; Yao et al., 2021). In particular, battery failure in electric vehicles or large-scale energy storage systems can result in significant safety hazards and economic losses, making the development of high-accuracy RUL prediction methods a pressing research focus.
Precise RUL prediction plays a vital role in optimizing battery management systems. First, it provides a scientific basis for battery replacement and maintenance decisions, thereby lowering operational costs (Tong et al., 2021). Second, it enables early identification of potential failures, thus enhancing system safety (Yang et al., 2023). Moreover, accurate RUL estimates support battery recycling and second-life applications, contributing to sustainable resource utilization. Nevertheless, several challenges hinder effective RUL prediction. The degradation process is influenced by multiple factors such as temperature, charge/discharge rates, and usage scenarios, exhibiting high nonlinearity and complexity (Sharma and Bora, 2022). Real-world operational data often contain noise and missing values, increasing the difficulty of modeling (Li et al., 2023). Furthermore, long-term prediction requires models that can simultaneously capture short-term fluctuations and long-term trends, which is difficult for single-model architectures to achieve.
Traditional RUL prediction approaches can be categorized into physics-based and data-driven methods. Physics-based models rely on the electrochemical mechanisms of batteries (Liu et al., 2022), using complex mathematical formulations to describe the degradation process. However, these methods require detailed knowledge of material properties and operating conditions, involve high computational complexity, and often lack generalizability across different battery types. In contrast, data-driven approaches have gained popularity by learning patterns directly from operational data (Ji et al., 2024). With advances in sensor technology and data acquisition capabilities, these methods can effectively model battery behavior using features such as voltage, current, and temperature, showing improved adaptability and predictive accuracy.
Data-driven RUL prediction techniques generally fall into three categories: statistical models (Crawford et al., 2021), machine learning methods (Zhang L. et al., 2022), and deep learning models (Zhang D. et al., 2022). Statistical approaches, such as Kalman filtering and particle filtering, model battery degradation probabilistically. For example, Nunes et al. (2023) proposed an online RUL estimation method for second-life lithium-ion batteries based on an unscented Kalman filter and degradation curve modeling, validated on six different second-life battery datasets. Despite some success—achieving a worst-case mean absolute percentage error (MAPE) of 5.279% and an R2 score of 0.726—statistical models often struggle with nonlinear or complex degradation behaviors. Machine learning approaches such as support vector machines, random forests, and XGBoost have demonstrated promising results in RUL prediction through hand-crafted features. Jafari and Byun (2022) introduced a hybrid RUL prediction method based on particle filtering and Kalman filtering, where XGBoost was used as the observation model due to its strong nonlinear fitting capabilities. Despite high predictive accuracy based on full-cycle test data, such methods are heavily dependent on the quality of feature engineering and may suffer from overfitting or inefficiency when applied to high-dimensional time-series data.
The emergence of deep learning has opened new avenues for RUL prediction. Long Short-Term Memory (LSTM) networks, known for their capability in modeling temporal dependencies, have been widely adopted for battery degradation modeling. LSTM networks utilize gating mechanisms to effectively capture long-term dependencies, making them well-suited for modeling the nonlinear degradation process of batteries. Reza et al. (2024) proposed an improved method combining LSTM with the Gravitational Search Algorithm (GSA), using data cleaning to remove noise, replacing anomalies with highly correlated data, and applying normalization. GSA was employed to optimize the LSTM hyperparameters to address key challenges in battery life prediction. However, LSTM models may still face limitations such as vanishing gradients and computational inefficiencies when dealing with long sequences. Recently, Transformer models have demonstrated excellent performance in natural language processing and time-series analysis tasks due to their strong capability in extracting global features (Chen et al., 2022; Han et al., 2023). The Transformer architecture processes sequences in parallel through multi-head attention mechanisms, effectively capturing long-range dependencies. Nevertheless, its application in battery RUL prediction remains relatively unexplored.
Given the above challenges, accurate RUL prediction remains difficult due to the following key factors,
1. The degradation process is highly nonlinear and influenced by external factors such as temperature, cycling rate, and usage scenarios;
2. Real-world data are often noisy and incomplete, complicating the modeling process;
3. Long-term prediction tasks require models to simultaneously capture short-term variations and long-term trends, which is difficult for single models to handle effectively.
To address these challenges, this study develops a hybrid deep learning model that captures both local temporal dependencies and global contextual features. As illustrated in Figure 1, we propose a novel LSTM-Transformer hybrid model based on the MIT battery dataset to enhance prediction accuracy and robustness. The LSTM module extracts local temporal dynamics from time-series inputs, while the Transformer module, with its attention mechanism, captures global feature dependencies. The integration of both allows the model to effectively represent complex degradation patterns.
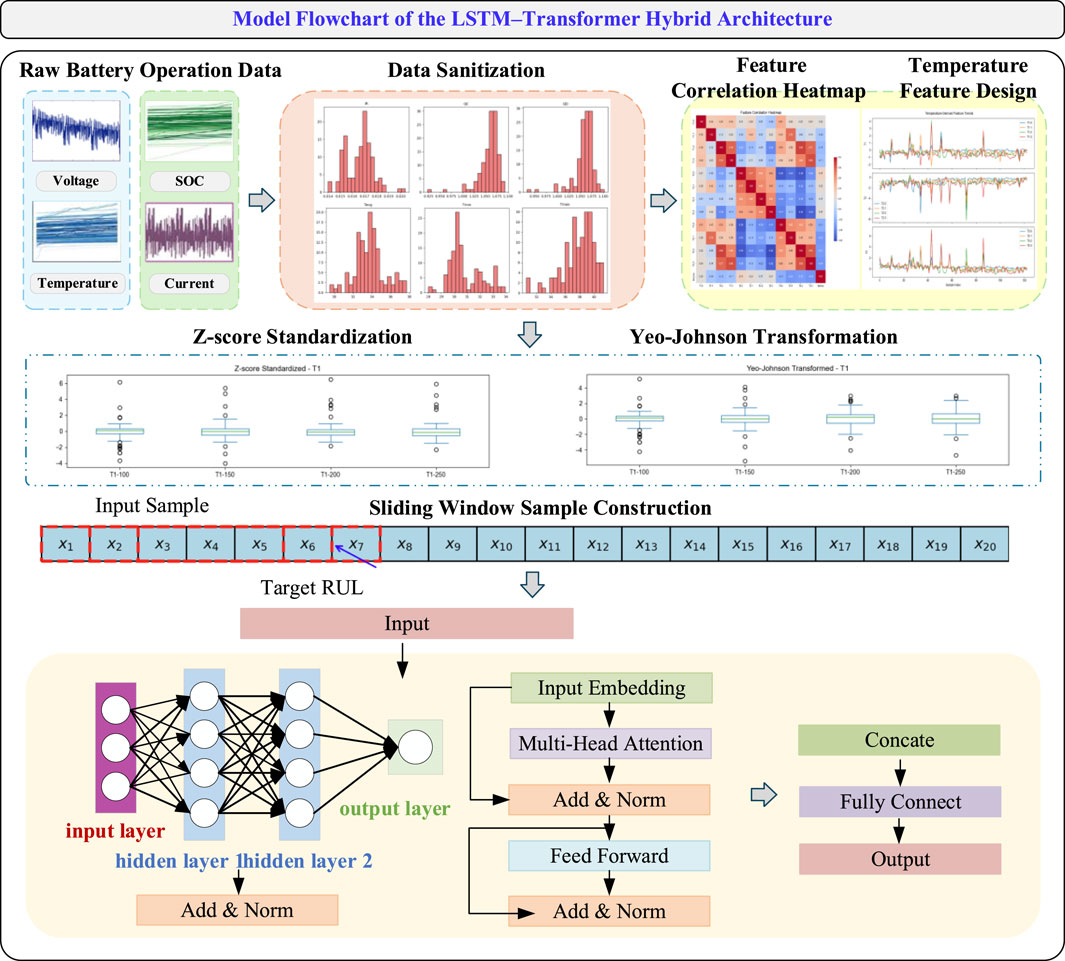
Figure 1. Schematic diagram of the LSTM-Transformer hybrid model architecture.
The main contributions of this work are as follows,
1. A novel hybrid deep learning architecture combining local temporal modeling and global attention mechanisms is proposed for lithium-ion battery RUL prediction.
2. Temperature-based features are engineered based on battery physical mechanisms to enhance input feature expressiveness.
3. The proposed model is validated on the MIT battery dataset, demonstrating superior prediction accuracy and robustness compared to existing methods, with strong potential for real-world applications.
The remainder of this paper is organized as follows: Section 2 introduces the data preprocessing and feature engineering methods; Section 3 details the architecture and training process of the LSTM-Transformer hybrid model; Section 4 presents experimental results and performance evaluation; Section 5 concludes the paper with a summary of findings and future work directions. Through this research, we aim to provide an efficient and accurate solution for lithium-ion battery RUL prediction, offering theoretical and technical support for optimized battery management systems.
2 Data preprocessing and feature engineering
Accurate prediction of the remaining useful life of lithium-ion batteries critically depends on high-quality data preprocessing and feature engineering. To construct a time-series modeling–ready prediction dataset, this study systematically performs data cleaning, temperature feature extraction, normalization, target variable transformation, and sample construction based on a sliding window. By incrementally sliding a fixed-length window over the time-series data to extract local segments, representative features or sequential samples are generated. This approach facilitates the capture of local temporal dependencies and dynamic variations (Lin et al., 2024), thereby ensuring that the input data fed into the model possesses strong representativeness and consistency.
The original dataset used in this work is the MIT Battery Dataset, which includes operational data from multiple batteries under various charging and discharging conditions. Key variables include voltage, current, and temperature. Let the raw feature matrix be denoted as
To explore the linear relationships between different features, we construct a Pearson correlation-based heatmap, as illustrated in Figure 2a. In this heatmap, red indicates strong positive correlations, while blue denotes strong negative correlations. The heatmap reveals significant correlations among several voltage-related, capacity-related, and temperature-related features. Based on this analysis, redundant features are removed to improve the generalization ability of the model and to mitigate issues related to multicollinearity.
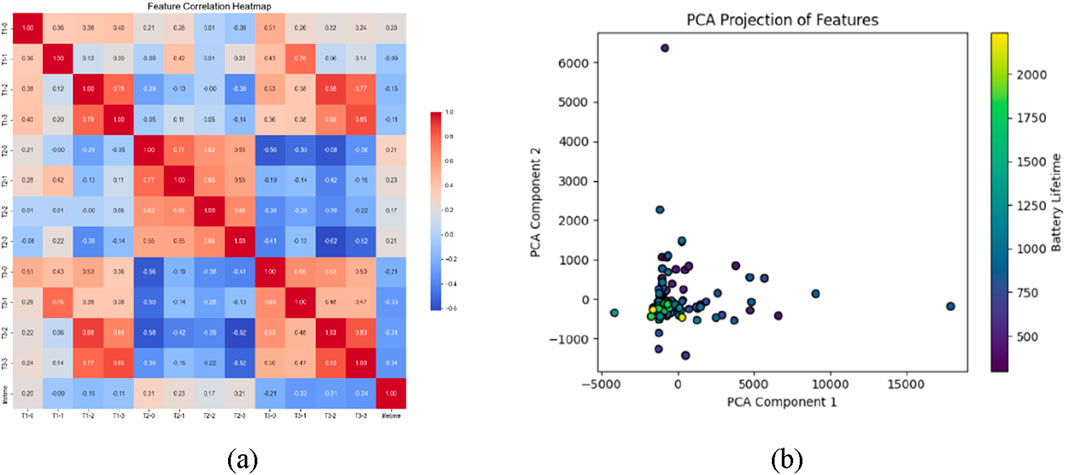
Figure 2. (a) Feature correlation heatmap based on Pearson coefficients. (b) Feature space distribution of battery life using Principal Component Analysis.
To comprehensively evaluate the structure of the feature space, Principal Component Analysis was applied to the high-dimensional feature data after redundancy removal, as shown in Figure 2b. The first two principal components were visualized, with a color gradient representing the corresponding battery RUL values. This visualization enables the observation of degradation trends within the feature space. The results indicate that samples with different RUL levels exhibit clear clustering patterns in the two-dimensional PCA space, demonstrating the discriminative capability of the extracted features in characterizing battery degradation states.
Temperature, as a critical factor influencing lithium-ion battery aging and performance degradation, plays a key role in modeling degradation behavior. Analysis reveals that the raw temperature features (T1-0 to T3-3) exhibit significant dynamic fluctuations during battery operation and are highly correlated with changes in the RUL curve.
To this end, three types of temperature-derived features are designed: temperature mean, temperature range, and temperature fluctuation. The temperature mean reflects the overall thermal load level during battery operation. Elevated operating temperatures accelerate electrolyte decomposition, solid electrolyte interphase (SEI) layer growth, and structural degradation of electrode materials, which are key contributors to capacity fade and internal resistance increase. The temperature range measures the amplitude of temperature variation within each time window, indicating the degree of thermal stress fluctuation. Frequent and intense thermal stress cycles may induce mechanical fatigue or even cracking of electrode particles, exacerbating material degradation and performance decline. Temperature fluctuation, quantified by the standard deviation, characterizes the local instability of temperature over time, typically associated with abnormal conditions such as high-current charge/discharge events and cooling system failures. These factors are prone to cause localized hotspots and accelerate undesirable electrochemical side reactions, ultimately shortening battery life.
For each temperature sensor group, the temperature mean is defined as shown in Equation 1,
In this context,
The above two features respectively characterize the central tendency and extreme dispersion of each temperature group, which can reflect phenomena such as localized overheating or abnormal heat dissipation. In addition, to capture the overall fluctuation level of the thermal behavior, the standard deviation across all temperature channels is calculated as shown in Equation 3 and used as an indicator of temperature volatility.
Let
Let
The transformation is defined as shown in Equation 5,
Here,
To accommodate the requirements of deep learning-based time series modeling, the dataset is reconstructed into a sliding window format. As illustrated in Figure 3, let the input window length be
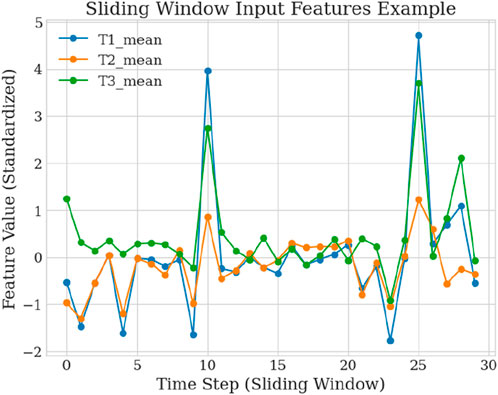
Figure 3. Illustration of the sliding window input features.
The total number of samples that can be constructed from the dataset is given by Equation 7,
The final dataset was split into training and testing sets at a ratio of 8:2, with the training set randomly shuffled to enhance sample diversity and training robustness. The data preprocessing pipeline significantly improved the semantic representation and structural compatibility of the input data. The design of temperature-derived features was closely aligned with the underlying battery physical mechanisms. Standardization and nonlinear transformation ensured numerical stability during model training, while the sliding window data construction effectively captured the dynamic evolution of battery degradation. Together, these steps laid a solid foundation for subsequent battery life prediction modeling based on the LSTM-Transformer architecture.
3 Model architecture and training process
To achieve high-precision regression prediction of the remaining useful life of lithium-ion batteries, this study designs a deep neural network model that integrates Long Short-Term Memory networks with the Transformer architecture. The model leverages the strength of LSTM in capturing local temporal dynamics in time series data and the powerful capability of Transformer in modeling global dependencies, thereby enhancing the ability to characterize the evolving performance trends of batteries. Time series features are fed into two parallel subnetworks for separate encoding, followed by feature-level fusion to ultimately predict the battery life over multiple future time steps.
3.1 LSTM model
In lithium-ion battery life prediction, operational features such as voltage, temperature, and current exhibit pronounced temporal correlations. Single-step or short-range modeling approaches often fail to capture the complex evolutionary processes. The Long Short-Term Memory network employs gating mechanisms to propagate information along the temporal dimension, enabling the model to capture nonlinear dynamic changes with long-term dependencies. Figure 4 illustrates the neural network architecture of the LSTM.
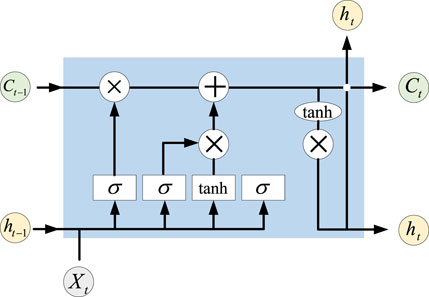
Figure 4. Computational process of the LSTM neural network.
The fundamental computational process of the LSTM is as follows. The forget gate determines whether to retain the cell state from the previous time step
Here,
The input gate controls how much of the current input information is written into the cell state, consisting of Equations 9, 10,
Here,
The cell state is updated by combining the weights of the forget gate and the input gate to revise the memory from the previous time step, as shown in Equation 11,
In this equation,
The output gate determines the amount of information output as the current hidden state, expressed as shown in Equations 12, 13,
Here,
3.2 Transformer model
Although LSTM performs well in sequence modeling, it suffers from gradient decay and low training efficiency when handling long-term dependencies. To address these issues, the Transformer architecture is introduced, which establishes direct connections between any positions within the sequence through a multi-head self-attention mechanism, thereby enhancing the model’s ability to capture global dynamics. The core computation in the Transformer is the scaled dot-product attention, defined as shown in Equation 14,
Here, Q, K, and V represent the Query, Key, and Value matrices, respectively, and
Since the Transformer lacks an explicit sequential structure, positional encoding is introduced to preserve temporal order. The fixed sinusoidal positional encoding scheme is employed as shown in Equation 15,
Here,
In the proposed model, the Transformer consists of two stacked encoder layers, each comprising a multi-head attention sublayer and a feed-forward neural network. The output is a sequence-level global feature representation, which is subsequently aggregated via average pooling to obtain a fixed-length vector
3.3 Feature fusion and prediction output
Considering the complementary strengths of LSTM and Transformer in modeling different aspects of sequential data, a feature-level fusion strategy is employed. The hidden representations generated by each sub-network are concatenated to form a unified feature vector for downstream prediction. The fusion process is formulated as shown in Equation 16,
Where
Where
3.4 Loss function and optimization strategy
The prediction of the remaining useful life of lithium-ion batteries is essentially a regression task, where the target variable is a continuous percentage value. Therefore, the mean squared error (MSE) is adopted as the loss function for optimization. It is defined as shown in Equation 18,
The variable
During training, the Adam optimizer is employed for parameter updates. This optimization algorithm integrates the advantages of momentum and adaptive learning rate adjustment, offering fast convergence and flexible parameter tuning. The initial learning rate is set to
4 Experimental results and performance analysis
A comprehensive evaluation was conducted to assess the predictive performance of the proposed LSTM-Transformer hybrid model on the MIT battery dataset, demonstrating its effectiveness and superiority in the task of remaining useful life prediction for lithium-ion batteries. Model training and testing were performed on the publicly available MIT battery degradation dataset. After undergoing data preprocessing and temporal windowing, the dataset was restructured into time series samples with an input sequence length of 30 and an output prediction horizon of 7 steps. The objective was to forecast the battery capacity degradation trend over the next 7 cycles. During training, the Adam optimizer was employed with an initial learning rate set to 0.001, and an Early Stopping mechanism was integrated to prevent overfitting. Architecturally, the LSTM layer captures local temporal dynamics, while the Transformer module exploits its global attention mechanism to model long-term dependencies. The synergistic integration of both enhances the model’s capacity to capture the complex degradation behaviors of batteries.
4.1 Model training process
As shown in Figure 5, the loss curves of both the training and testing sets over 200 epochs illustrate the model’s convergence behavior. It can be observed that the loss values decrease steadily with increasing training epochs, particularly during the initial 50 epochs where a rapid drop is evident—indicating efficient convergence. At epoch 50, the training loss decreased to 0.0021 and the testing loss reached 0.0054. Although the training loss continued to decrease afterward, the testing loss plateaued and remained low, reflecting the model’s strong ability to avoid overfitting. By the end of training at epoch 200, the training loss converged to 0.0008, and the testing loss stabilized around 0.0038, suggesting strong generalization on unseen data. These training dynamics and test loss results demonstrate the model’s stability and robust convergence characteristics.
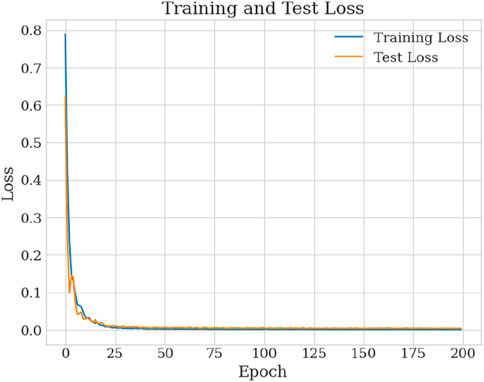
Figure 5. Training and testing loss curves over epochs.
4.2 Performance evaluation metrics for model prediction
To comprehensively and objectively evaluate the performance of the proposed model in battery life prediction tasks, three commonly used regression evaluation metrics are employed: Root Mean Square Error (RMSE), Mean Absolute Percentage Error (MAPE), and the Coefficient of Determination (R2). These metrics assess the prediction performance from three perspectives: absolute error, relative percentage error, and the model’s ability to explain variance in the data. Collectively, they offer a robust evaluation framework for assessing the accuracy, stability, and generalization capability of data-driven predictive models. These metrics are also widely adopted in current state-of-the-art regression-based forecasting studies.
RMSE, which quantifies the standard deviation of the prediction errors between the predicted and actual values, is defined as Equation 19,
where
MAPE, or Mean Absolute Percentage Error, measures the relative percentage deviation between predicted and actual values. It is defined as Equation 20,
This metric intuitively reflects the percentage error of the predicted values relative to the true values, making it suitable for comparing prediction accuracy across different scales.
The coefficient of determination R2 is used to measure the goodness of fit of the model and is defined as Equation 21,
Here,
4.3 Model performance analysis
The final evaluation results of the model’s predictive performance are as follows: RMSE of 0.0085, MAPE of 0.0200, and an R2 of 0.9902. These results demonstrate that the model exhibits excellent capability in fitting accuracy, error control, and capturing the variation trends of the target variable.
To more intuitively illustrate the model’s predictive effectiveness, Figure 6a presents a scatter plot comparing the predicted values with the true values. It can be observed that the majority of scatter points are densely clustered around the reference line, indicating a high consistency between the model’s predictions and the actual battery life across different samples. This tightly concentrated scatter distribution not only validates the high R2 value but also indirectly suggests that the model does not suffer from significant underfitting or overfitting, thereby demonstrating strong generalization ability.
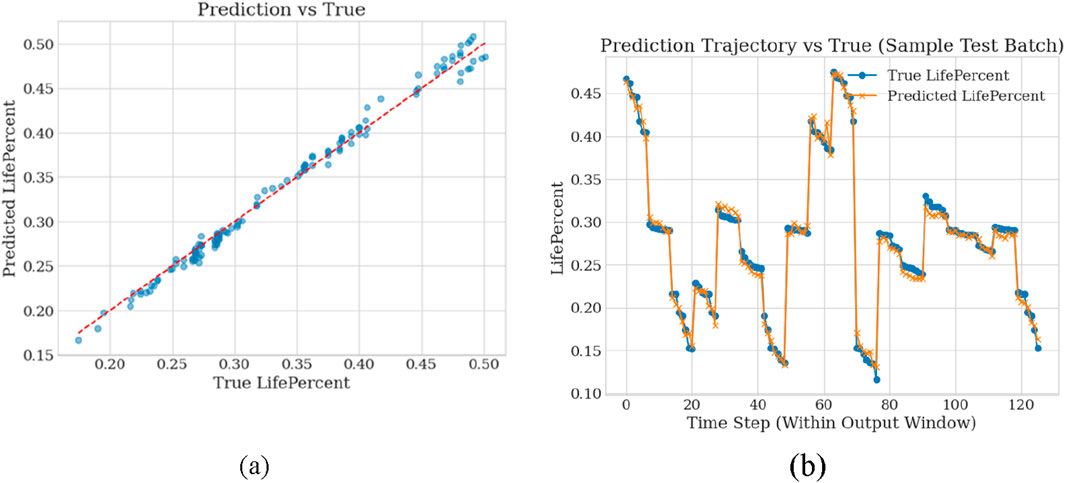
Figure 6. (a) Scatter plot of predicted values versus true values. (b) Comparison of predicted and true trajectories during the training process.
Figure 6b shows the comparison between the predicted and true trajectories on the test set. By forecasting future states over consecutive time steps, it is evident that the proposed LSTM-Transformer hybrid model can effectively fit the target trend, with predictions closely matching the real values and no notable deviations. This result indicates that the model possesses reliable short-term predictive capability, effectively adapting to the nonlinear gradual degradation characteristics of the battery state sequence, thus meeting the engineering requirements for remaining useful life prediction.
For further analysis of prediction errors, Figure 7a presents the frequency distribution histogram of the model’s prediction residuals, aiming to reveal whether there exist systematic biases or outliers in the errors. As observed, the residuals roughly exhibit a symmetric bell-shaped distribution, with most errors concentrated near zero, indicating that the overall prediction errors are small and unbiased. This statistical characteristic of the error distribution suggests that the prediction deviations mainly arise from minor perturbations inherent in the data rather than from systematic errors caused by the model structure. Additionally, the absence of long tails or skewness in the residual distribution further confirms the stability and consistency of the model’s predictions.
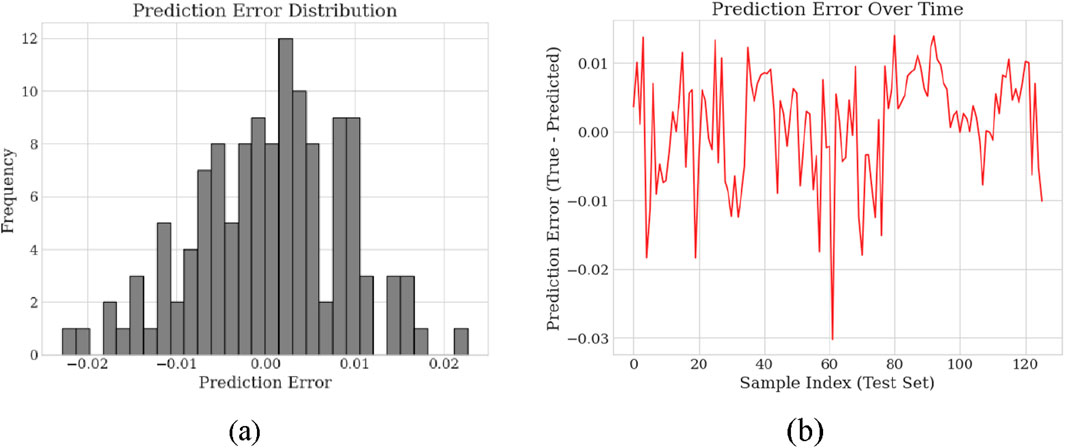
Figure 7. (a) Histogram of model residual frequency distribution. (b) Temporal variation of prediction errors.
Figure 7b depicts the temporal variation of prediction errors for all samples in the test set during the prediction process. Overall, the prediction errors fluctuate slightly without persistent systematic bias, demonstrating that no significant underfitting or overfitting occurred during training.
To more clearly present the comparative effects of the evaluation metrics, Figure 8a visualizes the three core performance indicators RMSE, MAPE, and R2 using a bar chart. It can be intuitively observed that all metrics fall within excellent ranges: RMSE approaches zero, MAPE is well below the commonly accepted 5% tolerance threshold for predictive models, and R2 significantly exceeds the benchmark of 0.9 for strong model fit. This visualization not only facilitates a comprehensive and balanced demonstration of the model’s performance but also enables straightforward comparison with traditional models, providing important references for subsequent optimization studies.
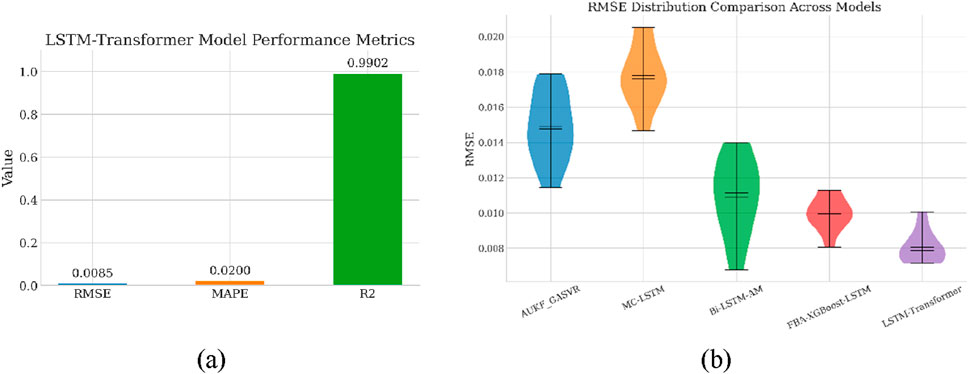
Figure 8. (a) Bar chart of evaluation metrics for the LSTM-Transformer model. (b) Comparison of RMSE performance among different models.
In summary, both quantitative metrics and visual analyses demonstrate that the proposed LSTM-Transformer hybrid model exhibits high accuracy, robustness, and interpretability in the battery remaining useful life prediction task. The model achieves satisfactory results not only in individual metric performance but also in fitting overall degradation trends and controlling prediction errors, providing strong empirical support for multimodal fusion approaches targeting complex time-series forecasting problems. Moreover, these outcomes lay a solid foundation for the model’s future application in practical engineering scenarios.
To further validate the performance advantages of the proposed LSTM-Transformer model in lithium-ion battery RUL prediction, several representative benchmark models were selected for comparative experiments, as shown in Figure 8b. Their prediction accuracies on the same dataset, expressed by RMSE values, are summarized in Table 1. The AUKF_GASVR model, which integrates particle filtering with nonlinear regression, and the deep learning-based MC-LSTM model achieved RMSEs of 0.0134 and 0.0168, respectively, yet both still suffered from relatively large fitting errors.
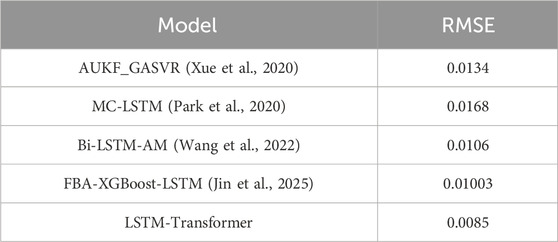
Table 1. Performance comparison of different models.
With the introduction of attention mechanisms and ensemble learning strategies, model performance further improved. For instance, the Bi-LSTM-AM model, combining bidirectional sequence modeling with attention mechanisms, reduced the RMSE to 0.0106; the FBA-XGBoost-LSTM model, leveraging feature enhancement and deep network integration, compressed the error to 0.01003, demonstrating strong learning capability. However, among all compared models, the proposed LSTM-Transformer model achieved the best overall performance with an optimal RMSE of 0.0085, indicating a significant accuracy advantage.
These results fully demonstrate that the LSTM-Transformer hybrid model effectively integrates LSTM’s strength in capturing local temporal dynamics with Transformer’s ability to extract global dependency features in time-series modeling. This synergy enables a more comprehensive learning of the complex mechanisms underlying battery life evolution, yielding higher accuracy and robustness, making it a highly efficient modeling solution for current RUL prediction tasks.
5 Conclusion
With the widespread adoption of electrification and intelligent systems in transportation, energy storage, and industrial control, health management and remaining useful life prediction of lithium-ion batteries have become critical tasks to ensure system safety and operational efficiency. Addressing key challenges such as the difficulty of RUL prediction under nonlinear and complex degradation mechanisms during battery operation, this work constructs a hybrid deep learning model that integrates Long Short-Term Memory networks with Transformer architecture based on the publicly available MIT battery dataset. The model aims to enhance prediction accuracy, stability, and generalization capability.
This study centers on the theme of “high-dimensional sequence modeling and deep fusion prediction.” First, in data preprocessing and feature engineering, raw sensor data including battery temperature and multi-channel voltages were systematically processed. Feature dimensionality reduction, principal component analysis, and physics-informed temperature-derived feature design were conducted to construct interpretable input variables such as temperature mean, temperature difference range, and temperature fluctuation. Meanwhile, unified data normalization techniques, including Z-score standardization and Yeo-Johnson transformation, were applied to improve the model’s capability to handle multi-scale and heterogeneous distributions. Furthermore, to align with sequence prediction tasks, a sliding window method was employed to reconstruct time series samples, effectively embedding local temporal dynamics.
Second, at the model design level, this work proposes a fusion modeling approach combining LSTM and Transformer structures. The LSTM module leverages gating mechanisms to accurately capture short-term fluctuations and long-term dependencies, which is well-suited for modeling dynamic sequences exhibiting continuity and staged features during battery degradation. The Transformer module employs multi-head attention and positional encoding to model global dependencies across the entire input sequence, enhancing expressiveness under long-sequence conditions. By concatenating and fusing the feature vectors from both modules, a multimodal prediction model capable of simultaneously capturing local temporal dynamics and global structural variations was constructed.
In terms of training optimization and performance evaluation, a training framework based on mean squared error loss and the Adam optimizer was established, achieving stable convergence after 200 iterations. Evaluation on the test set demonstrated that the proposed LSTM-Transformer model attained an RMSE of 0.0085, MAPE of 0.0200, and R2 of 0.9902, significantly outperforming conventional single deep learning models. Residual distribution analysis and visualization of prediction results further validated the model’s strong ability to capture battery degradation trends, robust performance, and lack of systematic bias, indicating substantial potential for engineering applications.
However, the proposed method still faces certain limitations in practical deployment, such as its reliance on high-quality sensor data and insufficient transferability across different usage scenarios. Future research will focus on enhancing the model’s adaptability to multi-source data and exploring strategies that integrate online learning with few-shot learning to improve its practicality and robustness.
In summary, the proposed LSTM-Transformer fusion prediction model exhibits high accuracy and stability in battery RUL forecasting. It provides effective technical support for the development of next-generation intelligent battery management systems, with promising prospects for practical engineering deployment and broader adoption.
Data availability statement
The original contributions presented in the study are included in the article/supplementary material, further inquiries can be directed to the corresponding author.
Author contributions
TZ: Writing – review and editing, Investigation, Writing – original draft, Formal Analysis, Visualization, Data curation. YZ: Methodology, Conceptualization, Supervision, Writing – review and editing, Writing – original draft. MW: Formal Analysis, Methodology, Writing – review and editing, Investigation. WF: Software, Formal Analysis, Methodology, Project administration, Writing – review and editing. SC: Formal Analysis, Validation, Writing – review and editing, Investigation. GW: Writing – review and editing, Methodology, Supervision, Investigation.
Funding
The author(s) declare that financial support was received for the research and/or publication of this article. This work is supported by Guangdong Basic and Applied Basic Research Foundation (No. 2023A1515240014), the key project of Shenzhen science and technology plan (No. JCYJ20220818103416035).
Conflict of interest
The authors declare that the research was conducted in the absence of any commercial or financial relationships that could be construed as a potential conflict of interest.
Correction note
A correction has been made to this article. Details can be found at: 10.3389/felec.2025.1693752.
Generative AI statement
The author(s) declare that no Generative AI was used in the creation of this manuscript.
Any alternative text (alt text) provided alongside figures in this article has been generated by Frontiers with the support of artificial intelligence and reasonable efforts have been made to ensure accuracy, including review by the authors wherever possible. If you identify any issues, please contact us.
Publisher’s note
All claims expressed in this article are solely those of the authors and do not necessarily represent those of their affiliated organizations, or those of the publisher, the editors and the reviewers. Any product that may be evaluated in this article, or claim that may be made by its manufacturer, is not guaranteed or endorsed by the publisher.
References
Bao-Hua, L., Long-Wen, Z., Yi-Qiang, W., and Chen, C. (2024). Dual power transformation and Yeo–Johnson techniques for static and dynamic reliability assessments. Buildings 14 (11), 3625. doi:10.3390/buildings14113625
Chen, D., Hong, W., and Zhou, X. (2022). Transformer network for remaining useful life prediction of lithium-ion batteries. Ieee Access 10, 19621–19628. doi:10.1109/access.2022.3151975
Crawford, A. J., Choi, D., Balducci, P. J., Subramanian, V. R., and Viswanathan, V. V. (2021). Lithium-ion battery physics and statistics-based state of health model. J. Power Sources 501, 230032. doi:10.1016/j.jpowsour.2021.230032
Elmahallawy, M., Elfouly, T., Alouani, A., and Massoud, A. M. (2022). A comprehensive review of lithium-ion batteries modeling, and state of health and remaining useful lifetime prediction. IEEE Access 10, 119040–119070. doi:10.1109/access.2022.3221137
Han, Y., Li, C., Zheng, L., and Lei, G. (2023). Remaining useful life prediction of lithium-ion batteries by using a denoising transformer-based neural network. Energies 16 (17), 6328. doi:10.3390/en16176328
Jafari, S., and Byun, Y. C. (2022). Xgboost-based remaining useful life estimation model with extended kalman particle filter for lithium-ion batteries. Sensors 22 (23), 9522. doi:10.3390/s22239522
Ji, S., Zhu, J., Yang, Y., dos Reis, G., and Zhang, Z. (2024). Data-driven battery characterization and prognosis: recent progress, challenges, and prospects. Small Methods 8 (7), 2301021. doi:10.1002/smtd.202301021
Jin, Z., Li, X., Qiu, Z., Kong, E., and Li, B. (2025). A data-driven framework for lithium-ion battery RUL using LSTM and XGBoost with feature selection via binary firefly algorithm. Energy 314, 134229. doi:10.1016/j.energy.2024.134229
Li, X., Yu, D., Byg, V. S., and Daniel Ioan, S. (2023). The development of machine learning-based remaining useful life prediction for lithium-ion batteries. J. Energy Chem. 82, 103–121. doi:10.1016/j.jechem.2023.03.026
Lin, M., Wu, D., Chen, S., Meng, J., Wang, W., and Wu, J. (2024). Battery health prognosis based on sliding window sampling of charging curves and independently recurrent neural network. IEEE Trans. Instrum. Meas. 73, 1–9. doi:10.1109/tim.2023.3348894
Liu, K., Gao, Y., Zhu, C., Li, K., Fei, M., Peng, C., et al. (2022). Electrochemical modeling and parameterization towards control-oriented management of lithium-ion batteries. Control Eng. Pract. 124, 105176. doi:10.1016/j.conengprac.2022.105176
Nunes, T. S. N., Moura, J. J. P., Prado, O. G., Camboim, M. M., de Fatima N. Rosolem, M., Beck, R. F., et al. (2023). An online unscented Kalman filter remaining useful life prediction method applied to second-life lithium-ion batteries. Electr. Eng. 105 (6), 3481–3492. doi:10.1007/s00202-023-01910-7
Park, K., Choi, Y., Choi, W. J., Ryu, H. Y., and Kim, H. (2020). LSTM-based battery remaining useful life prediction with multi-channel charging profiles. IEEE Access 8, 20786–20798. doi:10.1109/access.2020.2968939
Reza, M. S., Hannan, M. A., Mansor, M., Ker, P. J., Tiong, S. K., and Hossain, M. J. (2024). Gravitational search algorithm based LSTM deep neural network for battery capacity and remaining useful life prediction with uncertainty. IEEE Trans. Industry Appl. 60, 9171–9183. doi:10.1109/tia.2024.3429452
Sharma, P., and Bora, B. J. (2022). A review of modern machine learning techniques in the prediction of remaining useful life of lithium-ion batteries. Batteries 9 (1), 13. doi:10.3390/batteries9010013
Tong, Z., Miao, J., Tong, S., and Lu, Y. (2021). Early prediction of remaining useful life for lithium-ion batteries based on a hybrid machine learning method. J. Clean. Prod. 317, 128265. doi:10.1016/j.jclepro.2021.128265
Wang, S., Jin, S., Bai, D., Fan, Y., Shi, H., and Fernandez, C. (2021). A critical review of improved deep learning methods for the remaining useful life prediction of lithium-ion batteries. Energy Rep. 7, 5562–5574. doi:10.1016/j.egyr.2021.08.182
Wang, F. K., Amogne, Z. E., Chou, J. H., and Tseng, C. (2022). Online remaining useful life prediction of lithium-ion batteries using bidirectional long short-term memory with attention mechanism. Energy 254, 124344. doi:10.1016/j.energy.2022.124344
Wang, Y., Zhang, X., Li, K., Zhao, G., and Chen, Z. (2022). Perspectives and challenges for future lithium-ion battery control and management. eTransportation 18, 100260. doi:10.1016/j.etran.2023.100260
Xue, Z., Zhang, Y., Cheng, C., and Ma, G. (2020). Remaining useful life prediction of lithium-ion batteries with adaptive unscented kalman filter and optimized support vector regression. Neurocomputing 376, 95–102. doi:10.1016/j.neucom.2019.09.074
Yang, H., Hong, J., Liang, F., and Xu, X. (2023). Machine learning-based state of health prediction for battery systems in real-world electric vehicles. J. Energy Storage 66, 107426. doi:10.1016/j.est.2023.107426
Yao, L., Xu, S., Tang, A., Zhou, F., Hou, J., Xiao, Y., et al. (2021). A review of lithium-ion battery state of health estimation and prediction methods. World Electr. Veh. J. 12 (3), 113. doi:10.3390/wevj12030113
Zhang, L., Shen, Z., Sajadi, S. M., Prabuwono, A. S., Mahmoud, M. Z., Cheraghian, G., et al. (2022a). The machine learning in lithium-ion batteries: a review. Eng. Analysis Bound. Elem. 141, 1–16. doi:10.1016/j.enganabound.2022.04.035
Keywords: lithium-ion battery, remaining useful life, LSTM, transformer, time-series prediction
Citation: Zhao T, Zhang Y, Wang M, Feng W, Cao S and Wang G (2025) A hybrid LSTM–transformer model for accurate remaining useful life prediction of lithium-ion batteries. Front. Electron. 6:1654344. doi: 10.3389/felec.2025.1654344
Received: 26 June 2025; Accepted: 04 August 2025;
Published: 21 August 2025; Corrected: 27 October 2025.
Edited by:
Xiaohu Yang, Xi’an Jiaotong University, ChinaReviewed by:
Bowen Zhou, Northeastern University, ChinaWenji Song, Chinese Academy of Sciences (CAS), China
Yushuang Liu, Wuhan University, China
Copyright © 2025 Zhao, Zhang, Wang, Feng, Cao and Wang. This is an open-access article distributed under the terms of the Creative Commons Attribution License (CC BY). The use, distribution or reproduction in other forums is permitted, provided the original author(s) and the copyright owner(s) are credited and that the original publication in this journal is cited, in accordance with accepted academic practice. No use, distribution or reproduction is permitted which does not comply with these terms.
*Correspondence: Yanhui Zhang, emhhbmd5aEBzaWF0LmFjLmNu