 Baoye Tian1,2*
 Ye Zhang
- 1State Key Laboratory of HVDC (Electric Power Research Institute, CSG), Guangzhou, China
- 2China Southern Power Grid Co., Ltd., Guangzhou, China
As the proportion of HVDC infeed power increases in the eastern receiving-end power grid, inertia and frequency regulation capability decrease. Utilizing modular multilevel converter (MMC) stations at the receiving-end to provide active frequency support can effectively address this challenge. To this end, this paper first introduces conventional control methods for MMC-based HVDC systems participating in frequency regulation. Subsequently, it establishes a critical mapping relationship between the initial rate of change of frequency (RoCoF) and the subsequent maximum frequency deviation at the converter bus. Building upon this relationship, an adaptive strategy for dynamically adjusting the frequency regulation parameters (virtual inertia and damping coefficient) of the MMC is proposed. This strategy enables the MMC to provide prioritized inertia support during the initial inertial stage and switch to damping support during the recovery stage. Finally, simulations conducted on a modified IEEE 39 bus system validate the effectiveness of the proposed adaptive frequency regulation strategy.
1 Introduction
The distribution of energy resources and loads in China is characterized by a reverse east-west pattern. Major fossil and renewable energy resources are in the western regions, while primary load centers are situated along the eastern coast. Thus, transmitting power from west to east is crucial, with ultra-high voltage direct current (UHVDC) transmission being a key technology for large-scale, long-distance power transmission (Li, 2016; Mejia-Ruiz et al., 2025). Recently, both the number and capacity of DC systems have significantly increased, and the proportion of DC infeed power in the eastern coastal provincial grids has gradually risen (Yuan, 2005; Mejia-Rui et al., 2022). Concurrently, the proportion of synchronous generation, mainly represented by hydropower and thermal power, has shown a declining trend year by year. With the decrease in synchronous generation share, the inertia and frequency regulation capabilities of the power grid also decline, posing a severe threat to frequency stability (Wen et al., 2020; Mejia-Ruiz et al., 2023). Under these conditions, MMC-based flexible HVDC systems providing active frequency support represent a promising solution (Xie et al., 2024; Li Congshan et al., 2025).
Various control strategies have been developed for MMCs to participate in AC grid frequency regulation. Among them, the most widely adopted are virtual synchronous machine (VSM) control (Guan et al., 2015) and P-f droop control (Wang et al., 2018). Xiong et al. (2021) investigates the use of inertia control in wind farms, realizing coordinated control between the wind farm and DC grid through power distribution among onshore MMCs. Kirakosyan et al. (2021) achieves frequency regulation at converter stations by modifying the droop control reference of MMCs. Considering that MMCs must also fulfill their internal voltage regulation tasks while supporting grid frequency, Wang et al. (2023) and Judge and Green (2019) explore coordinated control of DC voltage and AC frequency for individual MMC units.
However, existing control strategies typically rely on fixed frequency regulation parameters and adjust MMC output power based solely on instantaneous frequency deviations at the converter bus. If future system states can be predicted, control parameter selection can go beyond current-state dependence and incorporate future information as well, thereby significantly improving control performance. Consequently, some researchers have attempted to predict the maximum frequency deviation online. Yang et al. (2022) and Liu et al. (2020) employ polynomial fitting to describe frequency response characteristics and thereby predict the frequency nadir after major disturbances. Further considering the influence of nonlinear elements, Zhang et al. (2021) improves the polynomial fitting method and enhances the accuracy of frequency nadir prediction. While these approaches generally provide high accuracy, their timeliness often falls short, limiting their applicability in the real-time adaptive adjustment of MMC control parameters.
Based on the above analysis, it is evident that predicting the dynamic trajectory of AC frequency is a critical technique for enhancing frequency regulation performance. However, the timeliness of existing prediction methods remains insufficient. Most of these methods rely on fitting time-series data of considerable length, and their dependence on the completeness of input data reduces their effectiveness for real-time applications. In fact, the rate of change of frequency (RoCoF) when a disturbance occurs inherently contains information about the magnitude and location of the disturbance. This makes it possible to predict the maximum frequency deviation using RoCoF, thereby significantly improving the prediction timeliness. With key frequency trajectory information available, considerable enhancement in frequency regulation performance becomes achievable------though the design of an effective control strategy remains a challenge.
To address this issue, this paper first introduces control methods for flexible HVDC systems participating in frequency regulation and analyzes the requirements for frequency regulation performance in different post-disturbance phases at the receiving-end grid. Then, a primary frequency regulation model is established to derive the mapping relationship between RoCoF and maximum frequency deviation. Accordingly, a timing-adaptive method for adjusting the frequency regulation parameters of flexible HVDC systems is proposed. This method tunes the MMC’s virtual inertia and damping coefficient based on RoCoF immediately following a disturbance, thereby fully exploiting the frequency regulation potential of MMCs.
2 MMC frequency regulation implementation
Without loss of generality, the control system block diagram of the MMC can be summarized in a general form as shown in Figure 1. The MMC control system mainly consists of four parts: the modulation unit, the inner-loop controller, the outer-loop controller, and the reference value generator. Typically, the modulation unit and inner-loop controller are fixed, while the outer-loop controller can be configured for different control objectives. For the d-axis outer-loop controller, the options include constant active power control or constant DC voltage control. For the q-axis outer-loop controller, the options include constant reactive power control or constant AC bus voltage control. The method by which MMC participates in frequency regulation is to generate the input signal of the d-axis outer-loop controller based on grid frequency deviation or rate of change of frequency.
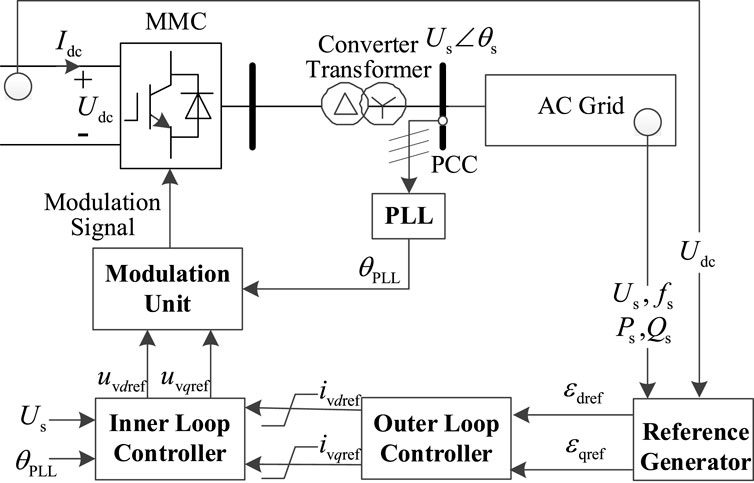
Figure 1. Control structure of the MMC.
In the figure, Idc and Udc represent the DC current and DC voltage of the MMC, respectively; Us and θs represent the voltage magnitude and phase at the point of common coupling (PCC); fs is the grid frequency at the PCC; Ps and Qs represent the active and reactive power outputs of the MMC, respectively. ivdref and ivqref are the reference values for d- and q-axis currents; uvdref and uvqref are the reference values for d- and q-axis voltages. θPLL is the phase angle output by the phase-locked loop (PLL), and εdref and εqref are the input command values for the d- and q-axis outer-loop controllers.
At the primary frequency regulation time scale, the dynamic response of the MMC can be neglected, and the MMC is assumed to follow the control commands in real time. When the MMC operates under constant active power control, to enable its participation in AC frequency regulation, the input of the d-axis outer-loop controller can be generated as shown in Equation 1.
here Psref is the active power reference, Ps0 is the initial active power value, Hv and Dv are the virtual inertia and damping coefficients, and Δfs is the frequency deviation of the converter bus. Unless otherwise specified, all variables used in this article are in per unit value.
If the MMC adopts constant DC voltage control, the relationship between the DC voltage and power can be approximately described by the differential equation shown in Equation 2.
here Ceq is the equivalent capacitance of the MMC, Udc is the DC voltage, Pin is the active power input from the DC side into the MMC, and Pout is the active power output on the AC side.
When the receiving-end MMC adopts constant DC voltage control, and the sending-end converter station operates under constant active power control, Pin in Equation 2 can be considered constant. To allow the MMC to exhibit the frequency regulation characteristic for Pout as shown in Equation 3, Udc can be designed to satisfy Equation 4.
here ΔPout is the variation in the MMC’s output power. By integrating both sides of Equation 4, the following can be obtained:
here Udc0 is the rated DC voltage, and fs0 is the rated frequency.
According to Equation 5, to enable the MMC operating under constant DC voltage control to exhibit frequency regulation behavior, the DC voltage reference value can be set as:
here Udcref is the DC voltage reference value.
3 Timing-adaptive frequency regulation strategy for receiving-end MMC-HVDC stations
When an active power disturbance occurs in the system, causing an imbalance between supply and demand, the system enters a frequency response process. Generally, the frequency response of an AC grid can be divided into three stages: the inertial stage, the damping stage, and the steady-state stage, as illustrated in Figure 2. During the inertial stage, the frequency drops rapidly. At this stage, the MMC should primarily provide inertia support to the onshore grid to slow down the rate of frequency decline. In the damping stage, the frequency begins to recover and gradually reaches a steady-state value. If the MMC continues to provide inertia support during this stage, it may hinder the rate of frequency recovery. Therefore, in the damping stage, the MMC should primarily provide damping support to the onshore grid.
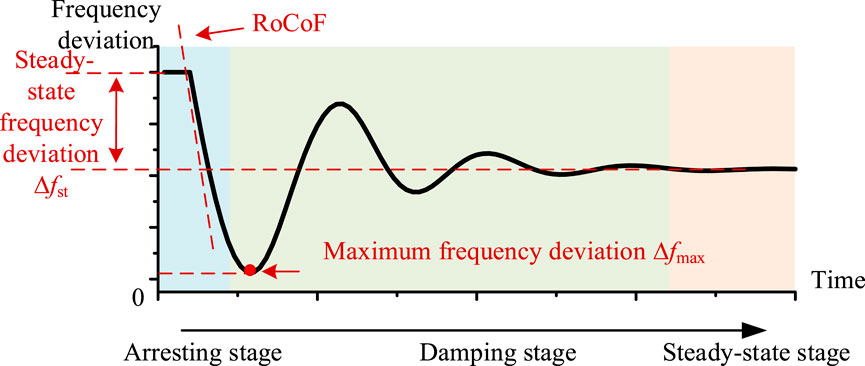
Figure 2. Diagram of the frequency response.
To define a switching principle between the inertia support and damping support modes of MMC, and to ensure that the MMC does not become overloaded in either mode, it is necessary to predict the maximum frequency deviation after the disturbance. To improve both the speed and accuracy of this prediction, a method based on RoCoF is proposed for estimating the maximum frequency deviation.
3.1 Maximum frequency deviation estimation based on RoCoF
Considering that primary frequency regulation is a relatively long-duration global dynamic process, local and inter-area oscillations in the system can be assumed to have largely decayed at this timescale. All generators in the AC system operate in synchronism, maintaining a uniform system frequency. Therefore, a unified frequency model is adopted to simulate the system’s frequency response characteristics (Fan et al., 2020). A representative model of a system incorporating both thermal and hydroelectric generating units for primary frequency regulation is shown in Figure 3.
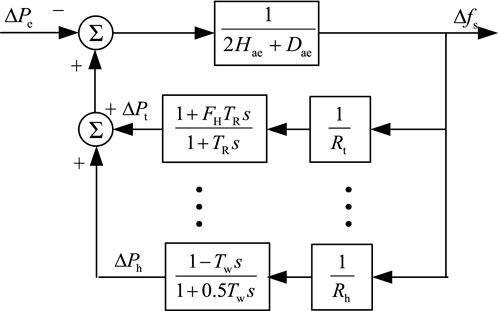
Figure 3. Transfer function diagram of the primary frequency regulation model.
In Figure 3, ΔPt and ΔPh represent the mechanical power variations of thermal and hydropower units. FH represents the proportion of power generated by the high-pressure boiler of the steam turbine, TR is the reheating time constant, and Δf is the system frequency deviation. Rt and Rh are the droop coefficients of thermal and hydropower units. Tw is the time constant associated with the water hammer effect. ΔPe represents the variation in electromagnetic power. Hae is the equivalent system inertia time constant, and Dae is the equivalent system damping coefficient. It is assumed that the system contains nt thermal units and nh hydropower units. The expressions for Hae and Dae are given in Equations 7, 8, where SBi is the rated capacity of the ith unit.
By aggregating and equivalently modeling the governor systems of thermal and hydropower units (Li et al., 2025), the differential equation of the aggregated governor system can be obtained as follows:
In Equation 9, ΔPmae represents the sum of the mechanical power variations of all units, and its expression is given in Equation 10. Tfae, Tpae, and Rae are equivalent parameters, which satisfy the conditions described in Equations 11–13.
The transfer function of the system frequency response after equivalence is:
The magnitude of RoCoF (Rate of Change of Frequency) is related to system inertia and the amount of power deficit, and can be expressed as:
According to Equations 14, 15, the quantitative relationship between the system’s maximum frequency deviation and RoCoF can be obtained as:
In this equation, η denotes the ratio between the maximum frequency deviation and RoCoF, Δfmax is the maximum frequency deviation, and vR is the RoCoF. The expressions for ωn, ζ, and φ are given as follows:
From Equations 16–19, the ratio η between the maximum frequency deviation and RoCoF does not change with the magnitude of the disturbance power. Under constant system parameters, it remains a fixed value. Therefore, in practical systems, it can be considered approximately that the ratio between the maximum frequency deviation and RoCoF is only related to the operating condition and remains unchanged under disturbances such as DC blocking and load fluctuations. The influence of key parameters in above formulas is analyzed in Table 1.
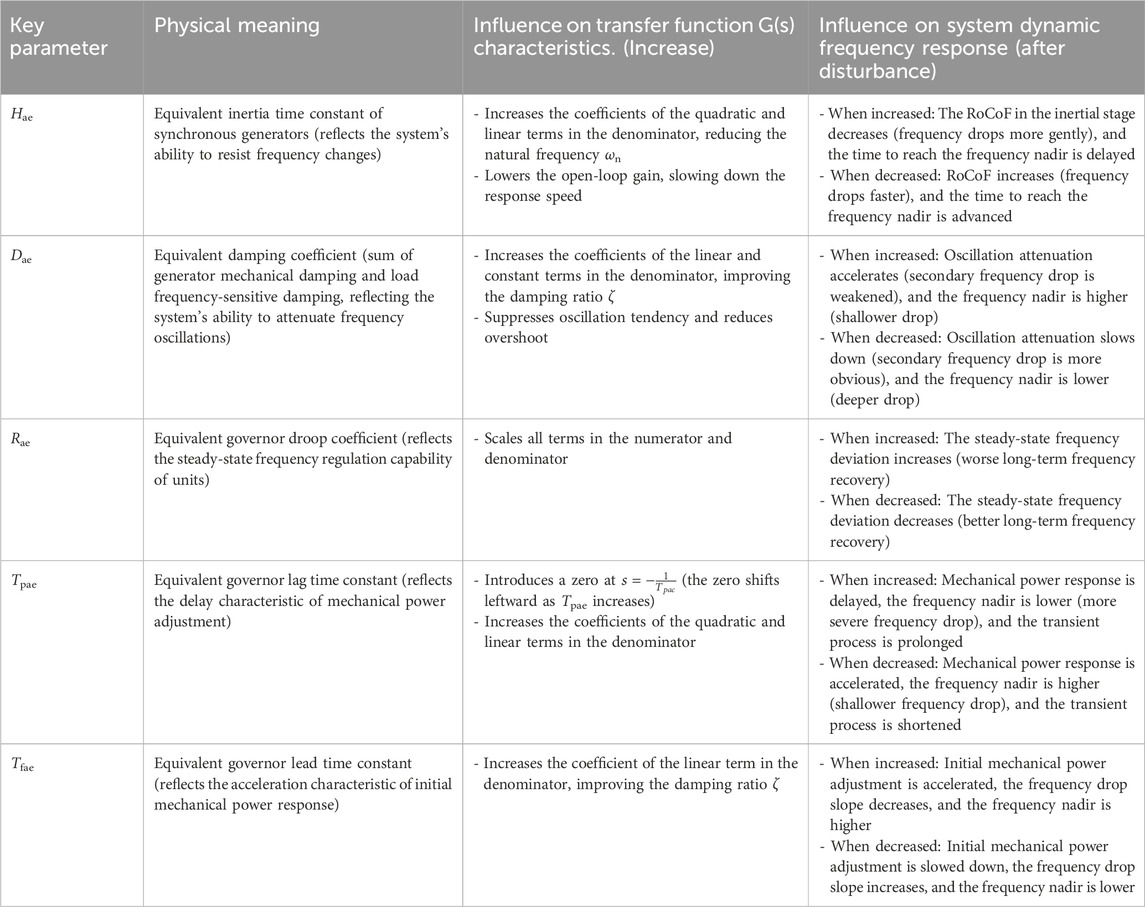
Table 1. Influence of key parameters on system dynamics.
3.2 MMC time-sequence adaptive frequency regulation strategy
To enable the MMC to provide inertia support to the system during the arrest stage and damping support during the stabilizing stage, the active power variation of the MMC should satisfy the following conditions:
In this equation, ΔPMMC represents the active power variation of the MMC, while Hm and Dm denote the adaptive virtual inertia and damping coefficients of the MMC, respectively. vc is the rate of change of frequency at the moment of strategy switching, which satisfies the following equation:
By adjusting the values of Hm and Dm, the switching point of the control strategy can be regulated. In extreme cases, if Hm approaches zero, the MMC enters the virtual damping control mode right at the initial operating point. If Dm approaches zero, the MMC enters the virtual damping control mode only at the lowest frequency point. The values of Hm and Dm can be reasonably set based on predicted values of RoCoF and the maximum frequency deviation, as shown in:
In this equation, ΔPmax represents the maximum active power variation of the MMC.
In combination with Equation 16, the virtual damping coefficient can also be expressed as a function of RoCoF:
After the disturbance occurs, the virtual inertia Hm of the MMC is first determined using the rate of change of frequency at the moment of the disturbance. Then, considering the inertia support provided by the MMC, the predicted maximum frequency deviation Δfmax is obtained from Equation 16, and subsequently the virtual damping coefficient Dm of the MMC is calculated using Equation 23. During the frequency response process, the control strategy is switched based on Equation 20, and the value of vc is obtained from Equation 21.
In addition, to avoid frequent actions of the MMC and to reduce the estimation error caused by differences in RoCoF across different buses, the RoCoF used in practical applications should be the average value over a time window, rather than an instantaneous value at a single moment. This approach reduces both the frequency of MMC actions and the estimation error in the maximum frequency deviation due to varying frequency bands across different buses.
The triggering condition for the MMC time-sequence adaptive frequency regulation strategy is given by:
In Equation 24, t0 is the measurement start time, ts is the measurement end time, and db is the dead band for action.
The control flow is illustrated in Figure 4. The key steps are as follows:
Step 1: Prediction of Maximum Frequency Deviation
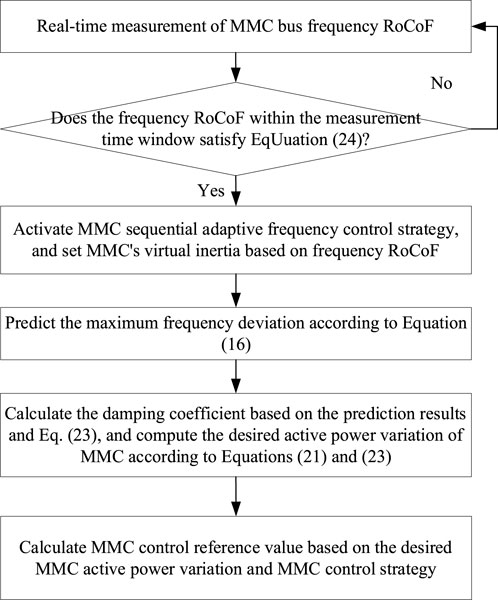
Figure 4. MMC sequential adaptive frequency regulation strategy flowchart.
After a disturbance occurs, the virtual inertia Hm of the MMC is set based on the rate of change of frequency (RoCoF). Then, considering the virtual inertia of the MMC, the maximum frequency deviation is estimated using the relationship between RoCoF and frequency deviation described in Equation 16.
Step 2: Calculation of MMC Expected Active Power Variation
The virtual damping coefficient is calculated using Equation 23, and the frequency change rate at the control mode switching point is calculated using Equation 21. Subsequently, Equation 20 is used to compute the expected active power variation of the MMC in real time throughout the time-sequence process.
Step 3: Calculation of MMC Control Reference Value
If the MMC operates under a constant active power control mode, then the expected active power variation obtained in Step 2 serves directly as the power reference. If the MMC operates under a constant DC voltage control mode, then the DC voltage reference is further calculated based on the relationship between virtual inertia, damping coefficient, and DC voltage as described in Equation 6.
4 Case study analysis
The proposed method is validated on a modified IEEE 39-bus system, with simulations conducted using PSS/E. The network topology of the modified IEEE 39 bus system is shown in Figure 5. A bipolar MMC-based flexible DC transmission system is integrated at Bus 7, and the main parameters of the MMC-HVDC are listed in Table 2.
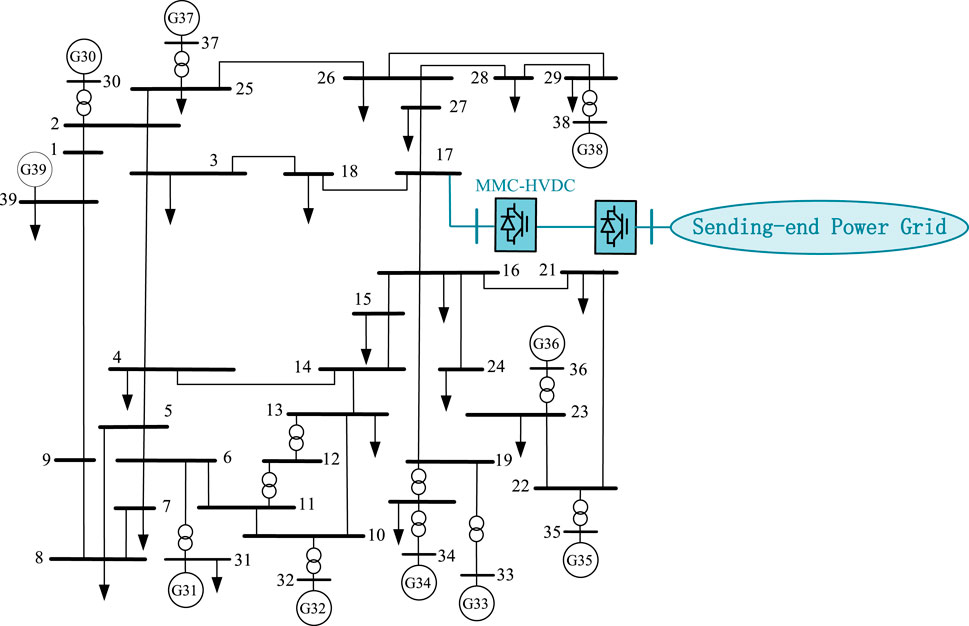
Figure 5. Network topology of the modified IEEE 39 bus system.
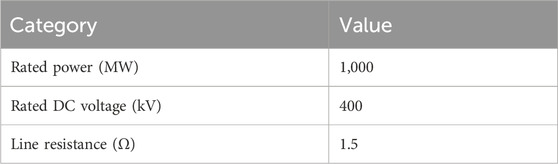
Table 2. Main parameters of the monopole MMC-HVDC system.
In the original IEEE 39-bus case, the total installed generation capacity is approximately 8050 MVA, with a load of 6124 MW. After the MMC-HVDC is connected, the generation capacity and output of all generating units remain unchanged, while all loads are scaled proportionally to maintain supply-demand balance.
4.1 Validation of maximum frequency deviation prediction method
The prerequisite for the effective application of the MMC time-sequenced adaptive frequency regulation strategy is the accurate prediction of the maximum frequency deviation using RoCoF. Therefore, the following focuses on validating the RoCoF-based method for predicting maximum frequency deviation. Generally, after a disturbance occurs, due to differences in generator capacities, parameters, and distances from the disturbance point, the imbalance in power is distributed unevenly among the generators. Consequently, within a very short time after the disturbance, each generator exhibits a different RoCoF. Because of the variation in RoCoF among generators, they cannot maintain perfect frequency synchronization, and relative phase shifts occur—this process is known as the power angle swing. When the system damping ratio is sufficient, the relative motion among generators gradually settles down, and the system then enters the primary frequency regulation stage, during which the generators operate in synchronism. For example, if a 600 MW load step is applied to the modified IEEE 39 bus system, the frequency variations of the ten generators in the system are shown in Figure 6.
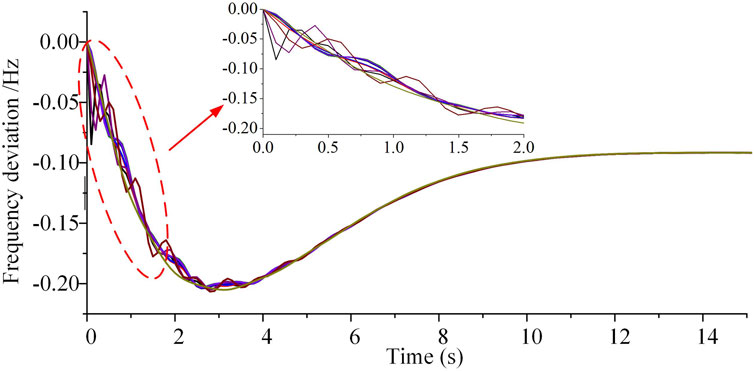
Figure 6. Frequency response curves of the ten units after the load steps.
From Figure 6, it can be observed that after the disturbance, the generators cannot maintain complete frequency synchronization. Using the RoCoF at a single time point to predict the maximum frequency deviation is likely to introduce significant errors. However, if the average RoCoF over a certain time window is used, the average RoCoFs of different generators become relatively similar, providing a more reliable reference for predicting the maximum frequency deviation. Therefore, in the following analysis, the average RoCoF values over different generators and various time window lengths are used to predict the maximum frequency deviation. These predictions are then compared with the actual maximum frequency deviations obtained from simulation results. The corresponding errors are shown in Figure 7. The formula for calculating the prediction error is given in Equation 25.
where ε is the prediction error, Δfpv is the predicted value of the maximum frequency deviation, and Δfsv is the simulated value of the maximum frequency deviation.
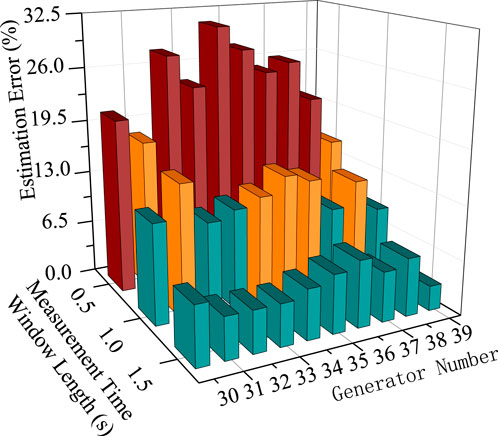
Figure 7. Statistical chart of maximum frequency deviation prediction error.
From Figure 7, if a time window of only 0.5 s is used to average the RoCoF, the resulting prediction of the maximum frequency deviation has a relatively large error, with the maximum reaching up to 31%. However, if the time window length is extended to 1.5 s, the prediction error can be effectively reduced to below 10%. It is worth noting that the time window should not be excessively long, as this would delay the participation of the MMC in frequency regulation, reducing its effectiveness in enhancing frequency stability. Among the ten generators, using G39 to obtain the average RoCoF yields the best prediction accuracy for the maximum frequency deviation. This is because G39 has a relatively large capacity and a smoother frequency waveform, resulting in a more stable mapping relationship between RoCoF and maximum frequency deviation.
It should be noted that RoCoF measurement errors (△VR)) affect the switching criterion through two paths:
Path 1: Impact on Hm and maximum frequency deviation prediction: Hm is directly tuned by RoCoF (Equation 22). A positive △VR (overestimated RoCoF) leads to overestimation of Hm, resulting in excessive inertia support and delayed frequency recovery. A negative △VR (underestimated RoCoF) leads to insufficient Hm, failing to suppress the initial frequency drop.
Path 2: Impact on vc and switching timing: vc is derived from predicted maximum frequency deviation (Equation 21), which depends on RoCoF. An overestimated RoCoF advances the switching to damping support, while an underestimated RoCoF delays it.
To determine the applicable error range for a specific system, it is necessary to conduct prior analysis of its structure and dynamic performance—this is a practical engineering prerequisite for the strategy’s application.
4.2 Verification of the MMC sequential adaptive frequency regulation strategy
The following section verifies the MMC sequential adaptive frequency regulation strategy. It is assumed that the MMC’s short-term maximum support power is 0.1 pu, equivalent to 200 MW. Three operating conditions are selected for simulation: MMC not participating in frequency regulation, MMC using the sequential adaptive frequency regulation strategy, and MMC using the virtual synchronous control strategy. Under the virtual synchronous control strategy, the inertia and damping coefficient of the MMC are fixed, selected based on the principle of ensuring no overload occurs throughout the transient process.
The simulation results are shown in Figures 8–10. Figure 8 presents the system’s frequency response curves under the three conditions. It can be observed that when the MMC adopts either the sequential adaptive frequency regulation strategy or the virtual synchronous control strategy, the minimum point of the system frequency can be effectively increased, thereby improving system frequency stability. Compared with the virtual synchronous control strategy, the sequential adaptive frequency regulation strategy can further increase the minimum system frequency and accelerate the frequency recovery process. This is because, during the system frequency recovery process, inertia control plays a hindering role, whereas the sequential adaptive frequency regulation strategy transitions into damping control during this phase, which is beneficial for enhancing the frequency recovery speed.
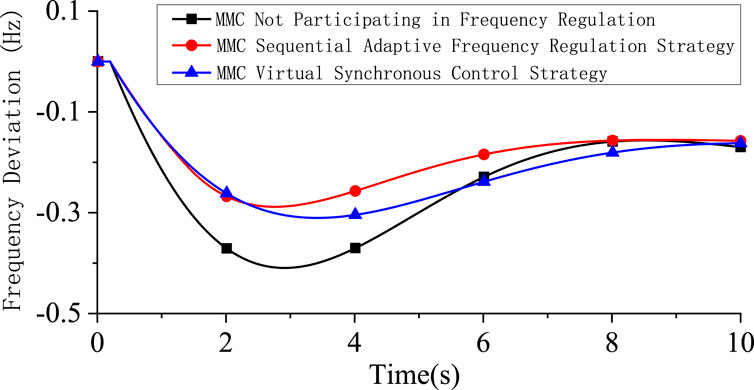
Figure 8. Frequency response curves under different control strategies of the MMC.
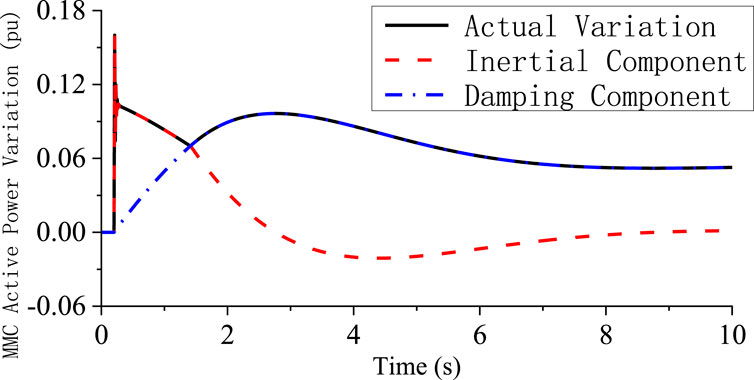
Figure 9. Active power variation of the MMC under the sequential adaptive frequency regulation strategy.
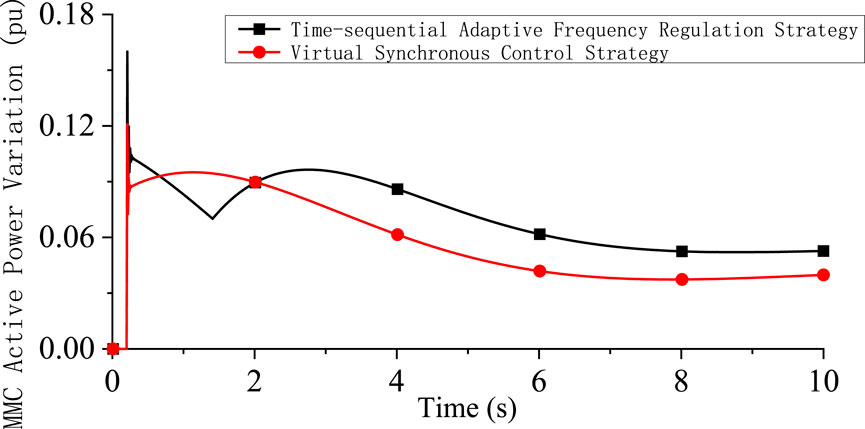
Figure 10. Comparison of the MMC active power variations under different control strategies.
The active power variation of the MMC under the sequential adaptive frequency regulation strategy is shown in Figure 9. Figure 9 illustrates the actual active power variation of the MMC, as well as the computed results of the inertia and damping components. Under the sequential adaptive frequency regulation strategy, the actual active power variation of the MMC corresponds to the maximum value between the inertia and damping control outputs, effectively forming an upper boundary. Figure 10 presents the MMC active power variations under both the sequential adaptive frequency regulation strategy and the virtual synchronous control strategy. In comparison, the sequential adaptive frequency regulation strategy enables the MMC to release its maximum power margin at the point of maximum frequency deviation. In contrast, under the virtual synchronous control strategy, the MMC reaches its peak output before the frequency nadir and subsequently experiences a continuous decline in output due to inertia control, failing to fully utilize the MMC’s power support capability. The detailed comparison between the proposed adaptive strategy and the virtual synchronous control is shown in Table 3.
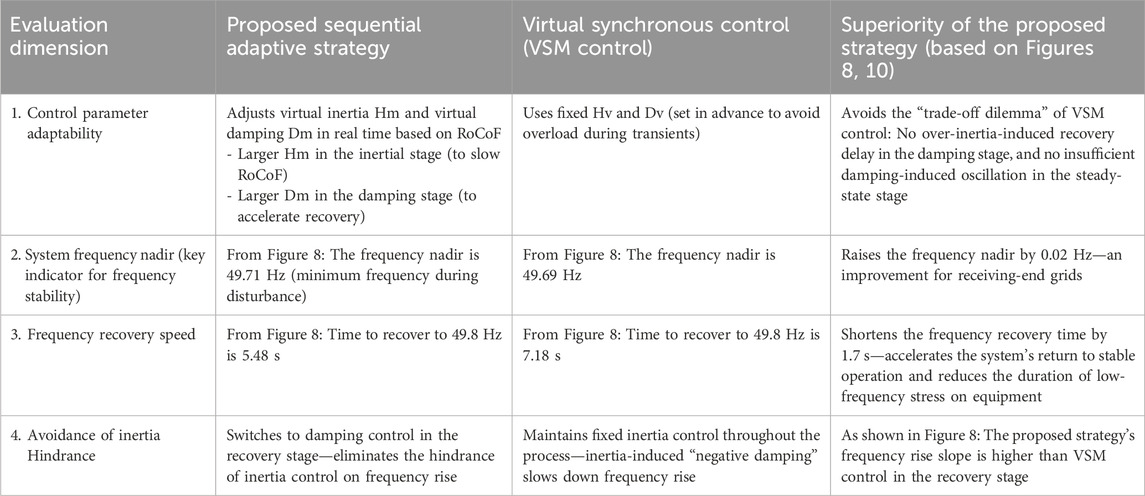
Table 3. Superiority of the Proposed Adaptive Strategy vs. Virtual Synchronous Control.
Previously, it was mentioned that if the receiving-end MMC operates under constant active power control, its participation in frequency regulation is achieved by adjusting its power reference. In this case, the power and energy required for frequency regulation are provided by the sending-end grid, and the DC voltage of the system can remain stable due to the sending-end MMC maintaining constant DC voltage control. On the other hand, if the receiving-end MMC operates under constant DC voltage control, its participation in frequency regulation is achieved by adjusting the DC voltage reference. In this scenario, the power and energy needed for frequency regulation are supplied by the DC-side capacitor energy storage of the MMC. Since the energy storage capacity of MMC submodule capacitors is limited, it usually cannot provide effective frequency support, and additional super-capacitor energy storage is required (Li J. et al., 2025). The impact of MMC participation in frequency regulation on its own DC voltage under different super-capacitor configurations is analyzed in Figure 11. When the equivalent lumped capacitance Ceq takes per unit values of 30, 12, and 6 pu (based on a rated capacity of 1,000 MW), it is observed that when the capacitance per unit value drops below 6 pu, the MMC DC voltage decreases below 0.9 pu under the current frequency regulation parameters, which is generally unacceptable. Therefore, if the receiving-end MMC adopts constant DC voltage control and attempts to participate in frequency regulation of the receiving-end grid, it imposes high requirements on the configuration of supercapacitor energy storage.
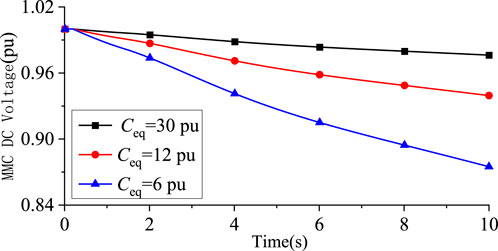
Figure 11. Variation curves of the DC voltage with different super-capacitor energy storage configurations.
4.3 Discussion on applicable conditions and performance boundaries
The case study demonstrates the effectiveness of the proposed adaptive frequency support strategy. However, its performance and applicability are subject to different conditions under the two control modes of the receiving-end MMC, which are systematically summarized here.
4.3.1 Applicable conditions for constant active power control mode
4.3.1.1 Energy source
The active power support is fundamentally provided by the sending-end grid. The receiving-end MMC acts as a power regulator, and the DC link serves as the power transmission channel.
4.3.1.2 Performance boundary and requirements
Sending-end Grid Capability: The sending-end grid must have sufficient spare capacity and fast response capability (e.g., from generators or energy storage) to inject the additional power required for frequency support into the DC link.
DC Link Capacity: The DC transmission system (including converters and lines) must have the capacity margin to carry this additional power transient without causing overcurrent or overvoltage issues.
Sending-end Control Coordination: The sending-end converter station must be capable of maintaining DC voltage stability while the receiving-end MMC varies its power draw. This mode is most suitable when the sending-end grid is strong and has abundant regulation resources.
4.3.2 Applicable conditions for constant DC voltage control mode
4.3.2.1 Energy source
The active power support is sourced from the energy stored in the DC-side capacitors of the MMC submodules. The DC voltage variation is the direct manifestation of this energy exchange.
4.3.2.2 Performance boundary and limitations
Limited Energy Reserve: The inherent energy storage capacity of MMC submodule capacitors is very limited. As shown in Figure 11, without external support, the DC voltage can drop to unacceptable levels during frequency support, which may threaten the secure operation of the HVDC system itself.
Dependency on Additional Energy Storage: To provide meaningful and sustained frequency support, this mode mandatorily requires the integration of large-capacity external energy storage systems (e.g., supercapacitors or batteries) on the DC side to supplement the MMC’s internal capacitance. The required size of this energy storage is directly proportional to the intended support power and duration. And the key requirement is “short-term fast high-power response”.
DC Voltage Stability: The control strategy must carefully manage the DC voltage deviation. Excessive deviation might lead to protection system activation or instability. Therefore, this mode is applicable primarily in systems where significant supercapacitor energy storage is co-located with the MMC station.
4.3.3 Summary
In summary, the choice between the two modes depends on the system configuration and available resources. The constant active power control mode is preferable when the sending-end grid is the desired source of support energy. In contrast, the constant DC voltage control mode is a viable option only when substantial supercapacitor energy storage is installed at the receiving-end station, effectively creating a hybrid MMC-ESS system for local frequency support.
5 Conclusion
This paper analyzes the technical approaches for MMC participating in grid frequency regulation under two control strategies: constant active power and constant DC voltage. To address the limitations of fixed-parameter control, a novel sequential adaptive frequency regulation strategy for MMC is proposed, which dynamically adjusts virtual inertia and damping coefficients based on the real-time estimation of the maximum frequency deviation via RoCoF.
Simulations conducted on the modified IEEE 39-bus system demonstrate the superior performance of the proposed strategy compared to the conventional virtual synchronous control (VSC) strategy. The advantages are quantitatively validated as follows:
Improved Frequency Nadir: The proposed strategy raises the system frequency nadir by 0.02 Hz, from 49.69 Hz to 49.71 Hz, as directly evidenced in Figure 8. This improvement is critical for enhancing the frequency security margin of the low-inertia receiving-end grid.
Accelerated Frequency Recovery: The time for the system frequency to recover to 49.8 Hz is significantly reduced from 7.18 s to 5.48 s, a reduction of 1.7 s. This faster recovery minimizes the duration of low-frequency stress on power equipment.
Full Utilization of Power Margin: The proposed strategy enables the MMC to deliver its maximum allowable support power of 200 MW (0.2 pu) precisely at the moment of the frequency nadir. In contrast, under the VSC strategy, the MMC’s output peaks before the nadir and decreases to about 180 MW at the critical point, failing to fully utilize its 200 MW capacity when it is most needed.
In summary, the proposed sequential adaptive strategy effectively taps into the frequency regulation potential of MMCs by ensuring optimal power injection at the critical time and eliminating the hindering effect of inertia during recovery. The case study quantitatively confirms its effectiveness in improving both the frequency nadir and the recovery speed.
Data availability statement
The raw data supporting the conclusions of this article will be made available by the authors, without undue reservation.
Author contributions
BT: Conceptualization, Data curation, Investigation, Methodology, Visualization, Writing – original draft, Writing – review and editing. JL: Conceptualization, Data curation, Investigation, Methodology, Supervision, Writing – review and editing. HZ: Investigation, Writing – review and editing. YZ: Investigation, Writing – review and editing.
Funding
The authors declare that financial support was received for the research and/or publication of this article. China Southern Power Grid Co., Ltd. Science and Technology Project: Research on the Hydro-Electromechanical Coupling Mechanism and Stability Characteristics of Ultra-Large-Scale ‘Bead-String’™ Hydropower Unit Clusters in DC Islanded Transmission Systems (ZBKJXM20240006).
Acknowledgements
We would like to sincerely thank all the subjects for volunteering their time and efforts during the research investigation. Thanks to all the staff that made contributions to this study.
Conflict of interest
Authors BT, JL, HZ, and YZ were employed by China Southern Power Grid Co., Ltd.
The authors declare that this study received funding from China Southern Power Grid Co., Ltd. The funder had the following involvement in the study: collection, analysis, interpretation of data.
Generative AI statement
The authors declare that no Generative AI was used in the creation of this manuscript.
Any alternative text (alt text) provided alongside figures in this article has been generated by Frontiers with the support of artificial intelligence and reasonable efforts have been made to ensure accuracy, including review by the authors wherever possible. If you identify any issues, please contact us.
Publisher’s note
All claims expressed in this article are solely those of the authors and do not necessarily represent those of their affiliated organizations, or those of the publisher, the editors and the reviewers. Any product that may be evaluated in this article, or claim that may be made by its manufacturer, is not guaranteed or endorsed by the publisher.
References
Fan, C. W., Chen, G., Shi, H. B., Liu, C., and Teng, Y.F. (2020). Analysis of the influence of multiple dead zone links on frequency oscillation based on unified frequency model. Autom. Electr. Power Syst. 44 (18), 164–171. doi:10.7500/AEPS20200119002
Guan, M. Y., Pan, W. L., Zhang, J., Hao, Q. R., Cheng, J. Z., and Zheng, X. (2015). Synchronous generator emulation control strategy for voltage source converter (VSC) stations. IEEE Trans. Power Syst. 30, 3093–3101. doi:10.1109/tpwrs.2014.2384498
Judge, P. D., and Green, T. C. (2019). Modular multilevel converter with partially rated integrated energy storage suitable for frequency support and ancillary service provision. IEEE Trans. Power Deliv. 34, 208–219. doi:10.1109/tpwrd.2018.2874209
Kirakosyan, A., El-Saadany, E. F., Moursi, M. S. E., and Salama, M. M. A. (2021). Selective frequency support approach for MTDC systems integrating wind generation. IEEE Trans. Power Syst. 36, 366–378. doi:10.1109/tpwrs.2020.3006832
Li, M. J. (2016). Analysis and operation control of large-scale UHVAC/DC hybrid power grids. Power Grid Technol. 40 (4), 985–991. doi:10.13335/j.1000-3673.pst.2016.04.001
Li, L. F., Wang, G. T., Chen, Y. X., You, G. Z., Huang, Y., and Xu, Z. (2025). Optimal allocation of universal static synchronous machines for the new-type power system. J. Electr. Power Syst. Autom. doi:10.19635/j.cnki.csu-epsa.001362
Li, C., Wei, H., He, P., Gao, J., and Zhang, Q. (2025a). Frequency consensus control strategy for multi-terminal HVDC transmission system based on disturbance degree. Int. J. Electr. Power and Energy Syst. 170, 110952. doi:10.1016/j.ijepes.2025.110952
Li, J., Huang, Y., Dou, X., Wang, S., and Chu, T. (2025b). Optimal energy storage configuration for primary frequency regulation performance considering state of charge partitioning. IEEE Trans. Sustain. Energy 16 (4), 2659–2668. doi:10.1109/tste.2025.3561286
Liu, L., Li, W., Ba, Y., Shen, J., Jin, C., and Wen, K. (2020). An analytical model for frequency nadir prediction following a major disturbance. IEEE Trans. Power Syst. 35, 2527–2536. doi:10.1109/tpwrs.2019.2963706
Mejia-Ruiz, G. E., Arrieta Paternina, M. R., Sevilla, F. R. S., and Korba, P. (2022). Fast hierarchical coordinated controller for distributed battery energy storage systems to mitigate voltage and frequency deviations. Appl. Energy 323, 119622. doi:10.1016/j.apenergy.2022.119622
Mejia-Ruiz, G. E., Arrieta Paternina, M. R., Ramirez-Gonzalez, M., Sevilla, F. R. S., and Korba, P. (2023). Real-time co-simulation of transmission and distribution networks integrated with distributed energy resources for frequency and voltage support. Appl. Energy 347, 121046. doi:10.1016/j.apenergy.2023.121046
Mejia-Ruiz, G. E., Arrieta Paternina, M. R., Qu, Z., Ahmed, S., and Konstantinou, C. (2025). Multiple ancillary services provision by optimal control of aggregated inverter-based resources. Int. J. Electr. Power and Energy Syst. 171, 110953. doi:10.1016/j.ijepes.2025.110953
Wang, W. Y., Li, Y., Cao, Y. J., Häger, U., and Rehtanz, C. (2018). Adaptive droop control of VSC-MTDC system for frequency support and power sharing. IEEE Trans. Power Syst. 33, 1264–1274. doi:10.1109/tpwrs.2017.2719002
Wang, Y. Z., Qiu, F. L., Lei, M., Ji, Y. R., and Wang, C. S. (2023). Research on frequency support strategy for flexible DC back-to-back interconnection system with large-scale renewable energy access. Power Grid Technol. 47 (3), 959–968. doi:10.13335/j.1000-3673.pst.2022.0619
Wen, Y. F., Yang, W. F., and Lin, X. H. (2020). Review and prospect on frequency stability analysis and control in low-inertia power systems. Electr. Power Autom. Equip. 40 (9), 211–222. doi:10.16081/j.epae.202009043
Xie, H. F., Su, Y. S., Xu, S., et al. (2024). Controller Design and Application Based VSC for Frequency Synchronous Operation of Asynchronous Grid of China Southern Power Grid. Southern Power Grid Technology, 1–8. doi:10.13648/j.cnki.issn1674-0629.2024.07.010
Xiong, Y., Zhang, H., Zhao, Y., Wang, X., Wang, L., Fang, J., et al. (2021). Two-level combined control scheme of VSC-MTDC integrated offshore wind farms for onshore system frequency support. IEEE Trans. Power Syst. 36, 781–792. doi:10.1109/tpwrs.2020.2998579
Yang, S. H., Meng, Q. R., Zhang, Y. B., Hao, Z. G., and He, J. (2022). Online prediction model for power system frequency nadir based on polynomial fitting of power-frequency characteristics. Proc. CSEE 42 (S1), 115–125. doi:10.13334/j.0258-8013.pcsee.221809
Yuan, Q. Y. (2005). Present situation and application prospect of UHVDC transmission technology in China. Power Grid Technol. 29 (14), 1–3.
Keywords: active frequency support, adaptive adjustment control, modular multilevel converter (MMC), virtual inertia, virtual damping coefficient
Citation: Tian B, Li J, Zhai H and Zhang Y (2025) Adaptive active frequency support strategy for receiving-end MMC-HVDC stations based on rate of change of frequency. Front. Electron. 6:1672188. doi: 10.3389/felec.2025.1672188
Received: 24 July 2025; Accepted: 31 October 2025;
Published: 17 November 2025.
Edited by:
Rivu Midya, Texas A&M University Department of Electrical and Computer Engineering, United StatesCopyright © 2025 Tian, Li, Zhai and Zhang. This is an open-access article distributed under the terms of the Creative Commons Attribution License (CC BY). The use, distribution or reproduction in other forums is permitted, provided the original author(s) and the copyright owner(s) are credited and that the original publication in this journal is cited, in accordance with accepted academic practice. No use, distribution or reproduction is permitted which does not comply with these terms.
*Correspondence: Baoye Tian, emhoX2NzcGdAMTYzLmNvbQ==