 Yi Luo1
 Yanyi Wang
 Zijie Mei
 Xuandong Liu
- 1Qujing Power Supply Bureau of Yunnan Power Grid Co., Ltd., Qujing, China
- 2State Key Laboratory of Electrical Insulation and Power Equipment, School of Electrical Engineering, Xi’an Jiaotong University, Xi’an, China
Glass suspension insulators in power transmission lines are vulnerable to surface contamination over time, especially in harsh environments like metallurgical plants. Analysis of such contamination revealed significant metal deposits, primarily iron particles sized between 2 μm and 20 μm. To study the impact of this metallic contamination on flashover behavior, researchers created artificial pollution using NaCl, diatomaceous earth, and iron powder. Leakage current tests demonstrated that metal content fundamentally alters the current waveform, causing it to exhibit AC superimposed impulses. Key findings include: metal lowers the voltage threshold for impulse inception, shortens the impulse rise and fall times, and increases critical impulse parameters (frequency, maximum amplitude, and discharge magnitude) as the metal proportion rises. Furthermore, a ResNet18-SA deep learning model was developed, integrating a self-attention mechanism. This architecture demonstrates exceptional robustness in interpreting pulsed current signals while accurately classifying levels of metallic contamination, providing a reliable and automated solution for insulator condition assessment.
1 Introduction
With the continuous development of power system, the scale of power transmission has been steadily expanding, and transmission lines are increasingly exposed to complex environmental conditions (Elsied et al., 2016; Su et al., 2010; Ilomuanya et al., 2022). In such a system, the operational safety of various power equipment plays a critical role in ensuring the overall reliability and stability of the grid. As essential components of the power system, insulators are widely deployed and are similarly subjected to harsh environmental conditions. Line insulators, being exposed outdoors over extended periods, are prone to surface contamination accumulation, which may lead to pollution flashover events, thereby posing a serious threat to the safe operation of the power grid (Maraaba et al., 2022; Jiang et al., 2020). Consequently, a thorough understanding and accurate assessment of insulator contamination characteristics are vital for ensuring the safe and reliable operation of the power system.
The composition of surface contamination is a critical factor influencing the pollution flashover voltage of insulators, while the operational environment significantly determines the nature of such contamination (Li et al., 2025; He et al., 2019). Existing studies indicate that the contaminants on the external insulation surfaces of power system components are complex in composition, with sodium chloride (NaCl) and calcium sulfate (CaSO4) being the predominant constituents. In coastal regions, NaCl tends to dominate, whereas in inland areas, CaSO4 is more prevalent (Ramos et al., 1993). Beyond natural environments, special operational settings can also alter the chemical makeup of insulator contamination (Zhang et al., 2022; Salem et al., 2022b; Feng et al., 2019). For instance (Sopelsa Neto et al., 2022), pointed out that pollution increases the surface conductivity of insulators, thereby raising the likelihood of partial discharges and dry band arcing, which can have a significant impact on the power system. This issue is particularly critical for insulators located near industrial, mining, and coastal areas, where pollution is more likely to accumulate on the insulator surface. Dolník et al. (2023) investigated the dielectric loss factor and leakage current of glass insulators under various pollution and humidity conditions. They found that the leakage current is highly dependent on the variation of the applied voltage and is very sensitive to changes in both relative humidity and the level of pollution. In artificial AC pollution tests (Ramos et al., 1993), observed that the flashover voltage of contaminated insulators decreased with increasing equivalent salt deposit density (ESDD). Baker et al. (1988) further found that the impact of insoluble contaminants on DC flashover voltage was greater than that under AC conditions, due to differing electrostatic adsorption effects on insoluble particles under DC fields. In certain regions of China, favorable geological conditions and abundant mineral resources support a well-developed metallurgical industry, resulting in atmospheric dust with a high metal content. When suspension insulators accumulate contamination with a high proportion of metallic components, these metal particles can significantly affect the insulation performance (Li et al., 2020; Liu et al., 2016; Zhang et al., 2014) reported that the presence of aluminum and iron elements among the insoluble metallic contaminants notably reduces the pollution flashover voltage of insulators.
At present, the degree of insulator contamination can be characterized using several representative indicators. The 33rd CIGRÉ Committee proposed various methods for evaluating insulator pollution severity, including the Equivalent Salt Deposit Density (ESDD) method, current pulse technique, surface conductivity method, leakage current method, and flashover voltage gradient method. Among these, the ESDD method is limited to measuring soluble contaminants, whereas the leakage current method is simple, practical, and provides a more comprehensive indication of surface pollution severity. Suda (2001) reported that surface contamination increases odd-order harmonics in the frequency domain. Salem et al. (2022a) extracted the time and frequency features of leakage current, calculated the curve slope and crest factor, and used them as evaluation indicators of insulator condition based on laboratory test results. Similarly Salem et al. (2022b), also assessed the physical condition of transmission line insulators by monitoring the characteristics of leakage current and voltage. In their experiments, they employed six criteria: the peak value of the leakage current, phase shift, signal slope, crest factor, harmonic distribution, and harmonic ratio. They concluded that the characteristics of leakage current are an effective technique for predicting the physical condition of in-service insulators.
In recent years, the integration of deep learning and non-invasive sensing technologies has opened new avenues for insulator condition monitoring. Thanh and Cho (2023) proposed a hybrid CNN-LSTM model that utilizes weather parameters to classify insulator leakage current levels online, demonstrating the excellent performance of deep learning in processing time-series monitoring data. In another study (Thanh and Cho, 2022), employed a Bidirectional Gated Recurrent Unit (Bi-GRU) to perform multi-class classification of leakage current in 15 kV HDPE insulators, significantly improving model accuracy through hyperparameter optimization, further confirming the effectiveness of recurrent neural networks in time-series prediction of leakage current. Meanwhile, important progress has been made in non-contact detection methods (Lutfi et al., 2024). innovatively combined ultrasonic sensors with 1D-CNN to achieve high-precision classification of various defects in ceramic insulators, such as internal puncture, surface discharge, and contamination, and validated the feasibility of this method in a real substation environment, providing a new approach for non-contact and non-power-outage insulator diagnosis. In terms of contamination impact mechanisms (Salem et al., 2023), systematically experimentally analyzed the influence of different contamination distribution scenarios on the flashover voltage of 11 kV ceramic insulators and established an Artificial Neural Network (ANN)-based prediction model for flashover voltage, revealing the intrinsic relationship between contamination spatial distribution and insulation performance, thus providing a theoretical basis for understanding insulator failure mechanisms under complex contamination conditions. Corso et al. (2023) focused on the assessment of visible contaminants, systematically comparing the performance of mainstream convolutional neural networks like VGG, ResNet, and DenseNet in classifying visible contamination levels of pin-type distribution insulators. They found that the ResNet-50 model achieved the best classification performance (99.242% accuracy) on an imbalanced dataset, providing a reliable solution for image recognition-based monitoring of insulator contamination status.
Despite extensive research on insulator contamination, studies focusing on the contamination composition and leakage current characteristics of insulators in metallurgical and mineral-rich regions remain limited. To address this gap, the present study investigates the contamination characteristics of insulators operating in such environments. The analysis identified iron powder with a particle size of 10 μm as a representative metal contaminant. Based on these findings, iron powder was incorporated into conventional artificial contamination to create a metal-rich artificial pollution mixture. A leakage current measurement platform was constructed to study the behavior of glass insulators under high metal-content contamination. The waveform characteristics of the resulting leakage current and the influence of metallic contamination on its parameters were systematically analyzed. A neural network model was established to identify and analyze the degree of metal contamination of insulators. The results provide valuable insights for monitoring metal contamination on insulator surfaces and assessing their insulation performance.
2 Analysis of insulator contaminant components
2.1 Insulator sample
To clarify the contamination composition on the surface of glass insulators in miner-al and metallurgical environments, field sampling was conducted in regions with concentrated mineral resources and metallurgical industries. Two glass insulator samples were collected: one from a 220 kV jumper string and another from a 220 kV suspension string, both operating in long-term metallurgical environments. Detailed information on the sampling conditions is provided in Table 1.
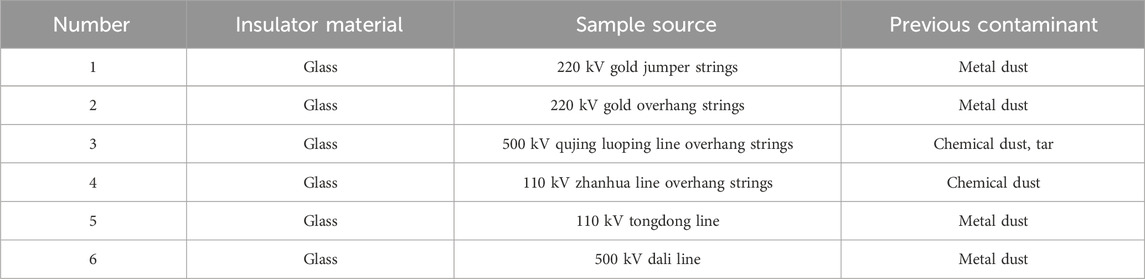
Table 1. Insulator sample information.
Macroscopic inspection of insulator samples, preliminary observation of long-term work in the target environment insulator contaminant appearance color, shape and distribution location and other characteristics, for subsequent confirmation of the specific component of the contaminant to provide a basis for judgment, and to determine the artificial contaminant spraying method to provide reference. Macroscopic examination of two insulator samples from different working environments, the appearance of the samples is shown in Figure 1.
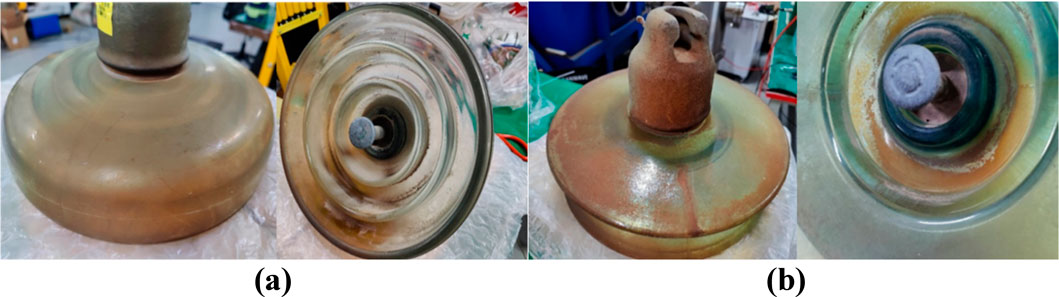
Figure 1. Picture of insulator samples. (a) Insulator sample #1. (b) Insulator sample #2.
According to Figure 1., there are significant color changes and contaminant accumulation on the surface of the two glass insulator samples. Combined with other parts of the color change can be seen, insulator samples are exposed to the external environment, and the actual work for a long time, there is a certain amount of contaminant accumulation phenomenon on the surface of the samples, but the contaminant is not uniformly distributed in the sample location, the distribution of the insulator samples on the upper and lower surfaces of the distribution of certain differences. On the upper surface of the insulator, the distribution of contaminant is more uniform, and the overall number is less. On the lower surface of the insulator, the contaminant is concentrated in the grooves on the lower surface of the insulator, and the total amount of contaminant and the unevenness of distribution on the lower surface of the insulator are greater than that on the upper surface of the insulator.
2.2 Microscopic morphology of contaminant particles
Considering the observed differences in contamination distribution, particle morphology, and the degree of pollutant accumulation on the two insulator samples, sampling was performed at multiple locations on each insulator to comprehensively and accurately characterize the surface contamination. The sampling details are summarized in Table 2.
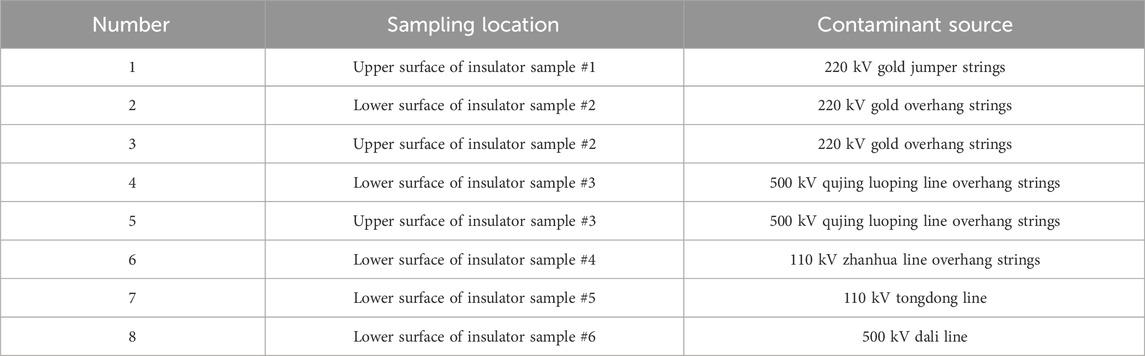
Table 2. Contaminant sample information.
Scanning electron microscope was used to photograph the contaminant samples, to characterize the microscopic morphology of three contaminant samples, to observe the contaminant arrangement of different contaminant samples, and to measure the parameters such as the shape of the contaminant particles and the size of the contaminant particles of different contaminant samples. The results of Sample #1∼ Sample #3 scanning electron microscopy are shown in Figure 2.
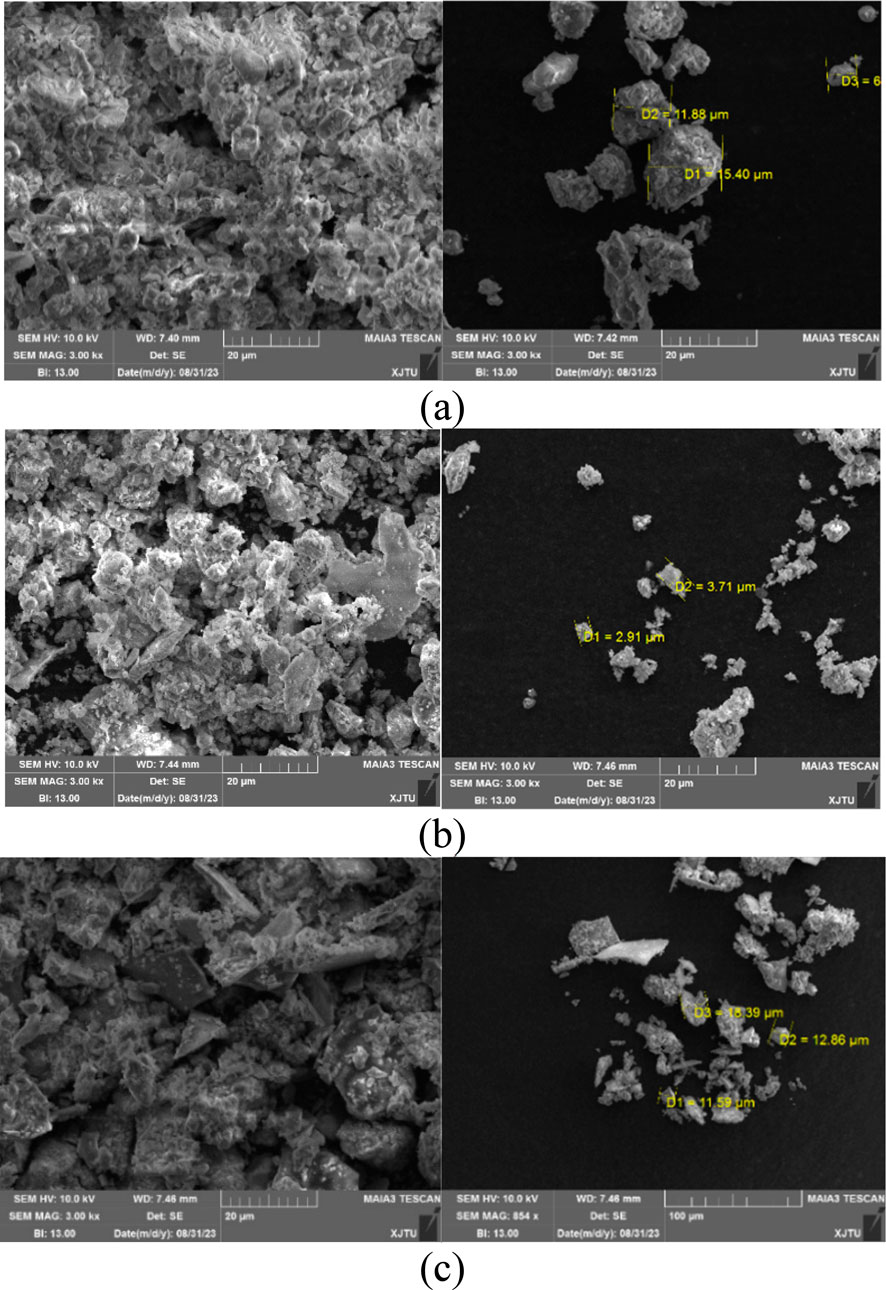
Figure 2. Microscopic morphology and particle size measurement results of contaminant. (a) Sample #1. (b) Sample #2. (c) Sample #3.
Based on the measurement results, the particle diameter of the contamination samples was found to range from a minimum of no less than 2 μm to a maximum of no more than 20 μm. These measurements accurately reflect the particle size characteristics of surface contaminants on insulators in metallurgical environments. The findings provide a reliable reference for the design of particulate matter in artificial pollution simulations, thereby enhancing the realism and representativeness of subsequent laboratory experiments.
2.3 Contaminant component analysis
In order to clarify the component of the contaminant samples, the X-ray spectrometer was used to analyze the component of the contaminant samples. Combined with the insulator samples and contaminant samples of the working environment information, we determine the type of elements that may be contained in the contaminant samples. Respectively, the relative content of the elements of the contaminant samples were analyzed, and the elemental component of the contaminant samples is shown in Table 3. It can be seen that the elemental component and elemental percentage of the three insulator contaminant samples have their own characteristics and are different from each other.
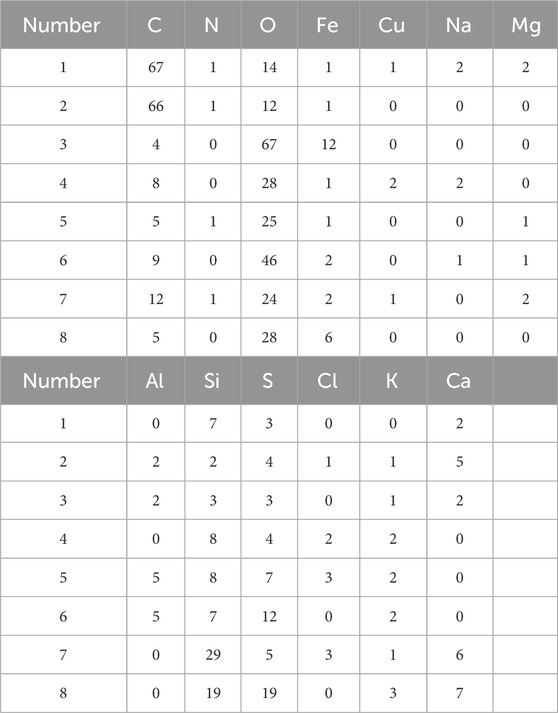
Table 3. Contaminant sample information.
As shown in Table 3., although the elemental composition and relative proportions vary among the three insulator contamination samples, metallic elements were consistently detected in all eight analyzed subsamples, with the total metallic content exceeding 1% in each case. This indicates a widespread accumulation of metallic contaminants on insulator surfaces within the target environment. Among the detected metallic elements, iron (Fe) exhibited a relatively high proportion, identifying it as a representative metal species in this context. These measurement and analysis results provide critical guidance for selecting both the type and proportion of metallic components in the preparation of artificial pollution. Accordingly, this study adopts iron (Fe) as a typical metallic contaminant to investigate the general mechanisms by which metallic constituents influence leakage current characteristics.
3 Influence of metal contamination on the leakage current
3.1 Experimental platform
The experimental platform consists of a test transformer, an acrylic tank, a humidifier, a current transformer, and an oscilloscope. A schematic diagram of the setup is shown in Figure 3. The test transformer used is the YDTW-900/180 model, with a rated capacity of 900 kVA, a rated input voltage of 10 kV, and a rated output voltage of 180 kV. The current transformer is the CP503B high-frequency AC/DC current probe from Meco, featuring a measurement range of 0–5 A, a resolution of 1 mA, and an output sensitivity of 1 V/A.
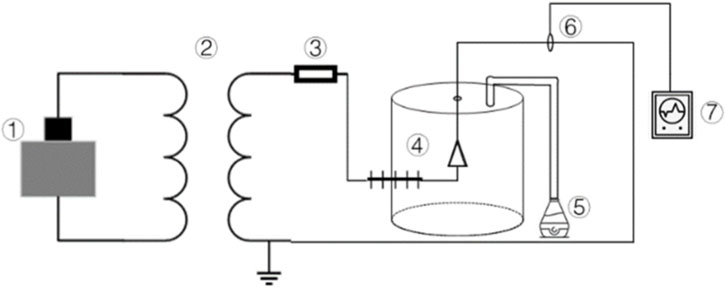
Figure 3. Schematic diagram of leakage current measurement test platform ① voltage regulator ②test transformer ③ protection resistor ④ acrylic can ⑤ humidifier ⑥ current transformer ⑦ oscilloscope.
The acrylic tank used in the experiment has a height of 1.2 m and a diameter of 0.9 m. A humidifier introduces micron-scale water droplets into the tank through an opening at the top, simulating moisture exposure under saturated humidity conditions.
During the experiment, according to the experimental method in (Wang et al., 2019), an isosceles triangular glass plate was used in place of an actual insulator. Since glass insulators possess an axisymmetric structure, each individual shed unit closely approximates a fan-shaped cross-section distributed along the central axis. The apex of the triangular glass plate exhibits analogous edge effect characteristics in its electric field distribution to those observed in a single shed unit of the insulator. The glass plate has a height of 45 cm, a base length of 30 cm, and a thickness of 8 mm. Conductive tape was applied to both the apex and the base of the triangle to facilitate voltage application at both ends. The prepared triangular glass plate specimen, after the application of artificial contamination, is shown in Figure 4.
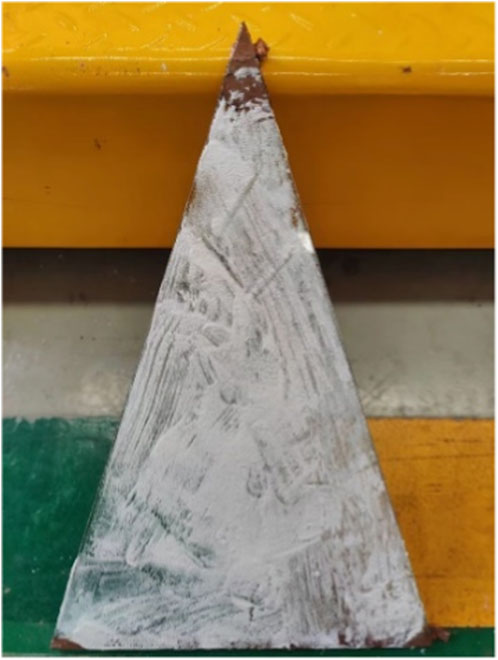
Figure 4. Glass plate sample with artificial contamination.
The dark yellow metallic strips at the top and bottom of the glass plate are conductive tapes. The procedures for contamination application and leakage current measurement are as follows:
1. Pre-treatment: Before the experiment, the glass plate specimens were cleaned with distilled water and dried. Conductive tape was then applied to the top and bottom edges of the plates.
2. Contamination preparation: The artificial contamination consisted of both soluble and insoluble components. The soluble component was composed solely of sodium chloride (NaCl), while the insoluble component included diatomite and iron powder. The contamination density and metal content ratio were adjusted according to experimental requirements.
3. Contamination application: NaCl, diatomite, and iron powder with a particle size of 10 μm were weighed according to the experimental design. The area of the glass plate was 675 cm2, and the non-soluble deposit density (NSDD) was maintained at 5 mg/cm2 for all specimens, while the equivalent salt deposit density (ESDD) was set to 0.05 mg/cm2. The iron powder proportion was varied at 10%, 20%, 30%, 40%, 50%, and 60%. The weight configuration of various substances is shown in Table 4. After dissolving and stirring, the mixture was applied uniformly to the surface of the glass plate and air-dried for 24 h to form a stable dry contamination layer.
4. Humidification and moisture conditioning: The contaminated glass plates were placed inside the acrylic tank. The humidifier was then activated to raise the internal humidity to a saturated state, after which the specimens were left in the tank to absorb moisture for 15 min.
5. Voltage application and measurement: A stepwise voltage increase method was employed, with the voltage gradually raised to the target value and held for 1 min. Leakage current was then measured and recorded.
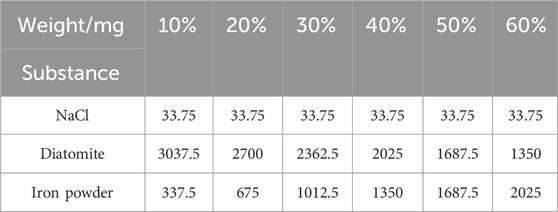
Table 4. Artificial contamination weight Configuration.
3.2 Experimental platform
To investigate the waveform characteristics of leakage current on insulator surfaces contaminated with metallic pollutants, experiments were conducted by varying the proportion of iron powder within the insoluble contamination. Leakage current waveforms were measured and recorded for each condition. Throughout the experiments, the non-soluble deposit density (NSDD) was maintained at 5 mg/cm2, and the equivalent salt deposit density (ESDD) was kept constant at 0.05 mg/cm2. The insoluble contamination was composed of a mixture of diatomite and iron powder.
The presence of metallic contamination lowers the inception voltage at which high-frequency pulses appear in the leakage current waveform. As shown in Figure 5, when no metallic components are present in the contamination, the leakage current exhibits a purely sinusoidal waveform with no superimposed high-frequency pulses. In contrast, when the contamination contains metal, the leakage current at the same applied voltage shows distortion in the AC component and the appearance of high-frequency pulses superimposed on the waveform near the AC voltage peaks.
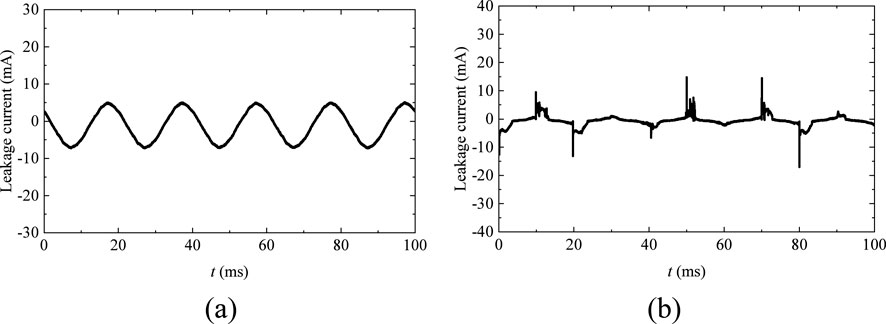
Figure 5. Waveforms of leakage current with different metal ratios. (a) Contamination without metallic components. (b) Contamination with metallic components.
Under conventional contamination conditions without metallic particles, the generation of high-frequency pulse currents is typically associated with the development of localized surface arcing. In such cases, the time-domain leakage current exhibits a standard power-frequency periodic pattern, and high-frequency components induced by arc activity are observed only when the electric field intensity approaches the critical breakdown threshold. However, the introduction of metallic particles significantly alters the surface electric field distribution of the insulator. Localized field distortions caused by the metallic particles promote partial discharge activity even under sub-critical field conditions, leading to premature initiation of micro-discharges.
In addition, the presence of metallic contamination reduces the rise time and fall time of the pulse waveform. As shown in Figure 6, the contamination without metallic content results in a pulse with a rise time of 1.49 μs, a fall time of 2.68 ms, and a clear plateau period, during which the leakage current remains relatively stable at a low level. The full width at half maximum (FWHM) of the pulse is 33.62 μs. When the contamination contains metal, all characteristic pulse parameters decrease: the rise time is shortened to 0.86 μs, the fall time to 27.36 μs, and the FWHM to 9.06 μs.
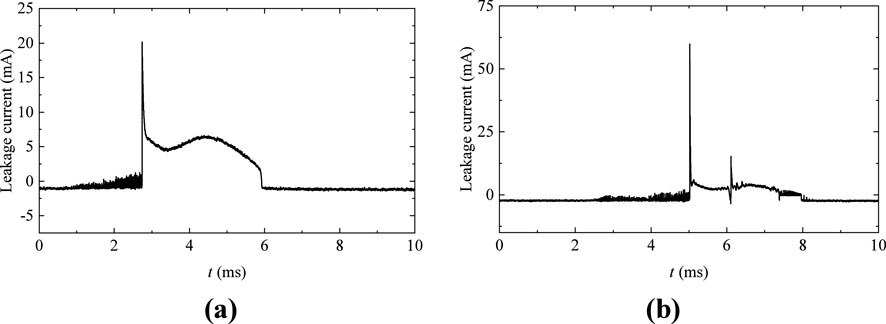
Figure 6. Single-pulse waveforms of leakage current with different metal ratios. (a) Contamination without metallic components. (b) Contamination with metallic components.
The typical surface leakage current waveform of the glass plate specimen is shown in Figure 7. As illustrated in the figure, when the contamination contains a high proportion of metallic components, the leakage current waveform under AC voltage consists of a superposition of an AC component and high-frequency pulse components.
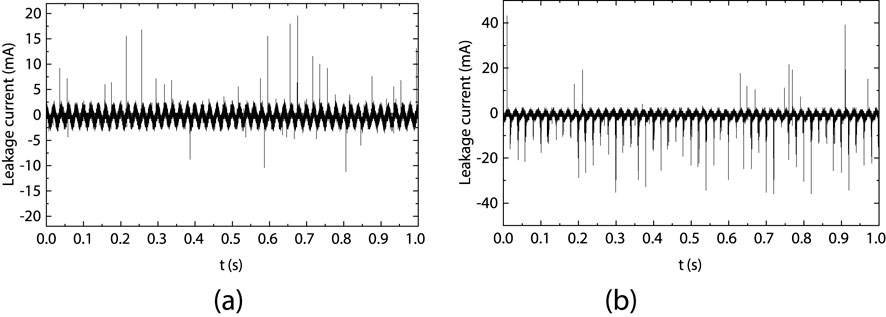
Figure 7. Typical leakage current waveforms with metal contamination at U = 10 kV. (a) Contamination with 20% metallic content. (b) Contamination with 50% metallic components.
As the applied voltage increases, both the AC and pulse components of the leakage current vary accordingly. Among them, the AC component exhibits relatively minor changes, while the pulse component shows more significant variation. Notably, the leakage current characteristics differ when the glass plate specimens are coated with contamination containing different proportions of metallic content.
These observations suggest the feasibility of inferring the proportion of metallic contamination based on leakage current monitoring. In this context, the pulse component of the leakage current emerges as a key feature for estimating the metallic content within the contamination layer. The detailed procedure for pulse identification is as follows:
1. Signal filtering: The data is first read and initialized. A fourth-order Butterworth high-pass filter with a cutoff frequency of 200 kHz is applied to perform zero-phase filtering, thereby preserving the high-frequency components of the leakage current signal.
2. Pulse peak extraction: Local extrema of the filtered current signal are identified using the findpeaks function in MATLAB, detecting both positive and negative peak amplitudes. A threshold is established as the mean ±5 times the standard deviation of the filtered signal. Pulses with amplitudes below this threshold are discarded, while valid pulse positions are retained for further analysis.
3. Pulse parameter calculation: The width of each positive pulse is determined by identifying the time points on either side of the peak where the amplitude drops to 10% of the peak value. A similar approach is applied to calculate the width of negative pulses based on their trough values. The total number of pulses, as well as the amplitudes of both positive and negative pulses, are then statistically analyzed. By combining pulse amplitude and pulse width, the total discharge quantity on the insulator surface can be estimated.
3.3 Influence of metal contamination on the leakage current pulses
3.3.1 The number of leakage current pulses
Experiments were conducted using glass plate specimens coated with surface contamination containing varying proportions of metallic components. The pulse components within the leakage current were analyzed accordingly. By sampling and detecting both positive and negative polarity current pulses, the total number of leakage current pulses within a fixed time interval was statistically determined.
The variation in the number of leakage current pulses within one second, as a function of both applied voltage and the proportion of metallic content in the contamination, is illustrated in Figure 8.
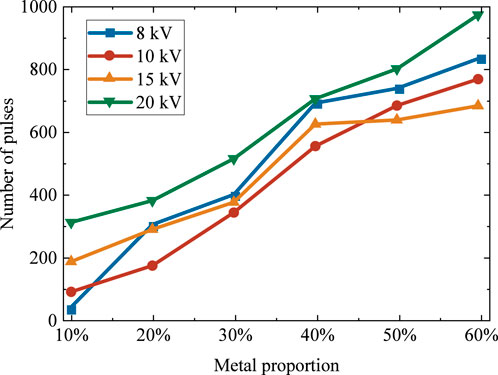
Figure 8. Influence of metal contamination on the number of impulses in leakage currents.
As shown in Figure 8, when the surface of the glass plate specimen is coated with contamination containing a high proportion of metallic particles, a noticeable number of current pulses appear in the leakage current under different levels of applied AC voltage. The total number of pulses increases with the rising proportion of metallic content in the contamination. Under the same applied voltage, the total number of pulses generally increases as the metal content increases. However, the rate of increase in pulse count with respect to metallic content varies under different voltage levels. Moreover, for a fixed proportion of metallic contamination, the number of leakage current pulses does not exhibit a clear or consistent trend with increasing voltage.
Therefore, it can be concluded that the proportion of metallic contamination has a significant and consistent influence on the total number of leakage current pulses within a one-second interval, whereas the applied voltage has a comparatively less pronounced effect on this parameter.
3.3.2 Leakage current pulse amplitude
An alternating voltage was applied to glass plate specimens coated with contamination containing varying proportions of metallic particles, and the variation of leakage current peak amplitudes was statistically analyzed. Figure 9 shows the changes in the maximum positive pulse amplitude within one second as a function of applied voltage and metallic content in the contamination. As illustrated in Figure 9, when the contamination on the glass plate surface contains metallic components, the maximum leakage current amplitude increases with the rising metal proportion under different AC voltage levels.
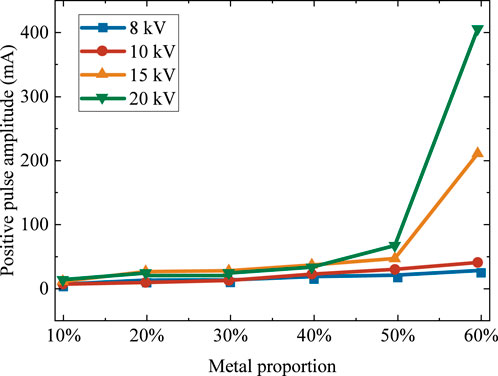
Figure 9. Influence of metal contamination on t positive pulse amplitude.
Comparing measurements under different voltages reveals that when the metallic proportion is low, the positive pulse amplitude varies little across voltage levels. However, when the metallic content is high, the positive pulse amplitude exhibits significant variation with applied voltage. These results indicate that the influence of voltage on the positive pulse amplitude becomes more pronounced as the metallic proportion in the contamination increases.
Furthermore, when the metallic proportion in the contamination is high, the positive pulse amplitude of the glass plate specimen exhibits a sharp increase under higher applied voltage levels, which may indicate a transition in the discharge mode. This phenomenon highlights the significant influence of metallic contaminants on the leakage current characteristics and the discharge process.
The variation of the maximum negative pulse amplitude within one second as a function of applied voltage and metal content is shown in Figure 10.
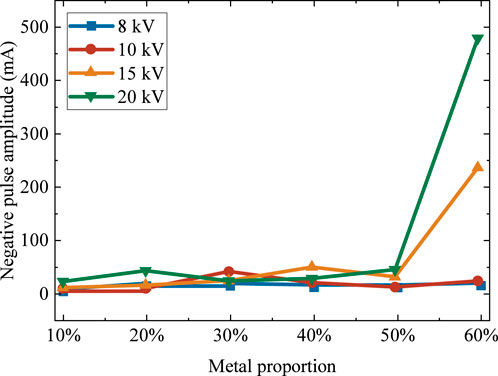
Figure 10. Influence of metal contamination on the negative pulse amplitude.
As shown in Figure 10, when the glass plate specimen surface is coated with contamination containing metallic components, the amplitude of negative polarity pulses in the leakage current varies with both the metal content in the contamination and the applied AC voltage level. However, except for cases where the contamination contains an exceptionally high proportion of metallic particles and is subjected to high voltage amplitudes, no clear or consistent trend is observed in the variation of negative pulse amplitude with respect to metal proportion and voltage. In conditions of high metallic contamination, the negative pulse amplitude increases significantly with rising voltage.
Taken together, these results indicate that the peak values of leakage current pulses can serve as valuable indicators for monitoring the contamination composition and insulation condition of insulator surfaces. In particular, the consistent relationship between the positive pulse amplitude within one second and both the metal content and applied voltage is of significant importance for the effective monitoring of insulator contamination and insulation performance.
3.3.3 Pulse charges
By identifying and analyzing the pulse signals within the leakage current, the average pulse amplitude and average pulse duration over a specified time interval can be quantified. Combining these two parameters enables the calculation of the pulse discharge quantity on the insulator surface, which serves as a crucial indicator for monitoring the discharge activity on insulator surfaces.
Figure 11 illustrates the variation of the leakage current pulse discharge quantity within one second as a function of applied voltage and the metallic content in the contamination.
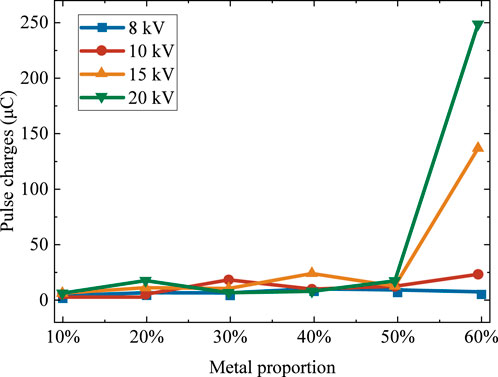
Figure 11. Influence of metal contamination on the impulse discharge of insulators.
As shown in Figure 11, under the same applied voltage, the pulse discharge quantity on the surface of the insulator within one second generally increases with the rise in metallic content in the contamination.
Comparing the relationship between metallic proportion and discharge quantity under different voltage levels reveals that this relationship varies with voltage magnitude. At lower applied voltages, the discharge quantity increases gradually with metallic content and does not exhibit any sharp rise. In contrast, at higher voltages, the discharge quantity increases sharply as the metallic proportion increases.
Moreover, the extent to which pulse discharge quantity varies with voltage also depends on the metallic content in the contamination. When the metallic content is low, the variation in discharge quantity with increasing voltage is relatively minor. For instance, at a metallic proportion of 30%, the discharge quantity increases only slightly from 3.9 μC to 4.3 μC as the voltage increases from 8 kV to 20 kV. However, when the metallic content reaches 60%, the same voltage increase results in a dramatic rise in discharge quantity—from 5.0 μC to 248.5 μC. These results indicate that the proportion of metallic contaminants significantly affects the surface insulation performance of insulators. When the metallic content exceeds a certain threshold, the surface insulation condition can be severely compromised.
The study of pulse discharge quantity on the insulator surface shows that this parameter provides an intuitive and quantifiable reflection of discharge activity and insulation integrity. In the context of online leakage current monitoring, tracking changes in pulse discharge quantity can be an effective means to assess the surface insulation status. When the insulation remains intact and only minor discharge activity is observed, the metallic content in surface contamination may be inferred by combining pulse discharge quantity, pulse count, and current extrema as diagnostic indicators.
3.4 Influence of metal contamination on RMS value of leakage current
The RMS value of the leakage current is one of the key parameters monitored during leakage current analysis, as it serves as an important indicator of the surface conductivity of the insulator contamination layer. To evaluate the influence of metallic contamination on the RMS value of leakage current, the measured current signals were filtered, and their effective values were subsequently calculated. The root mean square (RMS) value of the leakage current is calculated using Equation 1.
where N is the number of sampling points, and Ii is the leakage current, in amperes (A).
In this experiment, the equivalent salt deposit density (ESDD) was set at 0.05 mg/cm2, and the non-soluble deposit density (NSDD) was maintained at 5 mg/cm2. The relationship between the proportion of metallic content in the contamination and the RMS value of the leakage current is shown in Figure 12.
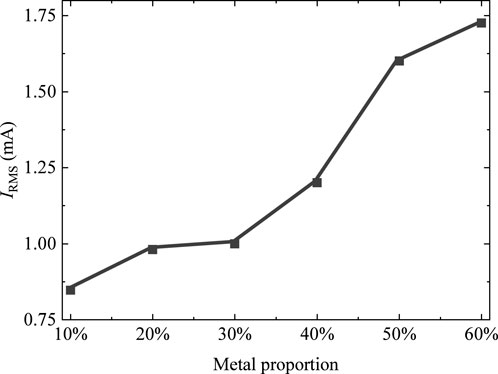
Figure 12. Effect of metal contamination on the RMS value of leakage current.
As shown in Figure 12, under fixed soluble and non-soluble contamination densities, the RMS value of the leakage current on the surface of the glass plate specimen increases nonlinearly with the proportion of metallic components in the contamination.
Conventional analyses of insulator surface contamination suggest that soluble pollutants, such as salts, have a dominant effect on the surface insulation condition and leakage current, primarily due to their high conductivity when moistened. In contrast, non-soluble contaminants mainly influence the leakage current indirectly by affecting the moisture retention of the pollution layer through their hygroscopic properties. To compare the effects of metallic and salt-based soluble contamination on surface insulation performance, leakage current measurements were conducted under the same conditions using contamination composed solely of salt-based soluble components. The results are presented in Figure 13.
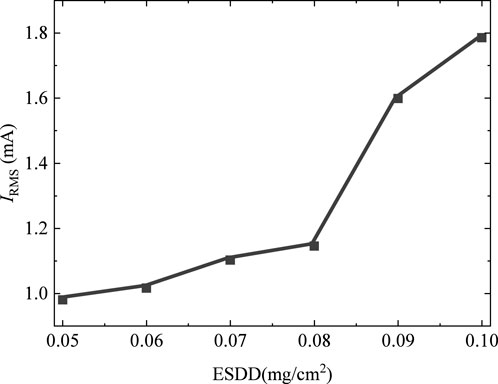
Figure 13. Effect of EDSS on the RMS value of leakage current.
As the equivalent salt deposit density (ESDD) increases, the RMS value of the leakage current on the insulator surface also increases, with a trend and magnitude comparable to those observed with increasing metallic content in the contamination. Although metallic contamination is categorized as non-soluble, its effect on surface insulation differs from that of conventional non-soluble pollutants. As shown in earlier results, metallic components within the non-soluble fraction can significantly influence both surface insulation conditions and leakage current behavior. Unlike typical non-soluble contaminants that affect insulation performance indirectly through moisture retention, metallic particles can directly alter the surface conductivity—similar to the behavior of soluble salts.
Both increased ESDD and rising metallic content lead to higher leakage current RMS values. Consequently, RMS-based single-parameter monitoring is insufficient to distinguish the influence of metallic contamination, and may result in substantial misinterpretation. However, under elevated voltage conditions, metallic particles cause localized electric field distortions, which intensify the field strength and induce partial discharges at lower onset voltages. These discharges are manifested in the leakage current waveforms as high-repetition-rate pulse components. As demonstrated in previous analyses, these pulses appear at lower inception voltages compared to non-metallic contamination, and exhibit distinctly steeper falling edges. Therefore, combined analysis of time- and frequency-domain features—such as pulse onset voltage, pulse repetition rate, and waveform steepness—offers a reliable approach to differentiate metallic pollution from conventional contamination.
4 Convolutional neural network identification of insulator metal con-tamination degree
Based on the collected leakage current pulse waveforms, the metallic contamination levels on insulators are categorized into three grades: light contamination (0%–20%), moderate contamination (20%–40%), and heavy contamination (40%–60%). To enable the assessment of metallic contamination levels through leakage current waveforms, a deep residual network model based on ResNet is constructed in this study. The overall framework of the identification method is shown in Figure 14. The neural network is constructed based on the ResNet-18 architecture. First, the original leakage current data was collected with a time window of 1 s to capture sufficient discharge impulses. These time-domain waveforms then underwent amplitude normalization to eliminate the influence of varying voltage levels. Subsequently, the original leakage current signal, first enters the initial convolutional layer (with 7 × 7 convolution kernels) for primary feature extraction, followed by a max pooling layer with a 3 × 3 pooling window, which reduces the feature map size by half while preserving significant features and improving computational efficiency. The core feature learning section is completed by 8 deep residual modules. Each module consists of two 3 × 3 convolutional layers and skip connections, effectively mitigating the gradient vanishing problem in deep networks and ensuring the integrity of signal features during multi-layer transmission. The specific structure of the residual modules is shown in Table 5. At the deep stage of the network, a channel self-attention mechanism is introduced, which adaptively recalibrates the weights of feature channels, enhancing sensitivity to key pulse features in the leakage current signal while suppressing irrelevant noise interference. After the final residual module, the spatial dimensions of the feature maps are compressed through a global average pooling layer. Finally, the learned high-level features are mapped to three contamination levels via a fully connected layer and a softmax classifier.
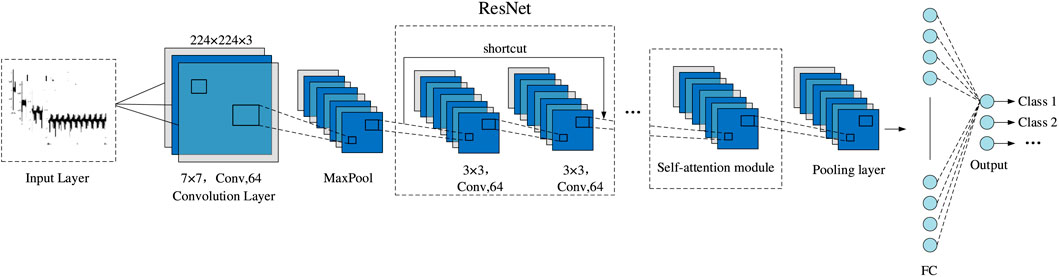
Figure 14. A metal contamination degree identification framework based on ResNet’s deep residual network model.
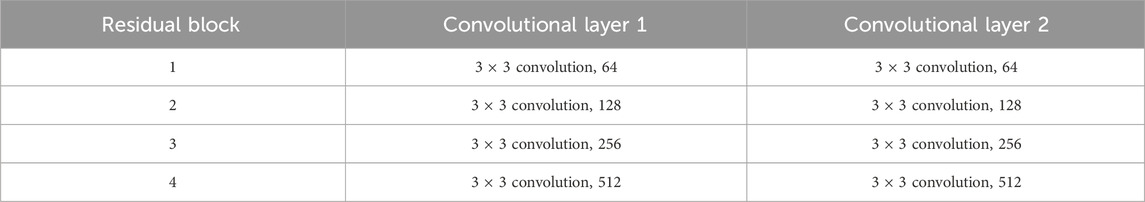
Table 5. Residual block parameter settings.
The learning rate of the ResNet18-SA model was set to 1 × 10⁻⁴, with a batch size of 8. A total of 480 leakage current waveform images were used as the dataset, which was split into training and validation sets in a 7:3 ratio. The training and validation accuracy and loss curves during the training process are shown in Figure 15. By the 1000th iteration, the model began to converge, achieving an accuracy of 96% on the validation set and reducing the loss to 0.1. Both the accuracy and loss curves gradually stabilized, indicating good training performance.
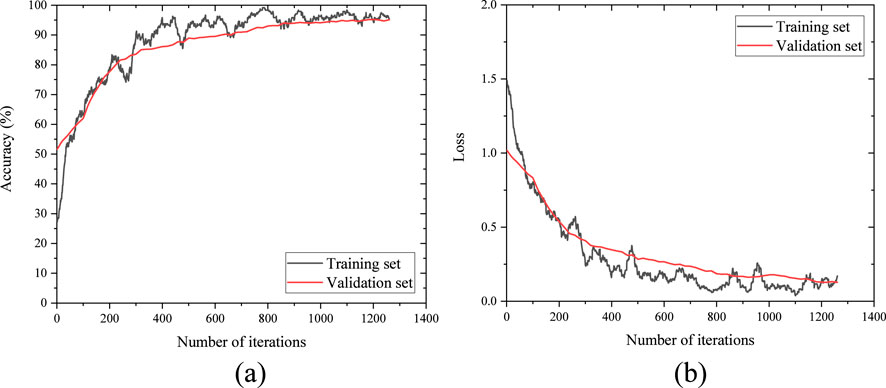
Figure 15. Accuracy rate versus loss value curve. (a) Accuracy rate. (b) Loss value.
To further validate the effectiveness of the trained model in determining the level of metallic contamination on glass insulators, the validation set was input into the trained model. The resulting confusion matrix is shown in Figure 16. In the figure, the blue regions along the diagonal represent correctly classified samples. It can be observed that the model is capable of accurately identifying all levels of metallic contamination.
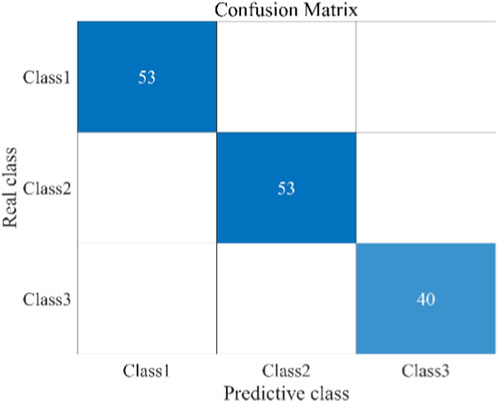
Figure 16. Confusion matrix.
In conventional convolutional neural networks (CNNs), increasing the network depth can lead to vanishing or exploding gradients during backpropagation, which adversely affects training performance and recognition accuracy. ResNet addresses this issue by introducing an innovative skip connection mechanism. This structure allows gradient information to bypass one or more layers during backpropagation, preventing degradation or amplification of the gradients during layer-wise transmission, thereby significantly enhancing the performance of deep models. Moreover, integrating a Self-Attention Module (SA) into CNN architectures can substantially improve the model’s sensitivity to short-time spectral features associated with high-frequency pulses in leakage current signals. It also effectively suppresses background noise, thereby improving the overall recognition performance of insulator leakage current characteristics.
In this study, we employed three different models: CNN-SA, ResNet18, and ResNet18-SA to classify leakage current waveforms of insulators under varying levels of metallic contamination. A comparative analysis of the recognition performance of the three networks is presented in Table 6.

Table 6. Contaminant sample information.
The results show that the CNN-SA model has a relatively fast training time but achieves lower accuracy (71.23%). The ResNet18 model provides a substantial improvement in accuracy (96.58%), though with a longer training duration. In the ResNet18 deep learning model, the model architecture exhibits a high degree of alignment with the physical characteristics of leakage current signals. Traditional CNN face issues like gradient vanishing or explosion as the network depth increases, which limits their ability to extract complex waveform features. ResNet18 effectively addresses this challenge in deep network training by introducing residual connections, which establish a fast path for gradient propagation. This significantly improves accuracy, demonstrating that the residual structure serves as a solid foundation for processing leakage current signals.
When the self-attention mechanism is integrated, the ResNet18-SA model experiences only a slight increase in training time, while its accuracy further improves to 100%. The incorporation of the self-attention mechanism enables the model to acquire a selective attention capability, allowing it to automatically focus on key high-frequency pulse regions in the waveform while suppressing background noise interference. This is precisely why ResNet18-SA achieves a further improvement in accuracy, reaching 100%. Therefore, through the synergistic effect of residual learning and the self-attention mechanism, where the former ensures stable extraction of deep features, and the latter enables focused discrimination of critical features. These findings indicate that the ResNet18-SA model is more suitable than traditional CNNs for detecting leakage current characteristics of insulators contaminated with metallic pollutants.
Although the ResNet18-SA model proposed in this study demonstrates high accuracy in identifying the metal contamination level of insulators, its focus remains primarily on the overall waveform characteristics of the leakage current caused by metallic pollutants. There is still room for improvement, as the model does not fully account for the complex temporal dynamic features within the leakage current signal or the influence of factors such as environmental interference. In contrast (Nguyen et al., 2024; Nguyen and Cho, 2025), took into comprehensive consideration both the leakage current pulse levels and the impact of external environmental parameters. They employed an improved particle swarm optimization algorithm for hyperparameter tuning, thereby ensuring optimal model performance. In future research, we plan to introduce advanced optimization algorithms such as genetic algorithms to automatically search for the optimal combination of hyperparameters (learning rate and number of network layers) ensuring the model converges to a superior performance state and enhancing the rigor and reproducibility of the study.
5 Conclusion
This study systematically investigated the impact of metallic contamination on the leakage current characteristics of insulators and developed a deep learning model for accurate condition assessment. The following conclusions were drawn:
1. Long-term operation in metallurgical and mining-intensive regions leads to significant metallic contamination on insulator surfaces, predominantly composed of iron particles ranging from 2 μm to 20 μm.
2. When metallic particles are present in the surface contamination, the leakage current waveforms exhibit both sinusoidal and pulse components. The presence of metallic contaminants reduces the inception voltage of discharge pulses and shortens both the rising and falling edges of the pulse waveform. A strong positive correlation exists between the metallic content and key pulse parameters (number, amplitude, discharge quantity), as well as the RMS value of the leakage current.
3. The ResNet18-SA model demonstrates superior accuracy and robustness. When classifying the degree of metal contamination, the accuracy rates of ResNet18-SA, ResNet18 and CNN-SA were 100%, 96.58% and 71.23% respectively. ResNet18-SA is the most effective approach for detecting leakage current characteristics of insulators under metallic contamination.
Data availability statement
The original contributions presented in the study are included in the article/supplementary material, further inquiries can be directed to the corresponding author.
Author contributions
YL: Conceptualization, Formal Analysis, Funding acquisition, Methodology, Visualization, Writing – original draft. JL: Conceptualization, Formal Analysis, Funding acquisition, Methodology, Visualization, Writing – original draft. YW: Investigation, Methodology, Supervision, Visualization, Writing – review and editing. ZM: Data curation, Writing – review and editing. XL: Project administration, Supervision, Writing – review and editing.
Funding
The authors declare that financial support was received for the research and/or publication of this article. This research was financially supported by project “Research on Pollution Monitoring and Risk Prevention and control Technology of High Proportion Metal Components: Pollution Meas-urement and Assessment of High Proportion Metal Components” (056200KK52222167).
Conflict of interest
Authors YL and JL were employed by Qujing Power Supply Bureau of Yunnan Power Grid Co., Ltd.
The remaining authors declare that the research was conducted in the absence of any commercial or financial relationships that could be construed as a potential conflict of interest.
Generative AI statement
The authors declare that no Generative AI was used in the creation of this manuscript.
Any alternative text (alt text) provided alongside figures in this article has been generated by Frontiers with the support of artificial intelligence and reasonable efforts have been made to ensure accuracy, including review by the authors wherever possible. If you identify any issues, please contact us.
Publisher’s note
All claims expressed in this article are solely those of the authors and do not necessarily represent those of their affiliated organizations, or those of the publisher, the editors and the reviewers. Any product that may be evaluated in this article, or claim that may be made by its manufacturer, is not guaranteed or endorsed by the publisher.
References
Baker, A. C., Zaffanella, L. E., Anzivino, L. D., Schneider, H., and Moran, J. (1988). Contamination performance of HVDC station post insulators. IEEE Trans. Power Deliv. 3 1968–1975. doi:10.1109/61.194007
Corso, M. P., Stefenon, S. F., Singh, G., Matsuo, M. V., Perez, F. L., and Leithardt, V. R. Q. (2023). Evaluation of visible contamination on power grid insulators using convolutional neural networks. Electr. Eng. 105, 3881–3894. doi:10.1007/s00202-023-01915-2
Dolník, B., Šárpataky, Ľ., Bucko, S., Pavlík, M., and Štefko, R. (2023). Assessing contamination severity of high voltage insulators using dielectric loss factor: laboratory measurements and comparative analysis of leakage current and dielectric loss factor at different voltage levels, humidity, and insulating materials. Electr. Power Syst. Res. 225, 109855. doi:10.1016/j.epsr.2023.109855
Elsied, M., Oukaour, A., Gualous, H., and Lo Brutto, O. A. (2016). Optimal economic and environment operation of micro-grid power systems. Energy Convers. manage. 122, 182–194. doi:10.1016/j.enconman.2016.05.074
Feng, Q., Kuang, H., Tian, Y., Zhou, P., Xiang, Y., Yu, H., et al. (2019). Study on hot water washing and surface electric field of post insulators in substation in chemical contaminant area. Insul. Mater. 52, 78–83.
He, Z., Gao, F., Tu, Z., Zhang, Y., Chen, H., and Hung, T. H. (2019). Analysis of natural contaminant components and sources of insulators on ±800 kV DC Lines. Electr. Power Syst. Res. 167, 192–198.
Ilomuanya, C., Farokhi, S., and Nekahi, A. (2022). Performance evaluation of outdoor high voltage glass insulators in high pollution industrial areas using simulated acid rain contamination. IEEE Access 10, 80600–80608. doi:10.1109/access.2022.3193237
Jiang, M., Guo, J., Jiang, Y., Li, L., and Lu, M. (2020). Dust contamination on surface of transmission line insulators in air-polluted regions in China: statistical characteristics, adhesion mechanism, and environmental impact factors. Environ. Sci. Pollut. Res. 27, 23643–23654. doi:10.1007/s11356-020-08692-6
Li, X., Liu, W. D., Yuan, X., Weijiang, C., and Jiangang, B. (2020). Surface charge accumulation and pre-flashover characteristics induced by metal particles on the insulator surfaces of 1100 kV GILs under AC voltage. High. Volt. 5, 134–142. doi:10.1049/hve.2019.0222
Li, X., Liu, Y., and Wang, J. (2025). Influence of surface contamination on electric field distribution of insulators. Chin. Phys. B. 34, 034101. doi:10.1088/1674-1056/ada54d
Liu, Y., Xia, B., Du, B., and Farzaneh, M. (2016). Influence of fine metal particles on surface discharge characteristics of outdoor insulators. Energies 9, 87. doi:10.3390/en9020087
Lutfi, A., El-Hag, A., and Shaban, K. (2024). Nonintrusive ultrasonic sensing and deep learning for outdoor ceramic insulator assessment. IEEE Trans. Dielectr. Electr. Insulation 31, 2993–3000. doi:10.1109/tdei.2024.3403072
Maraaba, L., Al-Soufi, K., Ssennoga, T., Memon, A., Worku, M., and Alhems, L. (2022). Contamination level monitoring techniques for high-voltage insulators: a review. Energies 15, 7656. doi:10.3390/en15207656
Nguyen, T. P., and Cho, M. Y. (2025). A cloud-based leakage current classified system for high voltage insulators with improved particle swarm optimization and hybrid deep learning technique. Eng. Appl. Artif. Intell. 143, 109987. doi:10.1016/j.engappai.2024.109987
Nguyen, T. D., Thanh, P. N., and Cho, M. Y. (2024). A cloud 15kV-HDPE insulator leakage current classification based improved particle swarm optimization and LSTM-CNN deep learning approach. Swarm Evol. Comput. 91, 101755. doi:10.1016/j.swevo.2024.101755
Ramos, N. G., Campillo, R. M. T., and Naito, K. (1993). A study on the characteristics of various conductive contaminants accumulated on high voltage insulators. IEEE Trans. Power Del. 8, 1842–1850. doi:10.1109/61.248293
Salem, A. A., Lau, K. Y., Rahiman, W., Abdul-Malek, Z., Al-Gailani, S. A., Rahman, R. A., et al. (2022a). Leakage current characteristics in estimating insulator reliability: experimental investigation and analysis. Sci. Rep. 12, 14974. doi:10.1038/s41598-022-17792-x
Salem, A. A., Lau, K. Y., Abdul-Malek, Z., Mohammed, N., Al-Shaalan, A. M., Al-Shamma’a, A. A., et al. (2022b). Polymeric insulator conditions estimation by using leakage current characteristics based on simulation and experimental investigation. Polymers. 14, 737. doi:10.3390/polym14040737
Salem, A. A., Abd-Rahman, R., Ishak, M. T. B., Lau, K. Y., Abdul-Malek, Z., Al-ameri, S., et al. (2023). Influence of contamination distribution in characterizing the flashover phenomenon on outdoor insulator. Ain Shams Engineering Journal 14, 102249. doi:10.1016/j.asej.2023.102249
Sopelsa Neto, N. F., Stefenon, S. F., Meyer, L. H., Ovejero, R. G., and Leithardt, V. R. Q. (2022). Fault prediction based on leakage current in contaminated insulators using enhanced time series forecasting models. Sensors 22, 6121. doi:10.3390/s22166121
Su, H., Jia, Z., Guan, Z., and Li, L. (2010). Mechanism of contaminant accumulation and flashover of insulator in heavily polluted coastal area. IEEE Trans. Dielectr. Electr. Insul. 17, 1635–1641. doi:10.1109/tdei.2010.5595568
Suda, T. (2001). Frequency characteristics of leakage current waveforms of an artificially polluted suspension insulator. IEEE Trans. Dielectr. Electr. Insul. 8, 705–709. doi:10.1109/94.946726
Thanh, P. N., and Cho, M. Y. (2022). Multilevel categorizing leakage current of 15 kV HDPE insulators based bidirectional gated recurrent unit. Measurement 202, 111779. doi:10.1016/j.measurement.2022.111779
Thanh, P. N., and Cho, M. Y. (2023). Online leakage current classification using convolutional neural network long short-term memory for high voltage insulators on web-based service. Electr. Power Syst. Res. 216, 109065. doi:10.1016/j.epsr.2022.109065
Wang, L., Li, X., Cao, B., and Guo, C. (2019). Influence of partial arc on leakage current and surface conductivity of insulators. High. Volt. Technol. 45, 1624–1629. doi:10.13336/j.1003-6520.hve.20190430036
Zhang, Z., Zhang, D., Liu, X., Jiang, X., and Hu, J. (2014). Effect of contaminant components on the AC flashover performance of LXY4-160 suspension glass insulator string. Trans. China Electrotech. Soc. 29, 298–305.
Keywords: glass insulators, contamination composition, metal contamination, leakage current, neural network
Citation: Luo Y, Liu J, Wang Y, Mei Z and Liu X (2025) Research on insulator contamination component identification based on neural network. Front. Electron. 6:1680502. doi: 10.3389/felec.2025.1680502
Received: 08 August 2025; Accepted: 26 November 2025;
Published: 05 December 2025.
Edited by:
Junfeng Liu, South China University of Technology, ChinaReviewed by:
Thanh-Phuong Nguyen, Nha Trang University, VietnamHao Yang, Xi’an Polytechnic University, China
Zhou Li, State Grid Shaanxi Electric Power Company Limited, China
Copyright © 2025 Luo, Liu, Wang, Mei and Liu. This is an open-access article distributed under the terms of the Creative Commons Attribution License (CC BY). The use, distribution or reproduction in other forums is permitted, provided the original author(s) and the copyright owner(s) are credited and that the original publication in this journal is cited, in accordance with accepted academic practice. No use, distribution or reproduction is permitted which does not comply with these terms.
*Correspondence: Xuandong Liu, bGl1eHVhbmRAeGp0dS5lZHUuY24=