 Szidónia Farkas1,2
 Adrienn Szabó1,2,3
 Bibiána Török1,2
 Csenge Sólyomvári1
 Csilla Lea Fazekas1,2,3
 Krisztina Bánrévi2
 Pedro Correia1,2,3
 Tiago Chaves1,2,3
 Dóra Zelena1,2*
- 1Institute of Physiology, Medical School, University of Pécs, Centre for Neuroscience, Szentágothai Research Centre, Pécs, Hungary
- 2Laboratory of Behavioral and Stress Studies, Institute of Experimental Medicine, Budapest, Hungary
- 3János Szentágothai School of Neurosciences, Semmelweis University, Budapest, Hungary
Alzheimer’s disease is the most common type of dementia, being highly prevalent in elderly women. The advanced progression may be due to decreased hormone synthesis during post-menopause as estradiol and progesterone both have neuroprotective potentials. We aimed to confirm that female hormone depletion aggravates the progression of dementia in a triple transgenic mouse model of Alzheimer’s disease (3xTg-AD). As pathological hallmarks are known to appear in 6-month-old animals, we expected to see disease-like changes in the 4-month-old 3xTg-AD mice only after hormone depletion. Three-month-old female 3xTg-AD mice were compared with their age-matched controls. As a menopause model, ovaries were removed (OVX or Sham surgery). After 1-month recovery, the body composition of the animals was measured by an MRI scan. The cognitive and anxiety parameters were evaluated by different behavioral tests, modeling different aspects (Y-maze, Morris water maze, open-field, social discrimination, elevated plus maze, light–dark box, fox odor, operant conditioning, and conditioned fear test). At the end of the experiment, uterus was collected, amyloid-β accumulation, and the cholinergic system in the brain was examined by immunohistochemistry. The uterus weight decreased, and the body weight increased significantly in the OVX animals. The MRI data showed that the body weight change can be due to fat accumulation. Moreover, OVX increased anxiety in control, but decreased in 3xTg-AD animals, the later genotype being more anxious by default based on the anxiety z-score. In general, 3xTg-AD mice moved less. In relation to cognition, neither the 3xTg-AD genotype nor OVX surgery impaired learning and memory in general. Despite no progression of dementia-like behavior after OVX, at the histological level, OVX aggravated the amyloid-β plaque deposition in the basolateral amygdala and induced early cholinergic neuronal fiber loss in the somatosensory cortex of the transgenic animals. We confirmed that OVX induced menopausal symptoms. Removal of the sexual steroids aggravated the appearance of AD-related alterations in the brain without significantly affecting the behavior. Thus, the OVX in young, 3-month-old 3xTg-AD mice might be a suitable model for testing the effect of new treatment options on structural changes; however, to reveal any beneficial effect on behavior, a later time point might be needed.
1 Introduction
Alzheimer’s disorder (AD) is the most common type of dementia, which is among the top 10 leading causes of death in the world (1, 2). It is characterized by disturbances of memory, attention, and sleep (1, 3). The patients often have difficulties in their daily life due to their impaired behavioral abilities (4). Morphologically, amyloid plaques [formed by amyloid-β 1-42 (Aβ1-42)] and hyperphosphorylated tau aggregates appear in the hippocampus, cortex, and amygdala, brain areas that are critical in cognitive and emotional function (5, 6).
Plenty of risk factors have been identified regarding AD. These can be lifestyle related, like diet, physical activity, and environmental conditions, or medical factors, like obesity and cardiovascular conditions (1). However, the three major risk factors are age, gender, and genetical mutations (7–9). It is well known that the incidence of AD is increasing with age, but it is also important to note that women represent 70% of the patients (10). The increasing female prevalence among elderly can be due to hormonal change during menopause (11, 12). Namely, the low levels of sex steroids, like 17β-estradiol (E2) and progesterone (PG), may have an important role in the pathomechanism (13). Indeed, both E2 and PG play a pivotal role in neuroprotection, thereby improving cognitive function, memory, attention, synaptic plasticity, spine density, and dendrite formation (14–17). The loss of the ovarian hormones can affect these functions, and also increase the appearance of amyloidogenic markers, aggravating the progression of AD (18–20). Beside the natural decrease in ovarian steroids during menopause, the surgical removal of the gland in younger generation may also have detrimental effect on their cognitive capabilities (21, 22). It is estimated that, in USA, 100,000 cases of dementia may be attributable annually to bilateral oophorectomy (23). This later state can be modeled by ovariectomy (OVX) in animals (24, 25).
AD can also be characterized by genetical mutations, leading to family accumulations. Research has identified five main “AD genes”: apolipoprotein E (ApoE) ϵ4 allele, amyloid precursor protein (APP), presenilin-1 (PSEN1), presenilin-2 (PSEN2), and microtubule-associated protein tau (MAPT). These genes may contribute to the formation of amyloid plaques, leading to memory loss and behavioral changes (8, 26–33), as well as to different tauopathies such as AD (34, 35). Genetic animal models were generated based on these human mutations. The triple transgenic mouse (3xTg-AD), bearing the humanoid mutation of APP, PSEN1, and tau, is widely used and well characterized (36–38). This mouse strain develops AD-like structural (amyloid plaques and hyperphosphorylated tau) and behavioral (progressive cognitive decline) symptoms.
The most relevant and affected neurocircuit in AD patients is the cholinergic system (39, 40), most of all the basal forebrain cholinergic (BFC) neurons (41, 42), being the main therapeutic target (43). The cholinergic neurons from the medial septum (MS), nucleus basalis magnocellularis (NBM), and substantia innominata complex are highly affected in AD, and also express E2 receptors (44–48), proving the importance of sexual steroids in the pathophysiology of the disease. OVX may decrease, while E2 treatment normalizes the number of cholinergic neurons in the BFC, as well as the length and branching of these neurons (49–51). In the 3xTg-AD mouse model, a cholinergic decline was also discovered, showing the loss of ChAT immunoreactive neurons in the MS and in the vertical limb of the diagonal band of Broca (52, 53).
Based on the important role of sexual steroids in neuronal health and their role in mental diseases, we aimed to investigate the aggravating effect of hormone deprivation induced by bilateral OVX on AD-related somatic, behavioral, and histological changes in the 3xTg-AD mice. The lack of E2 and PG may anticipate difficulties in cognitive function and anxiety-related behavior, perturbs somatic characteristics (like body weight or body fat ratio), and assumes morphological changes on amyloid deposition and in the cholinergic system. To test this hypothesis, the following concepts were used: (I) As OVX is often accompanied by body weight increase (54), and uterus weight decrease (55, 56), we were concentrating on these somatic parameters mainly to confirm the effectiveness of the OVX surgery. (II) The major symptom of dementia is cognitive disability; therefore, we used behavioral tests measuring (57) (i) short-term memory [Y-maze, often used in AD testing (58); based on spontaneous exploration of the mice]; (ii) social discrimination (SD); (iii) spatial memory [Morris water maze (MWM) as the gold standard in AD research (59, 60); also known as avoidance-based complex association]; (iv) reward-based simple association [operant conditioning (OC)]; and (v) punishment-based simple association [conditioned fear test (CFT)]. (III) As anxiety is often comorbid with AD (61, 62), and is a core symptom during menopause, or after OVX (63), we tested these symptoms by (i) elevated plus maze (EPM), as a gold standard in anxiety research (64), showing changes during the menstrual cycle (65); (ii) light–dark box (LD) test, which utilizes the fear from open, light spaces, similarly to EPM; and (iii) fox odor test (FOT), measuring the innate fear from a predator odor. (IV) At the structural level, we were concentrating on Aβ accumulation as well as cholinergic cell and fiber loss.
2 Materials and methods
2.1 Mouse strains
Three-month-old 3xTg-AD [B6;129-Tg(APPSwe,tauP301L)1Lfa Psen1tm1Mpm/Mmjax] mice and their control strains (C57BL6/J) were used (66). This age corresponds to young adult humans without hormonal disturbances. The 3xTg-AD animals were homozygotes for three AD-related human-based genetic mutations: PSEN1, APPSwe, and tauP30IL (36–38). We maintained the colony by breeding homozygous mice to each other. Only females were used in this experiment. All animals were bred and housed at the Institute of Experimental Medicine, Budapest, Hungary. The mice were maintained under reversed light–dark cycle (lights off at 8:00 a.m., lights on at 8:00 p.m.) and provided with standard mice chow [without estrogen-free dietary restrictions (67)] and water ad libitum. The animal rooms have a temperature of 22 ± 2°C and a relative humidity of 55 ± 10%. All tests were approved by the local committee of animal health and care (PE/EA/918-7/2019) and performed according to the European Communities Council Directive recommendations for the care and use of laboratory animals (2010/63/EU).
2.2 Experimental design
Mice were ovariectomized (OVX) or Sham operated without removing the ovaries (Sham), under ketamine–xylazine anesthesia (dose: 125 mg/kg ketamine and 25 mg/kg xylazine dissolved in 0.9% saline, administered in 10 ml/kg concentration intraperitoneally). During surgery, the animals were divided into the following four groups: (1) Control-Sham (n = 8), (2) Control-OVX (n = 9), (3) 3xTg-AD-Sham (n = 7), and (4) 3xTg-AD-OVX (n = 12) (Figure 1A; the unequal animal numbers are due to surgical-related loss). Two series were conducted; each contained all four groups. After 1 month, a magnetic resonance imaging (MRI) measurement was performed. During this period, the ovarian hormones were supposed to disappear [maximal luteinizing hormone levels can be detected at this point (68)] and enough time has passed for the development of supposed behavioral changes. Then, the following behavioral test battery was used: Y-maze, SD, EPM, LD, FOT, MWM, OC, and CFT, with at least 24-h rest between the different tests (Figure 1B). The order of the tests was chosen from the milder stressors (5–10 min single test) to more burdensome ones (through restricted diet in OC till foot shock in CFT). All behavioral tests were performed during the first half of the active (dark) cycle (between 9:00 a.m. and 2:00 p.m.). At the end of the experiments, animals were sacrificed, and brains were dissected and post-fixed in 4% PFA for 24 h, dehydrated in 30% sucrose solution for 24 h, and then 30-µm-thick slices were made with a freezing microtome (Leica SM2010 R). Uterus dissection and weighting were also performed to validate the success of the OVX. Due to technical reasons (e.g., missing video recording and loss of brain slide during staining) in some experiments, data from one to two animals are missing.
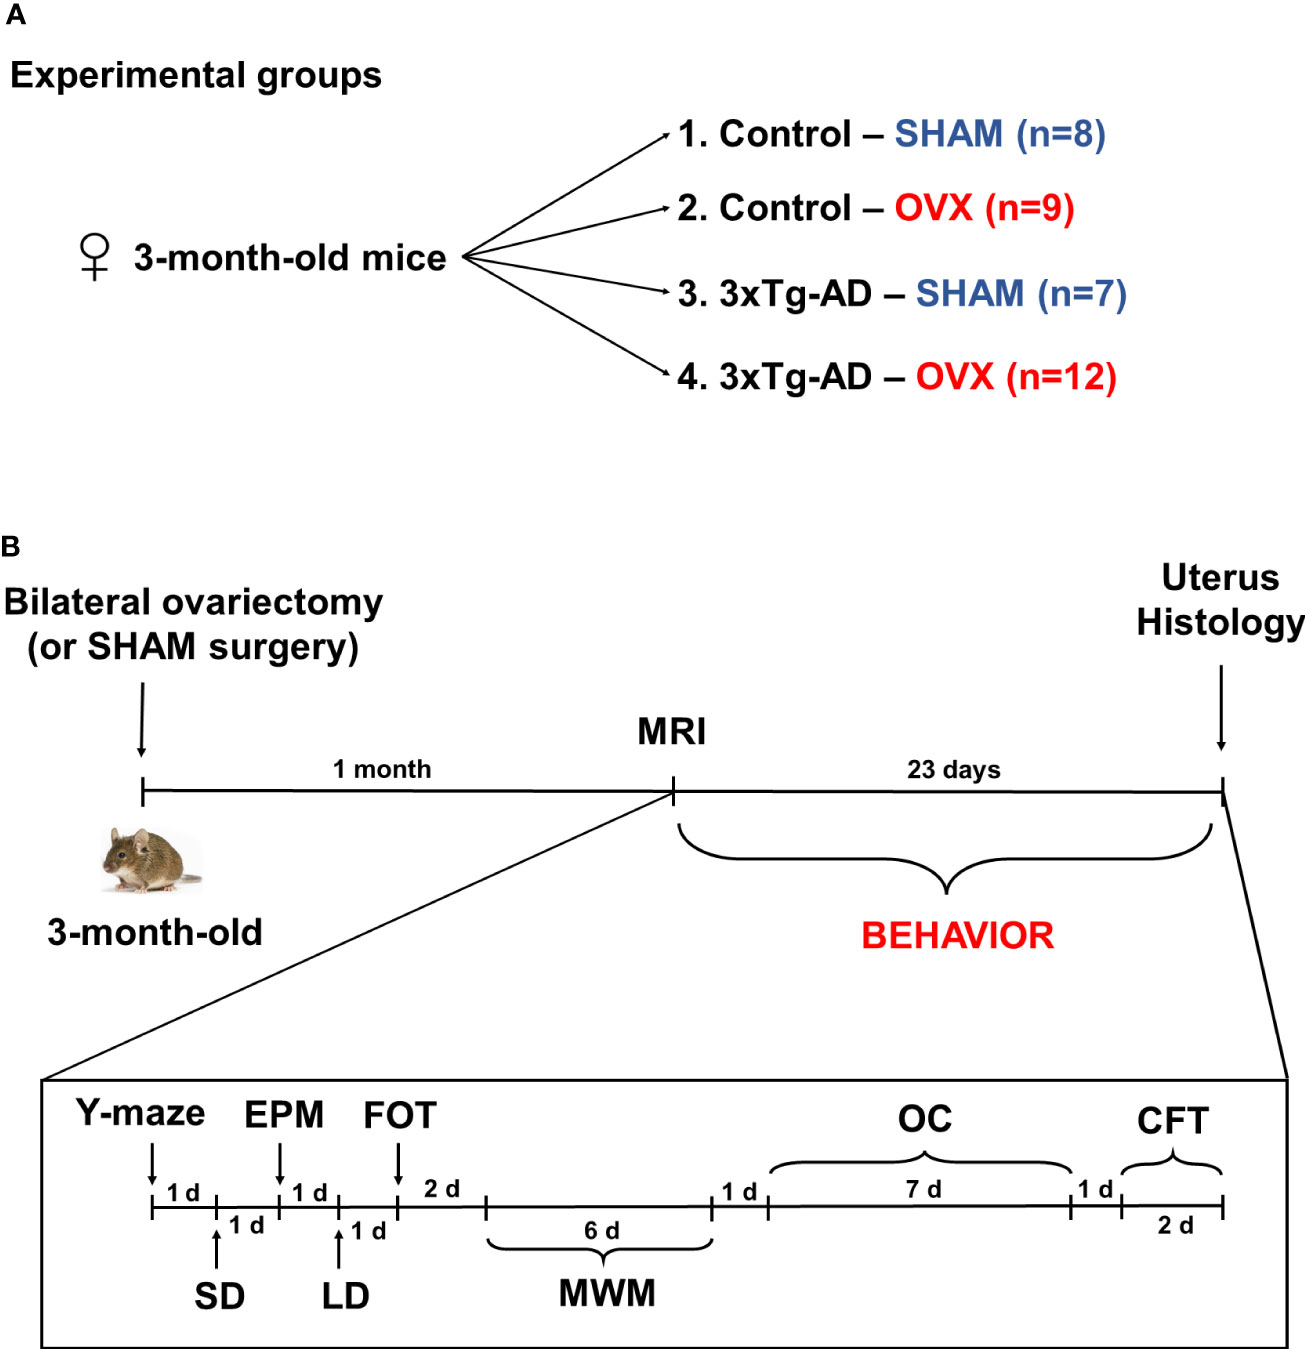
Figure 1 Experimental design. (A) Three-month-old female 3xTg-AD and C57BL6/J mice were used and divided into the following groups: (1) Control-Sham (n = 8), (2) Control-OVX (n = 9), (3) 3xTg-AD-Sham (n = 7), and (4) 3xTg-AD-OVX (n = 12). (B) Chronological order of experimental procedures. On 3-month-old mice, a bilateral ovariectomy (OVX) or Sham surgery was performed, then after 1 month, magnetic resonance imaging (MRI) measurements were conducted followed by behavioral experiments in this order: Y-maze, social discrimination (SD), elevated plus maze (EPM), light–dark box (LD), fox odor test (FOT), Morris water maze (MWM), operant conditioning (OC), and conditioned fear test (CFT). The duration and time between different tests are marked in the chronological axis as days (d). At the end of the experiment, uterus and brain were dissected for histological staining. OVX, ovariectomy; 3xTg-AD, triple transgenic mouse model of Alzheimer’s disorder.
2.3 Magnetic resonance imaging measurements
Body composition (body weight, fat, lean, free water, and total water) measurements were performed with a body composition analyzer for live small animals (EchoMRI™-700, EchoMRI LLC, Houston, TX), as described by the manufacturer. The animals were put in a restrainer and placed in the MRI machine for approximately 1 min (Figure 2A). The measurement was done in duplicate consecutively, without a time gap, and averaged. The body fat and lean weight were expressed as percentage of the body weight, and hydration ratio was calculated as the following:
2.4 Behavioral tests
2.4.1 Cognitive behavioral tests
2.4.1.1 Y-maze test
The test was performed in a Y-shaped apparatus, with 3 arms (A, B, and C), with 30 × 7 × 20 cm dimensions, and in a 15–20 lux environment (Figure 3A) (57). Mice were placed in arm A and were allowed to explore the maze freely for 10 min. Before the entry of each animal, the maze was cleaned with 70% ethanol. Locomotion was calculated based on the total number of entries, while the spontaneous alternation reflects short-term memory and was calculated as the percentage (%) of “correct” alternation/total alterations. “Correct” alternation means entry into all three arms on consecutive choices (i.e., ABC, BCA, or CAB). Parameters were measured manually by an experimenter blind to the treatment groups.
2.4.1.2 Social discrimination test
The test was performed in a 40 × 40 × 15 cm apparatus under red light (69). The experiment consisted of four phases, each lasting 5 min (Figure 3D). Firstly, the mice were placed in the box for acclimatization [open-field phase (OF)]. Secondly, two metal cages were placed into the box and fear from objects as well as side preference was evaluated. The goal was to habituate the animals to the container (object habituation). Then, a stimulus mouse [C57BL6, 25- to 30-day-old male, test naïve, sexually immature (70)] was placed under one of the metal cages (sociability phase). In the last 5 min, another stimulus mouse was placed under the other metal cage, and the position of the two cages was swapped [social discrimination (SD)]. The mice were left to explore freely the two animals. In the OF, the distance moved, and the time spent in the central or peripheral zone was analyzed automatically by EthoVision XT (Noldus IT, Wageningen, The Netherlands, version 15). Other parts of the test were analyzed using Solomon Coder (Solomon Coder, Hungary; https://solomoncoder.com/) by an experimenter blind to the treatment groups. The time and frequency sniffing the left or right container were evaluated. The sociability index (third phase) was calculated as:
The discrimination index (DI, fourth phase) was calculated as:
2.4.1.3 Morris water maze test
A plastic circular pool (90 cm in diameter and 40 cm in height) was filled with tap water (24 ± 2°C), made opaque by white wall paint (Figure 4A) (38). A platform (6 cm in diameter) was placed 1 cm above the water for learning day 1, then moved 1 cm lower than the level of the water for days 2–5. The apparatus was divided into four quadrants and the platform was installed in the middle of one quadrant. Mice were released into the water from different points across trials (Figure 4A, marks 1–4) and were allowed to swim freely for 60 s to find the platform. If the mice could not find the platform during the 1 min, then it was guided there and left on the platform for 10 s. The learning phase (days 1–5) consisted of four trials with 30-min intertrial interval (ITI) when the animals were dried by a towel and returned to their home cages. On day 6 (probe day), the platform was removed from the water and the mice had 60 s to search for it. Latency to reach the platform during the learning phase was recorded manually, while during the probe test, time spent in different zones was calculated by EthoVision XT 15.
2.4.1.4 Operant conditioning test
The test was performed in an automated operant chamber (Med Associates, St. Albans, VT, USA) with two nose holes (Figure 5A) (57). As a reward, 45 mg of food pellets (Bio-Serv Dustless Precision Rodent Pellet, Bilaney Consultants GmbH, Germany) was used (71). Animals were placed inside a test chamber for 30 min to freely explore the environment. A nose poke into one of the nose holes was immediately associated with a reward followed by a 25-s-long time out with the chamber light switched on (time-out period), while the other nose hole was not baited (incorrect). During the time-out period, responses were not rewarded, but were registered. The test was divided into two phases: habituation (days 1–2) and learning (days 3–7), and data only from the learning phase is shown (Figures 5B, C, days 1–5). Reward preference (RP) (ratio of responses on the rewarded nose hole) was calculated. Number of rewarded responses and time-out reward hole nose pokes were also recorded.
2.4.1.5 Conditioned fear test
The mouse was placed into a Plexiglas chamber (25 × 25 × 30 cm) with an electrical grid floor (Coulbourn Instruments) that delivered the foot shocks (SuperTech Instruments). For 2.5 min, the animals were left in the boxes for habituation [baseline (BL)]. Then, at pseudorandom intervals (60–90 s), a 30-s-long conditioned stimulus (CS: 80 dB pure tone at 7 kHz) was played and co-terminated with an unconditioned stimulus (foot shock: 0.7 mA, 1 s long, seven times in total), for a total of 11 min (Figure 5D). The following day, the experiment was repeated, except that the animals did not receive foot shocks at the end of the CSs (72). The chambers were cleaned with soap water and water after every trial. The experiment was conducted in bright light (700 lux). Time spent in immobility was measured automatically by Ethovision XT 15 on the second day. Time spent in immobility was calculated for the BL (mean for 10 s) as well as for CSs (mean for 7 CS per 10 s).
2.4.2 Anxiety-related behavioral tests
2.4.2.1 Elevated plus maze test
A plus-shaped device was used, which comprised two opposite open arms and two enclosed arms (30 × 7 × 30 cm) (Figure 6A) (73). The mice were placed in the center of the apparatus facing the open arm and were allowed to explore the maze for 5 min. Before the entry of each animal, the maze was cleaned with 70% ethanol. The time spent and number of entries into the different arms as well as the distance moved (cm) were quantified with EthoVision XT 15. The open arm preference (OP) (74) was calculated as:
2.4.2.2 Light–dark box test
LD was performed in a 40 × 20 × 25 cm box, which had two compartments: a light (white colored) compartment that is open from above and a dark (black colored) compartment that is closed from every side (Figure 6B). A small gate (5 × 5 cm) between the two compartments, where the animal can freely pass, was present. The mice were placed in the light part of the box and were allowed to explore the environment for 10 min. The duration of time spent in each compartment, the total number of entries, and latency to dark compartments were measured by Solomon Coder.
2.4.2.3 Fox odor avoidance test
Exposure to fox-derived synthetic predator odor, 2-methyl-2-thriazoline (2MT, #M83406, Sigma Aldrich), was performed in a separate experimental room under a fume hood. A transparent Plexiglas arena (43 × 27 × 19 cm) was used (Figure 7A). During the test, a 2MT solution-soaked filter paper (40 μl in 1 ml of distilled water, 50 μl/animal) was placed in a plastic 50-ml conical tube cap in one corner of the box (75). A 7 × 11 cm “odor zone” around the odor source was defined. The opposite part (25%) of the box was appointed as “avoidance zone”. During the test, the animal was placed in the avoidance zone and left to freely explore the arena for 10 min. Time spent in the odor zone and the distance moved (cm) was measured with EthoVision XT 15. Different anxiety-related behaviors, like the time spent freezing, grooming, and sniffing as well as the exploratory behaviors like time spent rearing and exploring was analyzed manually by Solomon Coder by an experimenter blind to the treatment groups.
2.5 Histological evaluations
2.5.1 Hematoxylin–eosin staining for uterus morphology
After weighing, uteruses were fixed in 4% PFA for 24 h, then dehydrated with 30% sucrose solution. Thirty-micrometer slices were made with a freezing microtome (Leica SM2010 R). Hematoxylin–eosin (HE) staining was performed on the slices to see morphological changes in the epithelium layer thickness, lumen size, and the integrity of the endometrial glands (Figure 8A). Samples were imaged with a Nikon Eclipse E1 R (Nikon, Tokyo, Japan) microscope at 4× magnification.
2.5.2 Amyloid-β1-42 and choline acetyltransferase immunohistochemistry
For Aβ1-42 and ChAT staining, peroxidase-based immunohistochemistry with nickel-diaminobenzidine tetrahydrochloride (Ni-DAB) visualization was undertaken (17). Firstly, only for the Aβ staining, a 10-min concentrated formic acid (Sigma-Aldrich, #F0507) exploration was implemented. Secondly, endogen peroxidase was blocked by a 3% peroxide (H2O2) solution. After blocking, slices were incubated 72 h with the primary antibody recognizing Aβ (Rabbit, 1:500, Invitrogen, #71-5800) or ChAT (Goat, 1:1,000, Millipore, #AB144P). After 72 h, brain slices were incubated with a biotinylated secondary antibody (biotinylated anti-rabbit, 1:200, Jackson ImmunoResearch, #111-065-003 or biotinylated anti-goat 1:200, Jackson ImmunoResearch, #705-065-147) at room temperature (RT), for 2 h. An avidin–biotin kit (VECTASTAIN Elite ABC-Peroxidase Kits, PK-6100, Vector Laboratories) was used for 2 h, RT, to detect biotinylated molecules. Then, the visualization was performed with a Ni-DAB and glucose oxidase mixture. Samples were imaged with a Nikon Eclipse E1 R (Nikon, Tokyo, Japan) microscope at 4× magnification.
In case of Aβ plaques, the integrated optical density (IOD) was measured by ImageJ/Fiji in the basolateral amygdala (BLA), the somatosensory and motor cortex (CTX) between Bregma 0.50 mm and −1.20 mm, and the CA1 region of the hippocampus (CA1-HC) between Bregma −1.19 mm and −2.69 mm (Figure 9A). In other brain areas of 5-month-old 3xTg-AD mice, no amyloid deposition was found. After ChAT staining, the number of ChAT-positive cells was counted in the NBM, a brain region containing cholinergic cell bodies, and highly affected in AD (Figure 10A) (76, 77).
2.5.3 Acetylcholinesterase histochemistry
To label cholinergic fibers in the somatosensory cortex (SSC), the target area of the NBM neurons (78), an AChE histochemistry was performed (17). Slices were selected from the coordinates: Bregma +0.50 mm to −1.06 mm (Figure 10A). Free-floating brain slices were incubated in a mixture of sodium acetate buffer (0.1 M; pH 6) acetylthiocholine iodide (0.05%), sodium citrate (0.1 M), copper sulfate (0.03 M), and potassium ferricyanide (5 mM). This was followed by ammonium sulfide (1%) and then silver nitrate (1%) incubation (17, 79). Analysis was performed with ImageJ/Fiji software. Samples were imaged with a Nikon Eclipse E1 R (Nikon, Tokyo, Japan) microscope at 10× magnification. IOD was measured between layer IV and V of the SSC (Figure 10A).
2.6 Z-score calculations
Integrated z-score was calculated for four major parameters: somatic, cognitive, anxiety, and locomotion, as proposed by Guilloux et al. (80), and previously presented in (73, 81). For each parameter, a normalized value (studentization) was calculated according to the following equation:
and the included parameters were adjusted to have the same directionality. Somatic z-score was calculated from the averages of body weight change, fat/BW percentage, and uterus weight (×−1) z-scores. Cognitive z-score was calculated from alteration in the Y-maze; the area under the curve (AUC) of the latencies to platform during learning days 1–5 in MWM (×−1), and latency to platform on the probe day (×−1) in MWM; average freezing during baseline and conditioned stimuli in CFT; and the AUC of the reward preference learning days 3–7 in operant conditioning. Anxiety z-score was averaged from the z-scores of open arm duration (×0.5) and open arm preference (×0.5) in EPM; time spent in light compartment in LD; time spent freezing (×−1) and percentage of time spent in the odor zone in FOT; and percentage of time spent with freezing in CFT day 2 (×−1). Locomotion z-score was calculated from the parameters that reflected mobility in the given experiment [distance moved in EPM (×0.5), OF and fox odor tests; total number of entries in the Y-maze, EPM (×0.5), and LD], then averaged for each animal. Somatic, cognitive, anxiety, and locomotor z-scores were averaged for every group and statistically tested. If multiple parameters indicating the same meaning within an experiment were included in averaged z-score calculations (e.g., distance moved and closed arm entries on EPM in the locomotion z-score), then they were multiplied by ×0.5 in order to avoid unwanted weighting of the specific test.
2.7 Statistical analysis
GraphPad Prism (version 6.0) was used for statistical analyses. Two-way ANOVA (MRI, Y-maze, OF, Sociability, SD, EPM, LD box, FOT, and histology; on factors genotype and OVX) or repeated-measures ANOVA (MWM, body weight change, OC, and CFT; additional factor: time) was used to compare the groups, followed by Tukey HSD or Sidak post-hoc test. For comparison of two groups, Student’s t-test was used (Aβ staining). All data are presented as mean ± SEM and p< 0.05 was considered as a statistically significant difference.
3 Results
3.1 Changes in body composition measured with MRI
Regarding body weight changes, a difference was found between the two genotypes [F(3,59) = 12.59, p< 0.0001], the 3xTg-AD mice being heavier than the controls. However, OVX surgery itself increased the body weight during a 40-day period [F(1,19) = 16.35, p = 0.0007] without any influence of the genotype (Figure 2B). This increased body weight can be explained by the increased body fat ratio, where a genotype effect was also detectable with more fat in 3xTg-AD animals [F(1,32) = 10.01, p = 0.0034] (Figure 2C). OVX was able to increase the fat accumulation in both genotypes [F(1,32) = 38.38, p< 0.0001] (Figure 2C). Simultaneously, lean body weight ratio decreased [genotype: F(1,32) = 11.97, p = 0.0016, OVX: F(1,32) = 47.45, p< 0.0001] (Figure 2D). A significant negative correlation between body fat and lean ratio was also detected (r = −0.9870, p< 0.0001) (Figure 2E). The hydration ratio (((total water − free water)/lean)*100) of all animals was in the normal range (80 ± 5%), without any effect of genotype or OVX (Figure 2F).
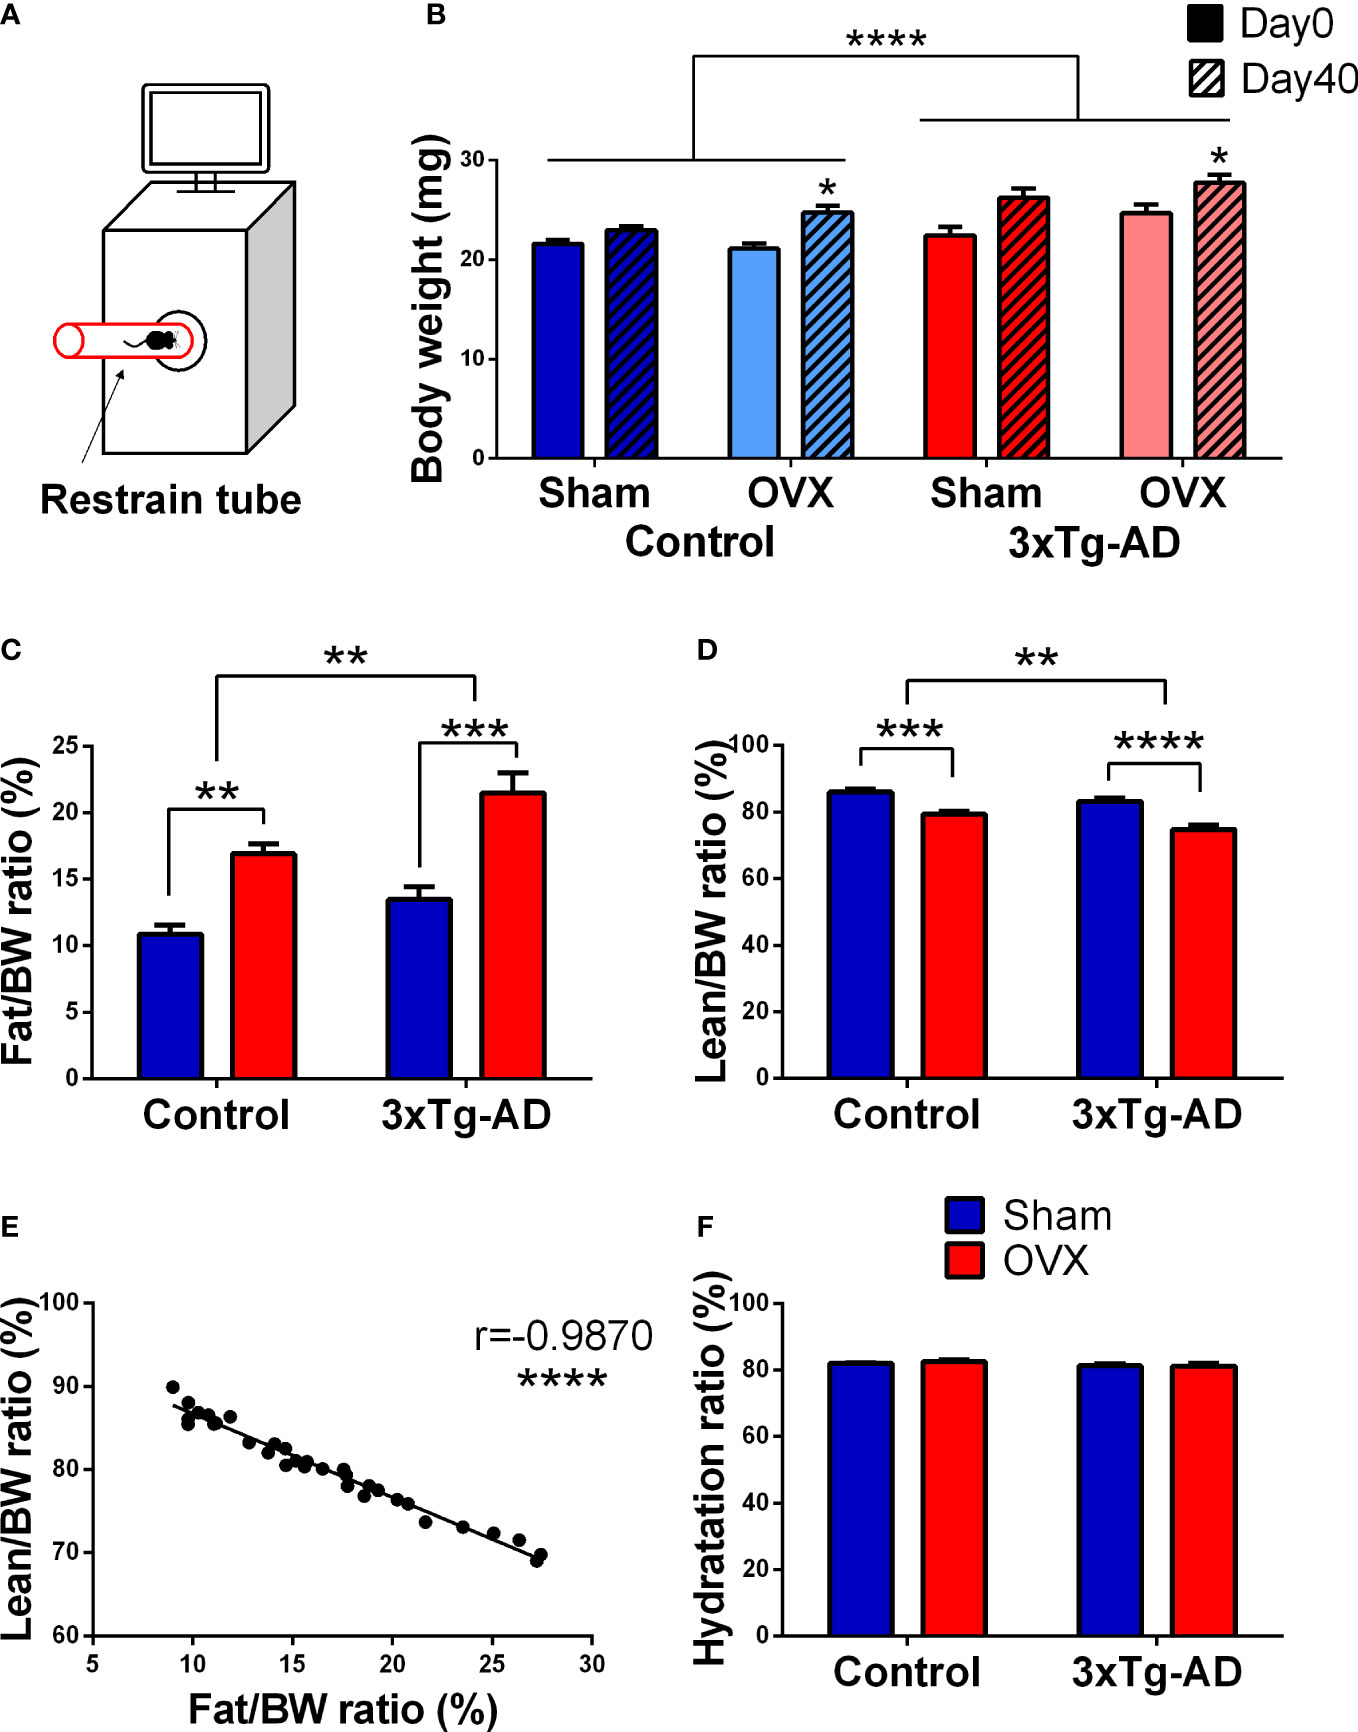
Figure 2 Magnetic resonance imaging (MRI) measurements. (A) Representative figure of the procedure. Animals were placed in a restrained tube, then inserted into an EchoMRI™-700 machine for approximately 1 min. (B) Body weight change of the animals from day 0 to day 40. 3xTg-AD animals were heavier than their controls (p < 0.0001). OVX induced body weight increase, irrespective of the genotype (p = 0.007). (C) Body fat percentage at 1-month post-surgery. 3xTg-AD animals had higher body fat percentage [Fat/Body weight (BW)*100] (p = 0.0034), which was aggravated by OVX in both genotypes (p < 0.0001). (D) Body lean percentage 1-month after surgery. A decrease in the body lean ratio [Lean/Body weight (BW)*100] was detected after OVX (p < 0.0001), and between the two genotypes (p = 0.0016). (E) Correlation between body fat and lean ratio. A negative and significant correlation was seen between the body fat and lean ratio (p < 0.0001). (F) Hydration ratio of the different animal groups. The hydration ratio (HR = ((total water − free water)/lean)*100) was normal in all animals (80% ± 5). OVX, ovariectomy; 3xTg-AD, triple transgenic mouse model of Alzheimer’s disorder. Data are shown as mean ± SEM, *p < 0.05, **p < 0.01, ***p < 0.001, ****p < 0.0001.
3.2 Behavioral tests
3.2.1 Cognitive behavioral tests
3.2.1.1 Y-maze test
There was no difference between the groups in the main parameter of short-term memory, the alternation (Figure 3B). The 3xTg-AD mice moved significantly less compared to control animals [F(1,31) = 19.52, p = 0.0001] without any effect or influence of OVX (Figure 3C).
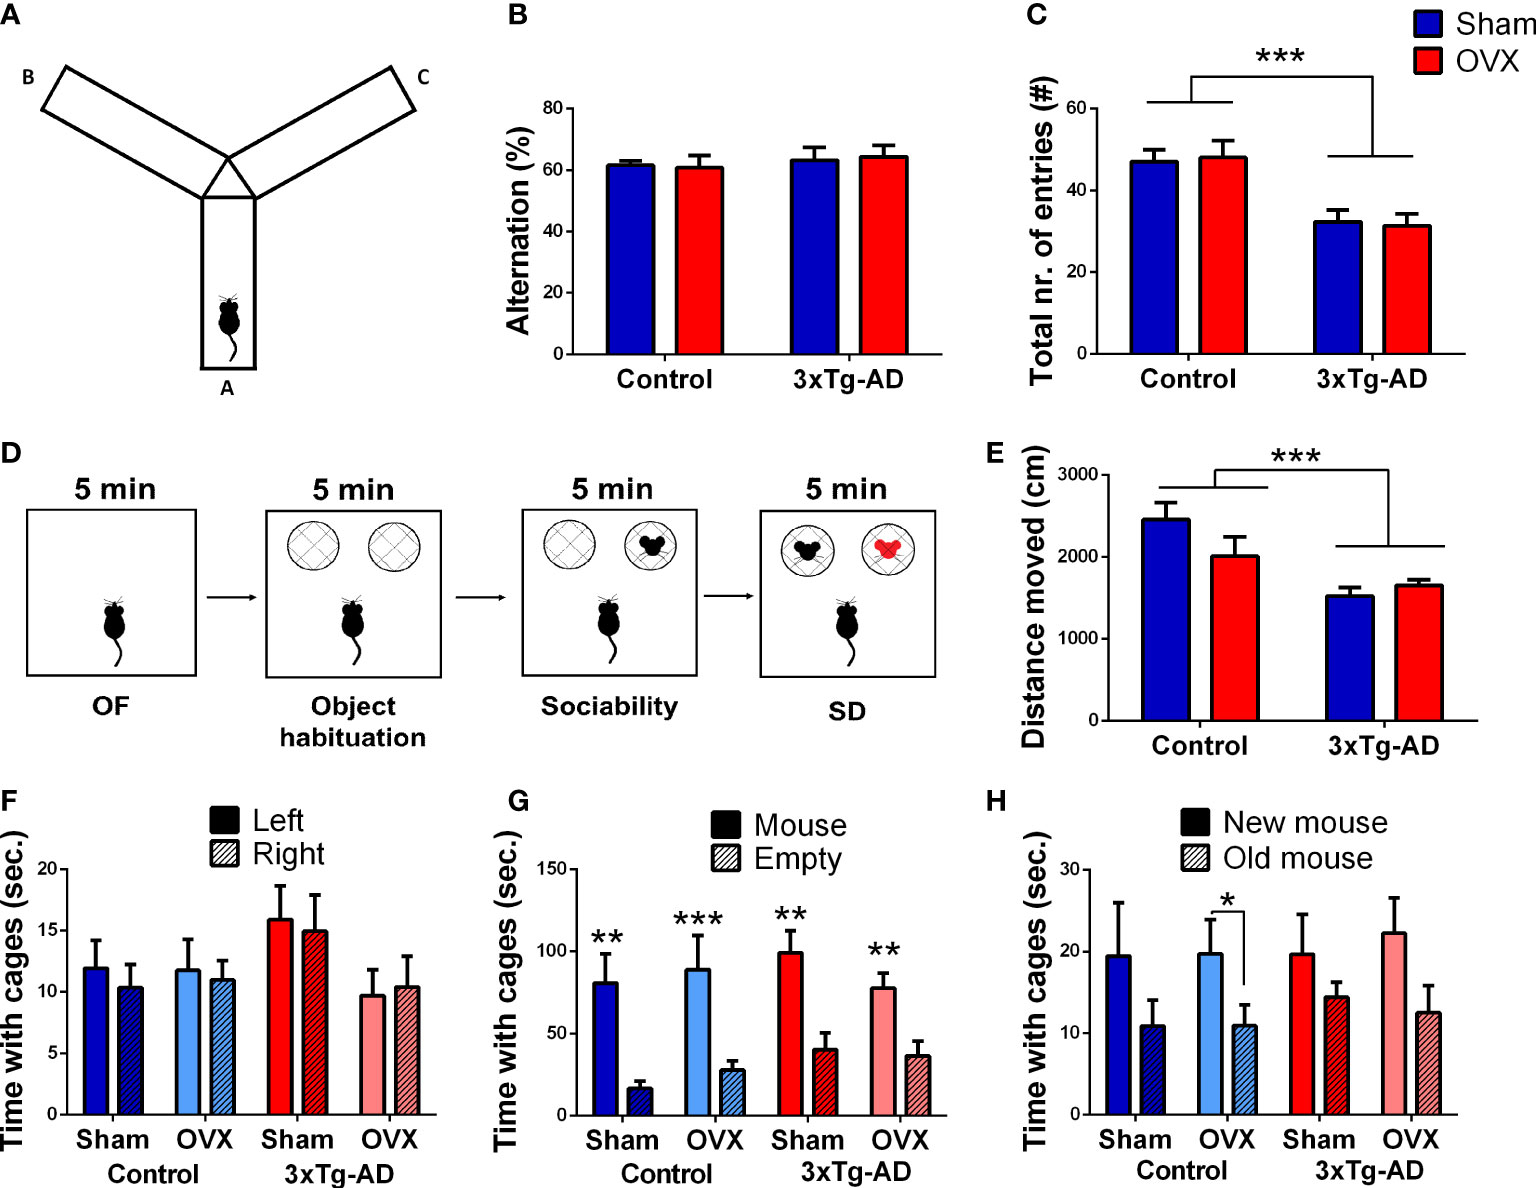
Figure 3 Y-maze and social discrimination (SD) tests. (A) Representative image of the Y-maze apparatus with three arms (A, B, and C). (B) Percentage of the good alternation in the Y-maze test. There was no significant difference between the groups. (C) Locomotor activity of the animals represented by the total number of entries. 3xTg-AD animals moved less than controls (p = 0.0001), without any OVX effect. (D) Representative figure of the different phases of the SD test. (E) Open-field (OF) test was the first 5-min phase of the SD test. A decreased locomotor activity, expressed in the distance moved (cm), was seen in the 3xTg-AD groups (p = 0.0008). (F) Object habituation phase of the SD test. No side preference was detected; thus, the next phases did not require any correction. (G) Sociability phase of the SD test. Every test mouse showed more interest towards the stimulus mouse containing cage (p < 0.0001); asterisks (*) show the result from the single-sample t-test against 50%. (H) SD phase. An increased interest towards the new mouse was detected in all groups (p = 0.0071). OVX, ovariectomy; 3xTg-AD, triple transgenic mouse model of Alzheimer’s disorder. Data are shown as mean ± SEM, **p < 0.01, ***p < 0.001, *p < 0,05.
3.2.1.2 Social discrimination (SD) test
We confirmed the reduced locomotion of 3xTg-AD mice during the first 5 min OF phase [F(1,32) = 13.80, p = 0.0008], without OVX effect (Figure 3E). Neither the genotype, nor the OVX influenced the number of entries or time spent in the centrum, not even if we corrected it with locomotion (Table 1).
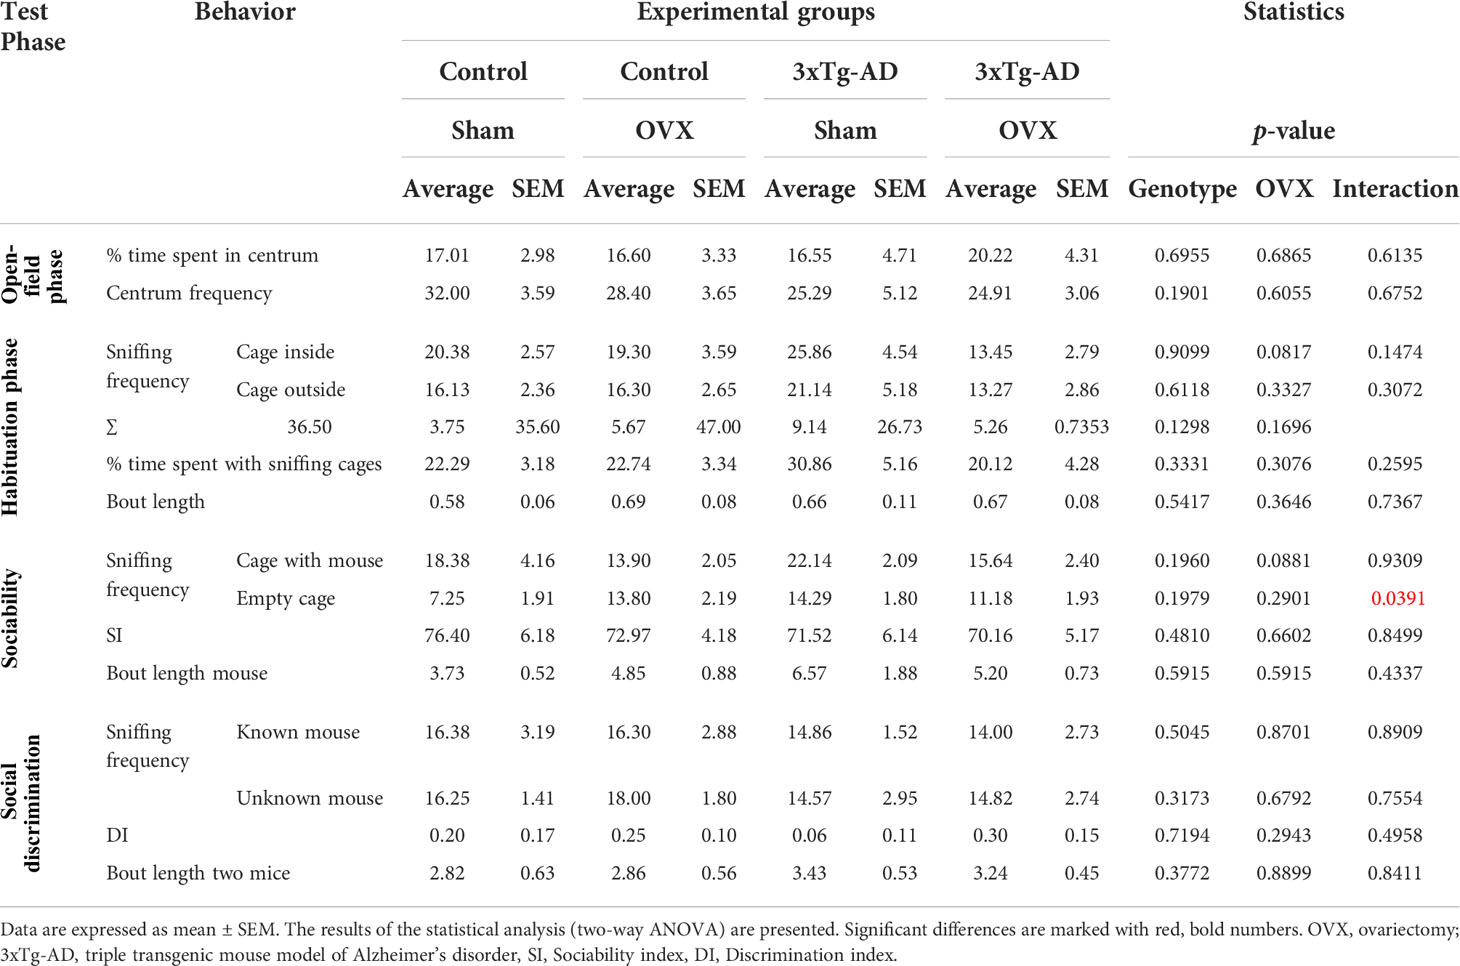
Table 1 Detailed results of the social discrimination tests.
During the object habituation phase, none of the mice preferred any side; thus, the next phases did not require any correction (Figure 3F). OVX did not significantly affect the number of object approaches as well [F(1,32) = 3.05, p = 0.1298; Table 1].
In the sociability phase, every mouse showed more interest to the stimulus mouse-containing cage [repeated-measures ANOVA: F(1,32) = 33.81, p< 0.0001; single-sample t-test against 50%; Control-Sham: t(7) = 4.27, p = 0.0037; Control-OVX: t(9) = 5.49, p = 0.0004; 3xTg-AD-Sham: t(6) = 3.50, p = 0.0128; 3xTg-AD-OVX: t(9) = 3.90, p = 0.0036] without significant difference between groups (Figure 3G). There was a tendency for OVX animals to approach the social container a fewer number of times [F(1,32) = 3.89, p = 0.0881; Table 1].
In the social discrimination phase, an increased interest towards the new mouse was detected in all groups [F(1,62) = 7.75, p = 0.0071], suggesting that—in general—the test animals preferred the new stimulus mice, as expected (Figure 3H). However, when we checked the groups one by one, only the Control-OVX group seemed to have intact memory with a tendency in the 3xTg-AD-OVX group [single-sample t-test against 0; Control-Sham: t(7) = 1.17, p = 0.2806; Control-OVX: t(9) = 2.48, p = 0.0348; 3xTg-AD-Sham: t(6) = 0.53, p = 0.6179; 3xTg-AD-OVX: t(9) = 2.03, p = 0.0732]. A larger number of animals are probably needed for this test to work properly. Nevertheless, there was no overall difference between groups.
3.2.1.3 Morris water maze test
The latencies to reach the platform showed a significant improvement in time during the learning phase, independently from genotypes or surgery [F(4,132) = 43.42, p< 0.0001] (Figure 4B). At the end of the 5th day, the animals were able to find the platform within 20 s (o average: 17.01 ± 1.21 s), suggesting that all groups learned the task. A significant interaction between OVX and time was detected [F(4,128) = 4.31, p = 0.0026]; the OVX groups started to learn the task a bit later, as day 2 was not significantly different from day 1 in contrast to Sham-operated groups. Moreover, during days 4 and 5, the OVX groups differed significantly from the Sham-operated ones [F(1,32) = 6.09, p = 0.0191], suggesting a flatter learning curve. Additionally, the fluctuation observable in the 3xTg-AD-OVX group suggests random choice, thus, not appropriate learning of this group. The genotype also showed a tendency for time dependence [F(4,128) = 2.18, p = 0.0744], with a subtle learning impairment of the 3xTg-AD mice. All the animals remembered the place of the platform as during the probe test they spent more than 25% of the time in the platform quadrant [single-sample t-test against 25; Control-Sham: t(7) = 2.14, p = 0.0701; Control-OVX: t(9) = 5.50, p = 0.0004; 3xTg-AD-Sham: t(6) = 6.12, p = 0.0009; 3xTg-AD-OVX: t(9) = 3.02, p = 0.0130]. No difference was found between groups in the probe day in the latency to reach the platform or time spent in the quadrant, where the platform was during the probe day (Figure 4C).
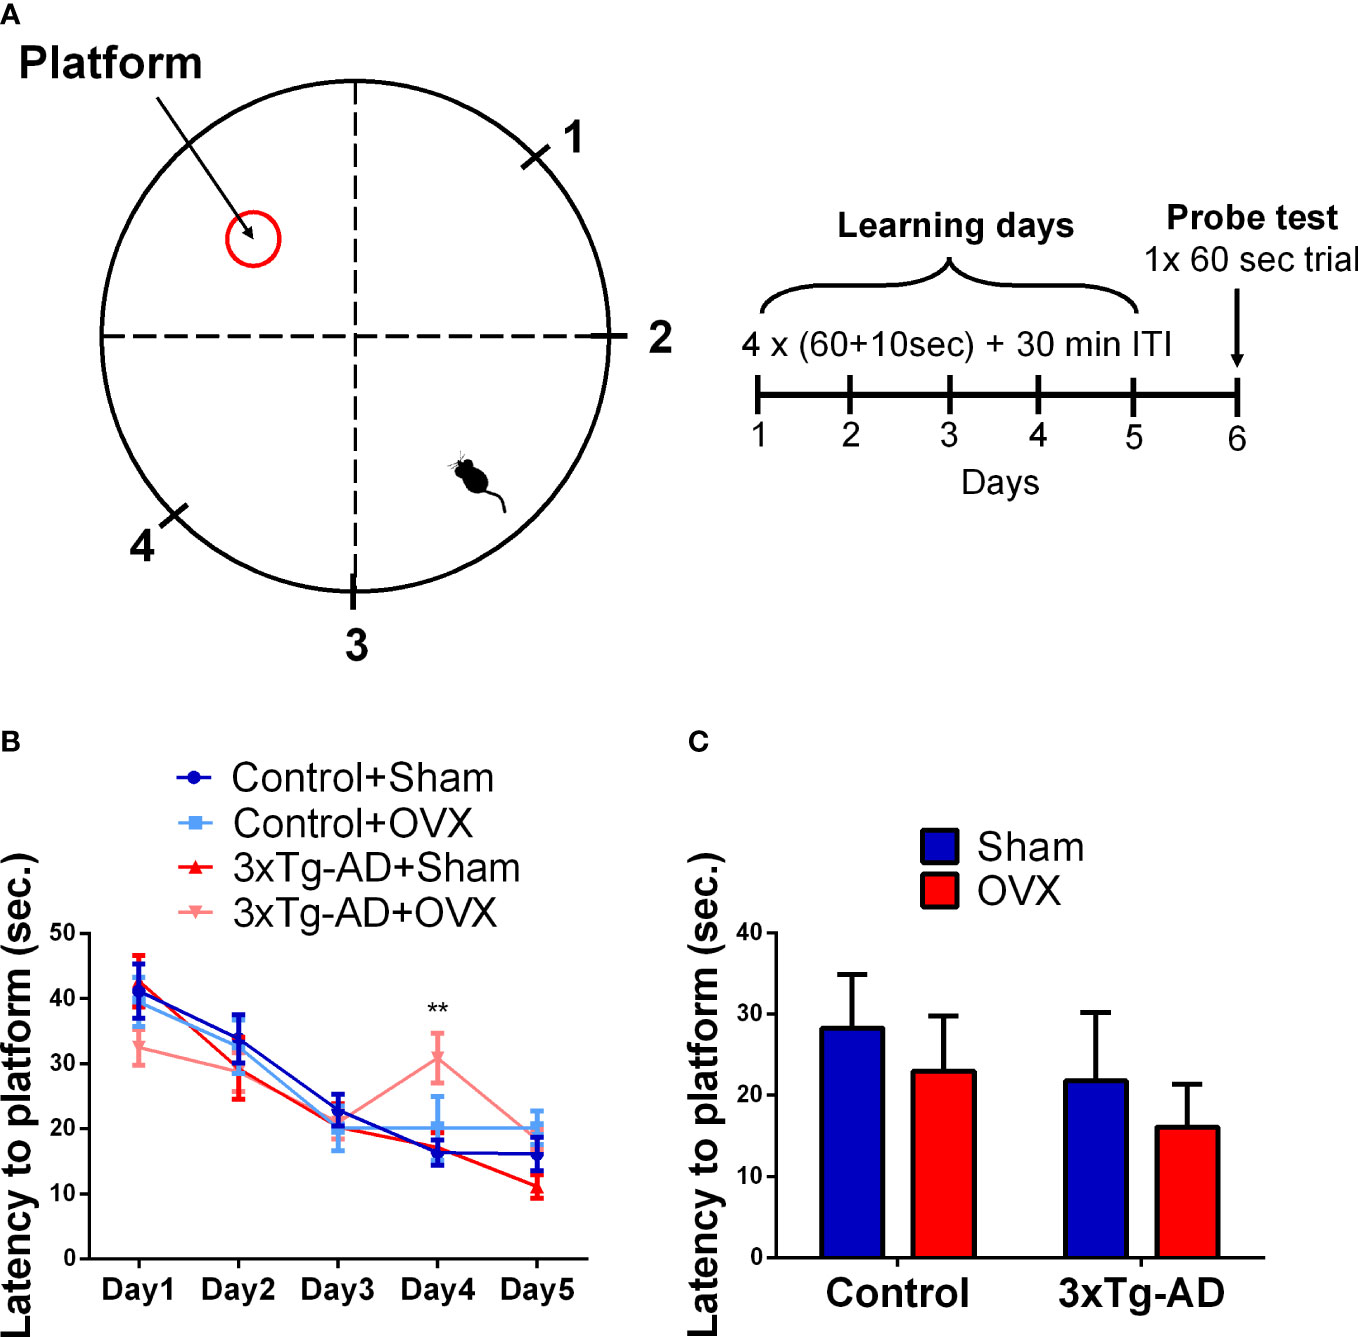
Figure 4 Morris water maze (MWM) test. (A) Representative figure of the MWM circular pool, with the location of the hidden platform, and the four starting points marked with 1–4. The learning phase consisted of 5 days; on each day, 4 × (60 + 10)-s trials were performed, with 30-min intertrial intervals (ITI). In the probe day (6th) one 60-s trial was done without the platform. (B) Latency to platform in seconds during the 5-day learning period. An improvement during the learning phase was seen in all groups (p < 0.0001). An interaction between OVX and time was detected, with a flatter learning curve of the OVX groups (p = 0.0004). (C) Latency to reach the platform on the probe day. No significant difference was found between the groups in the spatial memory. OVX, ovariectomy; 3xTg-AD, triple transgenic mouse model of Alzheimer’s disorder. Data are shown as mean ± SEM. **p<0,01.
3.2.1.4 Operant conditioning test
In reward preference, an improvement during time was detected [F(4,128) = 9.73, p< 0.0001] without any influence of the genotype or surgical removal of the ovaries (Figure 5B). In the number of rewarded responses, a similar time effect was seen [F(4,128) = 16.10, p< 0.001] (Figure 5C), with a tendency for genotype × OVX interaction [F(1,32) = 53.49, p = 0.0707]. There was a tendency for 3xTg-AD-Sham-operated animals to respond fewer times than Control-Sham-operated ones (p = 0.0794), while 3xTg-AD animals after OXV responded significantly more than the Sham-operated ones (p = 0.0407).
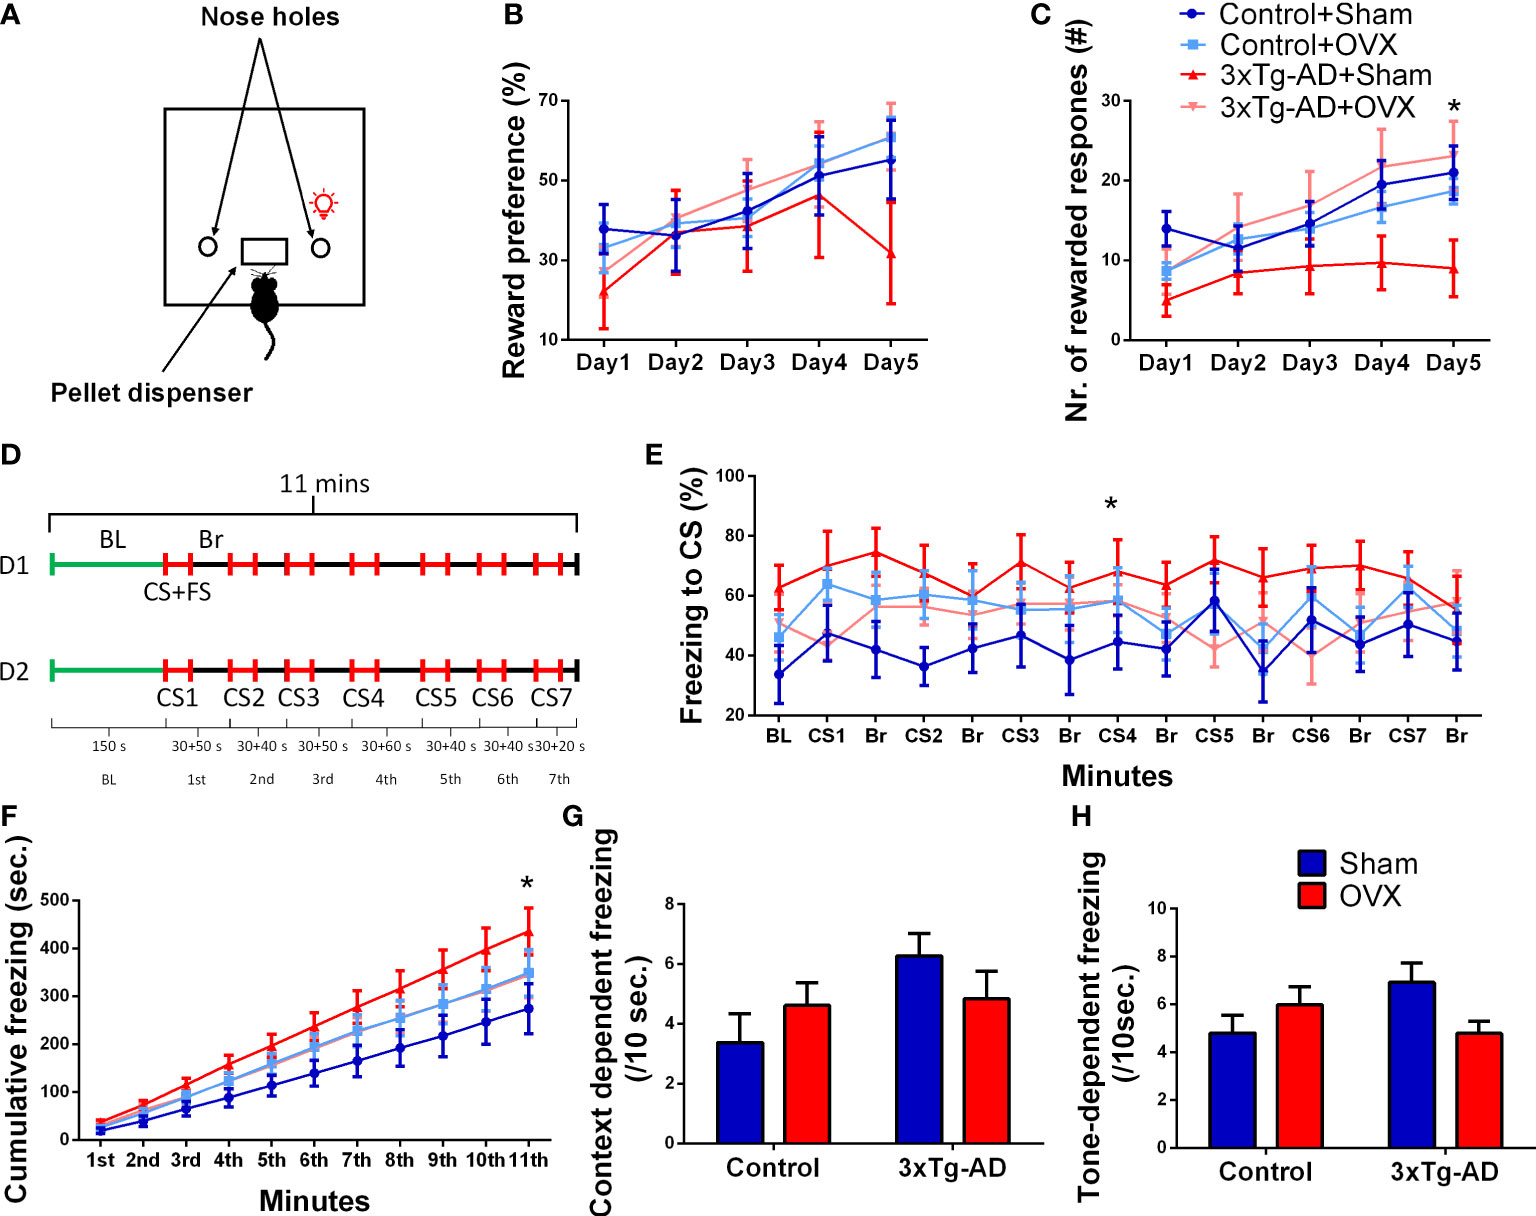
Figure 5 Operant conditioning (OC) and conditioned fear (CFT) tests. (A) Representative figure of the OC apparatus, with the light on above the reward associated nose hole. (B) Reward preference (ratio of responses on the rewarded vs. all nose pokes) during the OC test. An improvement during time was seen in all groups (p < 0.0001). (C) Number of rewarded responses during the OC test. Besides the time effect (p < 0.0001), a tendency for genotype × OVX interaction was also detected (p = 0.0707). 3xTg-AD animals after OXV responded significantly more than the Sham-operated ones (p = 0.0407). (D) Representative timeline of the 2 days (D1 and D2) lasting CFT test. D1 started with a 2.5-s baseline (BL) measurement, followed by a 30-s-long conditioned stimulus (CS: 80 dB pure tone at 7 kHz), which was co-terminated with an unconditioned stimulus [foot shock (FS): 0.7 mA, 1 s long, seven times in total], for a total of 11 min with random intertrial intervals (ITI, or break, Br). On D2, the experiment was repeated except that the animals did not receive an FS at the end of the CS. (E) Time spent freezing during CS and Br periods. For comparability, the values were calculated to 10-s bins. The AD × OVX interaction on CS meant that in the Control-Sham group, OVX aggravated, while in the 3xTg-AD group, the immobility was diminished (p = 0.0375). (F) The cumulative time spent in freezing (in 1-min bins) showed interaction between genotype, OVX, and time (p = 0.0005) with similar differences as seen on subgraph (E). (G) Context and (H) tone or CS-dependent freezing (/10 s) during CFT. Repeated-measures ANOVA on time showed a significant elevation in freezing after CS (p = 0.0075). Again, a tendency for genotype and OVX interaction was detected (p = 0.0531), mainly due to the differences during tone dependency (p = 0.0251). OVX, ovariectomy; 3xTg-AD, triple transgenic mouse model of Alzheimer’s disorder. Data are shown as mean ± SEM, *p < 0.05.
3.2.1.5 Conditioned fear test
We expressed the time spent in immobile posture during different phases as the percentage of the time period to get comparable values [i.e., the 150-s BL period is hardly comparable to the 30-s CS periods or random breaks (Br)] (Figure 5E). When we were concentrating on CS-induced changes, there was a significant interaction between the genotype and OVX [repeated-measures ANOVA on the seven CS: F(1,31) = 4.72, p = 0.0375]; the OXV increased freezing in control, but decreased in 3xTg-AD mice. The same effect was also seen in the cumulative time spent in freezing (in 1-min bins) (Figure 5F); not surprisingly this time, the interaction was significant between all three (genotype, OVX, and time) factors [F(10,320) = 53.26, p = 0.0005]. The time spent with inactivity during the initial context-dependent phase (BL, 150 s) (Figure 5G) and during the seven CS (conditioned phase, Figure 5H) was also calculated. Using repeated-measures ANOVA on context and cue-induced freezing, the CS, as a cue, significantly elevated the immobility time [F(1,32) = 8.16, p = 0.0075]. There was a tendency again for genotype and OVX interaction [F(1,32) = 4.03, p = 0.0531]. This was due to the significant interaction during tone-dependent freezing [F(1,32) = 5.53, p = 0.0251] (Figure 5H) as no difference was detectable in the context-dependent phase [F(1,32) = 3.12, p = 0.0871] (Figure 5G).
3.2.2 Anxiety-related behavioral tests
3.2.2.1 Elevated plus maze test
There was a significant interaction between genotype and OVX in the time spent in open arms [F(1,32) = 7.774, p = 0.0088], and in open arm preference [F(1,32) = 4.484, p = 0.0421] (Figures 6C, D), but no difference was detected in the time spent in the closed arm [time %; Control-Sham: 239.52 ± 9.99, Control-OVX: 250.09 ± 10.68, 3xTg-AD-Sham: 237.62 ± 14.09, 3xTg-AD-OVX: 260.13 ± 7.06; genotype: F(1,32) = 0.1554, p = 0.6961; OVX: F(1,32) = 2.569, p = 0.1188]. More specifically, Control-OVX animals spent less time in the open arm compared to the Control-Sham group (p = 0.0192), whose effect was not detectable in 3xTg-AD mice. In the locomotion parameters, similar to distance moved and the number of entries into the closed arms, no significant differences were detected between the groups (Figures 6E, F).
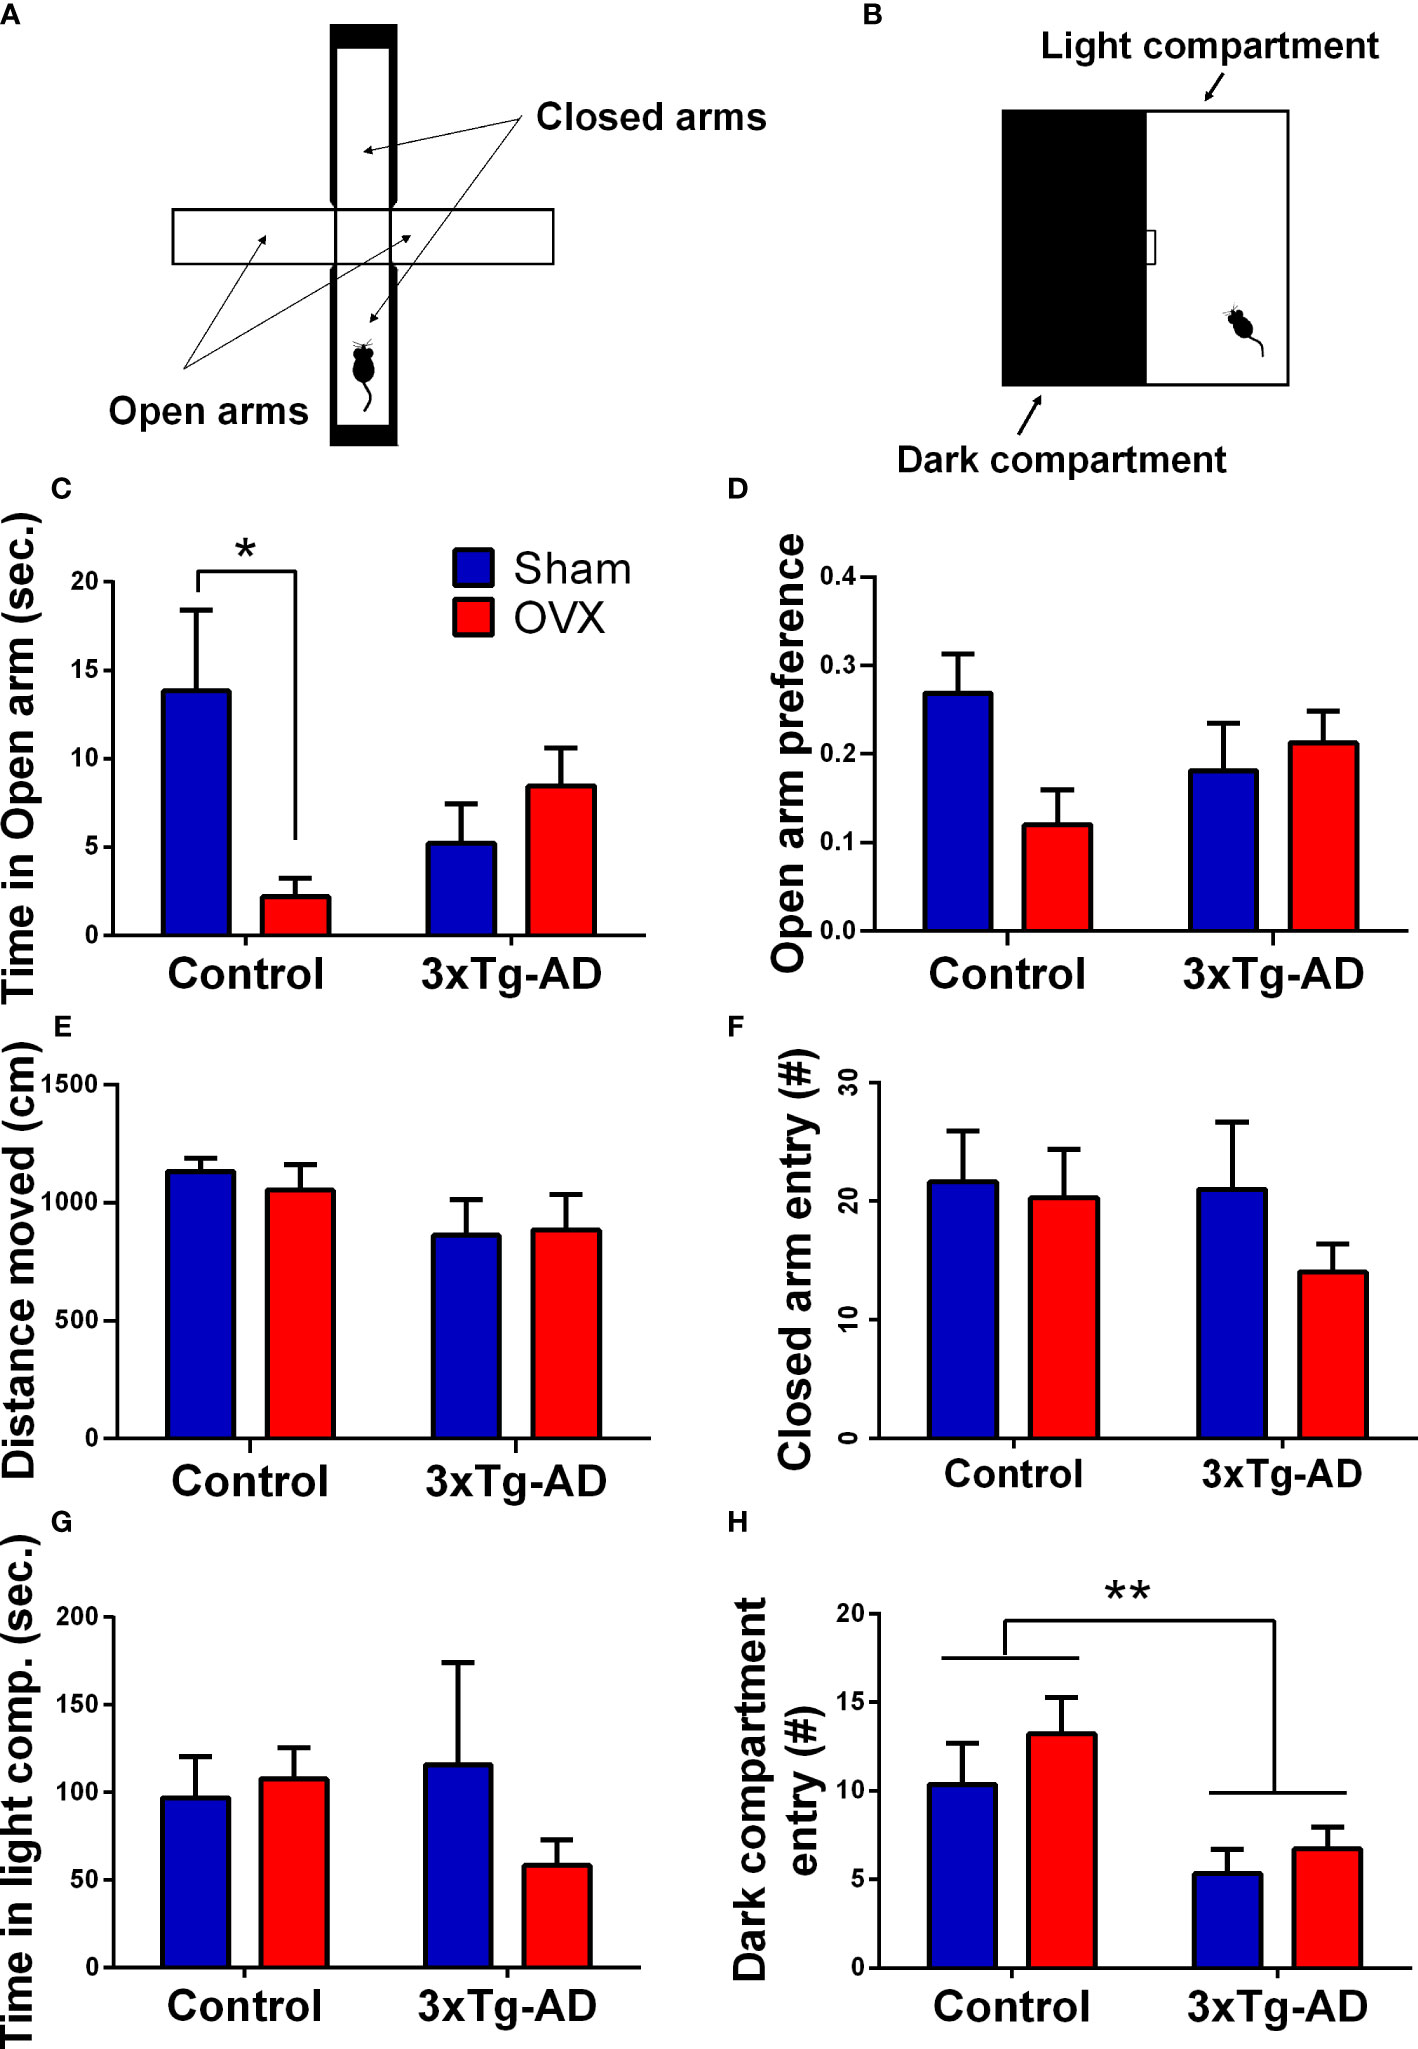
Figure 6 Elevated plus maze (EPM) and light–dark box (LD) tests. (A) Representative figure of the EPM apparatus, with two open and two closed arms. (B) Representative image of the LD equipment, with a light and a dark compartment, separated with a small gateway. (C) Time spent in the open arm of the EPM. A significant interaction between genotype and surgery groups was detected (p = 0.0088). Control-OVX animals spent less time in the open arm compared to Control-Sham ones (p = 0.0192). (D) Open arm preference in the EPM test. A significant interaction between genotype and surgery groups was seen (p = 0.0421). (E) Distance moved (cm) during the 5-min EPM test. No difference between the groups was detected. (F) Total number of entries into the closed arms in the EPM test. Differences between the groups were not significant. (G) Time spent in the light compartment during the LD test. No difference regarding genotype or OVX surgery was detected. (H) Number of entries in the dark compartment during LD test. 3xTg-AD mice moved significantly less, than controls (p = 0.0044), without any OVX effect. OVX, ovariectomy; 3xTg-AD, triple transgenic mouse model of Alzheimer’s disorder. Data are shown as mean ± SEM, *p < 0.05, **p < 0.01.
3.2.2.2 Light–dark box test
No differences were seen in the anxiety-related parameters like time spent in the light compartment (Figure 6G). However, in the locomotor activity represented by the number of entries to the dark compartment, a genotype effect was detected [F(1,30) = 9.80, p = 0.0039] (Figure 6H). 3xTg-AD animals moved significantly less than the controls.
3.2.2.3 Fox odor test
A tendency for decreased time spent in the odor zone was seen in the 3xTg-AD animals compared to the control groups [F(1,27) = 3.51, p = 0.0719] (Figure 7B). Accordingly, the 3xTg-AD animals spent more time freezing [F(1,31) = 25.33, p< 0.0001] (Figure 7C) and reared [F(1,31) = 7.15, p = 0.0118] (Figure 7E) and vertically explored the environment [F(1,31) = 22.48; p< 0.0001] (Figure 7D) less than controls. These may suggest that 3xTg-AD animals were more anxious in the presence of a predator odor. A tendency of genotype difference was also seen in the locomotor activity, expressed by the distance moved [F(1,31) = 3.46, p = 0.0723] (Figure 7F). Other parameters (like grooming and sniffing) were not different between groups and thereby not shown. The OVX surgery had no significant effect on the parameters examined during FOT.
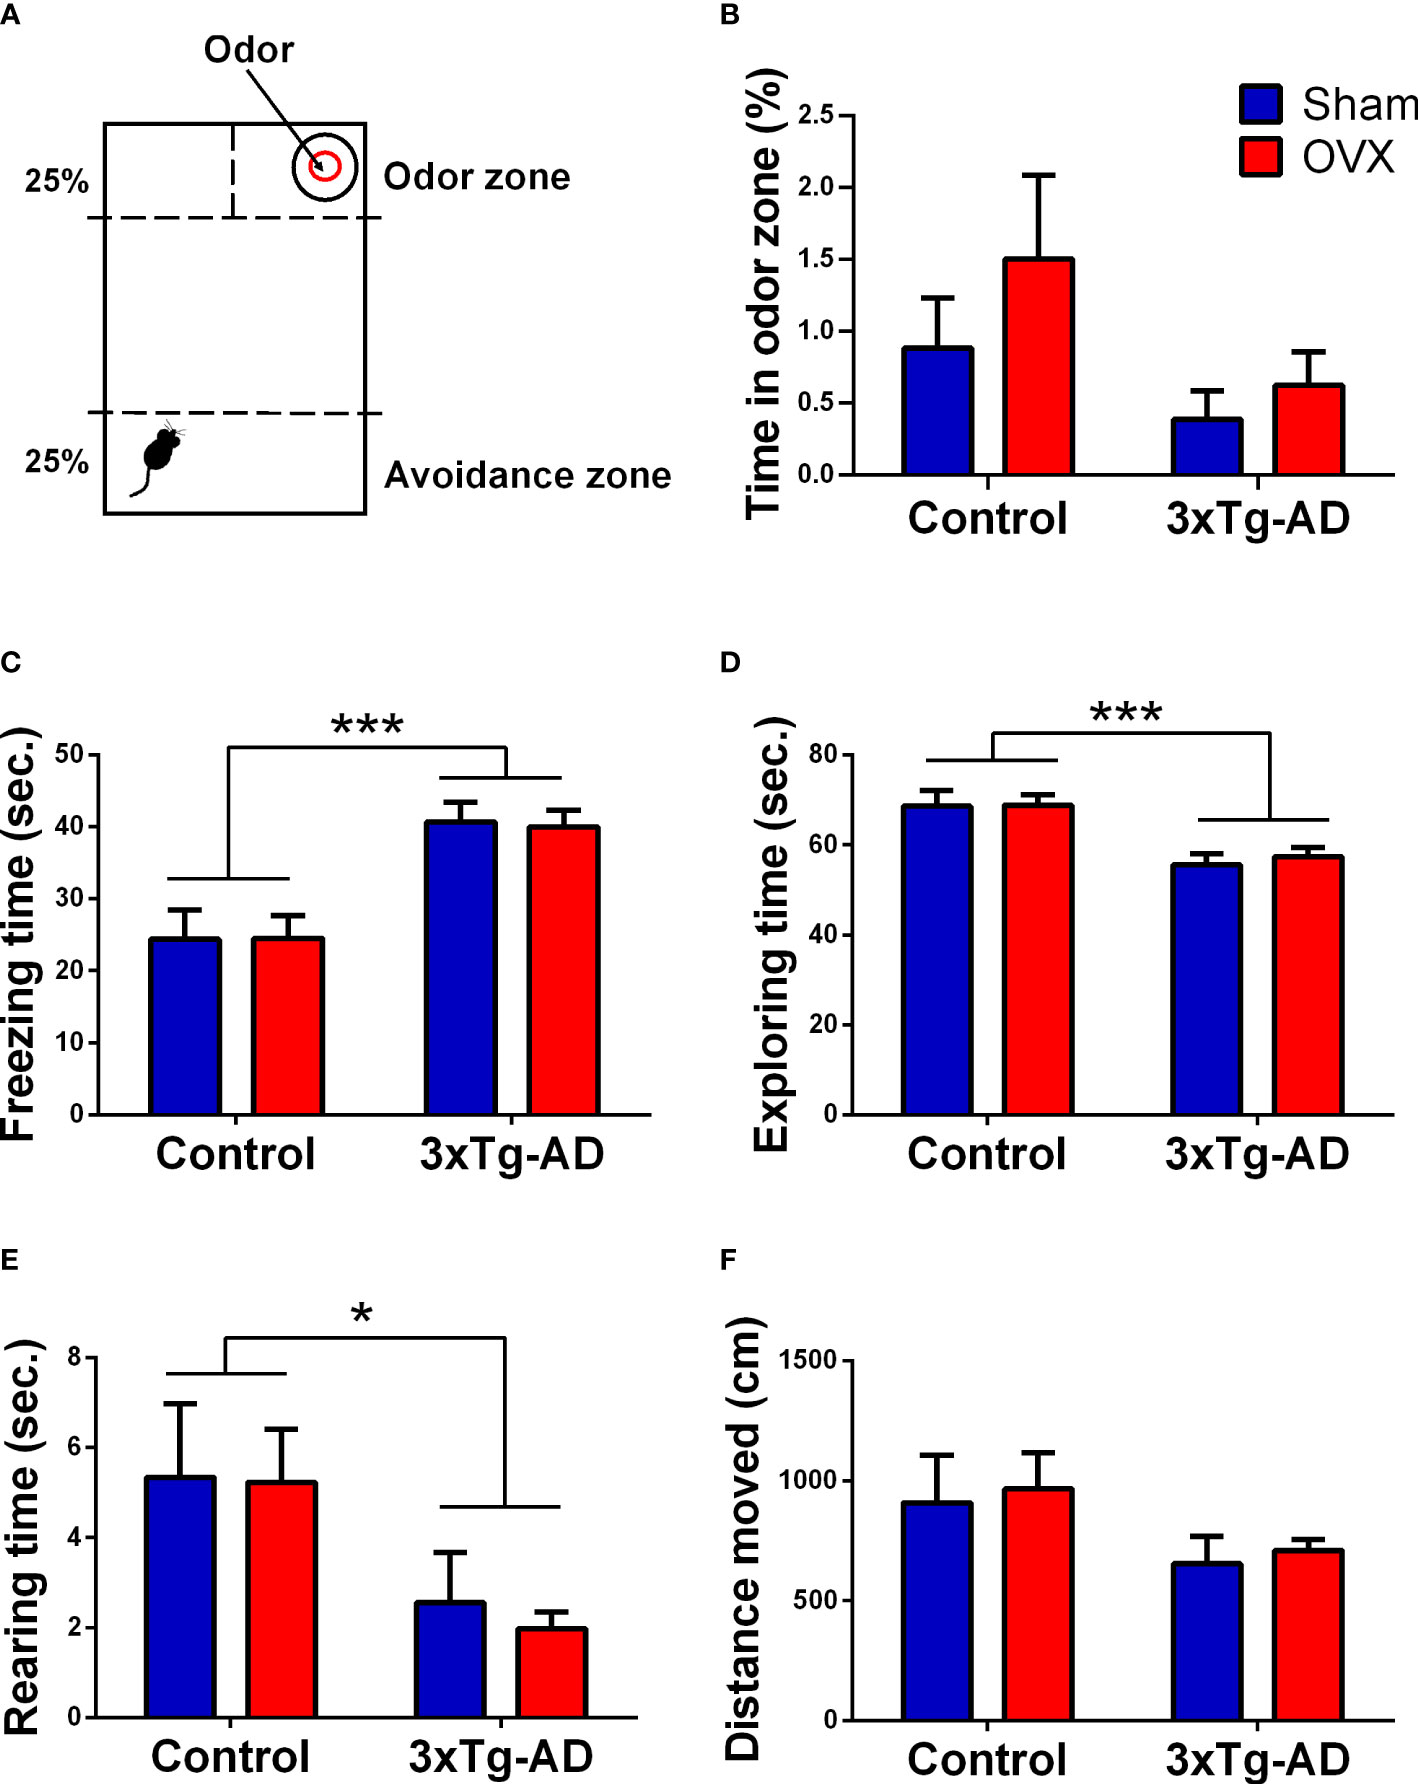
Figure 7 Fox odor test (FOT). (A) Representative figure of the FOT apparatus, presented with the odor zone [where the 2-methyl-2-thriazoline (2MT, fox odor) was placed] and the avoidance zone (distant part from the odor). (B) Time (in seconds) spent in the odor zone. No significant difference between genotypes or between surgery groups was detected. (C) Time (in seconds) spent freezing. 3xTg-AD mice spent more time freezing compared to control groups (p < 0.0001). (D) Time (in seconds) spent exploring the FOT box. The 3xTg-AD group showed reduced exploration time compared to controls (p < 0.0001). (E) Time (in seconds) spent rearing. A genotype effect was visible with less vertical movement in 3xTg-AD animals (p = 0.0118). (F) Distance moved (cm). A tendency for genotype difference was seen, with the 3xTg-AD mice moving less than controls (p = 0.0723). OVX, ovariectomy; 3xTg-AD, triple transgenic mouse model of Alzheimer’s disorder. Data are shown as mean ± SEM, *p < 0.05, ***p < 0.001.
3.3 Z-scores
The somatic z-score showed a significant interaction between genotype and surgery groups [F(1,32) = 41.35, p < 0.0001] (Table 2). Animals who underwent OVX surgery had a higher somatic z-score [F(1,32) = 12.92, p = 0.0010], whose effect was more pronounced in Control than in 3xTg-AD mice. In cognitive z-score, no significant differences were detected between the groups. Anxiety z-score showed an interaction between genotype and surgery groups [F(1,32) = 23.26, p < 0.0001]. Namely, OVX increased anxiety in Control, but decreased in 3xTg-AD animals. Indeed, in general, 3xTg-AD animals had a lower anxiety z-score, meaning more anxious behavior [F(1,32) = 17.61, p = 0.0002]. The locomotor differences were also supported by its z-score. Namely, the 3xTg-AD animals had a lower z-score number, meaning, in general, they moved less [F(1,32) = 19.64, p = 0.0001]. A significant interaction between genotype and surgery groups was also detected [F(1,32) = 27.45, p < 0.0001]. More specifically, OVX reduced locomotion in Control, but not that much in 3xTg-AD mice, which was moving less even before that.
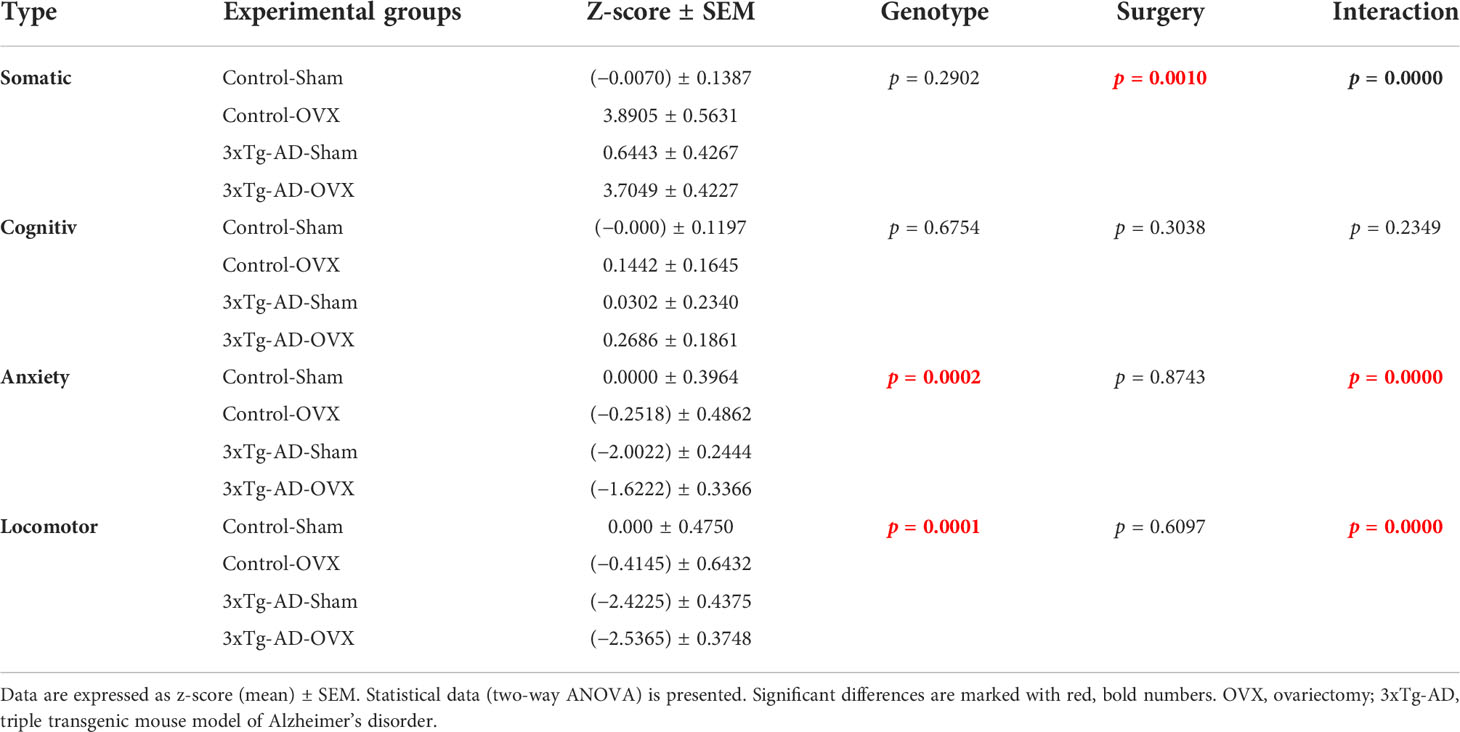
Table 2 Z-scores calculated from somatic, cognitive, anxiety, and locomotor parameters.
3.4 Histological evaluations
3.4.1 Uterus
The representative pictures with HE staining showed increased epithelium thickness, deteriorated endometrial glands, and a substantial difference between the size of the uterus and lumen (Figure 8A). Both in the control and 3xTg-AD groups, the normalized weight of the uterus was significantly lower after OVX compared to the Sham group [F(1,31) = 121.80, p< 0.0001] (Figure 8B).
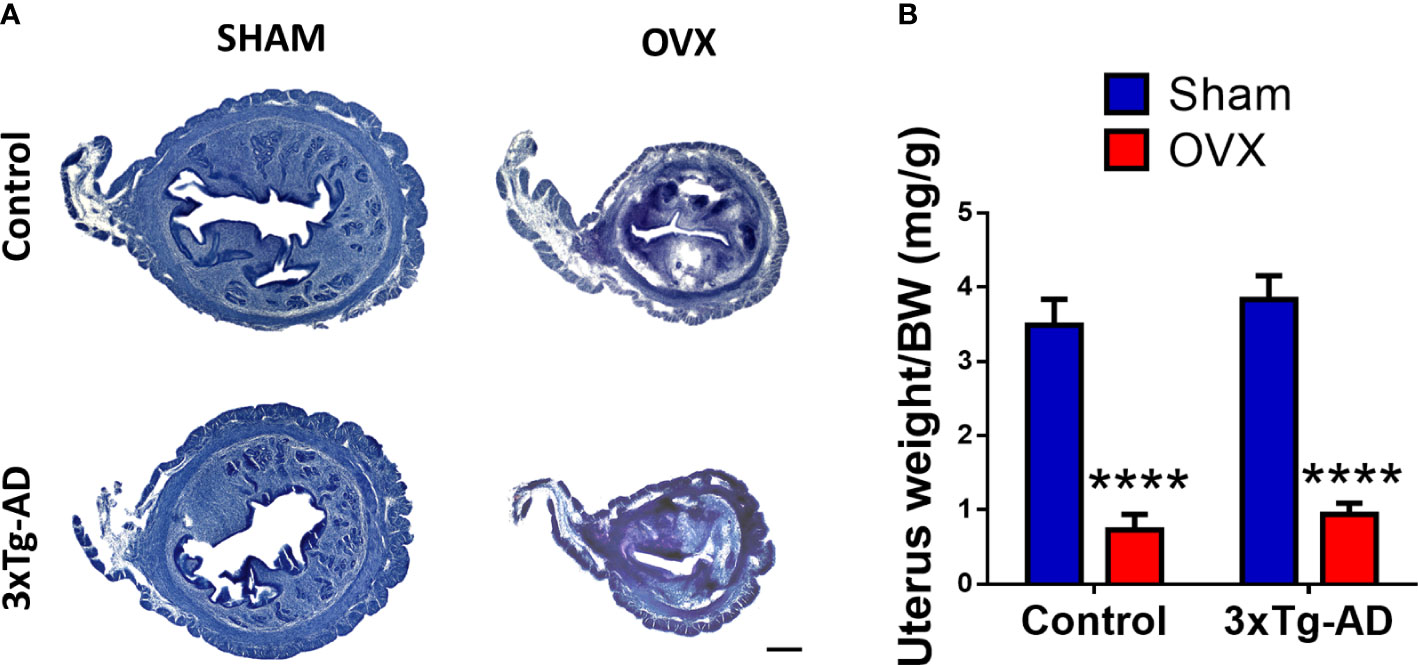
Figure 8 Changes in the uterus 2 months after Sham or OVX surgery. (A) Representative figure of the uterus stained with hematoxylin–eosin (HE). A decrease in size and epithelial layer thickness, and damaged integrity of the endometrial glands is visible. (B) Uterus weight normalized to the body weight (BW) of the animals. A significant decrease was seen after OVX surgery (p < 0.0001). OVX, ovariectomy; 3xTg-AD, triple transgenic mouse model of Alzheimer’s disorder. Data are shown as mean ± SEM, ****p < 0.0001. Scale bar, 200 µm.
3.4.2 Amyloid-β accumulation in different brain areas
Amyloid-β plaques were only quantified in 3xTg-AD mice, because no deposition was detected in the Control-Sham or Control-OVX groups (see Supplementary Figure 1). In the BLA, the 3xTg-AD-OVX mice had significantly more plaques than their Sham-operated mates [t(9) = 2.72, p = 0.0236] (Figures 9B, C). In the CTX and CA1-HC, no significant effect of OVX was found (Figures 9D–G).
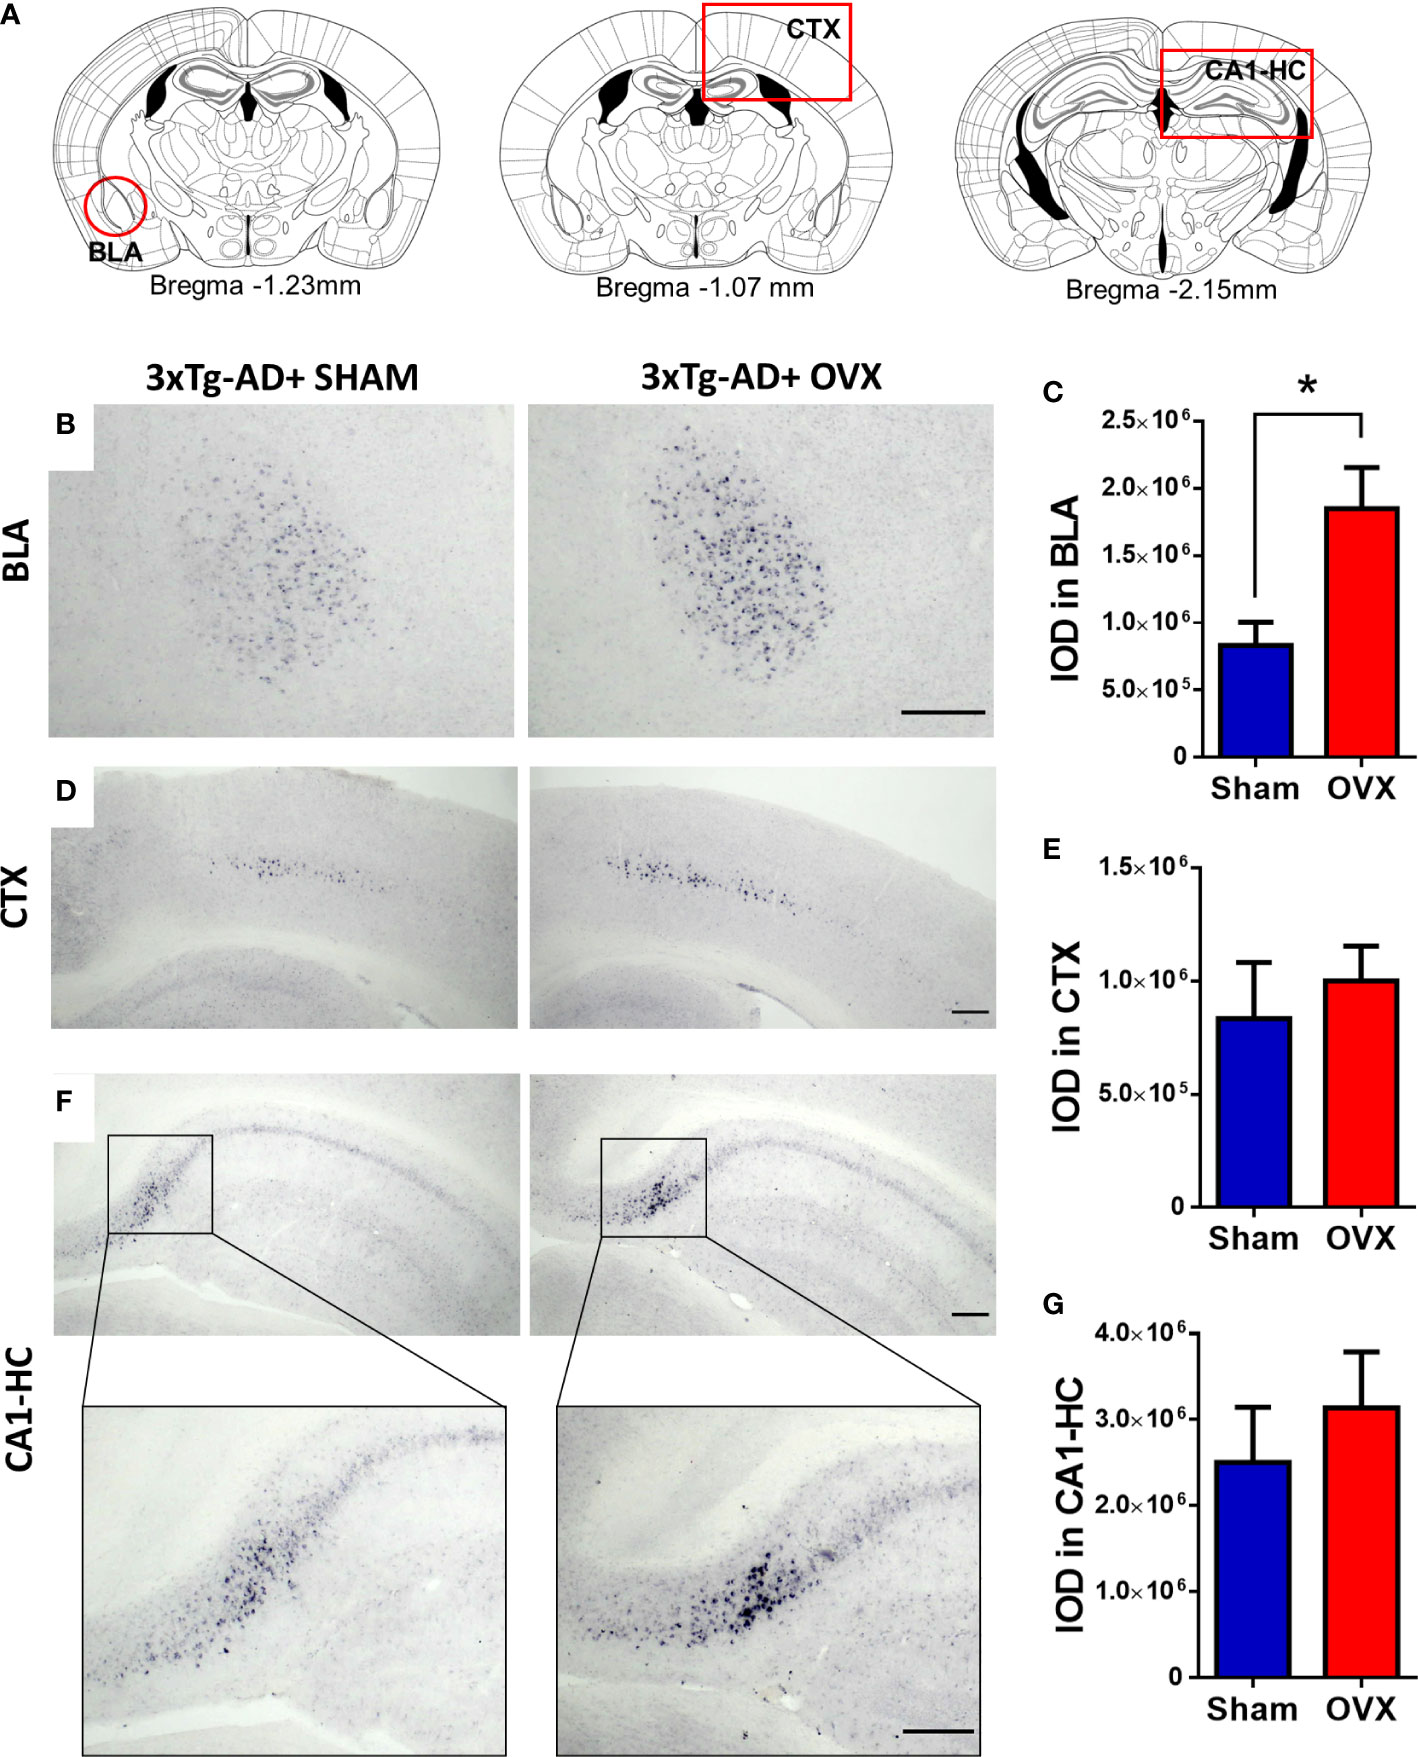
Figure 9 Immunohistochemical staining (NiDAB) of amyloid-β1-42 (Aβ) plaques in different brain regions. There was no Aβ signal detectable in the brain of control animals; therefore, we compared 3xTg-AD with and without ovariectomy (OVX). (A) Representative figures based on the Paxinos Mouse Brain atlas (4th Edition) about the brain regions of interest, framed with red: Basolateral amygdala (BLA), at Bregma −1.23 mm, Motor and somatosensory cortex (CTX) at Bregma −1.07 mm, and CA1 hippocampal region (CA1-HC) presented at Bregma −2.15 mm. (B) Representative pictures of Aβ plaques in the BLA of the 3xTg-AD animals after Sham or OVX surgery. (C) The integrated optical density (IOD) of Aβ plaques measured in the BLA. A significant increase was detected after OVX surgery (p = 0.0236). (D) Representative pictures of Aβ plaques in the CTX in 3xTg-AD animals after Sham or OVX surgery. (E) The IOD of Aβ plaques measured in the CTX. No significant difference was detected. (F) Representative pictures of Aβ plaques in the CA1-HC of 3xTg-AD animals after Sham or OVX surgery, with a close-up to a small part of the CA1 region. (G) The IOD of Aβ plaques measured in the HC. The difference between the two surgery groups was not significant. 3xTg-AD, triple transgenic mouse model of Alzheimer’s disorder. Data are shown as mean ± SEM, *p < 0.05. Scale bar: 200 µm.
3.4.3 Morphological changes in the cholinergic system
ChAT-positive cells were counted in the NBM region. We found no difference in the number of the cells between 3xTg-AD and control animal, neither in Sham-operated nor in OVX groups (Figure 10C). However, the AChE fiber density was significantly decreased in 3xTg-AD animals [F(1,22) =29.49, p< 0.0001], with a significant interaction between genotype and OVX [F(1,22) = 11.61, p = 0.0025]. In 3xTg-AD mice, OVX surgery exacerbated the fiber loss compared to the Sham group (p = 0.0147) (Figures 10B, D).
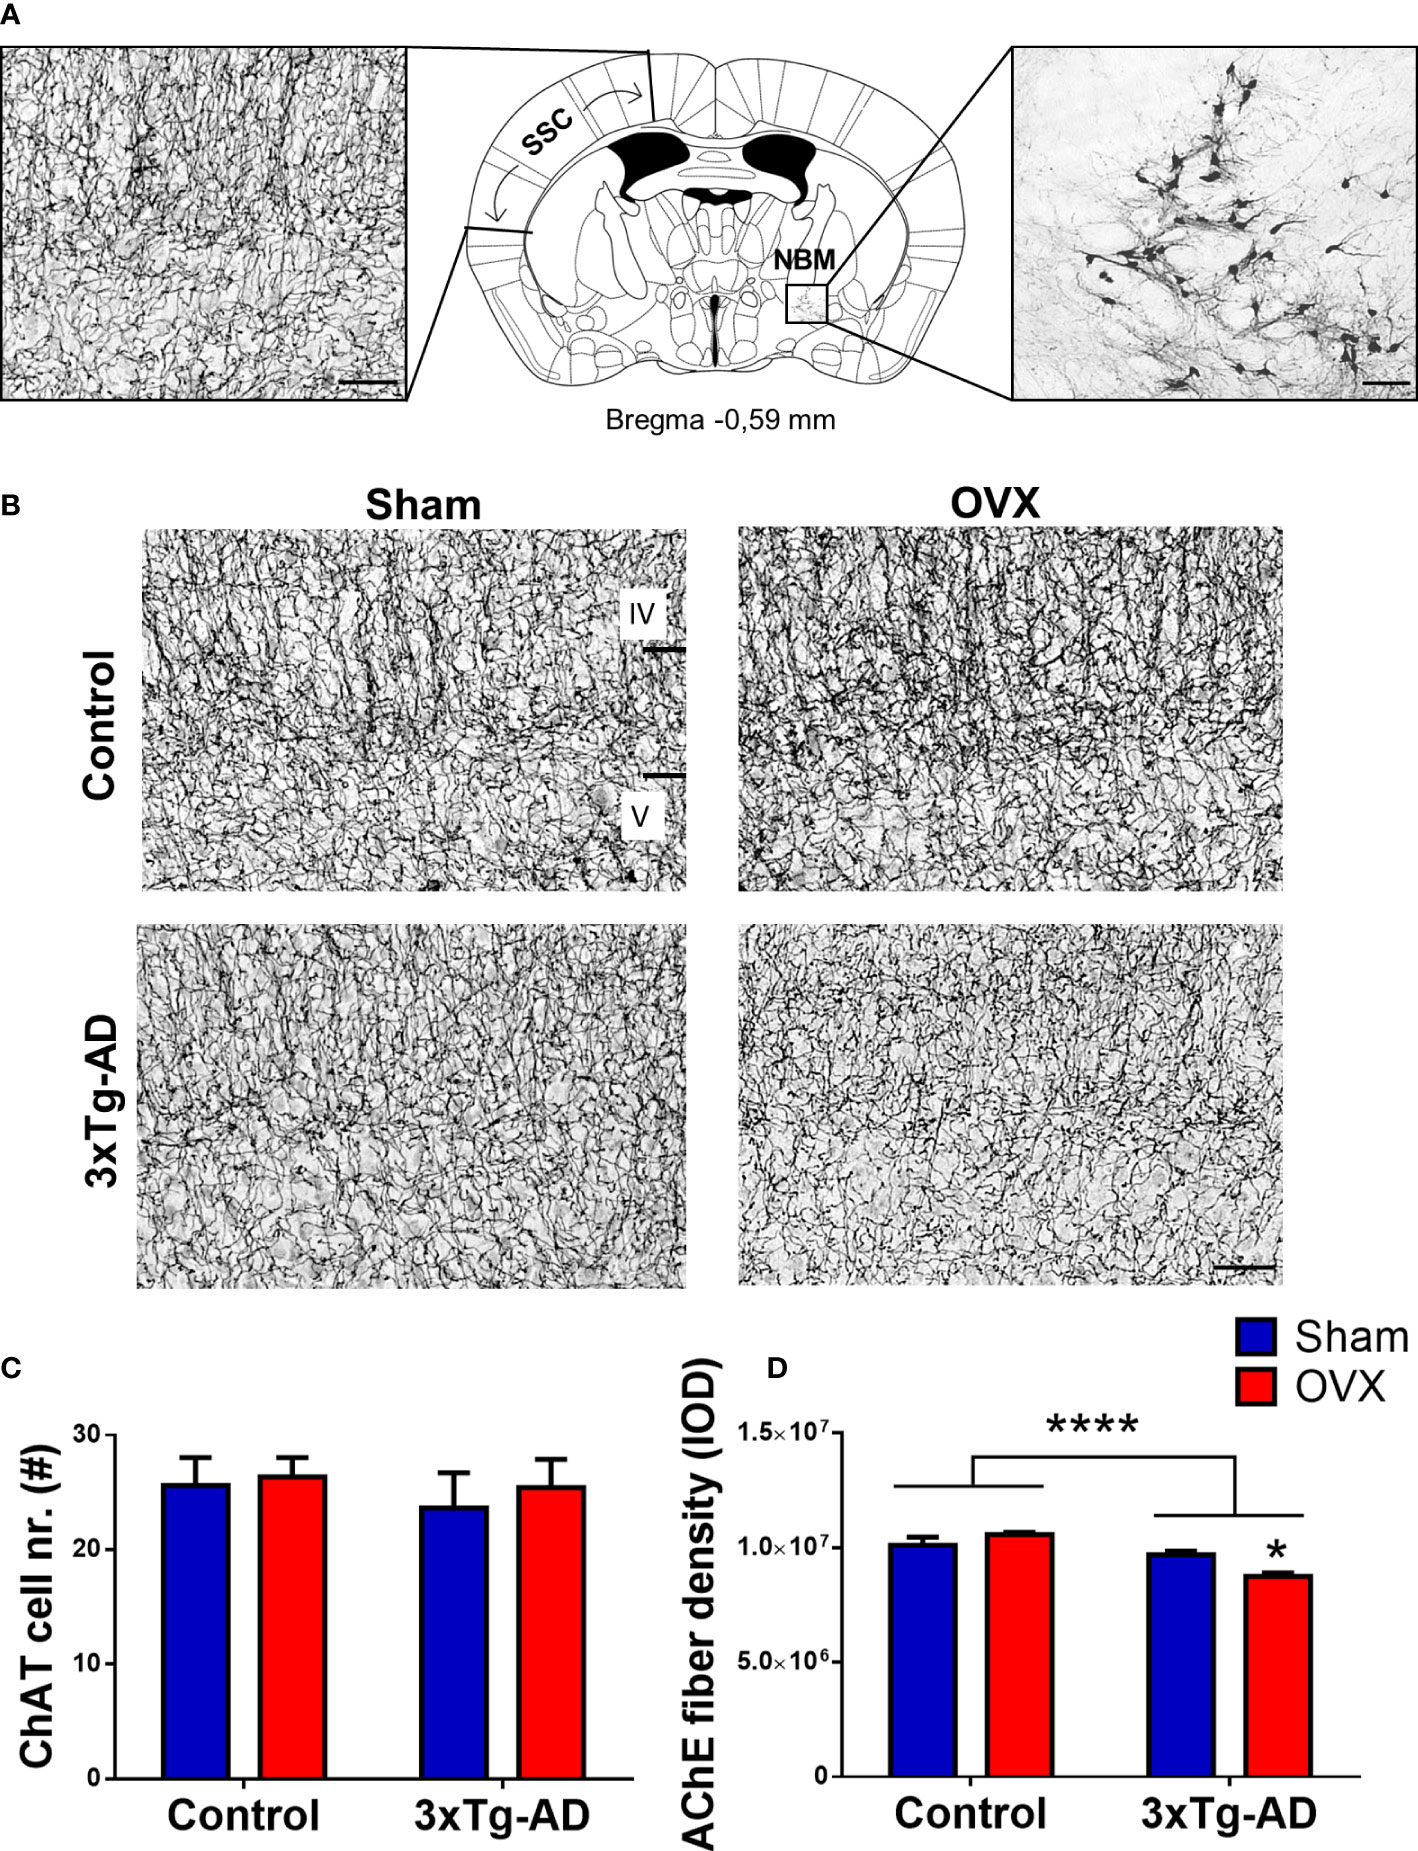
Figure 10 Immunohistochemical and histochemical staining of the cholinergic cell bodies and fibers. (A) Neuroanatomical location of the cholinergic choline-acetyltransferase (ChAT)-positive neurons in the nucleus basalis magnocellularis (NBM) and their acetylcholinesterase (AChE)-positive fibers in the somatosensory cortex (SSC). Schematic coronal brain section was adapted from Franklin and Paxinos (4th Edition) Mouse Brain atlas. (B) Representative pictures of the AChE-positive fibers in layers IV and V of SSC. Black bars indicate layers IV and V of the SSC. (C) Number of ChAT-positive cell bodies in the NBM region, stained with NiDAB immunohistochemistry. No significant difference was detected between groups. (D) AChE-positive fiber density measured in the SSC, expressed in integrated optical density (IOD). 3xTg-AD mice have a lower AChE fiber density compared to controls (p < 0.0001), with a significant interaction between groups (p = 0.0025). The decrease in density was exacerbated by OVX surgery in the 3xTg-AD group (p = 0.0147). OVX, ovariectomy; 3xTg-AD, triple transgenic mouse model of Alzheimer’s disorder. Data are shown as mean ± SEM, *p < 0.05, ***p < 0.001. Scale bar: (A) AChE staining in the SSC, 50 µm, and ChAT staining in the NBM, 100 µm. (B) 50 µm.
4 Discussion
In contrast to our hypothesis, OVX did not aggravate the appearance of AD-related symptoms in the cognitive behavioral tests, but in morphological examinations, signs of neurodegeneration were visible (see amyloid deposition in the BLA, and cholinergic fiber density in the SSC). Table 3 contains the summary of the changes.
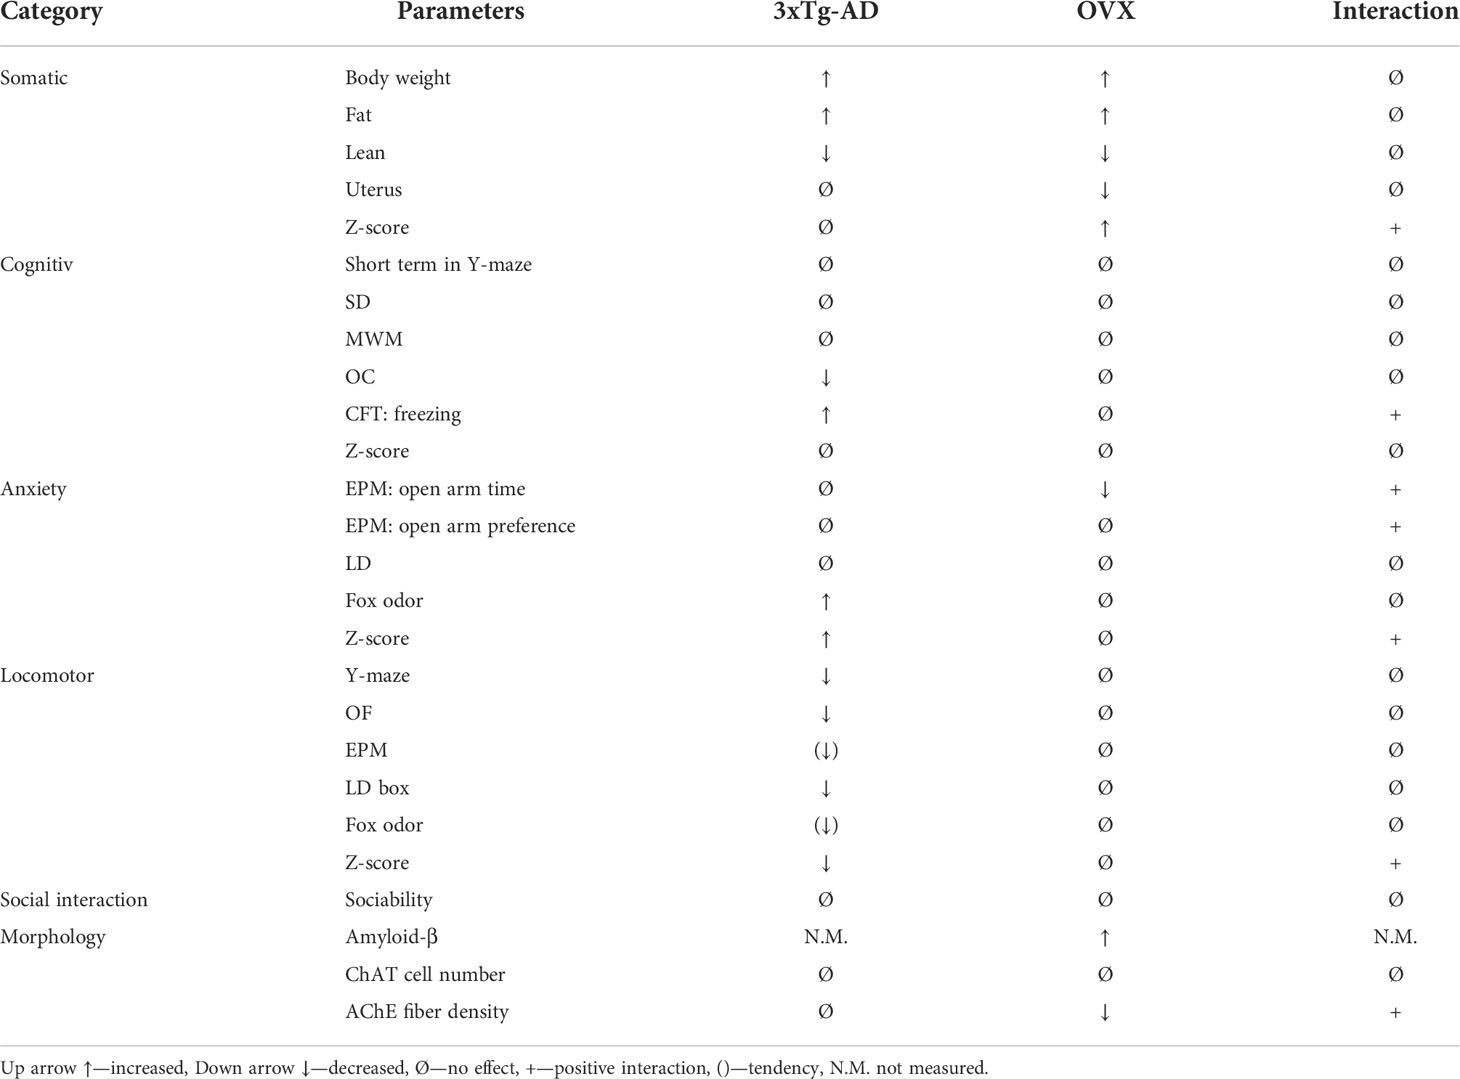
Table 3 Summary table of the main effect of genotype, OVX surgery, and interaction between the two parameters in the different procedures.
We confirmed that our model worked, as OVX induced the expected increase in body weight with fat accumulation as well as decrease in uterus weight and lean body percentage. The lack of sexual steroids can cause an increased risk for obesity, since E2 and PG also mediate glucose and lipid metabolism, and also affects adipocyte physiology (54, 82, 83). Indeed, in human studies, an increased visceral fat mass can be seen on women after menopause (84, 85). This is supported in mice by our MRI findings, where the body fat ratio of the OVX groups increased. Importantly, obesity is a prominent risk factor for AD: increasing Aβ plaques, adipokines, and cytokines, and effecting insulin homeostasis [reviewed in (86–88)]. Thus, this might be associated with how OVX might aggravate the development of AD-like symptoms. In support, 3xTg-AD animals per se were fatter and greasier, suggesting—together with the OC data—some metabolic disturbances, which require further studies. In contrast, after OVX, the weight of the uterus decreased, which can be explained by the estrogen deficit. Indeed, E2 has a proliferative effect on the uterus; hence, its lack causes hypotrophy (55, 89, 90). In future studies, luteinizing hormone measurements can help better understand the effect of OVX on the hypothalamic–hypophyseal–gonadal axis and their role in the development of AD (91–93). The MRI data also showed a decreased body lean ratio in the OVX groups, which may be the prodrome of a most common problem in menopausal patients, osteoporosis. Indeed, female sex hormone depletion was linked closely to low bone mineral density (94). Estrogen receptors can be also found in the bone, mediating protection of the bone structure, by inhibiting osteoclast activity and stimulating development of long bones and pubic epiphyses (94–96). The OVX-induced somatic changes presented in the literature were also supported by the somatic z-score, calculated from the body weight change, body fat ratio, and uterus weight. Interestingly, the OVX-induced changes were smaller in 3xTg-AD mice (see genotype × OVX interaction in somatic z-score).
As the major symptom of dementia is the cognitive decline, we evaluated five different memory tests to have a comprehensive picture. They measure different modalities [spontaneous exploration (Y-maze), social stimulus, simple association-based reward (OC) or punishment (CFT), or even complex association based on spatial memory (MWM)]. The cumulative effect (z-score) was very similar to the single tests, with overall ineffectiveness of the genetic deletion in the 3xTg-AD animals as well as the OVX. According to the literature, 3xTg-AD animals develop memory loss after 6 months (36, 38). Hence, for our animals that were between 4 and 5 months old, the results are not unexpected. However, we could not support our hypothesis, as the OVX did not aggravate the cognitive decline (no OVX effect was detected whatsoever). Even the tendencies for learning impairment in MWM were detected separately for OVX and AD without any interaction. The only genotype × OVX interaction in cognition was seen during the CS-induced freezing in CFT, when OVX aggravated the symptoms in Control, but decreased in 3xTg-AD animals. Although we used CFT as an associative learning and memory test (97), its result strongly depends on the animal’s anxiety state (98). Indeed, these CFT results were very similar to the anxiety z-score data. The intact memory can also be explained by the lack of Aβ deposition in the hippocampus and cortical areas (99, 100). We might assume that more time is needed for the development of the symptoms; therefore, investigating memory deficit would be informative with older animals only even after OVX (101).
Anxiety is a core symptom of postmenopausal women (102), as well as might be comorbid with AD (103). However, anxiety symptoms remain largely unexplored, despite the significant impact on quality of life, if not diagnosed and treated (102). As anxiety is associated with both AD and OVX (23), we assumed that both interventions will increase its level in mice, with a possible synergistic effect. However, we found a significant anxiogenic effect of OVX in EPM only, the most frequently used anxiety test (64, 104). On the contrary, an AD effect was visible in the FOT test measuring innate fear and anxiety-related behavior (75). We found that 3xTg-AD animals spend more time freezing, which suggests that these animals were more frightened (75, 105). Also, 3xTg-AD animals spend less time exploring and rearing, which might reflect anxiety, too (see immobility in CFT) (106). Nevertheless, these findings may be related to the increased Aβ deposition in the BLA (Figure 9), as this region is responsible for formation of fear-related responses and can be linked to anxious behavior (105, 107–109). The increased overall anxiety z-score of 3xTg-AD animals coincides with the increased anxiety in human AD patients (110, 111).
Moreover, the locomotor activity shown by the different behavioral tests (distance moved in EPM, OF, and FOT; total number of entries in the Y-maze; and number of entries to closed arms or dark compartment in EPM and LD) and the locomotion z-score calculated from these parameters showed a difference between the two genotypes with lower levels in 3xTg-AD animals. In line with previous results, this decreased locomotor activity may reflect anxious behavior. However, we cannot close out a moderate motoric disabilities as well (112, 113). The decrease in movement can be related to the presence of Aβ in the motoric and somatosensory cortex (Figure 9) (114). Nevertheless, in line with an anxious phenotype, OVX also decreased locomotion, which was mainly detectable in controls. In support, volcano mice presented a scalloped pattern of daily activity during the estrous cycle and OVX reduced the total movement (115). Moreover, in estrogen receptor knockout mice (on C57BL6 background), E2 injection to OVX animals increased total activity and amplitude (116). The smaller effects in the AD model might be due to the already low levels, which cannot be easily decreased further.
Despite subtle behavioral changes, morphological changes were more equivocal. Namely, Aβ plaques, one of the most characteristic morphological changes of AD (99, 117), appeared only in 3xTg-AD animals; however, we could detect their presence already around 5 months. Although we expected that OXV alone will lead to the appearance of pathological hallmarks in control animals, in humans, OVX induced behavioral and morphological changes only in the elderly or those having genetic mutations [e.g., ApoE-4 genotype (118–120)]. In line with this, OVX was able to increase the number of amyloid plaques in the 3xTg-AD animals, further increasing the translational values of our model. However, we detected changes in the BLA, but not in the HC and CTX. We have to note that in much older animals, OVX-induced Aβ formation was found also in the CTX and HC (121–123). Thus, BLA might be a sensitive area, where changes occur earlier than in other parts of the brain. It is known that stress, i.e., glucocorticoids, increases excitability of BLA, while E2 decreases it (124). Thus, in our hands, repeated testing, as a stressor, as well as E2 decline due to OVX, might have promoted the stress sensitivity of BLA (125, 126). In support of the E2 effect, the replacement of the hormone after OVX can decrease the number and density of Aβ plaques in rodents (25, 100, 121). This is also in line with human studies, where OXV patients were treated with hormone replacement therapy, resulting in no difference in Aβ deposition (120). These differences (namely, age, genetic predisposition, and hormone replacement) might be the cause of the controversy in the literature on OVX-induced amyloidosis in the brain reported to be missing by some (120, 127) or increased by others (13, 128–130). However, Palm et al., also using 3xTg-AD mice, showed no difference after E2 treatment in Aβ deposition (123), while Carroll et al. (121) used PG to reduce the p-Tau accumulation in the CA1 region of the hippocampus, subiculum, and frontal cortex.
The novelty of our study is that we included more behavioral tests and examined the cholinergic system as well. The importance of the cholinergic system in AD is outstanding, being the target of almost all the drugs in the market (131, 132). Thus, we decided to examine the cell numbers in the NBM (133), and their projections to the SSC (79). In the ChAT-positive cell numbers, no difference was found in 5-month-old mice, probably because of their young age. However, AChE-positive fiber degeneration was detected in 3xTg-AD mice and even aggravated after OVX, suggesting that axonal and dendritic degenerations start earlier than behavioral decline (114, 134).
Our study has certain limitations. First, we used standard diet, and phytoestrogens might have influenced the outcome. Next, we did not monitor the cycle, and the cyclic changes might increase variability in Sham-operated groups. Furthermore, to keep the number of used animals as low as possible, we used repeated testing, which might influence each other’s results. For some tests, more animals/group might have been required to see statistically significant differences.
All in all, we confirmed that OVX induced menopausal symptoms and removal of the sexual steroids aggravated the appearance of AD-related alterations in the brain without significantly influencing behavior. Thus, the OVX in young, 3-month-old 3xTg-AD mice might be a suitable model for testing the effect of new treatment options at the structural level, which can speed up testing (it is not necessary to wait 6–12 months for the animals to age). However, to reveal any beneficial effect on behavior, a later time point might be needed.
Data availability statement
The raw data supporting the conclusions of this article will be made available by the authors, without undue reservation.
Ethics statement
The animal study was reviewed and approved by Local committee of animal health and care and Baranya Country Office for Animal Welfare (PE/EA/918-7/2019).
Author contributions
Conceptualization, DZ; methodology, SF, AS, BT, CS, CF, KB, PC, and TC; investigation, SF, AS, BT, CS, CF, KB, PC, and TC; validation, DZ; formal analysis, SF, AS, BT, CS, and CF; writing—original draft preparation, SF, AS, BT, CF, and DZ; writing—review and editing, CS, KB, PC, and TC; visualization, SF, AS, BT, CS, CF, and DZ; supervision, DZ; project administration, DZ; funding acquisition, DZ. All authors have read and agreed to the published version of the manuscript.
Funding
This study was supported by the National Research Development and Innovation Office of Hungary (grant numbers K141934, K138763, and K120311) as well as by the Thematic Excellence Program 2021 Health Sub-programme of the Ministry for Innovation and Technology in Hungary, within the framework of the TKP2021-EGA-16 project of the Pécs of University. The agencies had no further role in study design, and in the collection, analysis, or interpretation of the data.
Acknowledgments
We thank all the core facilities of our institute for their supportive help: the Behavioral Studies Unit for help with behavioral testing (Dr. Kornél Demeter), the Nikon Microscopy Center for help with microscopy (Dr. László Barna and Dr. Pál Vági), the Virus Technology Unit and the Medical Gene Technology Unit for help with mouse lines, and the Metabolic Phenotyping Unit (Dr Csaba Fekete) for the help by the MRI measurement.
Conflict of interest
The authors declare that the research was conducted in the absence of any commercial or financial relationships that could be construed as a potential conflict of interest.
Publisher’s note
All claims expressed in this article are solely those of the authors and do not necessarily represent those of their affiliated organizations, or those of the publisher, the editors and the reviewers. Any product that may be evaluated in this article, or claim that may be made by its manufacturer, is not guaranteed or endorsed by the publisher.
Supplementary material
The Supplementary Material for this article can be found online at: https://www.frontiersin.org/articles/10.3389/fendo.2022.985424/full#supplementary-material
Supplementary Figure 1 | Immunohistochemical staining (NiDAB) of Amyloid-β1-42 (Aβ) plaques in different brain regions of the control animals. There was no Aβ signal detectable in the brain of control animals, therefore no quantitative measurement was possible. (A) Representative figures based on the Paxinos Mouse Brain atlas (4th Edition) about the brain regions of interest, framed with red: Basolateral amygdala (BLA), at Bregma -1.23 mm, Motor and somatosensory cortex (CTX) at Bregma -1.07 mm and CA1 hippocampal region (CA1-HC) presented at Bregma -2.15 mm. (B) Representative pictures of the BLA of the control animals after Sham or OVX surgery. (C) Representative pictures of the CTX of control animals after Sham or OVX surgery. (D) Representative pictures of the HC of control animals after Sham or OVX surgery, with a close-up to a small part of the CA1 region. Scale bar: 200µm.
References
1. Alzheimer’s Association. 2020 alzheimer’s disease facts and figures. Alzheimer’s Dement (2020) 16:391–460. doi: 10.1002/alz.12068
2. WHO. The top 10 causes of death (2020). Available at: https://www.who.int/news-room/fact-sheets/detail/the-top-10-causes-of-death.
3. Lyketsos CG, Carrillo MC, Ryan JM, Khachaturian AS, Trzepacz P, Amatniek J, et al. Neuropsychiatric symptoms in alzheimer’s disease. Alzheimers Dement (2011) 7:532–9. doi: 10.1016/j.jalz.2011.05.2410
4. Scheltens P, Blennow K, Breteler MMB, de Strooper B, Frisoni GB, Salloway S, et al. Alzheimer’s disease. Lancet (London England) (2016) 388:505–17. doi: 10.1016/S0140-6736(15)01124-1
5. LaFerla FM, Oddo S. Alzheimer’s disease: Abeta, tau and synaptic dysfunction. Trends Mol Med (2005) 11:170–6. doi: 10.1016/j.molmed.2005.02.009
6. Querfurth HW, LaFerla FM. Alzheimer’s disease. N Engl J Med (2010) 362:329–44. doi: 10.1056/NEJMra0909142
7. Nebel RA, Aggarwal NT, Barnes LL, Gallagher A, Goldstein JM, Kantarci K, et al. Understanding the impact of sex and gender in alzheimer’s disease: A call to action. Alzheimers Dement (2018) 14:1171–83. doi: 10.1016/j.jalz.2018.04.008
8. Cacace R, Sleegers K, Van Broeckhoven C. Molecular genetics of early-onset alzheimer’s disease revisited. Alzheimers Dement (2016) 12:733–48. doi: 10.1016/j.jalz.2016.01.012
9. Rettberg JR, Dang H, Hodis HN, Henderson VW, St. John JA, Mack WJ, et al. Identifying postmenopausal women at risk for cognitive decline within a healthy cohort using a panel of clinical metabolic indicators: potential for detecting an at-alzheimer’s risk metabolic phenotype. Neurobiol Aging (2016) 40:155–63. doi: 10.1016/j.neurobiolaging.2016.01.011
10. Fisher DW, Bennett DA, Dong H. Sexual dimorphism in predisposition to alzheimer’s disease. Neurobiol Aging (2018) 70:308–24. doi: 10.1016/j.neurobiolaging.2018.04.004
11. Pike CJ. Sex and the development of alzheimer’s disease. J Neurosci Res (2017) 95:671–80. doi: 10.1002/jnr.23827
12. Roof RL, Hall ED. Gender differences in acute CNS trauma and stroke: neuroprotective effects of estrogen and progesterone. J Neurotrauma (2000) 17:367–88. doi: 10.1089/neu.2000.17.367
13. Yao J, Irwin R, Chen S, Hamilton R, Cadenas E, Brinton RD. Ovarian hormone loss induces bioenergetic deficits and mitochondrial β-amyloid. Neurobiol Aging (2012) 33:1507–21. doi: 10.1016/j.neurobiolaging.2011.03.001
14. Cersosimo MG, Benarroch EE. Estrogen actions in the nervous system: Complexity and clinical implications. Neurology (2015) 85:263–73. doi: 10.1212/WNL.0000000000001776
15. Kramár EA, Babayan AH, Gall CM, Lynch G. Estrogen promotes learning-related plasticity by modifying the synaptic cytoskeleton. Neuroscience (2013) 239:3–16. doi: 10.1016/j.neuroscience.2012.10.038
16. Sellers KJ, Erli F, Raval P, Watson IA, Chen D, Srivastava DP. Rapid modulation of synaptogenesis and spinogenesis by 17β-estradiol in primary cortical neurons. Front Cell Neurosci (2015) 9:137. doi: 10.3389/fncel.2015.00137
17. Kwakowsky A, Potapov K, Kim S, Peppercorn K, Tate WP, Abraham IM. Treatment of beta amyloid 1-42 (Abeta(1-42))-induced basal forebrain cholinergic damage by a non-classical estrogen signaling activator in vivo. Sci Rep (2016) 6:21101. doi: 10.1038/srep21101
18. Hayward GC, Baranowski BJ, Marko DM, MacPherson REK. Examining the effects of ovarian hormone loss and diet-induced obesity on alzheimer’s disease markers of amyloid-β production and degradation. J Neurophysiol (2021) 125:1068–78. doi: 10.1152/jn.00489.2020
19. Qin Y, An D, Xu W, Qi X, Wang X, Chen L, et al. Estradiol replacement at the critical period protects hippocampal neural stem cells to improve cognition in APP/PS1 mice. Front Aging Neurosci (2020) 12:240. doi: 10.3389/fnagi.2020.00240
20. Mosconi L, Berti V, Quinn C, McHugh P, Petrongolo G, Varsavsky I, et al. Sex differences in Alzheimer risk: Brain imaging of endocrine vs chronologic aging. Neurology (2017) 89:1382–90. doi: 10.1212/WNL.0000000000004425
21. Georgakis MK, Beskou-Kontou T, Theodoridis I, Skalkidou A, Petridou ET. Surgical menopause in association with cognitive function and risk of dementia: A systematic review and meta-analysis. Psychoneuroendocrinology (2019) 106:9–19. doi: 10.1016/J.PSYNEUEN.2019.03.013
22. Rocca WA, Bower JH, Maraganore DM, Ahlskog JE, Grossardt BR, De Andrade M, et al. Increased risk of cognitive impairment or dementia in women who underwent oophorectomy before menopause. Neurology (2007) 69:1074–83. doi: 10.1212/01.WNL.0000276984.19542.E6
23. Parker WH, Jacoby V, Shoupe D, Rocca W. Effect of bilateral oophorectomy on women’s long-term health. Womens Health (Lond Engl) (2009) 5:565–76. doi: 10.2217/WHE.09.42
24. Brinton RD. Minireview: Translational animal models of human menopause: Challenges and emerging opportunities. Endocrinology (2012) 153:3571–8. doi: 10.1210/EN.2012-1340
25. Kara F, Belloy ME, Voncken R, Sarwari Z, Garima Y, Anckaerts C, et al. Long-term ovarian hormone deprivation alters functional connectivity, brain neurochemical profile and white matter integrity in the Tg2576 amyloid mouse model of alzheimer’s disease. Neurobiol Aging (2021) 102:139–50. doi: 10.1016/J.NEUROBIOLAGING.2021.02.011
26. Corder EH, Saunders AM, Strittmatter WJ, Schmechel DE, Gaskell PC, Small GW, et al. Gene dose of apolipoprotein e type 4 allele and the risk of alzheimer’s disease in late onset families. Science (1993) 261:921–3. doi: 10.1126/science.8346443
27. Hori Y, Hashimoto T, Nomoto H, Hyman BT, Iwatsubo T. Role of apolipoprotein e in β-amyloidogenesis: Isoform-specific effects on protofibril to fibril conversion of aβ in vitro and brain aβ deposition in vivo. J Biol Chem (2015) 290:15163–74. doi: 10.1074/jbc.M114.622209
28. Hashimoto T, Serrano-Pozo A, Hori Y, Adams KW, Takeda S, Banerji AO, et al. Especially apolipoprotein E4, increases the oligomerization of amyloid β peptide. J Neurosci (2012) 32:15181–92. doi: 10.1523/JNEUROSCI.1542-12.2012
29. Liu C-C, Zhao N, Fu Y, Wang N, Linares C, Tsai C-W, et al. ApoE4 accelerates early seeding of amyloid pathology. Neuron (2017) 96:1024–1032.e3. doi: 10.1016/j.neuron.2017.11.013
30. Castellano JM, Kim J, Stewart FR, Jiang H, DeMattos RB, Patterson BW, et al. Human apoE isoforms differentially regulate brain amyloid-β peptide clearance. Sci Transl Med (2011) 3:89ra57. doi: 10.1126/scitranslmed.3002156
31. Duan Y, Ye T, Qu Z, Chen Y, Miranda A, Zhou X, et al. Brain-wide Cas9-mediated cleavage of a gene causing familial alzheimer’s disease alleviates amyloid-related pathologies in mice. Nat BioMed Eng (2021) 6 (2):168–180. doi: 10.1038/s41551-021-00759-0
32. Lanoiselée H-M, Nicolas G, Wallon D, Rovelet-Lecrux A, Lacour M, Rousseau S, et al. APP, PSEN1, and PSEN2 mutations in early-onset Alzheimer disease: A genetic screening study of familial and sporadic cases. PloS Med (2017) 14:e1002270. doi: 10.1371/journal.pmed.1002270
33. Jonsson T, Atwal JK, Steinberg S, Snaedal J, Jonsson PV, Bjornsson S, et al. A mutation in APP protects against alzheimer’s disease and age-related cognitive decline. Nature (2012) 488:96–9. doi: 10.1038/nature11283
34. Sergeant N, David JP, Goedert M, Jakes R, Vermersch P, Buée L, et al. Two-dimensional characterization of paired helical filament-tau from alzheimer’s disease: demonstration of an additional 74-kDa component and age-related biochemical modifications. J Neurochem (1997) 69:834–44. doi: 10.1046/j.1471-4159.1997.69020834.x
35. Goedert M, Spillantini MG, Cairns NJ, Crowther RA. Tau proteins of alzheimer paired helical filaments: Abnormal phosphorylation of all six brain isoforms. Neuron (1992) 8:159–68. doi: 10.1016/0896-6273(92)90117-V
36. Oddo S, Caccamo A, Shepherd JD, Murphy MP, Golde TE, Kayed R, et al. Triple-transgenic model of alzheimer’s disease with plaques and tangles: intracellular abeta and synaptic dysfunction. Neuron (2003) 39:409–21. doi: 10.1016/s0896-6273(03)00434-3
37. Oddo S, Caccamo A, Kitazawa M, Tseng BP, LaFerla FM. Amyloid deposition precedes tangle formation in a triple transgenic model of alzheimer’s disease. Neurobiol Aging (2003) 24:1063–70. doi: 10.1016/j.neurobiolaging.2003.08.012
38. Belfiore R, Rodin A, Ferreira E, Velazquez R, Branca C, Caccamo A, et al. Temporal and regional progression of alzheimer’s disease-like pathology in 3xTg-AD mice. Aging Cell (2019) 18:e12873. doi: 10.1111/acel.12873
39. Ballinger EC, Ananth M, Talmage DA, Role LW. Basal forebrain cholinergic circuits and signaling in cognition and cognitive decline. Neuron (2016) 91:1199–218. doi: 10.1016/j.neuron.2016.09.006
40. Záborszky L, Gombkoto P, Varsanyi P, Gielow MR, Poe G, Role LW, et al. Specific basal forebrain-cortical cholinergic circuits coordinate cognitive operations. J Neurosci (2018) 38:9446–58. doi: 10.1523/JNEUROSCI.1676-18.2018
41. Whitehouse PJ, Price DL, Struble RG, Clark AW, Coyle JT, DeLong MR. Alzheimer’s disease and senile dementia: loss of neurons in the basal forebrain. Science (1982) 215:1237–9. doi: 10.1126/SCIENCE.7058341
42. Schmitz TW, Nathan Spreng R. Basal forebrain degeneration precedes and predicts the cortical spread of alzheimer’s pathology. Nat Commun 2016 71 (2016) 7:1–13. doi: 10.1038/ncomms13249
43. Desmarais JE, Gauthier S. Clinical use of cholinergic drugs in Alzheimer disease. Nat Rev Neurol 2010 68 (2010) 6:418–20. doi: 10.1038/nrneurol.2010.105
44. Kalesnykas G, Roschier U, Puoliväli J, Wang J, Miettinen R. The effect of aging on the subcellular distribution of estrogen receptor-alpha in the cholinergic neurons of transgenic and wild-type mice. Eur J Neurosci (2005) 21:1437–42. doi: 10.1111/J.1460-9568.2005.03953.X
45. Kim SH, Barad Z, Cheong RY, Ábrahám IM. Sex differences in rapid nonclassical action of 17β-oestradiol on intracellular signalling and oestrogen receptor α expression in basal forebrain cholinergic neurones in mouse. J Neuroendocrinol (2020) 32:e12830. doi: 10.1111/JNE.12830
46. Sarchielli E, Guarnieri G, Idrizaj E, Squecco R, Mello T, Comeglio P, et al. The G protein-coupled oestrogen receptor, GPER1, mediates direct anti-inflammatory effects of oestrogens in human cholinergic neurones from the nucleus basalis of meynert. J Neuroendocrinol (2020) 32:e12837. doi: 10.1111/jne.12837
47. Mitra SW, Hoskin E, Yudkovitz J, Pear L, Wilkinson HA, Hayashi S, et al. Immunolocalization of estrogen receptor β in the mouse brain: Comparison with estrogen receptor α. Endocrinology (2003) 144:2055–67. doi: 10.1210/EN.2002-221069
48. Merchenthaler I, Lane MV, Numan S, Dellovade TL. Distribution of estrogen receptor alpha and beta in the mouse central nervous system: in vivo autoradiographic and immunocytochemical analyses. J Comp Neurol (2004) 473:270–91. doi: 10.1002/CNE.20128
49. Ping SE, Trieu J, Wlodek ME, Barrett GL. Effects of estrogen on basal forebrain cholinergic neurons and spatial learning. J Neurosci Res (2008) 86:1588–98. doi: 10.1002/JNR.21609
50. Saenz C, Dominguez R, De Lacalle S. Estrogen contributes to structural recovery after a lesion. Neurosci Lett (2006) 392:198–201. doi: 10.1016/J.NEULET.2005.09.023
51. Ábrahám IM, Koszegi Z, Tolod-Kemp E, Szego ÉM. Action of estrogen on survival of basal forebrain cholinergic neurons: Promoting amelioration. Psychoneuroendocrinology (2009) 34 (Suppl 1):S104–12. doi: 10.1016/j.psyneuen.2009.05.024
52. Perez SE, He B, Muhammad N, Oh KJ, Fahnestock M, Ikonomovic MD, et al. Cholinotrophic basal forebrain system alterations in 3xTg-AD transgenic mice. Neurobiol Dis (2011) 41:338–52. doi: 10.1016/J.NBD.2010.10.002
53. Zhu D, Montagne A, Zhao Z. Alzheimer’s pathogenic mechanisms and underlying sex difference. Cell Mol Life Sci (2021) 78:4907–20. doi: 10.1007/s00018-021-03830-w
54. Mauvais-Jarvis F. Estrogen and androgen receptors: regulators of fuel homeostasis and emerging targets for diabetes and obesity. Trends Endocrinol Metab (2011) 22:24–33. doi: 10.1016/J.TEM.2010.10.002
55. Cooke PS, Buchanan DL, Young P, Setiawan T, Brody J, Korach KS, et al. Stromal estrogen receptors mediate mitogenic effects of estradiol on uterine epithelium. Proc Natl Acad Sci U.S.A. (1997) 94:6535–40. doi: 10.1073/PNAS.94.12.6535
56. Quispe Calla NE, Vicetti Miguel RD, Aceves KM, Huang H, Howitt B, Cherpes TL. Ovariectomized mice and postmenopausal women exhibit analogous loss of genital epithelial integrity. Tissue Barriers (2021) 9(2):1865760. doi: 10.1080/21688370.2020.1865760
57. Fazekas CL, Balázsfi D, Horváth HR, Balogh Z, Aliczki M, Puhova A, et al. Consequences of VGluT3 deficiency on learning and memory in mice. Physiol Behav (2019) 212:112688. doi: 10.1016/j.physbeh.2019.112688
58. Prieur E, Jadavji N. Assessing spatial working memory using the spontaneous alternation y-maze test in aged Male mice. Bio-protocol (2019) 9(3):e3162. doi: 10.21769/BIOPROTOC.3162
59. Brandeis R, Brandys Y, Yehuda S. The use of the morris water maze in the study of memory and learning. Int J Neurosci (1989) 48:29–69. doi: 10.3109/00207458909002151
60. Vorhees CV, Williams MT. Morris water maze: procedures for assessing spatial and related forms of learning and memory. Nat Protoc (2006) 1:848–58. doi: 10.1038/NPROT.2006.116
61. Roberto N, Portella MJ, Marquié M, Alegret M, Hernández I, Mauleón A, et al. Neuropsychiatric profile as a predictor of cognitive decline in mild cognitive impairment. Front Aging Neurosci (2021) 13:718949. doi: 10.3389/FNAGI.2021.718949
62. Johansson M, Stomrud E, Lindberg O, Westman E, Johansson PM, van Westen D, et al. Apathy and anxiety are early markers of alzheimer’s disease. Neurobiol Aging (2020) 85:74–82. doi: 10.1016/J.NEUROBIOLAGING.2019.10.008
63. Rocca WA, Grossardt BR, Geda YE, Gostout BS, Bower JH, Maraganore DM, et al. Long-term risk of depressive and anxiety symptoms after early bilateral oophorectomy. Menopause (2018) 25:1275–85. doi: 10.1097/GME.0000000000001229
64. Rodgers RJ, Dalvi A. Anxiety, defence and the elevated plus-maze. Neurosci Biobehav Rev (1997) 21:801–10. doi: 10.1016/S0149-7634(96)00058-9
65. Byrnes EM, Bridges RS. Reproductive experience alters anxiety-like behavior in the female rat. Horm Behav (2006) 50:70–6. doi: 10.1016/J.YHBEH.2006.01.006
66. Pairojana T, Phasuk S, Suresh P, Huang SP, Pakaprot N, Chompoopong S, et al. Age and gender differences for the behavioral phenotypes of 3xTg alzheimer’s disease mice. Brain Res (2021) 1762:147437. doi: 10.1016/J.BRAINRES.2021.147437
67. Thigpen JE, Setchell KDR, Saunders HE, Haseman JK, Grant MG, Forsythe DB. Selecting the appropriate rodent diet for endocrine disruptor research and testing studies. ILAR J (2004) 45:401–16. doi: 10.1093/ILAR.45.4.401/2/ILAR-45-4-401IGF7.GIF
68. Gee DM, Flurkey K, Finch CE. Aging and the regulation of luteinizing hormone in C57BL/6J mice: impaired elevations after ovariectomy and spontaneous elevations at advanced ages. Biol Reprod (1983) 28:598–607. doi: 10.1095/BIOLREPROD28.3.598
69. Chaves T, Török B, Fazekas CL, Correia P, Sipos E, Várkonyi D, et al. Median raphe region GABAergic neurons contribute to social interest in mouse. Life Sci (2022) 289:120223. doi: 10.1016/J.LFS.2021.120223
70. Engelmann M, Hädicke J, Noack J. Testing declarative memory in laboratory rats and mice using the nonconditioned social discrimination procedure. Nat Protoc (2011) 6:1152–62. doi: 10.1038/NPROT.2011.353
71. Aliczki M, Fodor A, Balogh Z, Haller J. Behavior DZ-h and, 2014 undefined. the effects of lactation on impulsive behavior in vasopressin-deficient brattleboro rats. Available at: https://www.sciencedirect.com/science/article/pii/S0018506X14001597 (Accessed June 16, 2022).
72. Bruzsik B, Biro L, Zelena D, Sipos E, Szebik H, Sarosdi KR, et al. Somatostatin neurons of the bed nucleus of stria terminalis enhance associative fear memory consolidation in mice. J Neurosci (2021) 41:1982. doi: 10.1523/JNEUROSCI.1944-20.2020
73. Balázsfi D, Fodor A, Török B, Ferenczi S, Kovács KJ, Haller J, et al. Enhanced innate fear and altered stress axis regulation in VGluT3 knockout mice. Stress (2018) 21:151–61. doi: 10.1080/10253890.2017.1423053
74. Gáll Z, Farkas S, Albert Á, Ferencz E, Vancea S, Urkon M, et al. Effects of chronic cannabidiol treatment in the rat chronic unpredictable mild stress model of depression. Biomolecules (2020) 10(5):801. doi: 10.3390/biom10050801
75. Bruzsik B, Biro L, Sarosdi KR, Zelena D, Sipos E, Szebik H, et al. Neurochemically distinct populations of the bed nucleus of stria terminalis modulate innate fear response to weak threat evoked by predator odor stimuli. Neurobiol Stress (2021) 15:100415. doi: 10.1016/J.YNSTR.2021.100415
76. Hanna Al-Shaikh FS, Duara R, Crook JE, Lesser ER, Schaeverbeke J, Hinkle KM, et al. Selective vulnerability of the nucleus basalis of meynert among neuropathologic subtypes of Alzheimer disease. JAMA Neurol (2020) 77:225–33. doi: 10.1001/JAMANEUROL.2019.3606
77. George AA, Vieira JM, Xavier-Jackson C, Gee MT, Cirrito JR, Bimonte-Nelson HA, et al. Implications of oligomeric amyloid-beta (oAβ 42) signaling through α7β2-nicotinic acetylcholine receptors (nAChRs) on basal forebrain cholinergic neuronal intrinsic excitability and cognitive decline. J Neurosci (2021) 41:555–75. doi: 10.1523/JNEUROSCI.0876-20.2020
78. Lehmann J, Nagy JI, Atmadja S, Fibiger HC. The nucleus basalis magnocellularis: the origin of a cholinergic projection to the neocortex of the rat. Neuroscience (1980) 5:1161–74. doi: 10.1016/0306-4522(80)90195-5
79. Koszegi Z, Szego ÉM, Cheong RY, Tolod-Kemp E, Ábrahám IM. Postlesion estradiol treatment increases cortical cholinergic innervations via estrogen receptor-α dependent nonclassical estrogen signaling in vivo. Endocrinology (2011) 152:3471–82. doi: 10.1210/en.2011-1017
80. Guilloux JP, Seney M, Edgar N, Sibille E. Integrated behavioral z-scoring increases the sensitivity and reliability of behavioral phenotyping in mice: relevance to emotionality and sex. J Neurosci Methods (2011) 197:21–31. doi: 10.1016/J.JNEUMETH.2011.01.019
81. Fazekas CL, Sipos E, Klaric T, Török B, Bellardie M, Erjave GN, et al. Searching for glycomic biomarkers for predicting resilience and vulnerability in a rat model of posttraumatic stress disorder. Stress (2020) 23:715–31. doi: 10.1080/10253890.2020.1795121
82. Heine PA, Taylor JA, Iwamoto GA, Lubahn DB, Cooke PS. Increased adipose tissue in male and female estrogen receptor-alpha knockout mice. Proc Natl Acad Sci U.S.A. (2000) 97:12729–34. doi: 10.1073/PNAS.97.23.12729
83. Beck P. Effect of progestins on glucose and lipid metabolism. Ann N Y Acad Sci (1977) 286:434–45. doi: 10.1111/J.1749-6632.1977.TB29435.X
84. Abildgaard J, Ploug T, Al-Saoudi E, Wagner T, Thomsen C, Ewertsen C, et al. Changes in abdominal subcutaneous adipose tissue phenotype following menopause is associated with increased visceral fat mass. Sci Rep (2021) 11(1):14750. doi: 10.1038/S41598-021-94189-2
85. Ambikairajah A, Walsh E, Tabatabaei-Jafari H, Cherbuin N. Fat mass changes during menopause: a metaanalysis. Am J Obstet Gynecol (2019) 221:393–409.e50. doi: 10.1016/J.AJOG.2019.04.023
86. Picone P, Di Carlo M, Nuzzo D. Obesity and alzheimer’s disease: Molecular bases. Eur J Neurosci (2020) 52:3944–50. doi: 10.1111/EJN.14758
87. Kang S, Lee YH, Lee JE. Metabolism-centric overview of the pathogenesis of alzheimer’s disease. Yonsei Med J (2017) 58:479–88. doi: 10.3349/YMJ.2017.58.3.479
88. Medina-Contreras J, Villalobos-Molina R, Zarain-Herzberg A, Balderas-Villalobos J. Ovariectomized rodents as a menopausal metabolic syndrome model. a minireview. Mol Cell Biochem (2020) 475:261–76. doi: 10.1007/S11010-020-03879-4
89. Alderman MH, Taylor HS. Molecular mechanisms of estrogen action in female genital tract development. Differentiation (2021) 118:34–40. doi: 10.1016/J.DIFF.2021.01.002
90. Levin ER. Membrane estrogen receptors signal to determine transcription factor function. Steroids (2018) 132:1–4. doi: 10.1016/j.steroids.2017.10.014
91. Kwakowsky A, Herbison AE, Ábrahám IM. The role of cAMP response element-binding protein in estrogen negative feedback control of gonadotropin-releasing hormone neurons. J Neurosci (2012) 32:11309–17. doi: 10.1523/JNEUROSCI.1333-12.2012
92. Cheong RY, Czieselsky K, Porteous R, Herbison AE. Expression of ESR1 in glutamatergic and GABAergic neurons is essential for normal puberty onset, estrogen feedback, and fertility in female mice. J Neurosci (2015) 35:14533. doi: 10.1523/JNEUROSCI.1776-15.2015
93. Yip SH, Liu X, Hessler S, Cheong I, Porteous R, Herbison AE. Indirect suppression of pulsatile LH secretion by CRH neurons in the female mouse. Endocrinology (2021) 162(3):bqaa237. doi: 10.1210/ENDOCR/BQAA237
94. Farkas S, Szabó A, Hegyi AE, Török B, Fazekas CL, Ernszt D, et al. Estradiol and estrogen-like alternative therapies in use: The importance of the selective and non-classical actions. Biomedicines (2022) 10(4):861. doi: 10.3390/BIOMEDICINES10040861
95. Liedert A, Nemitz C, Haffner-Luntzer M, Schick F, Jakob F, Ignatius A. Effects of estrogen receptor and wnt signaling activation on mechanically induced bone formation in a mouse model of postmenopausal bone loss. Int J Mol Sci (2020) 21:1–12. doi: 10.3390/IJMS21218301
96. Wei Z, Ge F, Che Y, Wu S, Dong X, Song D. Metabolomics coupled with pathway analysis provides insights into sarco-osteoporosis metabolic alterations and estrogen therapeutic effects in mice. Biomolecules (2021) 12(1):41. doi: 10.3390/BIOM12010041
97. Webster SJ, Bachstetter AD, Nelson PT, Schmitt FA, Van Eldik LJ. Using mice to model alzheimer’s dementia: an overview of the clinical disease and the preclinical behavioral changes in 10 mouse models. Front Genet (2014) 5:88. doi: 10.3389/FGENE.2014.00088
98. Campos AC, Fogaça MV, Aguiar DC, Guimarães FS. Animal models of anxiety disorders and stress. Rev Bras Psiquiatr (2013) 35(Suppl 2):S101–11. doi: 10.1590/1516-4446-2013-1139
99. Furcila D, Defelipe J, Alonso-Nanclares L. A study of amyloid-β and phosphotau in plaques and neurons in the hippocampus of alzheimer’s disease patients. J Alzheimers Dis (2018) 64:417–35. doi: 10.3233/JAD-180173
100. Behnamedin Jameie S, Pirasteh A, Naseri A, Sadat Jameie M, Farhadi M, Fahanik Babaee J, et al. β-amyloid formation, memory, and learning decline following long-term ovariectomy and its inhibition by systemic administration of apigenin and β-estradiol. Basic Clin Neurosci (2021) 12(3):383–94. doi: 10.32598/BCN.2021.2634.1
101. Stover KR, Campbell MA, Van Winssen CM, Brown RE. Early detection of cognitive deficits in the 3xTg-AD mouse model of alzheimer’s disease. Behav Brain Res (2015) 289:29–38. doi: 10.1016/J.BBR.2015.04.012
102. Siegel AM, Mathews SB. Diagnosis and treatment of anxiety in the aging woman. Curr Psychiatry Rep (2015) 17(12):93. doi: 10.1007/S11920-015-0636-3
103. Botto R, Callai N, Cermelli A, Causarano L, Rainero I. Anxiety and depression in alzheimer’s disease: a systematic review of pathogenetic mechanisms and relation to cognitive decline. Neurol Sci (2022) 43(7):4107–24. doi: 10.1007/S10072-022-06068-X
104. Arrant AE, Schramm-Sapyta NL, Kuhn CM. Use of the light/dark test for anxiety in adult and adolescent male rats. Behav Brain Res (2013) 256:119–27. doi: 10.1016/J.BBR.2013.05.035
105. Adhikari A, Lerner TN, Finkelstein J, Pak S, Jennings JH, Davidson TJ, et al. Basomedial amygdala mediates top-down control of anxiety and fear. Nature (2015) 527:179–85. doi: 10.1038/NATURE15698
106. Sturman O, Germain PL, Bohacek J. Exploratory rearing: a context- and stress-sensitive behavior recorded in the open-field test. Stress (2018) 21:443–52. doi: 10.1080/10253890.2018.1438405
107. Janak PH, Tye KM. From circuits to behaviour in the amygdala. Nature (2015) 517:284–92. doi: 10.1038/NATURE14188
108. Sah P. Fear, anxiety, and the amygdala. Neuron (2017) 96:1–2. doi: 10.1016/J.NEURON.2017.09.013
109. Etkin A, Prater KE, Schatzberg AF, Menon V, Greicius MD. Disrupted amygdalar subregion functional connectivity and evidence of a compensatory network in generalized anxiety disorder. Arch Gen Psychiatry (2009) 66:1361–72. doi: 10.1001/ARCHGENPSYCHIATRY.2009.104
110. Patel P, Masurkar AV. The relationship of anxiety with alzheimer’s disease: A narrative review. Curr Alzheimer Res (2021) 18:359–71. doi: 10.2174/1567205018666210823095603
111. Zhao QF, Tan L, Wang HF, Jiang T, Tan MS, Tan L, et al. The prevalence of neuropsychiatric symptoms in alzheimer’s disease: Systematic review and meta-analysis. J Affect Disord (2016) 190:264–71. doi: 10.1016/J.JAD.2015.09.069
112. Lee G. Impaired cognitive function is associated with motor function and activities of daily living in mild to moderate alzheimer’s dementia. Curr Alzheimer Res (2020) 17:680–6. doi: 10.2174/1567205017666200818193916
113. Albers MW, Gilmore GC, Kaye J, Murphy C, Wingfield A, Bennett DA, et al. At The interface of sensory and motor dysfunctions and alzheimer’s disease. Alzheimers Dement (2015) 11:70–98. doi: 10.1016/J.JALZ.2014.04.514
114. Jawhar S, Trawicka A, Jenneckens C, Bayer TA, Wirths O. Motor deficits, neuron loss, and reduced anxiety coinciding with axonal degeneration and intraneuronal aβ aggregation in the 5XFAD mouse model of alzheimer’s disease. Neurobiol Aging (2012) 33:196.e29–196.e40. doi: 10.1016/J.NEUROBIOLAGING.2010.05.027
115. Juárez-Tapia C, Miranda-Anaya M. Ovariectomy influences the circadian rhythm of locomotor activity and the photic phase shifts in the volcano mouse. Physiol Behav (2017) 182:77–85. doi: 10.1016/J.PHYSBEH.2017.10.002
116. Royston SE, Yasui N, Kondilis AG, Lord SV, Katzenellenbogen JA, Mahoney MM. ESR1 and ESR2 differentially regulate daily and circadian activity rhythms in female mice. Endocrinology (2014) 155:2613–23. doi: 10.1210/EN.2014-1101
117. Kazim SF, Seo JH, Bianchi R, Larson CS, Sharma A, Wong RKS, et al. Neuronal network excitability in alzheimer’s disease: The puzzle of similar versus divergent roles of amyloid β and tau. eNeuro (2021) 8(2):ENEURO.0418-20. doi: 10.1523/ENEURO.0418-20.2020
118. Bove R, Secor E, Chibnik LB, Barnes LL, Schneider JA, Bennett DA, et al. Age at surgical menopause influences cognitive decline and Alzheimer pathology in older women. Neurology (2014) 82:222–9. doi: 10.1212/WNL.0000000000000033
119. Mosconi L, Berti V, Dyke J, Schelbaum E, Jett S, Loughlin L, et al. Menopause impacts human brain structure, connectivity, energy metabolism, and amyloid-beta deposition. Sci Rep 2021 111 (2021) 11:1–16. doi: 10.1038/s41598-021-90084-y
120. Zeydan B, Tosakulwong N, Schwarz CG, Senjem ML, Gunter JL, Reid RI, et al. Association of bilateral salpingo-oophorectomy before menopause onset with medial temporal lobe neurodegeneration. JAMA Neurol (2019) 76:95–100. doi: 10.1001/JAMANEUROL.2018.3057
121. Carroll JC, Rosario ER, Chang L, Stanczyk FZ, Oddo S, LaFerla FM, et al. Progesterone and estrogen regulate Alzheimer-like neuropathology in female 3xTg-AD mice. J Neurosci (2007) 27:13357. doi: 10.1523/JNEUROSCI.2718-07.2007
122. Zhao L, Yao J, Mao Z, Chen S, Wang Y, Brinton RD. 17β-estradiol regulates insulin-degrading enzyme expression via an ERβ/PI3-K pathway in hippocampus: relevance to alzheimer’s prevention. Neurobiol Aging (2011) 32:1949–63. doi: 10.1016/J.NEUROBIOLAGING.2009.12.010
123. Palm R, Chang J, Blair J, Garcia-Mesa Y, Lee HG, Castellani RJ, et al. Down-regulation of serum gonadotropins but not estrogen replacement improves cognition in aged-ovariectomized 3xTg AD female mice. J Neurochem (2014) 130:115. doi: 10.1111/JNC.12706
124. Rodrigues SM, Sapolsky RM. Disruption of fear memory through dual-hormone gene therapy. Biol Psychiatry (2009) 65:441–4. doi: 10.1016/J.BIOPSYCH.2008.09.003
125. Shansky RM, Hamo C, Hof PR, Lou W, McEwen BS, Morrison JH. Estrogen promotes stress sensitivity in a prefrontal cortex-amygdala pathway. Cereb Cortex (2010) 20:2560–7. doi: 10.1093/CERCOR/BHQ003
126. Tian Z, Wang Y, Zhang N, yan GY, Feng B, bing LS, et al. Estrogen receptor GPR30 exerts anxiolytic effects by maintaining the balance between GABAergic and glutamatergic transmission in the basolateral amygdala of ovariectomized mice after stress. Psychoneuroendocrinology (2013) 38:2218–33. doi: 10.1016/J.PSYNEUEN.2013.04.011
127. Green PS, Bales K, Paul S, Bu G. Estrogen therapy fails to alter amyloid deposition in the PDAPP model of alzheimer’s disease. Endocrinology (2005) 146:2774–81. doi: 10.1210/EN.2004-1433
128. Ding F, Yao J, Zhao L, Mao Z, Chen S, Brinton RD. Ovariectomy induces a shift in fuel availability and metabolism in the hippocampus of the female transgenic model of familial alzheimer’s. PloS One (2013) 8(3):e59825. doi: 10.1371/JOURNAL.PONE.0059825
129. Levin-Allerhand JA, Lominska CE, Wang J, Smith JD. 17Alpha-estradiol and 17beta-estradiol treatments are effective in lowering cerebral amyloid-beta levels in AbetaPPSWE transgenic mice. J Alzheimers Dis (2002) 4:449–57. doi: 10.3233/JAD-2002-4601
130. Yao Q, Feng M, Yang B, Long Z, Luo S, Luo M, et al. Effects of ovarian hormone loss on neuritic plaques and autophagic flux in the brains of adult female APP/PS1 double-transgenic mice. Acta Biochim Biophys Sin (Shanghai) (2018) 50:447–55. doi: 10.1093/ABBS/GMY032
131. Hampel H, Mesulam M-M, Cuello AC, Farlow MR, Giacobini E, Grossberg GT, et al. The cholinergic system in the pathophysiology and treatment of alzheimer’s disease. Brain (2018) 141:1917–33. doi: 10.1093/brain/awy132
132. Chen ZR, Huang JB, Yang SL, Hong FF. Role of cholinergic signaling in alzheimer’s disease. Molecules (2022) 27(6):1816. doi: 10.3390/MOLECULES27061816
133. Gibbs RB. Effects of ageing and long-term hormone replacement on cholinergic neurones in the medial septum and nucleus basalis magnocellularis of ovariectomized rats. J Neuroendocrinol (2003) 15:477–85. doi: 10.1046/J.1365-2826.2003.01012.X
134. Oakley H, Cole SL, Logan S, Maus E, Shao P, Craft J, et al. Intraneuronal beta-amyloid aggregates, neurodegeneration, and neuron loss in transgenic mice with five familial alzheimer’s disease mutations: potential factors in amyloid plaque formation. J Neurosci (2006) 26:10129–40. doi: 10.1523/JNEUROSCI.1202-06.2006
Keywords: Alzheimer’s disease, hormone deprivation, ovariectomy, cognitive function, anxiety, estrogen, cholinergic neurons
Citation: Farkas S, Szabó A, Török B, Sólyomvári C, Fazekas CL, Bánrévi K, Correia P, Chaves T and Zelena D (2022) Ovariectomy-induced hormone deprivation aggravates Aβ1-42 deposition in the basolateral amygdala and cholinergic fiber loss in the cortex but not cognitive behavioral symptoms in a triple transgenic mouse model of Alzheimer’s disease. Front. Endocrinol. 13:985424. doi: 10.3389/fendo.2022.985424
Received: 03 July 2022; Accepted: 20 September 2022;
Published: 11 October 2022.
Edited by:
Allan Herbison, University of Cambridge, United KingdomReviewed by:
Lucia Karailievova, Slovak Academy of Sciences, SlovakiaFirat Kara, Mayo Clinic, United States
Ingrid Y Liu, Tzu Chi University, Taiwan
Copyright © 2022 Farkas, Szabó, Török, Sólyomvári, Fazekas, Bánrévi, Correia, Chaves and Zelena. This is an open-access article distributed under the terms of the Creative Commons Attribution License (CC BY). The use, distribution or reproduction in other forums is permitted, provided the original author(s) and the copyright owner(s) are credited and that the original publication in this journal is cited, in accordance with accepted academic practice. No use, distribution or reproduction is permitted which does not comply with these terms.
*Correspondence: Dóra Zelena, zelena.dora@pte.hu