 Shengjie Yang
 Xinyue Wang
 Yujuan Li1
 Min Wu
- 1Guang’an men Hospital, China Academy of Chinese Medical Sciences, Beijing, China
- 2Qilu Hospital of Shandong University, Jinan, China
Background: Observational studies suggest an association between telomere length (TL) and blood lipid (BL) levels. Nevertheless, the causal connections between these two traits remain unclear. We aimed to elucidate whether genetically predicted TL is associated with BL levels via Mendelian randomization (MR) and vice versa.
Methods: We obtained genetic instruments associated with TL, triglycerides (TG), low-density lipoprotein cholesterol (LDL-C), high-density lipoprotein cholesterol (HDL-C), apolipoprotein A-1 (ApoA-1) and apolipoprotein B (ApoB) from large-scale genome-wide association studies (GWASs). The causal relationships between TL and BL were investigated via bidirectional MR, multivariable MR and mediation analysis methods. The inverse variance weighted (IVW) method was employed as the principal methodology, complemented by several other estimators to enhance the robustness of the analysis.
Results: In the forward MR analyses, we identified significant positive correlation between genetically predicted TL and the levels of TG (β=0.04, 95% confidence interval [CI]: 0.01 to 0.06, p = 0.003). In the reverse MR analysis, TG (β=0.02, 95% CI: 0.01 to 0.03, p = 0.004), LDL-C (β=0.03, 95% CI: 0.01 to 0.04, p = 0.001) and ApoB (β=0.03, 95% CI: 0.01 to 0.04, p = 9.71×10⁻⁵) were significantly positively associated with TL, although this relationship was not observed in the multivariate MR analysis. The mediation analysis via two-step MR showed no significant mediation effects acting through obesity-related phenotypes in analysis of TL with TG, while the effect of LDL-C on TL was partially mediated by body mass index (BMI) in the reverse direction, with mediated proportion of 12.83% (95% CI: 0.62% to 25.04%).
Conclusions: Our study indicated that longer TL were associated with higher TG levels, while conversely, higher TG, LDL-C, and ApoB levels predicted longer TL, with BMI partially mediating these effects. Our findings present valuable insights into the development of preventive strategies and interventions that specifically target TL-related aging and age-related diseases.
1 Introduction
Telomeres are DNA-protein structures located at the terminal regions of chromosomes that play a crucial role in maintaining genomic stability and cellular integrity (1). Gradually shortening over time in most somatic tissues (2), telomere length (TL) is considered to be a biomarker of biological aging (3, 4). Moreover, TL is increasingly being recognized as a clinical indicator of age-related disease risk (5), including cardiovascular and cerebrovascular diseases, diabetes, cancer, and neurodegenerative disorders (6).
Blood lipids (BL) are fatty substances and apolipoproteins circulating in blood. Commonly measured BL traits include triglycerides (TG), low-density lipoprotein cholesterol (LDL-C), high-density lipoprotein cholesterol (HDL-C), apolipoprotein A-1 (ApoA-1) and apolipoprotein B (ApoB) (7, 8). Abnormal blood lipid levels are associated with various diseases. Previous studies have found that controlling BL levels can effectively reduce the risk of cardiovascular disease (9, 10), with LDL-C considered a primary target for lipid-lowering therapy (11). However, large-scale studies have indicated a negative correlation between BL levels, particularly LDL-C, and the risk of intracerebral hemorrhage (ICH), certain cancers, and dementia (12–14), while exhibiting a protective effect against type 2 diabetes mellitus (T2DM) (15). These findings revealed inconsistencies in the association between BL levels and age-related disease risk.
Given the complex relationship between BL levels and age-related diseases, and the crucial role of TL in aging and age-related disease risk, the relationship between TL and BL has attracted widespread interest. Previous population-based prospective studies have consistently indicated a significant association between TL and TG, LDL-C, HDL-C and ApoA-1 (16–18). Cross-sectional (19) and cohort (20) studies have indicated that TL strongly correlates with ApoB. The relationship between the TL and BL, however, was found to be not significant in several observational studies (21–23). The existence of inconsistent outcomes introduces difficulties in making conclusive inferences about the causal relationship between TL and BL. However, the association between TL and BL observed in observational studies could be influenced by confounding variables, limited follow-up duration, small sample sizes and the potential for reverse causation (24). These factors may lead to misleading conclusions. Thus, the potential causality of TL in determining the BL level remains elusive, and vice versa.
Mendelian randomization (MR) is a more reliable method of causal inference that overcomes the limitations of observational studies (25, 26). MR uses genetic variation strongly associated with exposure factors as a tool, which can effectively avoid the effects of confounding factors and reverse causation (25, 27–29). With the identification of numerous variants associated with complex exposures through genome-wide association studies (GWAS), MR has gained widespread applicability (30, 31). In this study, we applied a two-sample bidirectional MR analysis to investigate the potential causal relationship between BL and TL. Given the intimate association between BL, TL and obesity (32), we performed a two-step mediation analysis to investigate the mediating pathway from BL to TL via obesity-related phenotypes, and vice versa.
2 Materials and methods
2.1 Study design
A brief illustration of the bidirectional MR design is shown in Figure 1. BL is characterized by five generally assessed lipid traits. We assessed the causal relationship between TL and BL using forward-direction MR analysis. To ensure a comprehensive analysis, we adopted summary-level statistics from the most extensive GWAS conducted on TL. In the reverse MR analysis, we evaluated the correlation between the genetically predicted BL and TL. Summary-level statistics from the most comprehensive GWAS were also extracted for TG, LDL-C, HDL-C, ApoA-1 and ApoB. Therefore, we conducted 10 MR analyses to explore the bidirectional association between the TL and BL. The associations of BL on TL were adjusted via multivariable MR to eliminate potential pleiotropy (33). We also investigated mediation effects for TL on BL via mediation analysis and vice versa. MR analysis is underpinned by three core assumptions (Figure 1): genetic instruments are significantly associated with exposure; genetic instruments are unrelated to any confounding factors of the exposure-outcome association; and genetic instruments affect the outcome only via exposure (34). The analyses were restricted to individuals of European ancestry to minimize potential racial mismatches. Genotypes in the GWASs were imputed using the 1000 Genomes Project reference panels (35). An additive genetic model was used as the basis for analysis for all the GWAS summary statistics utilized in this study.
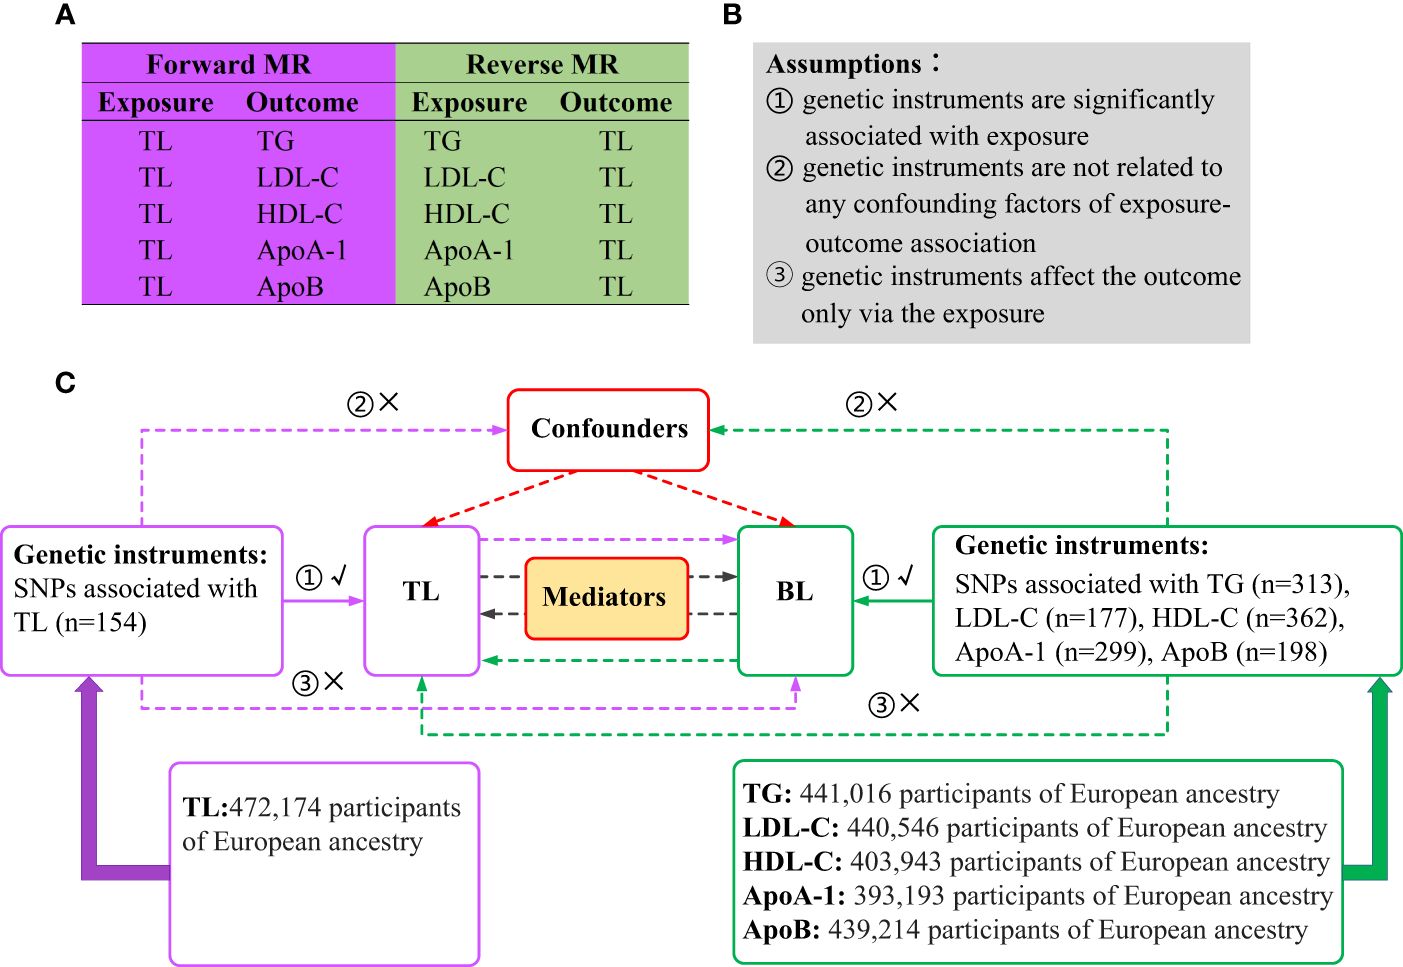
Figure 1 Overview of the study design. (A) Ten MR analyses investigating the bidirectional association between TL and BL. (B) MR analysis is underpinned by three core assumptions. (C) Outline of the study design. MR, Mendelian randomization; TL, telomere length; BL, blood lipids; TG, triglycerides; LDL-C, low-density lipoprotein cholesterol; HDL-C, high-density lipoprotein cholesterol; ApoA-1, apolipoprotein A-1; ApoB, apolipoprotein B; SNPs, single nucleotide polymorphisms.
2.2 Data source and instruments
2.2.1 Selection of genetic instruments
The genetic instruments were selected according to the three main assumptions of MR. Firstly, we filtered single-nucleotide polymorphisms (SNPs) at the genome-wide significance threshold (P < 5 × 10⁻⁸). To ensure independence among the genetic instruments, we also utilized linkage disequilibrium clumping (36) with r2 > 0.001 (clumping window of 10,000 kb). To meet the assumption that genetic instruments affect the outcome only through the exposure, we excluded outcome-related (P < 1×10⁻⁵) SNPs. PhenoScanner V2 (http://www.phenoscanner.medschl.cam.ac.uk) and GWAS Catalog (http://www.ebi.ac.uk/gwas) were used for investigating genetic associations with various phenotypes and traits. With the help of the online tools, we queried and removed SNPs significantly (P < 5 × 10⁻⁸) associated with potential confounders (37). In addition, incompatible and palindromic SNPs were removed when harmonizing the effect allele of each SNP between the summary statistics of exposure and outcome. Furthermore, we applied Steiger filtering to remove SNPs that may have a reverse potential causal direction, avoiding the association between each SNP and the outcome being stronger than that of the exposure (38).
2.2.2 Data source and SNP selection for TL
Summary-level data for TL (n = 472,174) were obtained from the largest published GWAS in the UK Biobank (39). Using genome-wide significance filtering and linkage disequilibrium clumping, 154 independent SNPs significantly associated with TL were retained (Supplementary Table 1; Figure 1). After removing SNPs associated with potential confounders [i.e., diabetes, hypertension, smoking, and body mass index (BMI)] (40–43), 137 SNPs remained (Supplementary Table 7). For example, the index SNP at KIAA1429, which catalyzes the m6A methylation modification of RNA (44), was removed because of its significant association with BMI (rs1023767, P = 3.24 × 10⁻⁸). After the coding alleles in the summary statistics of TL were aligned with those of the outcome measures, 135, 135, 124, 128, and 135 SNPs remained to assess the associations between TL and TG, LDL-C, HDL-C, ApoA-1, and ApoB, respectively. None of these genetic instruments was removed by Steiger filtering, which explains the correctness of the causal direction for a single SNP. Detailed information on the number of SNPs preserved after each selection step is provided in Supplementary Table 15.
2.2.3 Data source and SNP selection for BL
Summary statistics for TG (n = 441,016), LDL-C (n = 440,546), HDL-C (n = 403,943), Apo A-1 (n = 393,193), and ApoB (n = 439,214) were available from a comprehensive GWAS dataset from the UK Biobank (45). The mean (standard deviation [SD]) lipid concentrations were LDL-C 3.57 (0.87) mmol/L and HDL-C 1.45 (0.38) mmol/L, and the median TG was 1.50 (interquartile range = 1.11) mmol/L. The mean (SD) values for ApoB and ApoA-1 were 1.03 (0.24) g/L and 1.54 (0.27) g/L, respectively. Genome-wide significant filtering and linkage disequilibrium clumping identified 313 SNPs when TG was used as the exposure (Supplementary Table 2). After removing SNPs associated with the potential confounders (that is, diabetes, hypertension and smoking, and BMI) (46–49), 254 remained (Supplementary Table 7). By matching the TG and TL coding alleles, 236 SNPs were identified. Steiger filtering removed no SNPs, resulting in 236 genetic instruments being selected for LDL-C. Using the same selection procedures, 147, 303, 242, and 170 genetic instruments were selected for TG, HDL-C, ApoA-1 and ApoB, respectively (Supplementary Tables 3–7,15).
2.2.4 Data source and SNP selection for potential mediators
Summary-level data of potential mediators (obesity-related phenotypes) were derived from comprehensive GWAS datasets, with BMI (n = 359,983), waist-to-hip ratio (WHR) (n = 224,459), hip circumference (HC) (n = 225,487) and waist circumference (WC) (n = 245,746) derived from the Genetic Investigation of Anthropometric Traits Consortium (50, 51). GWAS dataset for body fat percentage (BFP) (n = 331, 117) was derived from Neale Lab (http://www.nealelab.is). To ensure genome-wide significance and avoid potential confounding (GWAS Catalog was used to investigate each SNP to assess its associations with confounding factors), 69, 257, 31, 75 and 65 genetic instruments were eventually selected for BMI, BFP, WHR, HC and WC (Supplementary Tables 8–12).
2.3 Statistical analysis
2.3.1 Univariable MR
R2 was calculated to estimate the proportion of variance in liability explained by genetic instruments (52). The F-statistic was calculated to validate the strength of the association between genetic instruments and exposure, and a threshold of F-statistic > 10 was suggested for MR analysis (53). The inverse variance weighted (IVW) method was adopted as the principal MR analytical approach to assess potential associations between TL and BL (54). In addition, we utilized the Mendelian Randomization-Egger (MR-Egger) (55), weighted median (56), and weighted mode (57) as alternative analysis methods. Bonferroni-corrected P < 0.005 (0.05/10 = 0.005) was used to determine statistical significance in the univariable MR analysis, and beta (β) with 95% confidence intervals (CI) were applied to estimate the degree of causal relationships. We then evaluated the heterogeneity for the IVW and MR-Egger methods using Cochran’s Q statistics (58), where P < 0.05 suggesting apparent heterogeneity. The IVW random effects (IVW-RE) method was used for heterogeneous SNPs. We also performed tests for horizontal pleiotropy using the MR-Egger regression intercept, and statistical significance was set at P < 0.05. Additionally, we applied the MR pleiotropy residual sum and outlier (MR-PRESSO) test to identify and eliminate horizontal pleiotropic outliers (59).
2.3.2 Multivariable MR
The special BL traits share correlation in terms of function and composition, and there were SNPs associated with at least two of the five BL traits. Considering these relationships, we performed multivariable MR (60) analysis to simultaneously estimate the causal effect of each BL trait on TL conditioned on related BL traits. We designed two models to correct for both measured and unmeasured pleiotropy, using the multivariable MR extension of the IVW and MR-Egger method. Model 1 included TG, LDL-C and ApoB, as TG combines with ApoB to form very-low-density lipoprotein cholesterol (VLDL-C) particles, and these VLDL-C particles transport TG in the bloodstream to other tissues, gradually converting into LDL-C (61). Model 2 included HDL-C and ApoA-1, as ApoA-1 is the major structural protein of HDL-C. p < 0.05 was considered significant in the multivariate MR analysis.
2.3.3 Mediation analysis
For significant MR associations, two-step MR analysis was applied to evaluate mediating effects. In the first step, genetic instruments for exposure were used to access the causal effect of the exposure on the potential mediators. In the second step, genetic instruments for the identified mediators were used to estimate the causal effect of the potential mediators on outcome. When there was evidence that TL influenced the mediator, which in turn influenced BL, we utilized the “product of coefficients” method (62) to assess the mediation effect of TL on BL via each potential mediator in the forward-direction MR analysis, and vice versa. Standard errors for the indirect effects were derived by using the delta method (63). Given that obesity-related phenotypes are correlated with both BL and TL (64, 65), it is plausible that obesity-related measurements could act as mediators between TL and BL. A p-value < 0.05 suggests statistical significance in mediation analysis.
All above MR analysis were performed using the TwoSampleMR, MRPRESSO and MendelianRandomization packages in R (version 4.2.0; www.r-project.org/).
3 Results
3.1 Estimates of the causal effect of TL on BL
3.1.1 Univariable MR
The R2 and F-statistics indicated that all SNPs were sufficiently powerful to predict the exposure of interest (Supplementary Table 13). The results of the forward MR analyses are shown in Figure 2, and the scatter and forest plots are presented in Supplementary Figures 1, 2. The TL were significantly positive associated with the TG levels. The estimates of causal effect for each SD longer TL were 0.04 SD higher level of TG (95% CI: 0.01–0.06; p = 0.003) in the IVW analysis. No significant correlation was found for LDL-C (β = -0.01, 95% CI: -0.03 to 0.01, p = 0.386), HDL-C (β = -0.02, 95% CI: -0.05 to 3.64E-04, p = 0.054) and ApoB (β = -0.01, 95% CI: -0.03 to 0.01, p = 0.404) after Bonferroni correction. Using other MR methods, i.e., MR-Egger, weighted median and weighted mode—all estimates of the causal effects were consistent with those of IVW. Additionally, although IVW (β = -0.03, 95% CI: -0.05 to -0.01, p = 0.017) and MR-Egger (β = -0.05, 95% CI: -0.09 to -0.01, p = 0.019) methods showed on significant association between TL on ApoA-1 after Bonferroni correction, weighted median (β = -0.04, 95% CI: -0.07 to -0.01, p = 0.005) and weighted mode (β = -0.05, 95% CI: -0.08 to -0.01 = 2, p = 4.16E-04) methods indicated significant causal effects for TL on ApoA-1, suggesting implicit association between TL and ApoA-1. The MR-PRESSO test identified 8 outlier SNPs for TG, 4 outlier SNPs for LDL-C, 4 for HDL-C, 5 for ApoA-1 and 4 for ApoB, respectively (Supplementary Table 14). After removing outlier SNPs which had horizontal pleiotropy, the corrected MR-PRESSO analysis showed consistent causal estimates with IVW analysis.
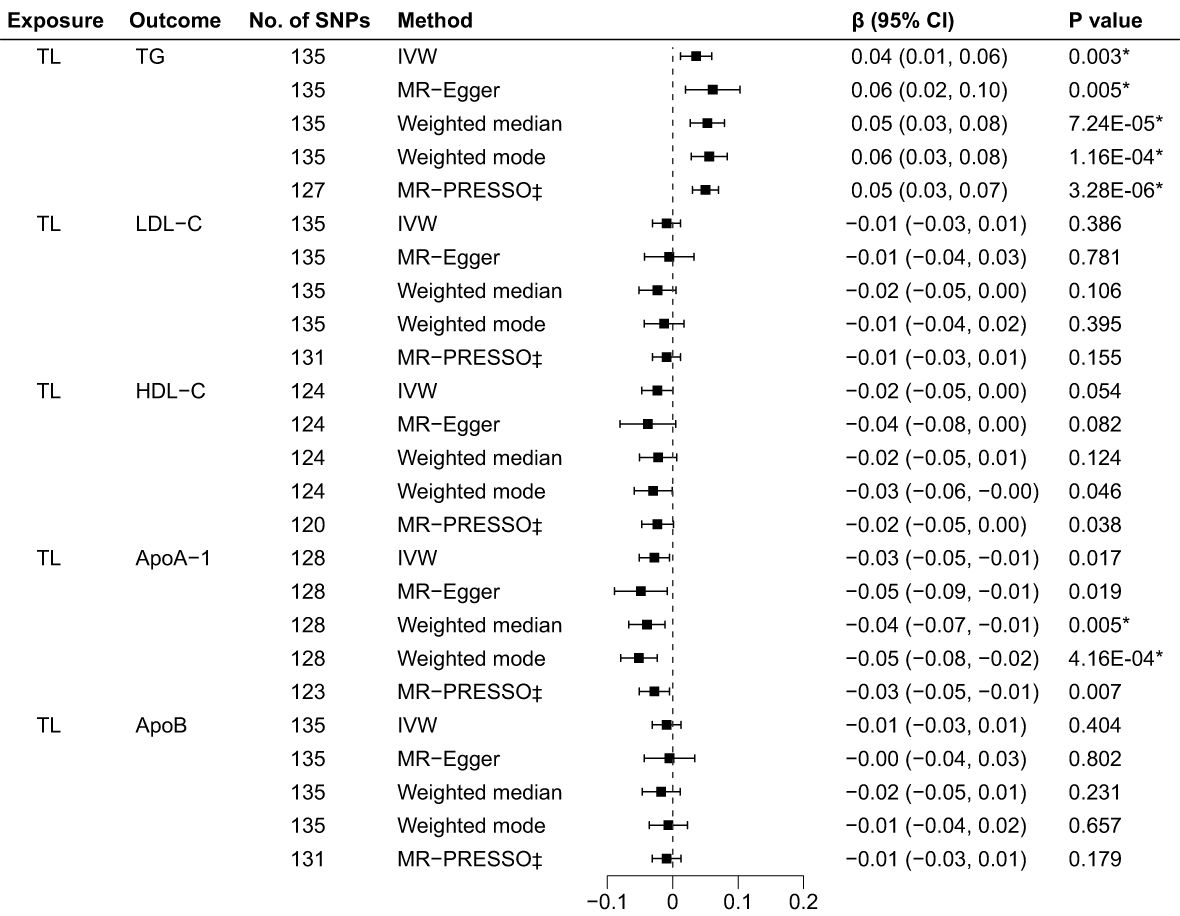
Figure 2 Associations of TL and BL in the forward MR analyses. TL, telomere length; BL, blood lipids; MR, Mendelian randomization; SNPs, single nucleotide polymorphisms; OR, odds ratio; CI, confidence interval; IVW, inverse variance weighted (random-effects model); TG, triglycerides; LDL-C, low-density lipoprotein cholesterol; HDL-C, high-density lipoprotein cholesterol; ApoA-1, apolipoprotein A-1; ApoB, apolipoprotein B; *Bonferroni-corrected P < 0.005 (0.05/10 = 0.005) was used to determine statistical significance; ‡MRgnifica instrumental variable outlier removed.
Cochran’s Q test indicated different degrees of heterogeneity (Table 1; all P-values of Cochran’s Q < 0.05), whereas funnel plots revealed no perceptible heterogeneity (Supplementary Figure 3). Furthermore, the leave-one-out analysis showed no significant changes after eliminating any single SNP, suggesting the stability of the observed associations (Supplementary Figure 4).
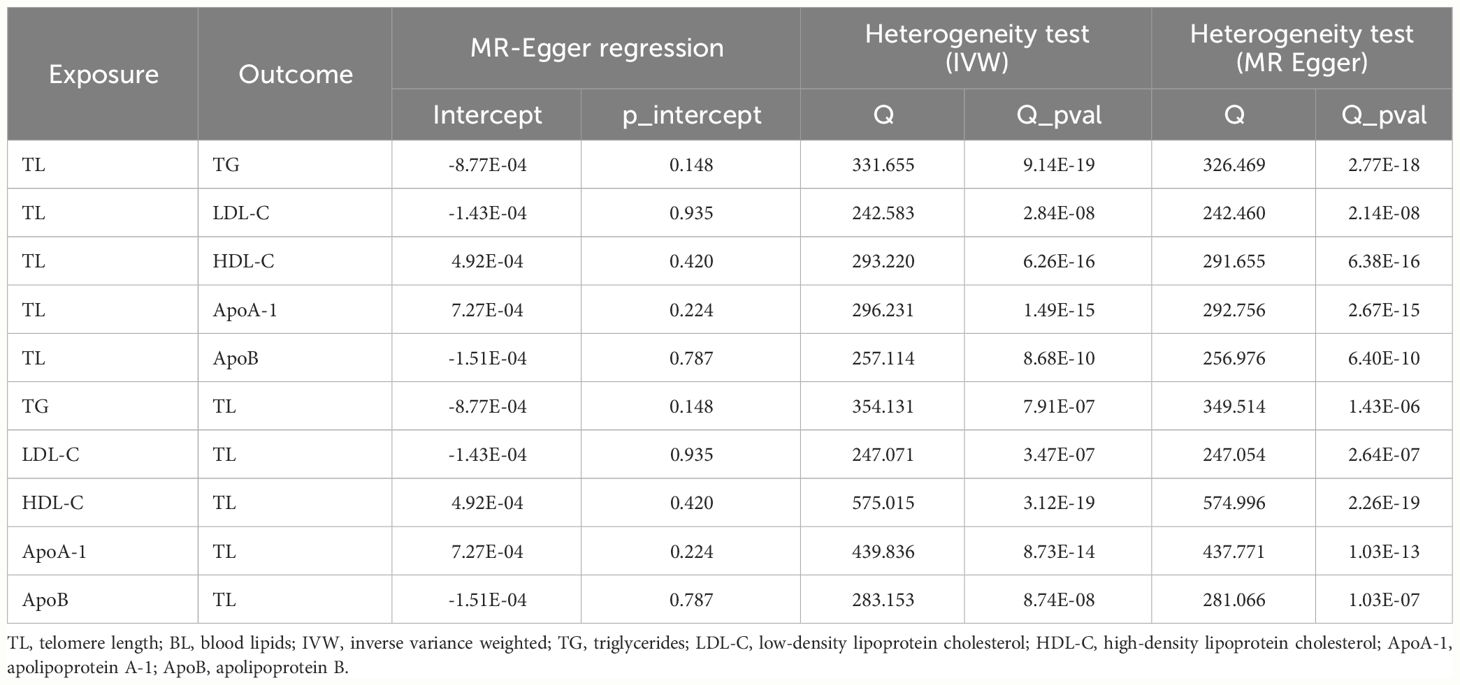
Table 1 Heterogeneity and horizontal pleiotropy analysis.
3.1.2 Mediation analysis
We conducted two-step MR analysis to investigate the mediating pathway from TL to TG via five obesity-related phenotypes, including BMI, BFP, WHR, HC and WC. In the first step, we estimated the correlation across TL and potential mediators. Among the five obesity-related phenotypes, we found positive significant association between TL and WC (β = 0.07, 95% CI: 7.64E-04 to 0.13, p = 0.047) (Supplementary Table 16). In the second step, we evaluated the causal effects for obesity-related phenotypes on TG, and we only identified positive causal effect of WC (β=0.09, 95% CI: 0.04 to 0.13, p = 2.23E-04) on TG. Finally, we assessed the mediation effect of TL on TG acting through WC, and no significant mediation effect was found (β = 0.01, 95% CI: -8.91E-04 to 0.01, p = 0.081) (Table 2).
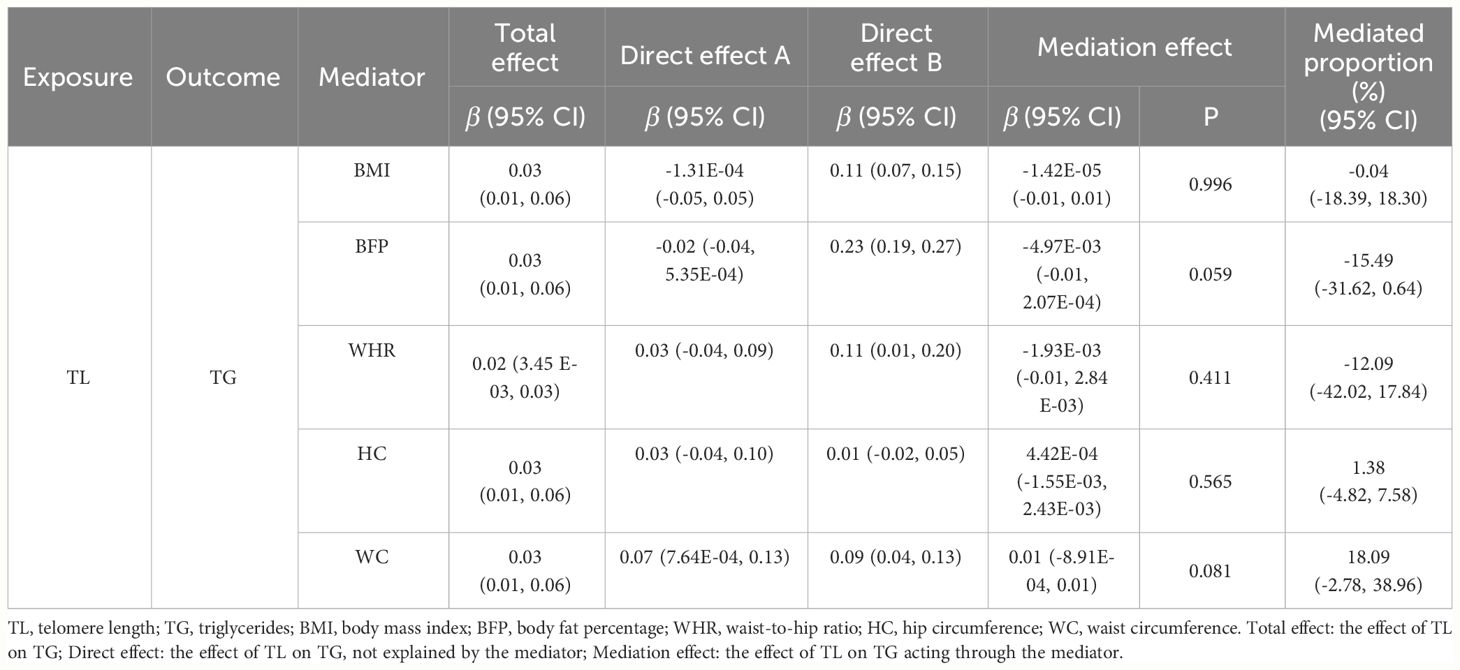
Table 2 The mediation effect of TL on TG via obesity-related phenotypes.
3.2 Estimates of the causal effect of BL on TL
3.2.1 Univariable MR
As illustrated in Figure 3, the genetically predicted TG, LDL-C, and ApoB levels were positively correlated to TL after Bonferroni correction. Using IVW in the reverse MR analyses, the estimates of causal effect for each SD higher level of TG was 0.02 SD longer TL (95% CI: 0.01 to 0.03, p = 0.004). Similar estimates of causal effect were observed for LDL-C (β = 0.03, 95% CI: 0.01 to 0.04, p = 0.001) and ApoB (β = 0.03, 95% CI: 0.01 to 0.04, p = 9.71×10⁻⁵) on TL. In contrast, the estimates of causal effect were nonsignificant across both HDL-C (β = -0.01, 95%CI: -0.02 to 0.006, p = 0.303) and ApoA-1 (β = -0.02, 95%CI: -0.03 to -0.001, p = 0.040) on TL. Other MR approach also suggested similar results. Furthermore, the causal effects for LDL-C on TL estimated through MR-Egger (β = 0.03, 95% CI: 0.01 to 0.05, p = 0.021) and weighted median (β = 0.03, 95% CI: 0.01 to 0.05, p = 0.012) did not achieve significance threshold after Bonferroni correction, indicating a proposing correlation. The MR-PRESSO test identified 6 outlier SNPs for HDL-C, 2 for ApoA-1 and 2 for ApoB. No outlier SNPs were identified for the LDL-C or TG levels (Supplementary Table 14). The MR-PRESSO analysis exhibited compatible results with the IVW analysis. The scatter plots (Supplementary Figure 5) and forest plots (Supplementary Figure 6) show consistent estimates of the causal effect of BL on TL.
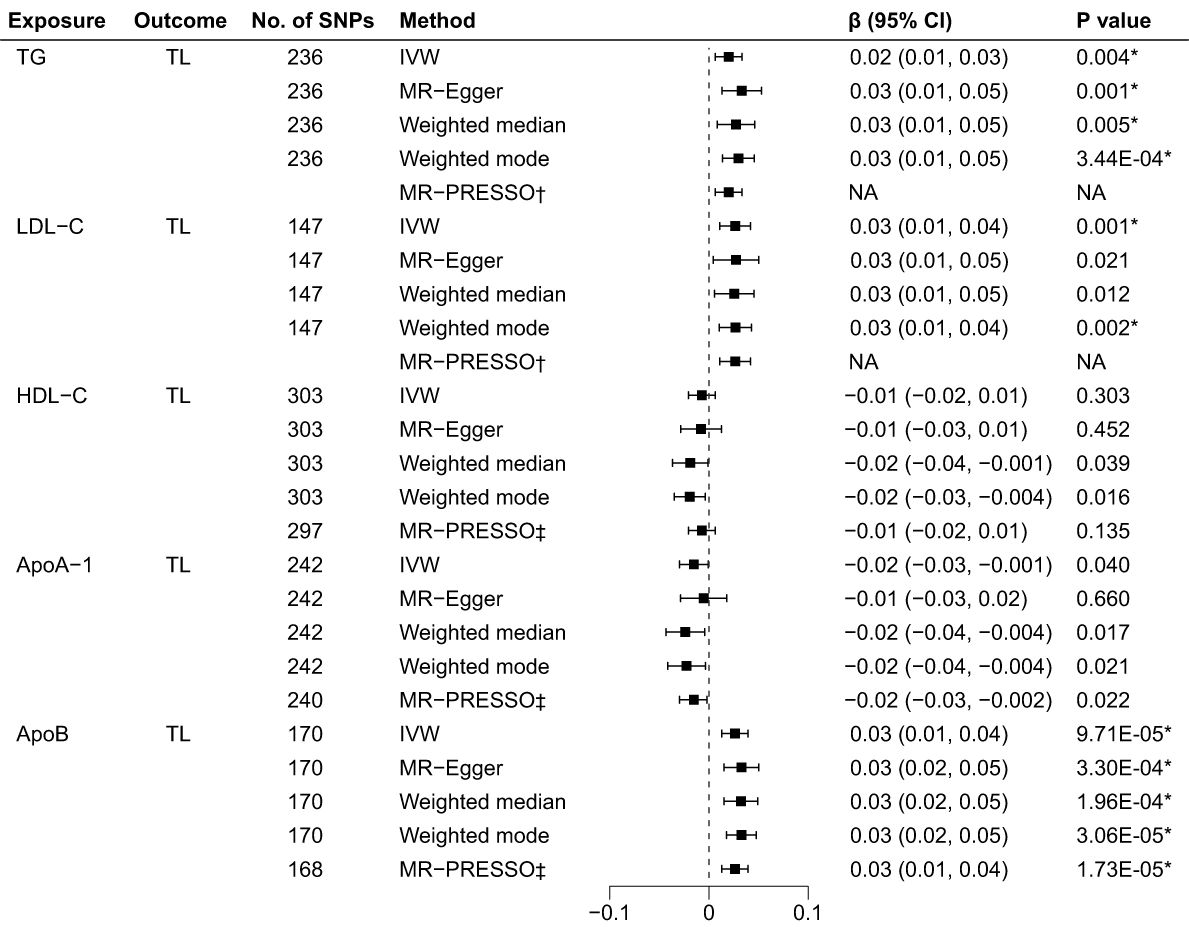
Figure 3 Associations of BL and TL in the reverse MR analyses. BL, blood lipids; TL, telomere length; MR, Mendelian randomization; SNPs, single nucleotide polymorphisms; IVW, inverse variance weighted; OR, odds ratio; CI, confidence interval; TG, triglycerides; LDL-C, low-density lipoprotein cholesterol; HDL-C, high-density lipoprotein cholesterol; ApoA-1, apolipoprotein A-1; ApoB, apolipoprotein B; *Bonferroni-corrected P < 0.005 (0.05/10 = 0.005) was used to determine statistical significance; †No outlier detected; ‡MRtected; instrumental variable outlier removed.
The MR-Egger regression test showed no evidence of horizontal pleiotropy and Cochran’s Q test indicated evident heterogeneity (Table 1). However, funnel plots (Supplementary Figure 7) suggested no potential existence of heterogeneity. The leave-one-out analysis also revealed the robustness of the observed results (Supplementary Figure 8).
3.2.2 Multivariable MR
Considering the correlation across BL traits, we performed multivariable MR analysis to simultaneously estimate the direct effect of special BL trait on TL conditioned on other BL traits (Table 3). The independent instruments used for multivariable MR are listed in Supplementary Table 14. The multivariable IVW estimates for TG (β = 0.04, 95% CI: -0.06 to 0.14, p = 0.437), LDL-C (β = -0.20, 95% CI: -0.95 to 0.55, p = 0.598) and ApoB (β = 0.18, 95% CI: -0.46 to 0.81, p = 0.586) on TL were not significant, which was inconsistent with univariable IVW estimates. The results indicated potentially unstable relationship between TG, LDL-C, ApoB and TL. The multivariable IVW estimates for HDL-C (β = 0.002, 95% CI: -0.11 to 0.11, p = 0.966) and ApoA-1 (β = -0.02, 95% CI: -0.13 to 0.09, p = 0.714) on TL were also not significant.
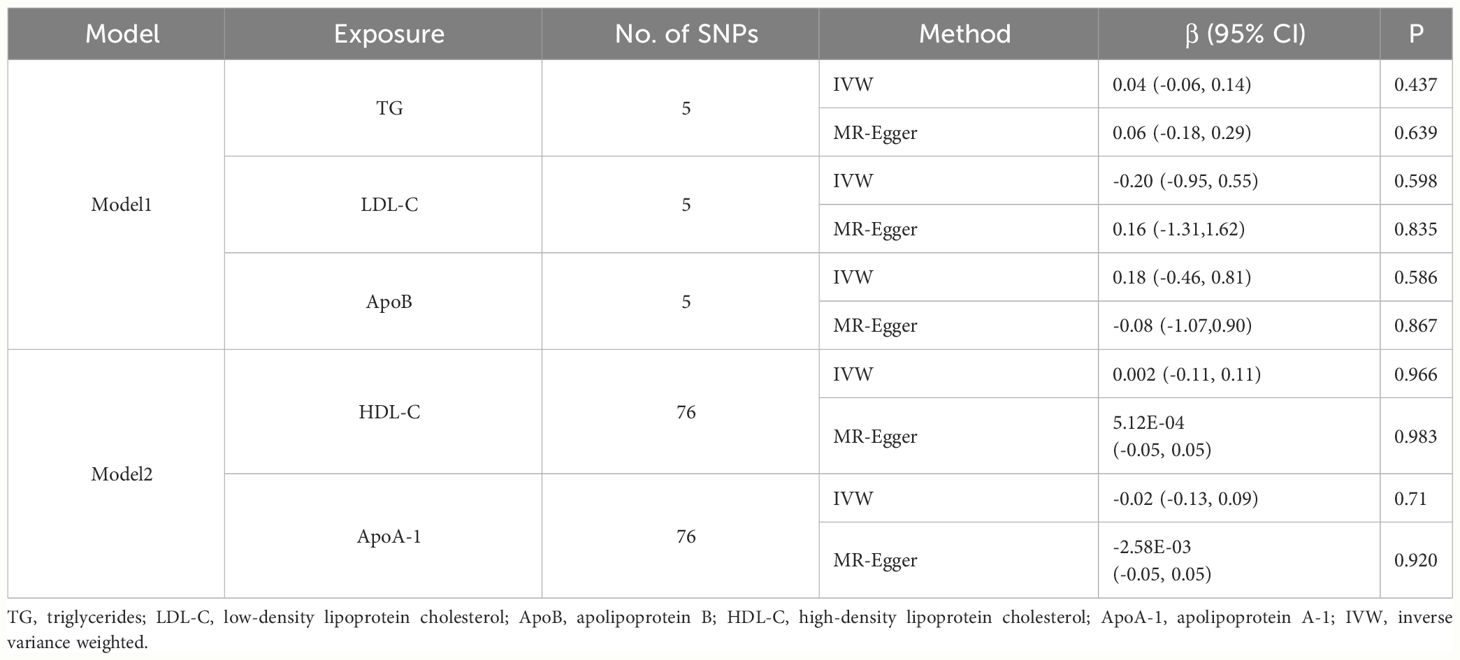
Table 3 The multivariable effect of BL on TL.
3.2.3 Mediation analysis
We conducted two-step MR analysis to explore whether the effect of TG, LDL-C and ApoB on TL was mediated via obesity-related phenotypes, i.e., BMI, BFP, WHR, HC and WC. In the first step, we assessed the causal effects for TG, LDL-C and ApoB on the five obesity-related phenotypes. Significant associations were identified for TG on WHR (β = 0.09, 95% CI: 0.04 to 0.14, p = 5.61E-04) and HC (β = -0.09, 95% CI: -0.14 to -0.04, p = 2.00E-04) (Supplementary Table 17). The results also showed significant causal effects for LDL-C on BMI (β = -0.08, 95% CI: -0.12 to -0.04, p = 1.57E-04) and WHR (β = -0.06, 95% CI: -0.10 to -0.02; p = 0.006), as well as AopB on HC (β = -0.07, 95% CI: -0.13 to -0.01, p = 0.016). In the second step, we estimated the causal effects for BMI, WHR and HC on TL, and we found evidence that BMI (β = -0.04, 95% CI: -0.07 to -0.01, p = 0.011) was significantly associated with TL. Ultimately, we assessed the mediation effects for TG, LDL-C and ApoB on TL via potential mediators. We only identified significant mediation effect of LDL-C on TL acting via BMI (β = 2.97E-03, 95% CI: 1.44E-04 to 5.79E-03, p = 0.035) with a mediated proportion of 12.83% (95% CI: 0.62% to 25.04%) (Table 4).
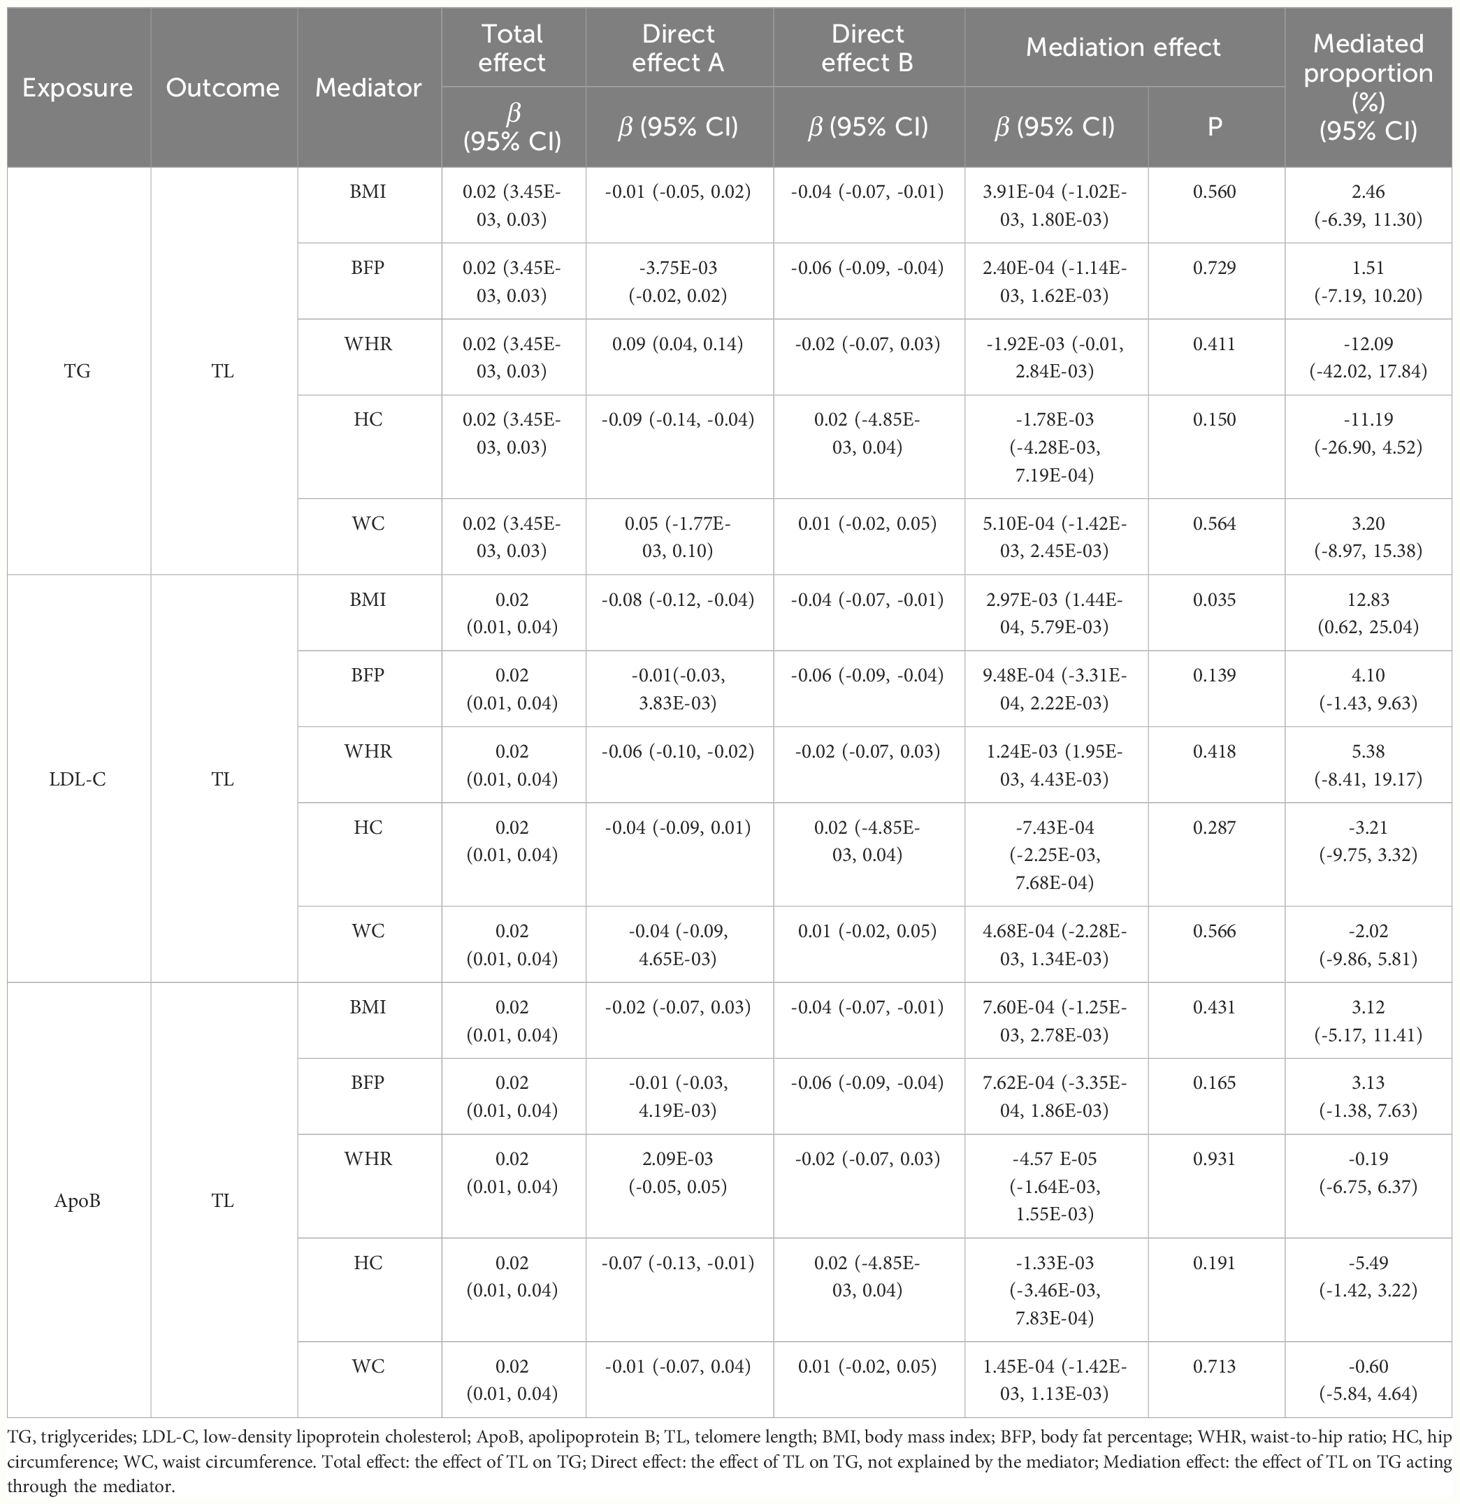
Table 4 The mediation effect of TG, LDL-C and ApoB on TL via obesity-related phenotypes.
4 Discussion
Previous research has reported inconsistent associations between TL and lipid traits (66–71), which poses challenges in drawing conclusive inferences about their causal relationship. In this study, we attempted to disentangle the causal relationship between TL and BL by leveraging substantial sample sizes and GWAS summary statistics. Given that TL serves as a clinical indicator of aging and age-related disease risk, clarifying this association is of great significance, because BL levels are also associated with these diseases (4, 5).
Our MR analyses provided reliable and robust findings regarding the associations between TL and BL, revealing the causal effect of TL on specific BL, and vice versa. Specifically, in the forward MR analyses, TL was significantly positively associated with TG levels, indicating that a longer TL predicted higher TG levels. In the reverse MR analysis, genetically predicted TG, LDL-C, and ApoB levels were positively correlated with TL, suggesting that higher TG, LDL-C, and ApoB levels predicted longer TL, although this relationship was not observed in the multivariate MR analysis. Additionally, we conducted mediation analysis to estimate potential mediating factors; analysis of TL with TG showed no significant mediation effects acting through obesity-related phenotypes, while the impact of LDL-C on TL was partially mediated by BMI, although the indirect effect was smaller than the total effect.
Our study found that higher TG, LDL-C, and ApoB levels predicted longer TL. Although our MR findings conflict with several relatively smaller observational studies (67, 72), they align with the results of the largest cross-sectional study conducted to date investigating these relationships (68). This study reported that higher levels of TG, LDL-C, and ApoB were associated with 0.48,1.04, and 0.96 years of age‐related TL change, respectively. This potentially beneficial role of BL in TL may facilitate prevention strategies and interventions directed toward clinical aging and age-related diseases. Multiple studies have contributed to understanding this relationship. A large-scale study of over 500,000 Chinese adults found that lower plasma LDL-C and TG levels were associated with increased ICH risk (12). The underlying mechanism is not fully understood but may be related to the increased vascular wall permeability associated with lower cholesterol levels (73). Additionally, higher LDL-C levels have shown an inverse correlation with dementia, indicating a potential protective role against cognitive decline (14). MR analysis also supported the association between lower LDL-C levels and increased risk of ICH and dementia, raising concerns about excessively low LDL-C levels (74). Moreover, LDL-C has been found to have a protective effect against type 2 diabetes (T2DM) (75), which may explain the slight increase in T2DM risk associated with statin therapy (15). The association between LDL-C levels and cancer is also inconsistent with its relationship to cardiovascular disease, with some studies showing a positive association between low LDL-C levels and cancer risk (13). These observations have implications in understanding the potentially beneficial effects of BL on telomere-related aging and age-related diseases. It is crucial to consider the delicate balance among cardiovascular benefits, potential aging, and age-related disease risks when managing LDL-C levels. Further research is necessary to elucidate the underlying mechanisms and develop targeted interventions to optimize health outcomes in individuals at risk for age-related conditions.
However, the mechanisms underlying the association between the TL and BL remain unclear. Oxidative and chronic inflammatory stress are thought to play crucial roles (76). The occurrence of dyslipidemia is frequently accompanied by changes in some inflammatory markers (77). It is worth noting that TL has been shown to be correlated with levels of inflammatory markers (67, 69). Oxidative stress is considered a major driving factor of telomere attrition (78, 79). Furthermore, oxidative stress directly affects lipid metabolism, leading to abnormal lipid levels. TL serves as a marker of DNA damage, and telomere dysfunction is caused by critically short telomeres or structural changes, ultimately resulting in replicative cell senescence and chromosomal instability, both of which are hallmarks of aging. However, studies have also found that longer telomeres are associated with a higher risk of incident myocardial infarction in healthy participants aged 65 years or older (18). A plausible explanation could be that telomeres inhibit further replication in senescent cells. Specifically, telomere attrition may lead to replicative senescence, which may serve as a mechanism for restricting elevated BL levels and atherosclerosis progression (80, 81), potentially similar to their inhibitory effects on carcinogenesis (82). Shortening of TL and cessation of proliferation in aging cell lines within the endothelium may be equally important as long telomeres in preventing the accumulation of DNA mutations. Overall, these findings partially explain the relationship between BL and TL. Nonetheless, future cellular and molecular research is necessary to elucidate these potential mechanisms.
We conducted a bidirectional two-step MR mediation analysis; the analysis of TL with TG showed no significant mediation effects, whereas the reverse MR results indicated that the protective effect of higher LDL-C levels on TL was partially mediated through a reduction in BMI, although the indirect effect was smaller than the total effect. In the first MR step, univariate MR established a causal relationship between LDL-C and BMI, showing that increased LDL-C levels were associated with decreased BMI. Previous studies reported inconsistent results regarding the association between BMI and BL. Several studies have reported a negative correlation between BMI and LDL-C levels (64, 83). Additionally, some studies have shown a nonlinear relationship between BMI and LDL-C (84), with LDL-C levels tending to plateau or decrease with increasing BMI in overweight populations (85). Furthermore, the association between BMI and LDL-C level may vary across sex and age subgroups. The diminishing correlation between BMI and LDL-C levels suggests metabolic impairment due to aging or other metabolic disorders. These findings are consistent with our first-step estimations. The second step of our MR analysis provided evidence that a genetically predicted lower BMI was associated with longer TL. Several published MR studies have reported causal evidence for BMI as a risk factor for TL or related phenotypes (86, 87), consistent with the estimations from the second step of our mediation analysis. Mechanistically, obesity-related metabolic dysregulation leads to oxidative stress, resulting in telomere shortening (88). Furthermore, obesity-induced inflammation partially mediates the negative association between BMI and TL (87, 89). In conclusion, these studies provided compelling evidence supporting the mediating effect of BMI.
Our study exhibits several strengths. First, we utilized summary statistics derived from large-scale GWASs to provide a solid foundation for our research. Furthermore, we employed a range of techniques to minimize the risk of violating the assumptions of MR, including the evaluation of index SNP associations with confounders, the use of Steiger filtering to effectively reduce the potential influence of reverse causation driven by genetic instruments and the selection of a primary method known for its resistance to pleiotropy, along with sensitivity analyses using alternative methods. If increasing blood lipid levels indeed provide protective effects with respect to telomeres, it could be a modifiable factor that could potentially help mitigate the risk of age-related diseases.
Our study also has several limitations that should be acknowledged. First, the MR approach relies on genetic instruments to represent lifelong differences in exposure levels, assuming that these instruments accurately estimate causal effects on the outcome. However, it is crucial to consider that developmental adaptation can alter the effects of these genetic instruments on outcomes (90). In addition, two-sample MR methods rely on GWAS summary statistics and assume a linear relationship between exposure and outcomes. Finally, as both the exposure and outcome in this study were derived from European populations, caution should be exercised when generalizing the research findings to other racial or ethnic groups.
In summary, this study employed large-scale exposure and outcome GWAS data for MR analysis to elucidate the causal relationship between TL and BL. We found robust genetic evidence supporting the causal effects of TL on TG, whereas reverse MR analyses identified protective causal relationships among TG, LDL-C, and ApoB on TL, with BMI partially mediating the causal effect of LDL-C on TL. Our findings provide insights into preventive strategies and interventions targeting TL-related aging and age-related diseases.
Data availability statement
Publicly available datasets were analyzed in this study. All summary level GWAS results are publicly available from the IEUOpenGWAS platform, accessible at https://gwas.mrcieu.ac.uk/.
Ethics statement
The current Mendelian randomization analysis utilized summary data from prior studies that had obtained written informed consent and ethical approval. The secondary analysis of summary data does not necessitate an additional ethical permit.
Author contributions
SY: Conceptualization, Data curation, Formal analysis, Writing – original draft, Writing – review & editing. XW: Validation, Writing – review & editing. YL: Validation, Writing – review & editing. LZ: Validation, Writing – review & editing. GG: Project administration, Supervision, Writing – review & editing. MW: Project administration, Supervision, Validation, Funding acquisition, Writing – review & editing.
Funding
The author(s) declare financial support was received for the research, authorship, and/or publication of this article. This project was supported by the National Natural Science Foundation of China (No. 81202805, 82074254, 82374281), the Beijing Natural Science Foundation (No.7172185), and the Science and Technology Innovation Project of China Academy of Chinese Medical Science (C12021A01413).
Conflict of interest
The authors declare that the research was conducted in the absence of any commercial or financial relationships that could be construed as a potential conflict of interest.
Publisher’s note
All claims expressed in this article are solely those of the authors and do not necessarily represent those of their affiliated organizations, or those of the publisher, the editors and the reviewers. Any product that may be evaluated in this article, or claim that may be made by its manufacturer, is not guaranteed or endorsed by the publisher.
Supplementary material
The Supplementary Material for this article can be found online at: https://www.frontiersin.org/articles/10.3389/fendo.2024.1338698/full#supplementary-material
References
1. Blackburn EH. Structure and function of telomeres. Nature. (1991) 350:569–73. doi: 10.1038/350569a0
2. Blackburn EH, Epel ES, Lin J. Human telomere biology: A contributory and interactive factor in aging, disease risks, and protection. Science. (2015) 350:1193–8. doi: 10.1126/science.aab3389
3. Cheng F, Carroll L, Joglekar MV, Januszewski AS, Wong KK, Hardikar AA, et al. Diabetes, metabolic disease, and telomere length. Lancet Diabetes Endocrinol. (2021) 9:117–26. doi: 10.1016/S2213-8587(20)30365-X
4. Rossiello F, Jurk D, Passos JF, d'Adda di Fagagna F. Telomere dysfunction in ageing and age-related diseases. Nat Cell Biol. (2022) 24:135–47. doi: 10.1038/s41556-022-00842-x
5. Fasching CL. Telomere length measurement as a clinical biomarker of aging and disease. Crit Rev Clin Lab Sci. (2018) 55:443–65. doi: 10.1080/10408363.2018.1504274
6. Turner KJ, Vasu V, Griffin DK. Telomere biology and human phenotype. Cells. (2019) 8(1). doi: 10.3390/cells8010073
7. Arvanitis M, Lowenstein CJ. Dyslipidemia. Ann Intern Med. (2023) 176:Itc81–itc96. doi: 10.7326/aitc202306200
8. Berberich AJ, Hegele RA. A modern approach to dyslipidemia. Endocr Rev. (2022) 43:611–53. doi: 10.1210/endrev/bnab037
9. Pirillo A, Casula M, Olmastroni E, Norata GD, Catapano AL. Global epidemiology of dyslipidaemias. Nat Rev Cardiol. (2021) 18:689–700. doi: 10.1038/s41569–021-00541–4
10. Mach F, Baigent C, Catapano AL, Koskinas KC, Casula M, Badimon L, et al. 2019 Esc/Eas guidelines for the management of dyslipidaemias: Lipid modification to reduce cardiovascular risk. Eur Heart J. (2020) 41(1):111–88. doi: 10.1093/eurheartj/ehz455
11. Domanski MJ, Tian X, Wu CO, Reis JP, Dey AK, Gu Y, et al. Time course of ldl cholesterol exposure and cardiovascular disease event risk. J Am Coll Cardiol. (2020) 76:1507–16. doi: 10.1016/j.jacc.2020.07.059
12. Sun L, Clarke R, Bennett D, Guo Y, Walters RG, Hill M, et al. Causal associations of blood lipids with risk of ischemic stroke and intracerebral hemorrhage in Chinese adults. Nat Med. (2019) 25:569–74. doi: 10.1038/s41591-019-0366-x
13. Li M, Lu J, Fu J, Wan Q, Wang T, Huo Y, et al. The association and joint effect of serum cholesterol, glycemic status with the risk of incident cancer among middle-aged and elderly population in China cardiometabolic disease and cancer cohort (4c)-study. Am J Cancer Res. (2020) 10:975–86.
14. Zhou F, Deng W, Ding D, Zhao Q, Liang X, Wang F, et al. High low-density lipoprotein cholesterol inversely relates to dementia in community-dwelling older adults: the Shanghai aging study. Front Neurol. (2018) 9:952. doi: 10.3389/fneur.2018.00952
15. Sattar N, Preiss D, Murray HM, Welsh P, Buckley BM, de Craen AJ, et al. Statins and risk of incident diabetes: A collaborative meta-analysis of randomised statin trials. Lancet. (2010) 375:735–42. doi: 10.1016/s0140–6736(09)61965–6
16. Chen YF, Zhou KW, Yang GZ, Chen C. Association between lipoproteins and telomere length in us adults: data from the Nhanes 1999–2002. Lipids Health Dis. (2019) 18:80. doi: 10.1186/s12944–019-1030–7
17. Banach M, Mazidi M, Mikhailidis DP, Toth PP, Jozwiak J, Rysz J, et al. Association between phenotypic familial hypercholesterolaemia and telomere length in us adults: results from a multi-ethnic survey. Eur Heart J. (2018) 39:3635–40. doi: 10.1093/eurheartj/ehy527
18. Østhus I, Lydersen S, Dalen H, Nauman J, Wisløff U. Association of telomere length with myocardial infarction: A prospective cohort from the population based hunt 2 study. Prog Cardiovasc Dis. (2017) 59:649–55. doi: 10.1016/j.pcad.2017.04.001
19. Lee M, Martin H, Firpo MA, Demerath EW. Inverse association between adiposity and telomere length: the fels longitudinal study. Am J Hum Biol. (2011) 23:100–6. doi: 10.1002/ajhb.21109
20. Salpea KD, Nicaud V, Tiret L, Talmud PJ, Humphries SE. The association of telomere length with paternal history of premature myocardial infarction in the European atherosclerosis research study ii. J Mol Med (Berl). (2008) 86:815–24. doi: 10.1007/s00109-008-0347-x
21. Bekaert S, De Meyer T, Rietzschel ER, De Buyzere ML, De Bacquer D, Langlois M, et al. Telomere length and cardiovascular risk factors in a middle-aged population free of overt cardiovascular disease. Aging Cell. (2007) 6:639–47. doi: 10.1111/j.1474-9726.2007.00321.x
22. Nilsson PM, Tufvesson H, Leosdottir M, Melander O. Telomeres and cardiovascular disease risk: an update 2013. Transl Res. (2013) 162:371–80. doi: 10.1016/j.trsl.2013.05.004
23. Fernández-Alvira JM, Fuster V, Dorado B, Soberón N, Flores I, Gallardo M, et al. Short telomere load, telomere length, and subclinical atherosclerosis: the Pesa study. J Am Coll Cardiol. (2016) 67:2467–76. doi: 10.1016/j.jacc.2016.03.530
24. Sekula P, Del Greco MF, Pattaro C, Köttgen A. Mendelian randomization as an approach to assess causality using observational data. J Am Soc Nephrol. (2016) 27:3253–65. doi: 10.1681/asn.2016010098
25. Emdin CA, Khera AV, Kathiresan S. Mendelian randomization. Jama. (2017) 318:1925–6. doi: 10.1001/jama.2017.17219
26. Neeland IJ, Kozlitina J. Mendelian randomization: using natural genetic variation to assess the causal role of modifiable risk factors in observational studies. Circulation. (2017) 135:755–8. doi: 10.1161/circulationaha.117.026857
27. Xu J, Li M, Gao Y, Liu M, Shi S, Shi J, et al. Using mendelian randomization as the cornerstone for causal inference in epidemiology. Environ Sci pollut Res Int. (2022) 29:5827–39. doi: 10.1007/s11356–021-15939–3
28. Davies NM, Holmes MV, Davey Smith G. Reading mendelian randomisation studies: A guide, glossary, and checklist for clinicians. Bmj. (2018) 362:k601. doi: 10.1136/bmj.k601
29. Gupta V, Walia GK, Sachdeva MP. 'Mendelian randomization': an approach for exploring causal relations in epidemiology. Public Health. (2017) 145:113–9. doi: 10.1016/j.puhe.2016.12.033
30. Zhao Q, Chen Y, Wang J, Small DS. Powerful three-sample genome-wide design and robust statistical inference in summary-data mendelian randomization. Int J Epidemiol. (2019) 48:1478–92. doi: 10.1093/ije/dyz142
31. Porcu E, Rüeger S, Lepik K, Santoni FA, Reymond A, Kutalik Z. Mendelian randomization integrating gwas and eqtl data reveals genetic determinants of complex and clinical traits. Nat Commun. (2019) 10:3300. doi: 10.1038/s41467–019-10936–0
32. Nussbaumerova B, Rosolova H. Obesity and dyslipidemia. Curr Atheroscler Rep. (2023) 25:947–55. doi: 10.1007/s11883–023-01167–2
33. Burgess S, Thompson SG. Multivariable mendelian randomization: the use of pleiotropic genetic variants to estimate causal effects. Am J Epidemiol. (2015) 181:251–60. doi: 10.1093/aje/kwu283
34. Davey Smith G, Ebrahim S. What can mendelian randomisation tell us about modifiable behavioural and environmental exposures? Bmj. (2005) 330:1076–9. doi: 10.1136/bmj.330.7499.1076
35. Abecasis GR, Auton A, Brooks LD, DePristo MA, Durbin RM, Handsaker RE, et al. An integrated map of genetic variation from 1,092 human genomes. Nature. (2012) 491:56–65. doi: 10.1038/nature11632
36. Purcell S, Neale B, Todd-Brown K, Thomas L, Ferreira MA, Bender D, et al. Plink: A tool set for whole-genome association and population-based linkage analyses. Am J Hum Genet. (2007) 81:559–75. doi: 10.1086/519795
37. Kamat MA, Blackshaw JA, Young R, Surendran P, Burgess S, Danesh J, et al. Phenoscanner V2: an expanded tool for searching human genotype-phenotype associations. Bioinformatics. (2019) 35:4851–3. doi: 10.1093/bioinformatics/btz469
38. Hemani G, Tilling K, Davey Smith G. Orienting the causal relationship between imprecisely measured traits using gwas summary data. PloS Genet. (2017) 13:e1007081. doi: 10.1371/journal.pgen.1007081
39. Codd V, Denniff M, Swinfield C, Warner SC, Papakonstantinou M, Sheth S, et al. Measurement and initial characterization of leukocyte telomere length in 474,074 participants in uk biobank. Nat Aging. (2022) 2:170–9. doi: 10.1038/s43587–021-00166–9
40. Chen S, Cheng W. Relationship between lipid profiles and hypertension: A cross-sectional study of 62,957 Chinese adult males. Front Public Health. (2022) 10:895499. doi: 10.3389/fpubh.2022.895499
41. Chimura Y, Daimon T, Wakabayashi I. Proneness to high blood lipid-related indices in female smokers. Lipids Health Dis. (2019) 18:113. doi: 10.1186/s12944–019-1050–3
42. Marcadenti A, Fuchs FD, Moreira LB, Gus M, Fuchs SC. Adiposity phenotypes are associated with type-2 diabetes: lap index, body adiposity index, and neck circumference. Atherosclerosis. (2017) 266:145–50. doi: 10.1016/j.atherosclerosis.2017.09.022
43. Sundfør TM, Svendsen M, Heggen E, Dushanov S, Klemsdal TO, Tonstad S. Bmi modifies the effect of dietary fat on atherogenic lipids: A randomized clinical trial. Am J Clin Nutr. (2019) 110:832–41. doi: 10.1093/ajcn/nqz113
44. Wang Q, Chen C, Ding Q, Zhao Y, Wang Z, Chen J, et al. Mettl3-mediated M(6)a modification of hdgf mrna promotes gastric cancer progression and has prognostic significance. Gut. (2020) 69:1193–205. doi: 10.1136/gutjnl-2019–319639
45. Richardson TG, Sanderson E, Palmer TM, Ala-Korpela M, Ference BA, Davey Smith G, et al. Evaluating the relationship between circulating lipoprotein lipids and apolipoproteins with risk of coronary heart disease: A multivariable mendelian randomisation analysis. PloS Med. (2020) 17:e1003062. doi: 10.1371/journal.pmed.1003062
46. Wang J, Dong X, Cao L, Sun Y, Qiu Y, Zhang Y, et al. Association between telomere length and diabetes mellitus: A meta-analysis. J Int Med Res. (2016) 44:1156–73. doi: 10.1177/0300060516667132
47. Liu P, Zhang Y, Ma L. Telomere length and associated factors in older adults with hypertension. J Int Med Res. (2019) 47:5465–74. doi: 10.1177/0300060519882570
48. Astuti Y, Wardhana A, Watkins J, Wulaningsih W. Cigarette smoking and telomere length: A systematic review of 84 studies and meta-analysis. Environ Res. (2017) 158:480–9. doi: 10.1016/j.envres.2017.06.038
49. Müezzinler A, Zaineddin AK, Brenner H. Body mass index and leukocyte telomere length in adults: A systematic review and meta-analysis. Obes Rev. (2014) 15:192–201. doi: 10.1111/obr.12126
50. Locke AE, Kahali B, Berndt SI, Justice AE, Pers TH, Day FR, et al. Genetic studies of body mass index yield new insights for obesity biology. Nature. (2015) 518:197–206. doi: 10.1038/nature14177
51. Shungin D, Winkler TW, Croteau-Chonka DC, Ferreira T, Locke AE, Mägi R, et al. New genetic loci link adipose and insulin biology to body fat distribution. Nature. (2015) 518:187–96. doi: 10.1038/nature14132
52. Burgess S, Thompson SG. Bias in causal estimates from mendelian randomization studies with weak instruments. Stat Med. (2011) 30:1312–23. doi: 10.1002/sim.4197
53. Burgess S, Thompson SG. Avoiding bias from weak instruments in mendelian randomization studies. Int J Epidemiol. (2011) 40:755–64. doi: 10.1093/ije/dyr036
54. Burgess S, Butterworth A, Thompson SG. Mendelian randomization analysis with multiple genetic variants using summarized data. Genet Epidemiol. (2013) 37:658–65. doi: 10.1002/gepi.21758
55. Bowden J, Davey Smith G, Burgess S. Mendelian randomization with invalid instruments: effect estimation and bias detection through egger regression. Int J Epidemiol. (2015) 44:512–25. doi: 10.1093/ije/dyv080
56. Bowden J, Davey Smith G, Haycock PC, Burgess S. Consistent estimation in mendelian randomization with some invalid instruments using a weighted median estimator. Genet Epidemiol. (2016) 40:304–14. doi: 10.1002/gepi.21965
57. Yavorska OO, Burgess S. Mendelianrandomization: an R package for performing mendelian randomization analyses using summarized data. Int J Epidemiol. (2017) 46:1734–9. doi: 10.1093/ije/dyx034
58. Cohen JF, Chalumeau M, Cohen R, Korevaar DA, Khoshnood B, Bossuyt PM. Cochran's Q test was useful to assess heterogeneity in likelihood ratios in studies of diagnostic accuracy. J Clin Epidemiol. (2015) 68:299–306. doi: 10.1016/j.jclinepi.2014.09.005
59. Verbanck M, Chen CY, Neale B, Do R. Detection of widespread horizontal pleiotropy in causal relationships inferred from mendelian randomization between complex traits and diseases. Nat Genet. (2018) 50:693–8. doi: 10.1038/s41588–018-0099–7
60. Sanderson E, Davey Smith G, Windmeijer F, Bowden J. An examination of multivariable mendelian randomization in the single-sample and two-sample summary data settings. Int J Epidemiol. (2019) 48:713–27. doi: 10.1093/ije/dyy262
61. Li JJ, Zhao SP, Zhao D, Lu GP, Peng DQ, Liu J, et al. 2023 Chinese guideline for lipid management. Front Pharmacol. (2023) 14:1190934. doi: 10.3389/fphar.2023.1190934
62. VanderWeele TJ. Mediation analysis: A practitioner's guide. Annu Rev Public Health. (2016) 37:17–32. doi: 10.1146/annurev-publhealth-032315–021402
63. Carter AR, Gill D, Davies NM, Taylor AE, Tillmann T, Vaucher J, et al. Understanding the consequences of education inequality on cardiovascular disease: mendelian randomisation study. Bmj. (2019) 365:l1855. doi: 10.1136/bmj.l1855
64. Mutie PM, Pomares-Milan H, Atabaki-Pasdar N, Coral D, Fitipaldi H, Tsereteli N, et al. Investigating the causal relationships between excess adiposity and cardiometabolic health in men and women. Diabetologia. (2023) 66:321–35. doi: 10.1007/s00125–022-05811–5
65. Wang X, Wen J, Qu Q, Gu S, Zhang L, Li Y, et al. Association of weight range with telomere length: A retrospective cohort study. Front Endocrinol (Lausanne). (2023) 14:1106283. doi: 10.3389/fendo.2023.1106283
66. Weischer M, Bojesen SE, Cawthon RM, Freiberg JJ, Tybjærg-Hansen A, Nordestgaard BG. Short telomere length, myocardial infarction, ischemic heart disease, and early death. Arterioscler Thromb Vasc Biol. (2012) 32:822–9. doi: 10.1161/atvbaha.111.237271
67. Rehkopf DH, Needham BL, Lin J, Blackburn EH, Zota AR, Wojcicki JM, et al. Leukocyte telomere length in relation to 17 biomarkers of cardiovascular disease risk: A cross-sectional study of us adults. PloS Med. (2016) 13:e1002188. doi: 10.1371/journal.pmed.1002188
68. Bountziouka V, Musicha C, Allara E, Kaptoge S, Wang Q, Angelantonio ED, et al. Modifiable traits, healthy behaviours, and leukocyte telomere length: A population-based study in UK biobank. Lancet Healthy Longev. (2022) 3:e321–e31. doi: 10.1016/s2666–7568(22)00072–1
69. Guzzardi MA, Iozzo P, Salonen M, Kajantie E, Eriksson JG. Rate of telomere shortening and metabolic and cardiovascular risk factors: A longitudinal study in the 1934–44 Helsinki birth cohort study. Ann Med. (2015) 47:499–505. doi: 10.3109/07853890.2015.1074718
70. Loh NY, Noordam R, Christodoulides C. Telomere length and metabolic syndrome traits: A mendelian randomisation study. Aging Cell. (2021) 20:e13445. doi: 10.1111/acel.13445
71. Koriath M, Müller C, Pfeiffer N, Nickels S, Beutel M, Schmidtmann I, et al. Relative telomere length and cardiovascular risk factors. Biomolecules. (2019) 9(5). doi: 10.3390/biom9050192
72. Révész D, Verhoeven JE, Picard M, Lin J, Sidney S, Epel ES, et al. Associations between cellular aging markers and metabolic syndrome: findings from the cardia study. J Clin Endocrinol Metab. (2018) 103:148–57. doi: 10.1210/jc.2017–01625
73. Konishi M, Iso H, Komachi Y, Iida M, Shimamoto T, Jacobs DR Jr., et al. Associations of serum total cholesterol, different types of stroke, and stenosis distribution of cerebral arteries. The akita pathology study. Stroke. (1993) 24:954–64. doi: 10.1161/01.str.24.7.954
74. Liu H, Li J, Liu F, Huang K, Cao J, Chen S, et al. Efficacy and safety of low levels of low-density lipoprotein cholesterol: trans-ancestry linear and non-linear mendelian randomization analyses. Eur J Prev Cardiol. (2023) 30:1207–15. doi: 10.1093/eurjpc/zwad111
75. Zhu Z, Zheng Z, Zhang F, Wu Y, Trzaskowski M, Maier R, et al. Causal associations between risk factors and common diseases inferred from gwas summary data. Nat Commun. (2018) 9:224. doi: 10.1038/s41467–017-02317–2
76. Victorelli S, Passos JF. Telomeres and cell senescence - size matters not. EBioMedicine. (2017) 21:14–20. doi: 10.1016/j.ebiom.2017.03.027
77. Aulinas A, Ramírez MJ, Barahona MJ, Valassi E, Resmini E, Mato E, et al. Dyslipidemia and chronic inflammation markers are correlated with telomere length shortening in cushing's syndrome. PloS One. (2015) 10:e0120185. doi: 10.1371/journal.pone.0120185
78. Armstrong E, Boonekamp J. Does oxidative stress shorten telomeres in vivo? A meta-analysis. Ageing Res Rev. (2023) 85:101854. doi: 10.1016/j.arr.2023.101854
79. von Zglinicki T. Oxidative stress shortens telomeres. Trends Biochem Sci. (2002) 27:339–44. doi: 10.1016/s0968–0004(02)02110–2
80. Poch E, Carbonell P, Franco S, Díez-Juan A, Blasco MA, Andrés V. Short telomeres protect from diet-induced atherosclerosis in apolipoprotein E-null mice. FASEB J. (2004) 18:418–20. doi: 10.1096/fj.03–0710fje
81. Gizard F, Heywood EB, Findeisen HM, Zhao Y, Jones KL, Cudejko C, et al. Telomerase activation in atherosclerosis and induction of telomerase reverse transcriptase expression by inflammatory stimuli in macrophages. Arterioscler Thromb Vasc Biol. (2011) 31:245–52. doi: 10.1161/atvbaha.110.219808
82. Reddel RR. The role of senescence and immortalization in carcinogenesis. Carcinogenesis. (2000) 21:477–84. doi: 10.1093/carcin/21.3.477
83. Norwitz NG, Soto-Mota A, Kaplan B, Ludwig DS, Budoff M, Kontush A, et al. The lipid energy model: reimagining lipoprotein function in the context of carbohydrate-restricted diets. Metabolites. (2022) 12(5). doi: 10.3390/metabo12050460
84. Laclaustra M, Lopez-Garcia E, Civeira F, Garcia-Esquinas E, Graciani A, Guallar-Castillon P, et al. Ldl cholesterol rises with bmi only in lean individuals: cross-sectional U.S. And Spanish representative data. Diabetes Care. (2018) 41:2195–201. doi: 10.2337/dc18–0372
85. Li H, Ma J, Zheng D, Li X, Guo X, Wang J, et al. Sex differences in the non-linear association between bmi and ldl cholesterol in middle-aged and older adults: findings from two nationally representative surveys in China. Lipids Health Dis. (2021) 20:162. doi: 10.1186/s12944-021-01591-w
86. Loh NY, Rosoff D, Noordam R, Christodoulides C. Investigating the impact of metabolic syndrome traits on telomere length: A mendelian randomization study. Obes (Silver Spring). (2023) 31:2189–98. doi: 10.1002/oby.23810
87. Rode L, Nordestgaard BG, Weischer M, Bojesen SE. Increased body mass index, elevated C-reactive protein, and short telomere length. J Clin Endocrinol Metab. (2014) 99:E1671–5. doi: 10.1210/jc.2014–1161
88. Lejawa M, Osadnik K, Osadnik T, Pawlas N. Association of metabolically healthy and unhealthy obesity phenotypes with oxidative stress parameters and telomere length in healthy young adult men. Analysis of the magnetic study. Antioxidants (Basel). (2021) 10(1). doi: 10.3390/antiox10010093
89. Gao X, Li S, Dong S, Li J, Yan Y, Zhang T, et al. Association between body weight and telomere length is predominantly mediated through C-reactive protein. J Clin Endocrinol Metab. (2021) 106:e4634–e40. doi: 10.1210/clinem/dgab455
Keywords: telomere length, blood lipids, bidirectional two-sample Mendelian randomization, aging, dyslipidemia
Citation: Yang S, Wang X, Li Y, Zhou L, Guo G and Wu M (2024) The association between telomere length and blood lipids: a bidirectional two-sample Mendelian randomization study. Front. Endocrinol. 15:1338698. doi: 10.3389/fendo.2024.1338698
Received: 15 November 2023; Accepted: 10 May 2024;
Published: 28 May 2024.
Edited by:
Jiahui Si, Peking University, ChinaReviewed by:
Mengyu Fan, Sichuan University, ChinaFuyi Xu, University of Tennessee Health Science Center (UTHSC), United States
Copyright © 2024 Yang, Wang, Li, Zhou, Guo and Wu. This is an open-access article distributed under the terms of the Creative Commons Attribution License (CC BY). The use, distribution or reproduction in other forums is permitted, provided the original author(s) and the copyright owner(s) are credited and that the original publication in this journal is cited, in accordance with accepted academic practice. No use, distribution or reproduction is permitted which does not comply with these terms.
*Correspondence: Gang Guo, guogang78@126.com; Min Wu, wumin19762000@126.com