 William Markiewicz
 Vince Wilczynski
 Julie Dorsey3†
- 1Bartlett Centre for Advanced Spatial Analysis, University College London, London, United Kingdom
- 2School of Engineering and Applied Science, Yale University, New Haven, CT, United States
- 3Department of Computer Science, Yale University, New Haven, CT, United States
- 4Bartlett School of Environment, Energy and Resources, University College London, London, United Kingdom
This study provides a theoretical and practical assessment of the potential benefits of live data streams, as used in digital twins, relating to a building’s running cost and carbon emissions. This is a significant issue, as there is a rise in the demand of digital twins and smart buildings in industry, and the energy savings that could be achieved should be assessed, as it relates to building automation and function. The study considers theoretical assessments based on existing standards and practical assessments on university buildings in London, United Kingdom and New Haven, Connecticut, United States, and is particularly focused on how data-driven controls can improve the energy efficiency of the buildings considered. Using data from the building’s building management systems and energy monitoring software, operational building data analysis was carried out on buildings in London and New Haven. Informed by the studies of both buildings, an assessment against ISO 52120-1:2021 was carried out for the existing building in New Haven, and a planned new university complex in New Haven. The comparative study between the London and New Haven building found that 29% of noteworthy cases identified for the London building were also observed in New Haven. The most significant energy saving opportunities, such as signs of overcooling and not adhering to scheduled shutdowns, were found to be present in both buildings. From a baseline state of low building automation, three states of increasing Building Automation and Control capability were defined as “must have”, “should have”, and “could have”. The mean expected energy savings for these were 5%, 7%, and 9% respectively. The implications of this study are that energy savings can be achieved in existing and planned education buildings, and that opportunities can be identified using enhanced building automation described in ISO 52120-1:2021. It also highlights the challenges with using ISO 52120 to fully quantify the energy savings due to enhanced automation and live data streams, especially for buildings with laboratory areas, which are not covered by ISO 52120, and which typically make up a much higher proportion of a building’s energy footprint than office areas.
1 Introduction
Digital twins in the built environment are seen to be at an early stage in their development (Schweigkofler et al., 2022; Deng, Menassa, and Kamat, 2021), and their use is increasing rapidly (Boje et al., 2020). This will be associated with a rapid increase in live data streams and the associated processing and storage of data (Wright and Davidson, 2020). This could lead to benefits for the environment, building occupants, and building managers (Ketzler et al., 2020; Shahzad et al., 2022; Halmetoja, 2022), with the potential for improved energy efficiency identified as a key benefit (Hernández-Moral et al., 2021). However, there are indications that 90% of sensor data from the internet of things and 80% of all digital data is never used (McGovern, 2020; Rogers and Kirwan, 2019; Active Archive, 2018). This is a large cost, when considering that total global carbon emissions from data transmission and storage are estimated at 97 million tonnes of CO2e per year (Obringer et al., 2021). At the time of writing, this is greater than the total estimated carbon footprint of Chile. In light of this, guiding principles for developing digital twins in the built environment such as the Gemini principles (Bolton, Enzer, and Schooling, 2019) exist. These provide a framework for developing digital twins that provide a clear purport and public good.
The assessment of energy-saving potential for live data streams should also be considered in the wider context of active and passive energy-saving measures. This includes effective use of atriums to minimise thermal energy consumption (Vujošević and Krstić-Furundžić, 2017; Aldawoud, 2013; Wang et al., 2017), with Vujošević and Krstić-Furundžić finding that buildings with a glass atrium could reduce heating demands by 30% in other areas of the building (Vujošević and Krstić-Furundžić, 2017). Ventilation design to enable gravity assisted ventilation can also be used to maximise passive cooling and ventilation (Nakielska and Pawłowski, 2017; Gil-Baez et al., 2017). Other effective passive energy saving measures include the use of night cooling (Solgi et al., 2018), thermal inertia (D’Orazio et al., 2014; Rugani et al., 2021), and ground energy (Gondal, 2021; Panão and Gonçalves, 2011). Existing active energy saving measures include thermal storage systems (Kim, Shim, and Won, 2018), heat recovery (Vakiloroaya et al., 2014) and predictive control (Xue et al., 2023).
Existing studies have assessed the utility of live data streams in buildings, for example, Maltese et al. (2021) have shown how live data in office buildings can be used to reduce running costs and improve occupant productivity and space utilisation. Schweigkofler et al. have also shown how live data streams are used in digital twin to engage occupants with facilities and energy management for a school building (Schweigkofler et al., 2022). Existing literature has shown ISO 52120 as a method for assessing gains from enhanced building automation, including modelling of the Building Automation and Control Systems classes in the standard (Albesiano, 2023), assessing benefits from improved automation in heating (Morkunaite et al., 2022) and designing an automated control system for improved thermal performance (Montalbán Pozas et al., 2023). The present study builds on the existing literature to assess the benefits of live data streams through ISO 52120 assessments for existing buildings and a planned new development, informed by operational data.
Considering the potential benefits of live data streams mentioned, and the costs of harvesting, storing, and analysing this data, an assessment of quantitative potential digital twin benefits is needed (Demian, Yeomans, and Murgula-Sanchez, 2018). The work presented provides a case study to contribute towards addressing this need by calculating the potential benefits of live data streams in digital twins and feeds back learning from operational data from existing buildings into the design stage for new building projects. First, operational data from two university buildings, one of which is situated in London, UK and another in New Haven, Connecticut, USA is assessed. The London building is University College London (UCL) East One Pool Street (UCL 2018a), and the New Haven building is Yale University’s Becton Engineering and Applied Science Center (BCT) (Yale University, 2021). One Pool Street and the BCT are shown in Figures 1, 2 respectively.
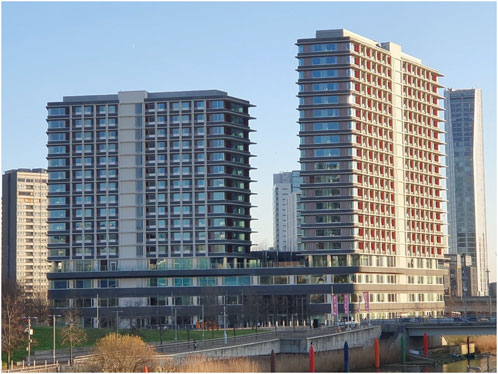
Figure 1. UCL East One Pool Street.

Figure 2. Becton Engineering Center.
Based on an analysis of the operational data and building control manuals, the BCT and a planned new development for the Yale School of Engineering and Applied Science (SEAS) on Hillhouse Avenue (Yale University, 2023) were assessed against the ISO 52120-1:2021 standard (ISO, 2021), to provide an indication of energy savings that could be achieved using greater levels of Building Automation and Control (BAC). Using the ISO 52120 standard covers the use of active energy saving measures, including demand driven heating and cooling, and passive techniques including use of free cooling. This assessment gave rise to a series of possible development pathways for the new SEAS development on Hillhouse Avenue. These are provided in this paper as “must have”, “should have”, and “could have” pathways, with the potential utility of each pathway considered.
2 Methods
This study assessing the utility of live data streams is based on a data harvesting and analysis project at One Pool Street. This section describes the methods used in this study, and the following studies at Yale University. These include the operational data assessment at BCT, ISO 52120 assessment at BCT, and the ISO 52120 assessments for the planned development on Hillhouse Avenue. The method used intentionally covers operational data for existing buildings and a theoretical assessment of a planned new development. This is to provide a real-world picture of building automation and controls as well as assessing which technologies work best in practice to feedback to new buildings at the design stage.
2.1 UCL East One Pool Street harvesting and analysis of live data streams
One Pool Street operational data is made available through campus wide instances of Schneider Ecostruxure Building Operation (Schneider, 2022) and Schneider EcoStruxure Power Monitoring Expert (Schneider Electric 2024b). A data harvesting solution was implemented using MQTT (MQTT, 2022), with data storage carried out in InfluxDB (InfluxData, 2022), and data visualisation achieved in Grafana (Grafana Labs, 2024). Harvested operational data included room temperature, CO2 concentration, thermal energy consumption, electricity consumption, Heating, Ventilation, and Air Conditioning (HVAC) operating parameters, and occupancy (from passive infrared sensors). The list of parameters harvested for this study is provided in Tables 3, 4.
Grafana data visualisations are analysed manually to identify cases that could save energy or improve operations. For example, spaces were being actively cooled to 21°C in summer months, even though it is university policy for spaces not to be cooled below 25°C. This case will be discussed in more detail in Section 3.1. Potential cases that affect occupant comfort were also identified. These include chiller outages that caused room temperatures above 29°C in occupied rooms, and up to 34°C in a room that houses a computer cluster. The cases observed were used to support engagement with building stakeholders, and formed the basis for the assessments made for existing and planned university buildings at Yale University described in Sections 2.3, 2.4. The opportunities identified that offered the largest potential energy savings were:
• Increasing the cooling setpoint from 21°C to 25°C to bring this in line with the UCL heating and cooling policy (UCL 2018b).
• Turning off ventilation over shutdown periods and weekends.
• Reducing the return temperature from the building’s hot water circuit to the district heating system in line with the design values to maintain the intended temperature difference across the hot water circuit.
This study aims to compare these cases with improvements suggested in ISO 52120 (ISO, 2021) (see Sections 2.3, 2.4), to identify alignment for the buildings considered.
The key building parameters as it pertains to energy consumption for UCL East One Pool Street are provided in Table 1.
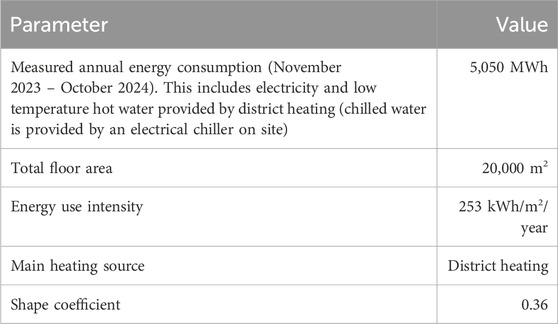
Table 1. Energy performance parameters for UCL East One Pool Street.
2.2 Becton Engineering Center operational data analysis
The study of live data at the BCT seeks to understand whether the same cases arise in this university building in New Haven, USA, as were present in the UCL East One Pool Street case study. Trend data from Johnson Controls Metasys (Johnson Controls, 2024), Fault Detection and Diagnostics data from Clockworks analytics (Clockworks Analytics, 2024), and energy data from the Facilities Energy Usage Explorer (Yale University, 2024) were used to assess each of the 40 cases identified in the One Pool Street case study, and an assessment was made as to whether they existed at the BCT. Data for comparison was not available for all cases. For example, Yale University does not have the same building shutdown at Easter that exists at UCL. The understanding of the building systems and the trends in the harvested operational data fed directly into the ISO 52120 assessments described in Sections 2.3, 2.4.
The key building parameters as it pertains to energy consumption for the Becton Engineering Center are provided in Table 2.
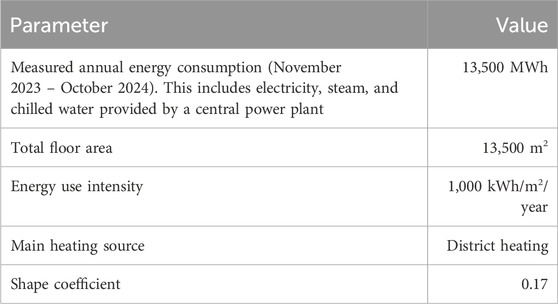
Table 2. Energy performance parameters for the Becton Engineering Center.
A description of the of data harvested at One Pool Street and the BCT is provided in Tables 3, 4 respectively.
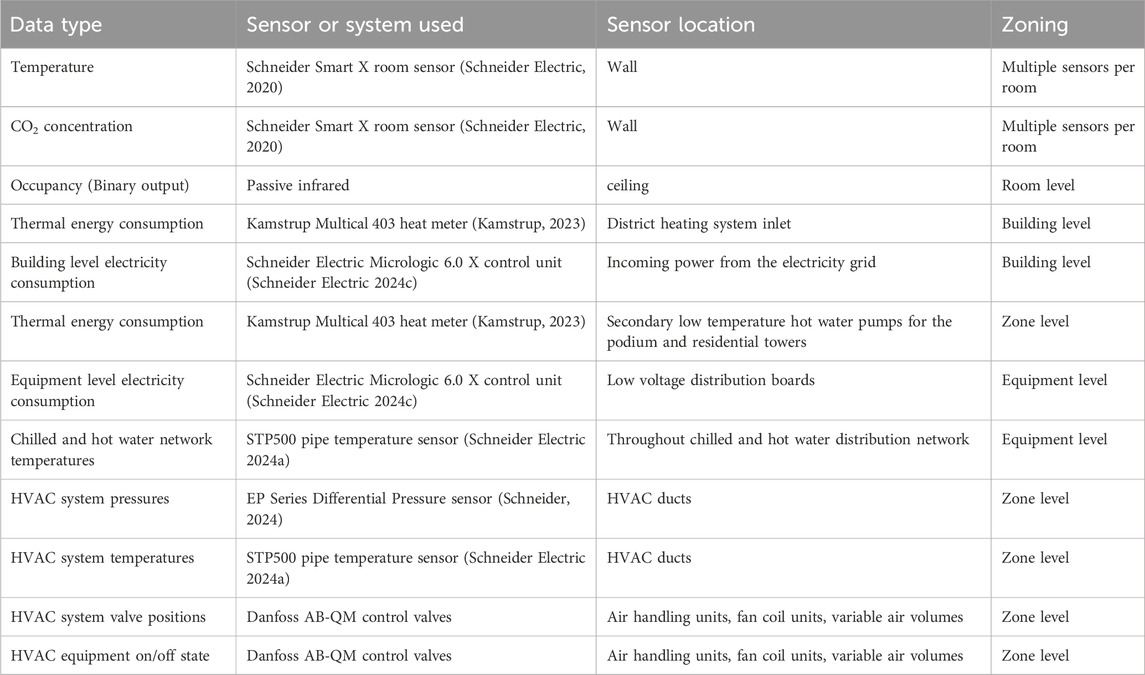
Table 3. Detailed description of sensor data for UCL East One Pool Street.
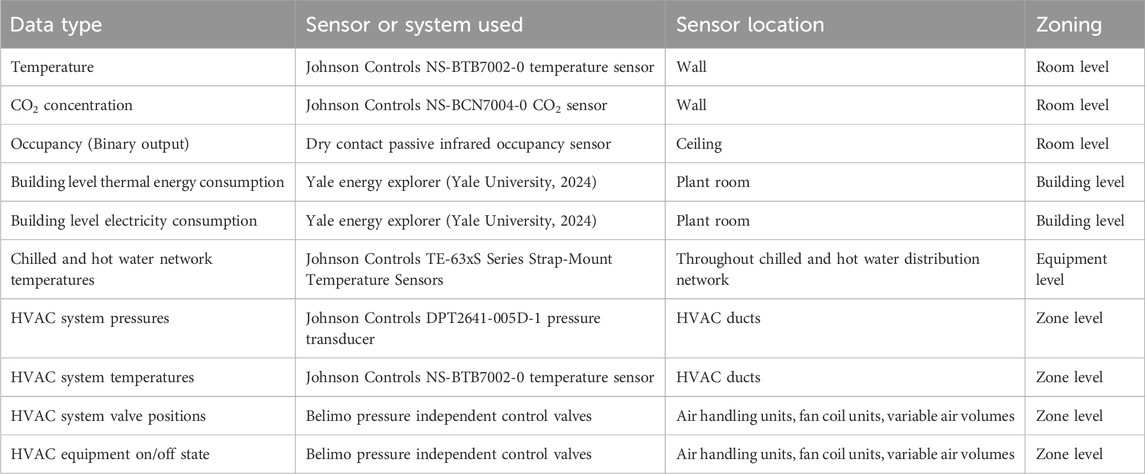
Table 4. Detailed description of sensor data for the BCT.
2.3 Becton Engineering Center data-driven control assessment
In addition to the studies on operational data, an assessment against the ISO 52120-1:2021 standard (ISO, 2021), that covers the contribution of building automation to the energy performance of buildings, was carried out for the BCT. The standard describes detailed requirements for using sensor data to drive automated building control and provides quantitative metrics that these data-driven controls have on the energy performance of buildings. The Siemens EPC-Tool web interface was used to carry out the assessment against ISO 52120 (Siemens, 2022). The building control manuals for the BCT were used to complete the assessment, as well as the results from the BCT operational data analysis described in section 2.3. The building classification is carried out for an office building, since the spaces in the BCT that are not laboratory spaces are office spaces, and there is no distinction in ISO 52120 for laboratory spaces. The overall BAC classification was used, since this allowed for the most granular level of input, covering 45 functions across heating, hot water, cooling, ventilation/air conditioning, lighting, blinds, and technical building management. The requirements to meet each classification are minimum requirements, meaning that if one control element is rated as “D”, then the BAC class of that building is D.
2.4 Hillhouse Avenue data-driven control assessment
Based on the BCT ISO 52120 assessment, and available proposal documents from the architects and engineers for the new development at Hillhouse Avenue, an ISO 52120 assessment was made for the new development. The classification process is as described for the BCT in section 2.3. For the Hillhouse Avenue assessment, the requirements to move to a BAC class C, B, and A from a “do nothing” state were identified. The requirements to meet class C are defined as “must have”, to meet class B are defined as “should have”, and to meet class A are defined as “could have” requirements. Energy modelling results from design proposals were used to estimate energy savings for each state, considering that the savings defined in ISO 52120 would only be for the office portion of the new development. The assumptions made in assessing the expected energy consumption for each state were:
• A gross floor area of 30,000 m2.
• 40% of the planned new development is laboratory space, and the rest is office space.
• An Energy Use Intensity (EUI) of 315.5–378.6 kWh/m2/yr as calculated using energy modelling.
• An increased energy consumption factor of laboratory spaces of 5-10 times compared to an office space (EPA, 2008).
• The EUI and increased energy consumption factor of laboratory spaces are normally distributed.
• The EUI calculated in energy modelling assumes a standard class BAC and therefore corresponds to BAC class C.
• Since the planned new development is fully electrified, BAC factors for thermal energy correspond to the electricity used for Domestic Hot Water (DHW), cooling, heating, and humidification, whereas BAC factors for electrical energy are applied to HVAC systems such as pumps and fans, and equipment that uses electricity. As shown in Figure 3, this means that thermal BAC factors were applied to 54% of energy consumption, and electrical BAC factors were applied to 46% of energy consumption.
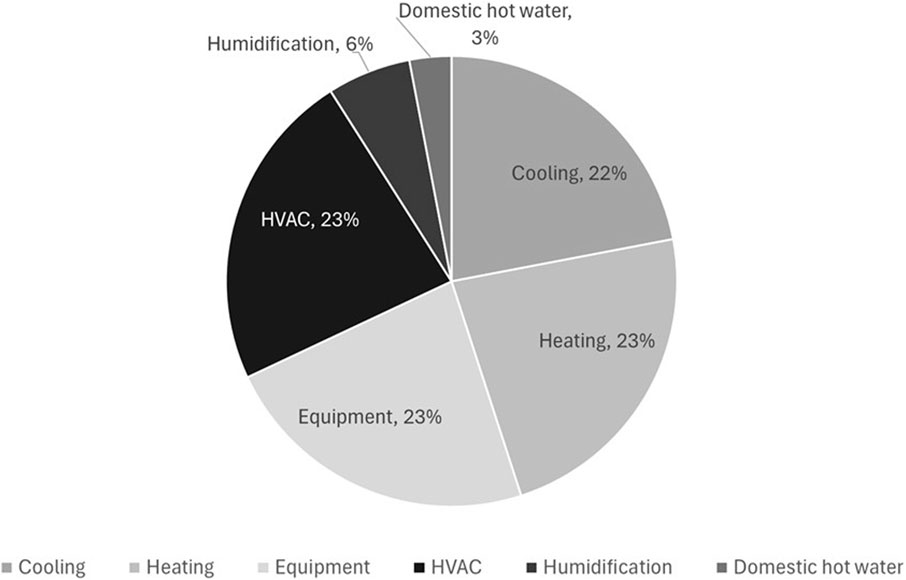
Figure 3. Proportion of energy consumption by end use for the new development at lower Hillhouse Avenue.
These assumptions show that the new building is similar in function to existing buildings, especially considering the distribution of lab and office space is similar to the Becton Engineering Center. It is the largest of the buildings considered, with the BCT having a gross floor area of approximately 13,500 m2 and One Pool Street 20,000 m2. Using the assumptions listed in this section, the total expected building energy consumption for the planned new development were calculated for the inputs that would result in the minimum, mean, and maximum expected energy savings from improved use data-driven control. The analysis of operational building data (see section 2.1 and 2.2) was used to classify the BAC level for the planned new development.
2.4.1 Energy savings calculation
ISO 52120 overall BACS factors were used in the present study. The formula for calculating total energy consumption for thermal and electrical energy is shown in Equations 1, 2 (ISO, 2021).
Equation 1 – Formula used to calculate thermal energy consumption with improved building automation control (ISO, 2021)
Where:
Equation 2 - formula used to calculate electrical energy consumption with improved building automation control (ISO, 2021)
The BAC efficiency factors for thermal energy are 1.51 for class D, one for class C, 0.80 for class B, and 0.70 for class A.
The BAC efficiency factors for electrical energy are 1.10 for class D, one for class C, 0.93 for class B, and 0.87 for class A.
3 Results
Results for the operational data assessment are shown in Section 3.1, and results for the ISO 52120 assessments, and the associated energy implications are shown in Sections 3.2–3.4.
3.1 Becton Engineering Center operational data analysis and comparison to One Pool Street
The results from the comparison of operational data between One Pool Street and the BCT are shown in Figure 4.
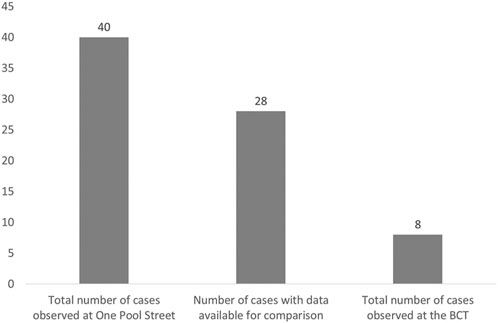
Figure 4. Comparison of potential improvement items found at the BCT that were also identified at One Pool Street.
As mentioned in section, the reason that data for comparison was not available for all cases observed at One Pool Street was because of a difference in data harvesting architecture available at the BCT, for example, the lack of electrical submetering for equipment. In both buildings, it was observed that equipment was left running over the Christmas shutdown period. There were however differences in how this came about. At One Pool Street, there was no process for shutting down equipment over Christmas, so it was not turned off. At Yale University, all buildings are shut down over Christmas by default, and staff members can notify facilities if their specific area will be occupied or in use, in which case equipment is left running for that area.
At both sites, there was a large increase in cooling energy used over summer months, with zone temperatures below the defined setpoints for both university buildings.
The setpoint defined by UCL’s cooling policy (UCL 2018b) is 25°C, and the mean recommended cooling setpoint defined by Yale University is 75°F (23.9°C). The zone temperatures observed in both buildings, along with the recommended setpoints can be seen in Figures 5, 6, which show the outdoor and indoor air temperature for One Pool Street, and the BCT respectively.
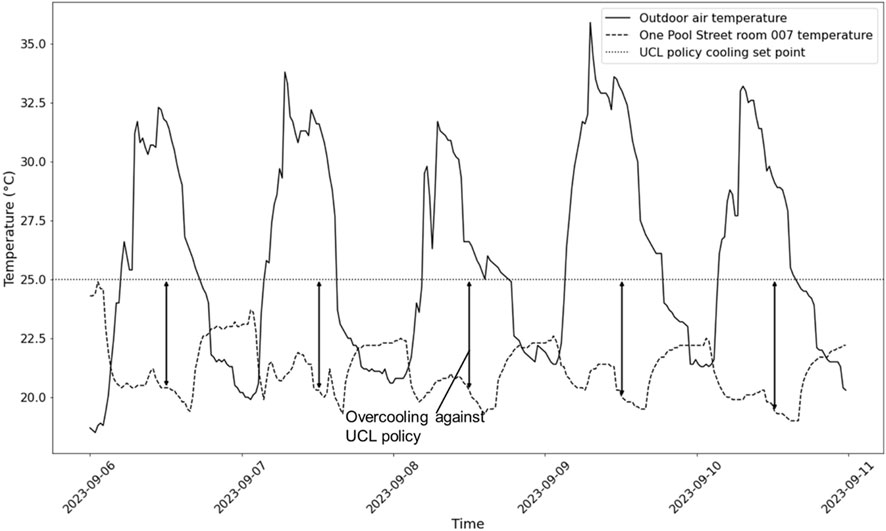
Figure 5. One Pool Street indoor vs. outdoor air temperature.
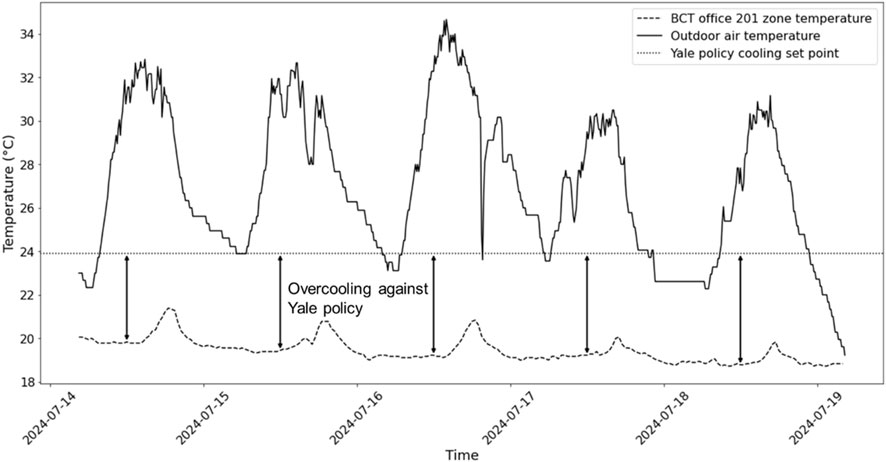
Figure 6. BCT indoor vs outdoor air temperature.
In the One Pool Street case (see Figure 5), the low cooling setpoint of 21°C resulted in complaints from occupants who were used to warm weather, whereas discussions with staff at Yale indicated that occupants desired colder zone temperatures.
3.2 Becton Engineering Center ISO 52120-1:2022 assessment
The results of the ISO 52120 assessment, based on the learning from the operational data assessment at the BCT, surveying the building’s facilities, and the contents of the manual. The results are shown in Figure 7.

Figure 7. Number of functions that meet each BAC classification for the BCT.
As shown in Figure 7, only 18% of the functions were assessed as BAC class D. Since the requirements in ISO52120 are minimum requirements, this means that the overall rating for the BCT is currently a D, but the BAC class could be improved by upgrading a small portion of BAC functions. Figure 8 shows a breakdown of classifications by the ISO 52120 they fall under.
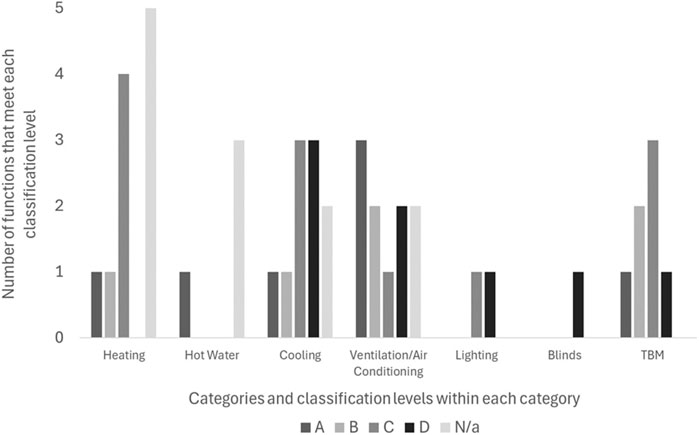
Figure 8. Number of functions that meet each classification level (A–D) for each ISO 52120 category.
Figure 8 shows that the highest number of D rated functions are in cooling and ventilation/air conditioning. Within cooling, two of the D rated functions were because the temperature control of the cold-water distribution network and chillers was based on a constant temperature control. Upgrading these to a control that compensates for outside temperature would upgrade these classifications.
3.3 Hillhouse Avenue ISO 52120-1:2022 assessment
The learnings from the assessment of building automation and controls were carried through to an assessment of the design proposals for Hillhouse Avenue. This provided sufficient confidence that the level of building automation control would be at least as good as it is in the BCT. Therefore, as a worst-case scenario, BAC classes were assumed to be the same as at the BCT. Additionally, the proposals explained that occupancy control would be used for all systems, which meant that BAC ratings for functions 1.1, 3.1, and 5.1 improved to an A rating, and 4.1 improved to a B rating. Heat pumps, and heat recovery will be used in the new development, where these were not used in the BCT. The BAC classes for these technologies were assigned in line with the classes observed at the BCT. This means that functions 1.7 (Heat generator control (heat pump)) (class C), 2.1 (Control of Domestic hot water storage temperature with integrated electric heating or electric heat pump) (class C), 2.2 (Control of Domestic hot water storage temperature using heating water generation, 4.6 (Heat recovery control (icing protection)) (class D), and 4.7 (Heat recovery control (prevention of overheating)) (class D) were included in the Hillhouse ISO 52120 assessment.
From the baseline state, improved states of building automation and control were defined for the new development. These were defined as “must have”, “should have”, and “could have” states, and correspond to BAC classifications C, B, and A respectively. Table 5 provides a summary of the improved states.
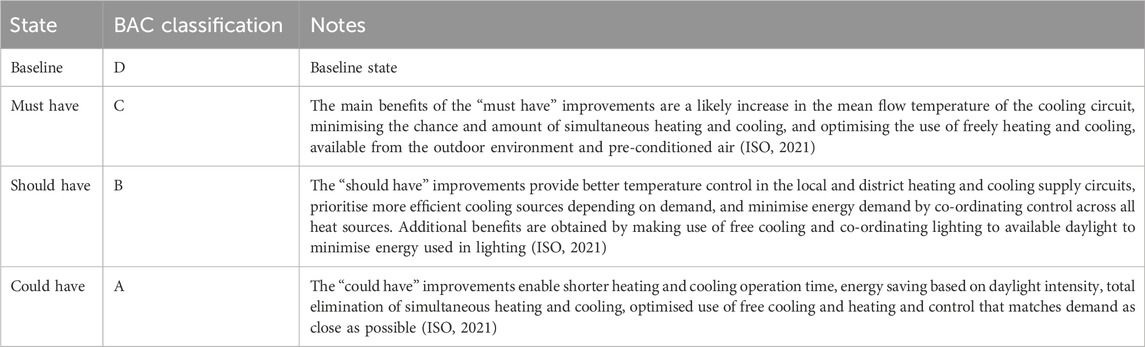
Table 5. Summary of improvements for “must have”, “should have”, and “could have” states.
3.4 Energy implications of suggested BAC improvements
ISO 52120 (ISO, 2021) provides efficiency factors. As described in section 2.4, these were used to estimate the energy consumption reductions that are expected if the recommendations described in section 3.3 are implemented. Figures 9, 10 show the expected total energy consumption and the expected energy savings for each state respectively.
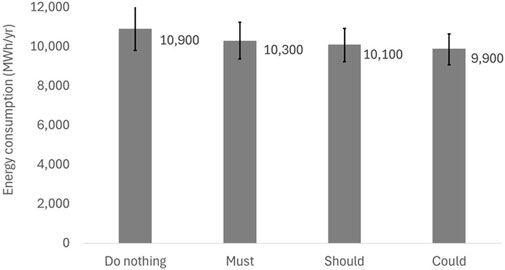
Figure 9. Expected total energy consumption for the Hillhouse Avenue development in the “do nothing”, “must have”, “should have”, and “could have” states.
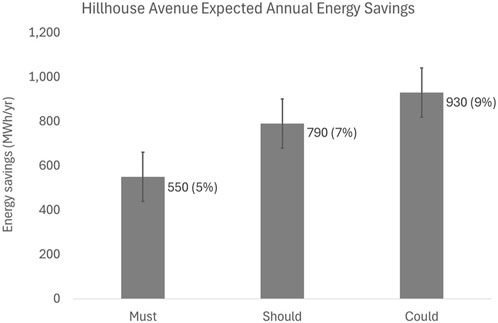
Figure 10. Expected energy savings for the Hillhouse Avenue development in the “must have”, “should have”, and “could have” states.
The results shown in Figures 9, 10 should be viewed with consideration for the assumptions listed in section 2.4, which provide the baseline for the savings and uncertainties shown.
4 Discussion
The comparative study of operational data between the London and New Haven university buildings focussed on 28 cases that were chosen from live data streams. Of these 28 cases, nine were also observed in the New Haven building. This shows that ∼70% of cases were not transferrable between the two buildings. However, the two cases that were deemed to have the highest potential energy savings in the London building were also observed in New Haven. The significant differences in cases across the two buildings highlights the need for skilled facilities managers who understand the building they are managing and can take actions tailored to it. However, sharing key similarities also shows the benefits of data-driven methods as tools to aid managers in operating, maintaining, and improving buildings that are optimised for energy efficiency and occupant comfort.
As mentioned in Section 2.1, the greatest energy saving opportunities identified from operational data at UCL East One Pool Street were to increase the cooling setpoint, turn off ventilation when it is not needed, and reduce the hot water exit temperature. Considering the ventilation, the improvements suggested in ISO 52120 would help to address this opportunity, since the higher BAC classifications improve a building’s ability to tailor equipment operation to occupancy. Similarly, ISO 52120 functions 1.3 and 3.4 control the flow temperature of the hot water and cold water distribution networks respectively. This means that the hot water exit temperature from the system could be optimised using higher levels of building automation and control. The cooling setpoint adjustment, however, requires an understanding of local policies, which would not be addressed by improving BAC functionality alone. In One Pool Street, the overcooling was caused by having a setpoint of 21°C for the entire year, with no modification for winter and summer months. With regards to this, understanding the impacts of adjusting the setpoint on occupant comfort is also important. As seen in the present case, for example, the low setpoint at UCL caused occupants to complain that they are cold in addition to using more energy, whereas occupants at Yale University indicated that they enjoyed the lower cooling setpoint. Overcooling is a wider issue observed in the literature, a study into overcooling in commercial buildings in the US, for example, found that overcooling alone represents an 8% energy loss on average across the country (Derrible and Reeder, 2015).
The results from the ISO 52120 assessments have shown that some energy savings can be made from enhanced building automation, with 5% energy savings across the entire new development project achievable for the most basic improvements, and 9% for the most complete building automation enhancements. This shows that where it is cost effective to make improvements to building automation, these should be implemented. This in turn shows the necessity of future work to assess the costs of the enhanced automation proposed in ISO 52120.
Comparing the results from this study to existing studies that assess the impact of improved automation, the achieved results are conservative, with results showing savings of up to 31.6% (Yin and Mohamed, 2023) of energy used for electric heating, and savings from smart control of lighting between 40%-70% (Mahdavi et al., 2008; Roisin et al., 2008; Yun et al., 2012). This conservativeness shows gives confidence in the savings presented in this study being lower than what would be achieved for the proposed new Hillhouse Avenue development. It is likely that the cause of this conservativeness is the exception of laboratory areas (see Section 5).
Whilst ISO 52120 (ISO, 2021) provides an excellent tool for assessing the technological capability of a BAC system, and defining the technologies that should be installed in a building, it lacks detail in how this technology should be implemented. The ASHRAE 36 guideline, High-Performance Sequences of Operation for HVAC Systems (ASHRAE, 2021) provides an excellent resource for this, and should be used in conjunction with the recommendations found in this study to maximise savings in energy consumption.
5 Limitations
As can be seen in Section 3.1, there was not scope in this paper to provide a detailed description of every improvement opportunity identified at One Pool Street and the BCT. The results summary was included however, as the assessment helped to provide a solid understanding of BCT controls to carry out ISO 52120 assessments, and to be able to understand similarities and differences in the utility of live data streams across different geographies and cultures. Future work should provide a detailed assessment of each case found, and provide a benefit assessment based on operational data, to allow for comparison against the energy savings calculated using an ISO 52120 assessment provided in this paper. It should be noted that the building management system sensors used to obtain operational data typically have lower accuracies than newly calibrated stand-alone temperature sensors (Bae et al., 2021).
An important limitation is the uncertainty associated with energy savings from ISO 52120 assessments for the Hillhouse Avenue project. The greatest source of this is the lack of detailed understanding of the energy consumption of the lab spaces at the BCT and Hillhouse Avenue. Since ISO 52120 does not provide guidance on laboratory applications, it was assumed that no energy savings from improved controls could be made for laboratory spaces, and it was estimated that these made up the greatest proportion of the building’s energy consumption (between 77% and 87%). Therefore, future work should seek to address laboratory use to understand the savings that could be obtained using the control strategies described in this report, and to develop a control strategy tailored to minimising energy consumption in laboratories.
It should be noted that the baseline assessment for the planned development at Hillhouse Avenue (Section 3.3) is a worst-case assessment. This was done intentionally, to ensure that no potential improvement opportunities could be missed. However, it is likely that a lot of the functionality listed in the “Must”, “Should”, and “Could” states would be incorporated into the building, but have not been included in plans at such an early stage. Future work should be done to understand which features would be included in the building without any intervention, and what the value of the remaining improvements would be.
6 Conclusion
This study has provided some progress towards addressing the need for tools and real case study examples to assess the benefits of digital twins in the built environment, by quantifying the potential benefits of live data streams in existing and future buildings. The results showed that the mean reduced energy consumption for a planned new university building in New Haven, Connecticut were 5%, 7%, and 9% for three increasing levels of improved building automation control. A comparative study between university buildings in London and New Haven found that 71% of noteworthy cases identified for the London building were not observed in New Haven, but signs of overcooling and not adhering to scheduled shutdowns were observed in both buildings.
Additional work is needed to assess the costs of implementing the data acquisition and data-driven control strategies described in this study and to assess additional benefits of live data streams, including dynamically updating building models. Future work should also consider the impact of data-driven buildings on laboratory buildings, especially as potential energy savings could be greater than for offices.
Data availability statement
The datasets presented in this article are not readily available because the raw data for this study is privately held and owned by Yale University and University College London. Requests for data sharing can be directed to the corresponding author and may be granted subject to approval by the data holders. Requests to access the datasets should be directed to V2lsbGlhbS5NYXJraWV3aWN6LjIxQHVjbC5hYy51aw==.
Author contributions
WM: Writing–original draft, Writing–review and editing. VW: Writing–review and editing. JD: Writing–review and editing. DW: Writing–review and editing. CE: Writing–review and editing.
Funding
The author(s) declare that financial support was received for the research, authorship, and/or publication of this article. This research has been funded by the Engineering and Physical Sciences Research Council under Grant EP/S021671/1 and Ove Arup and Partners Limited.
Acknowledgments
This study would not have been possible without Julie Paquette, Mike Ghilani, and Ed Lipsett from the Yale Office of Facilities. They provided access to the data needed to carry out this research, and their experience with the building controls at the Becton Engineering Centre was invaluable in supporting the ISO 52120 assessments and analysing operational data from the building. The authors are also very grateful to David Kelley, Senior Director of Capital Program Development and Delivery at Yale, especially for his help in defining requirements for collecting operational data and for his help in analysing the result from this. The authors are also very grateful to Darren Wright, director of Arup’s built environment team, especially for his guidance in collecting and interpreting operational data from UCL East One Pool Street.
Conflict of interest
The authors declare that the research was conducted in the absence of any commercial or financial relationships that could be construed as a potential conflict of interest.
Generative AI statement
The author(s) declare that no Generative AI was used in the creation of this manuscript.
Publisher’s note
All claims expressed in this article are solely those of the authors and do not necessarily represent those of their affiliated organizations, or those of the publisher, the editors and the reviewers. Any product that may be evaluated in this article, or claim that may be made by its manufacturer, is not guaranteed or endorsed by the publisher.
References
Active Archive (2018). Active archive and the state of the industry 2018. Available at: https://activearchive.com/wp-content/uploads/2018/04/Active-Archive-and-the-State-of-the-Industry-2018_Final.pdf.
Albesiano, M. (2023). BACS: energy performance and technical-economic analysis of HVAC technologies. Politecnico di Torino: Laurea. Available at: https://webthesis.biblio.polito.it/26443/.
Aldawoud, A. (2013). The influence of the atrium geometry on the building energy performance. Energy Build. 57 (February), 1–5. doi:10.1016/j.enbuild.2012.10.038
ASHRAE (2021). Guideline 36-2021 -- high-performance Sequences of operation for HVAC systems. Available at: https://store.accuristech.com/ashrae/standards/guideline-36-2021-high-performance-sequences-of-operation-for-hvac-systems?product_id=2229690.
Bae, Y., Bhattacharya, S., Cui, B., Lee, S., Li, Y., Zhang, L., et al. (2021). Sensor impacts on building and HVAC controls: a critical review for building energy performance. Adv. Appl. Energy 4 (November), 100068. doi:10.1016/j.adapen.2021.100068
Boje, C., Guerriero, A., Kubicki, S., and Rezgui, Y. (2020). Towards a semantic construction digital twin: directions for future research. Automation Constr. 114 (June), 103179. doi:10.1016/j.autcon.2020.103179
Bolton, A., Enzer, M., and Schooling, J. (2019). The Gemini principles: guiding values for the national digital twin and information management framework. Cambridge, United Kingdom: Centre for Digital Built Britain. Available at: https://www.cdbb.cam.ac.uk/DFTG/GeminiPrinciples.
Clockworks Analytics (2024). Clockworks analytics. Clockworks Anal. Available at: https://clockworksanalytics.com/.
Demian, P., Yeomans, S., and Murgula-Sanchez, D. (2018). Network FOuNTAIN A cdbb network: for onTologies and Information maNagement in digital built britain: final report. Text. Available at: https://www.cdbb.cam.ac.uk/CDBBResearchBridgehead/Networks/2018Network_FOuNTAIN.
Deng, M., Menassa, C. C., and Kamat, V. R. (2021). From bim to digital twins: a systematic review of the evolution of intelligent building representations in the AEC-FM industry. J. Inf. Technol. Constr. (ITcon) 26 (5), 58–83. doi:10.36680/j.itcon.2021.005
Derrible, S., and Reeder, M. (2015). The cost of over-cooling commercial buildings in the United States. Energy Build. 108 (December), 304–306. doi:10.1016/j.enbuild.2015.09.022
D’Orazio, M., Di Perna, C., and Di Giuseppe, E. (2014). A field study of thermal inertia of roofs and its influence on indoor comfort. J. Build. Phys. 38 (1), 50–65. SAGE Publications Ltd STM. doi:10.1177/1744259113480134
EPA (2008). Laboratories for the 21st century: an introduction to low-energy design. Available at: https://www.nrel.gov/docs/fy08osti/29413.pdf.
Gil-Baez, M., Barrios-Padura, Á., Molina-Huelva, M., and Chacartegui, R. (2017). Natural ventilation systems in 21st-century for near zero energy school buildings. Energy 137 (October), 1186–1200. doi:10.1016/j.energy.2017.05.188
Gondal, I. A. (2021). Prospects of shallow geothermal systems in HVAC for NZEB. Energy Built Environ. 2 (4), 425–435. doi:10.1016/j.enbenv.2020.09.007
Grafana Labs (2024). Grafana: the open observability platform. Grafana Labs. Available at: https://grafana.com/.
Halmetoja, E. (2022). “The role of digital twins and their application for the built environment,” in Industry 4.0 for the built environment: methodologies, technologies and skills. Editors M. Bolpagni, R. Gavina, and D. Ribeiro (Cham: Springer International Publishing), 415–442. doi:10.1007/978-3-030-82430-3_18
Hernández-Moral, G., Mulero-Palencia, S., Serna-González, V. I., Rodríguez-Alonso, C., Sanz-Jimeno, R., Marinakis, V., et al. (2021). 14. Big data value chain: multiple perspectives for the built environment. Multidiscip. Digit. Publ. Inst., 4624. doi:10.3390/en14154624
InfluxData (2022). InfluxDB | real-time insights at any scale. InfluxData. Available at: https://www.influxdata.com/home/.
ISO (2021). ISO 52120-1:2021’. ISO 52120-1:2021 energy Performance of buildings — Contribution of building automation. Geneva, Switzerland: International Standards Organisation. Available at: https://www.iso.org/standard/65883.html.
Johnson Controls (2024). Metasys software and servers. Available at: https://www.johnsoncontrols.com/building-automation-and-controls/building-automation-systems-bas/metasys-software-and-servers.
Kamstrup (2023). MULTICAL® 403 | the most flexible ultrasonic heat meter available. Available at: https://www.kamstrup.com/en-en/heat-solutions/meters-devices/meters/multical-403.
Ketzler, B., Naserentin, V., Latino, F., Zangelidis, C., Thuvander, L., and Logg, A. (2020). Digital twins for cities: a state of the art review. Built Environ. 46 (4), 547–573. doi:10.2148/benv.46.4.547
Kim, N.-K., Shim, M.-H., and Won, D. (2018). Building energy management strategy using an HVAC system and energy storage system. Multidiscip. Digit. Publ. Inst. 11, 2690. doi:10.3390/en11102690
Mahdavi, A., Mohammadi, A., Kabir, E., and Lambeva, L. (2008). 1. Occupants operation of lighting and shading systems in office buildingsJ. Build. Perform. Simul., 57–65. doi:10.1080/19401490801906502
Maltese, S., Altieri, D., Branca, G., and Marvin, D. (2021). BIM+IoT for office spaces optimisation. Lugano, 1–4. Available at: https://repository.supsi.ch/13071.
McGovern, G. (2020). World wide waste. Silver Beach. Available at: https://gerrymcgovern.com/world-wide-waste/.
Montalbán Pozas, B., Bustos García de Castro, P., Lucas Bonilla, M., and Serrano Candela, F. (2023). A methodology for designing an automated system to improve the thermal performance of a large building in operation. Buildings 13 (8). 1938. doi:10.3390/buildings13081938
Morkunaite, L., Pupeikis, D., Jurelionis, A., Fokaides, P. A., and Papadopoulos, A. (2022). An analytical model for the impact of building control and automation upgrade on space heating energy efficiency. Multidiscip. Digit. Publ. Inst., 12, 1074. doi:10.3390/buildings12081074
MQTT (2022). MQTT - the standard for IoT messaging. Available at: https://mqtt.org/.
Nakielska, M., and Pawłowski, K. (2017). “Enhancement of gravity ventilation in buildings,” in Proccedings of 10th international conference ‘environmental engineering’. Vilnius gediminas technical university, Lithuania: VGTU technika. doi:10.3846/enviro.2017.269
Obringer, R., Rachunok, B., Maia-Silva, D., Arbabzadeh, M., Nateghi, R., and Madani, K. (2021). The overlooked environmental footprint of increasing internet use. Resour. Conservation Recycl. 167 (April), 105389. doi:10.1016/j.resconrec.2020.105389
Panão, M. J. O., and Gonçalves, H. (2011). Methodological development of sesonal cooling energy needs by introducing ground-cooling systems. Available at: https://www.semanticscholar.org/paper/Methodological-development-of-sesonal-cooling-needs-Pan%C3%A3o-Gon%C3%A7alves/6fb3e202e11f30c48e4eea16d32cd880760d0f8c.
Rogers, J., and Kirwan, B. (2019). The post-occupancy digital twin: a quantitative report on data standardisation and dynamic building performance evaluation. Capst. Rep. May. doi:10.21427/a37g-ha11
Roisin, B., Bodart, M., Deneyer, A., and D’Herdt, P. (2008). Lighting energy savings in offices using different control systems and their real consumption. Energy Build. 40 (4), 514–523. doi:10.1016/j.enbuild.2007.04.006
Rugani, R., Bigazzi, M., Fantozzi, F., Marengo, M., Picco, M., and Salvadori, G. (2021). Impact of building thermal inertia in different climates using energy dynamic simulation through a simplified description model. Build. Simul. Conf. Proc. 17. 2578–2585. doi:10.26868/25222708.2021.30515
Schneider (2022). EcoStruxureTM building operation. Available at: https://www.se.com/uk/en/product-range/62111-ecostruxure-building-operation/.
Schneider, E. (2024). EcoStruxure power monitoring Expert | schneider electric USA. Available at: https://www.se.com/us/en/product-range/65404-ecostruxure-power-monitoring-expert/.
Schneider Electric (2020). SmartX sensors. Available at: https://ecostruxure-building-help.se.com/bms/topics/show.castle?id=11538&locale=en-US&productversion=2.0.
Schneider Electric (2024a). EPP302 - EP series differential pressure/air velocity transducer, panel mounting, 0-10 in. WC/0-2500 Pa | schneider electric UK. Available at: https://www.se.com/uk/en/product/EPP302/ep-series-differential-pressure-air-velocity-transducer-panel-mounting-010-in-wc-02500-pa/.
Schneider Electric (2024b). LV847288 - micrologic 6.0 X control unit, for masterpact MTZ circuit breakers, fixed, LSIG protections | schneider electric UK. Available at: https://www.se.com/uk/en/product/LV847288/micrologic-6-0-x-control-unit-for-masterpact-mtz-circuit-breakers-fixed-lsig-protections/.
Schneider Electric (2024c). STP500-50 - Immersion temp sensor schneider electric UK. Available at: https://www.se.com/uk/en/product/STP500-50/immersion-temp-sensor/.
Schweigkofler, A., Braholli, O., Akro, S., Siegele, D., Penna, P., Marcher, C., et al. (2022). Digital twin as energy management tool through IoT and BIM data integration. doi:10.34641/clima.2022.46
Shahzad, M., Shafiq, M. T., Douglas, D., and Kassem, M. (2022). Digital twins in built environments: an investigation of the characteristics, applications, and challenges buildings. Multidiscip. Digit. Publ. Inst., 12. 120. doi:10.3390/buildings12020120
Siemens (2022). EPC-Tool. Available at: https://epc.bt.siemens.com/EPC/.
Solgi, E., Hamedani, Z., Fernando, R., Skates, H., and Orji, N. E. (2018). A literature review of night ventilation strategies in buildings. Energy Build. 173 (August), 337–352. doi:10.1016/j.enbuild.2018.05.052
UCL (2018a). Campus facilities. UCL East. Available at: https://www.ucl.ac.uk/ucl-east/campus-facilities.
UCL (2018b). UCL heating, cooling and ventilation policy. Sustain. UCL. Available at: https://www.ucl.ac.uk/sustainable/about-us/governance-and-policies/ucl-heating-cooling-and-ventilation-policy.
Vakiloroaya, V., Samali, B., Fakhar, A., and Pishghadam, K. (2014). A review of different strategies for HVAC energy saving. Energy Convers. Manag. 77 (January), 738–754. doi:10.1016/j.enconman.2013.10.023
Vujošević, M., and Krstić-Furundžić, A. (2017). The influence of atrium on energy performance of hotel building. Energy Build. 156 (December), 140–150. doi:10.1016/j.enbuild.2017.09.068
Wang, L., Huang, Q., Zhang, Q., Xu, H., and Yuen, R. K. K. (2017). Role of atrium geometry in building energy consumption: the case of a fully air-conditioned enclosed atrium in cold climates, China. Energy Build. 151 (September), 228–241. doi:10.1016/j.enbuild.2017.06.064
Wright, L., and Davidson, S. (2020). ‘How to tell the difference between a model and a digital twin’. Adv. Model. Simul. Eng. Sci. 7: (1). 13. doi:10.1186/S40323-020-00147-4
Xue, Y., Dong, B., Zhang, Z., and Gao, X. (2023). “Deep learning-based model predictive control for energy saving and consumption reduction in HVAC systems,” in 2023 9th international conference on computer and communications (ICCC), 2233–2238. doi:10.1109/ICCC59590.2023.10507499
Yale University (2021). Becton engineering and applied science center (BCT) | office of facilities. Available at: https://facilities.yale.edu/service-schedule/becton-engineering-and-applied-science-center-bct.
Yale University (2023). Yale to make historic investment in engineering, lower Hillhouse Avenue. YaleNews. Available at: https://news.yale.edu/2023/02/23/yale-make-historic-investment-engineering-lower-hillhouse-avenue.
Yale University (2024). Facilities energy usage explorer. Available at: https://java.facilities.yale.edu/energy/.
Yin, H., and Mohamed, H. (2023). Towards smart electric heaters for homes in-line with EN-ISO 52120 standard. Build. Simul. 18. 3050–3058. doi:10.26868/25222708.2023.1155
Keywords: live data streams, ISO 52120, data-driven control, built environment, building automation and control, smart building, data harvesting, net zero
Citation: Markiewicz W, Wilczynski V, Dorsey J, Wilson D and Elwell C (2025) Assessing the utility of live data streams across existing and planned university buildings. Front. Energy Effic. 3:1539689. doi: 10.3389/fenef.2025.1539689
Received: 04 December 2024; Accepted: 31 January 2025;
Published: 24 February 2025.
Edited by:
Tomasz Cholewa, Lublin University of Technology, PolandReviewed by:
Graziano Salvalai, Polytechnic University of Milan, ItalyŁukasz Amanowicz, Poznań University of Technology, Poland
Damian Muniak, Cracow University of Technology, Poland
Copyright © 2025 Markiewicz, Wilczynski, Dorsey, Wilson and Elwell. This is an open-access article distributed under the terms of the Creative Commons Attribution License (CC BY). The use, distribution or reproduction in other forums is permitted, provided the original author(s) and the copyright owner(s) are credited and that the original publication in this journal is cited, in accordance with accepted academic practice. No use, distribution or reproduction is permitted which does not comply with these terms.
*Correspondence: William Markiewicz, d2lsbGlhbS5tYXJraWV3aWN6LjIxQHVjbC5hYy51aw==
†ORCID: William Markiewicz, orcid.org/0000-0002-1084-7884; Julie Dorsey, orcid.org/0000-0003-2495-4979; Duncan Wilson, orcid.org/0000-0001-6041-8044; Clifford Elwell, orcid.org/0000-0003-1058-1091