 Raja Rajendra Timilsina
 Dil B. Rahut
 Madhu Sudan Gautam
 Raman Mishra
 Tetsushi Sonobe
- 1Asian Development Bank Institute, Tokyo, Japan
- 2Institute for Frontier Studies (IFS), Kathmandu, Nepal
- 3Korea University, Seoul, Republic of Korea
The natural environment is negatively impacted by the daily fuel use for domestic purposes, particularly in developing nations with large populations, such as India, where biomass is the primary source of fuel for household cooking. However, a greater understanding is needed about the trends, patterns, and factors affecting household energy consumption and choice in India over the past two decades. The National Family Health Survey (NFHS) data from the years 2005–2006, 2015–2016, and the most recent year 2019–21 are used in this study to empirically demonstrate that characteristics including gender, education, capital, social status, and geography have significant influence on a household's decision to use cleaner energy. The results report that homes in rural regions, the poorest and most impoverished households, those headed by women, and without formal education have been unable to switch to cleaner fuels such as liquid petroleum gas (LPG) over time. As the study suggests that increasing income levels and education can lead to a shift toward cleaner household energy consumption, policies promoting economic growth and education can reduce greenhouse gas emissions from household energy consumption. Thus, policies like subsidies in LPG and electricity shall explicitly aim to assist impoverished households and lower-income families in enhancing their accessibility and affordability options for cleaner energy sources. The research underscores the significance of directing efforts towards the economically disadvantaged segments of society, guaranteeing their access to more environmentally friendly energy sources.
1. Introduction
Anthropogenic climate change is driven by numerous human activities, such as consuming dirty solid fuels such as firewood, dung, kerosene, and straw. Consumption of these solid forms of energy are widely acknowledged as aggregating atmospheric carbon emissions (Crutzen, 2016). Clean energy is important for human health, the environment, and socioeconomic development (Duflo et al., 2008; Akpalu et al., 2011). Dirty energy sources such as firewood and charcoal are used because they are easily accessible and cheap (Leach, 1992), and shifting to cleaner energy sources such as gas and electricity can be more expensive. The energy transition ladder assumes that wealthier households use cleaner energy sources such as electricity and liquid petroleum gas (LPG), while poorer households use firewood and dung (Rahut et al., 2017b). These transitions reflect the relationship between income and consumption of energy sources (Hasan and Mozumder, 2017; Aghaei and Lawell, 2020; Wang et al., 2022). Thus, in response to increasing income levels, households in lower- and middle-income countries might shift from traditional dirty energy sources such as biomass to cleaner and more efficient energy sources such as LPG and electricity (Daioglou et al., 2012; Khandker et al., 2012; Mensah and Adu, 2015; Rahut et al., 2017b; Sharma and Dash, 2022). Little is known about how such a change in economic structure in middle- and lower-income countries in the last two decades has led to the choice of clean energy sources.
Daily household energy consumption, which includes mostly dirty energy sources, contributes to environmental degradation and greenhouse gas emissions, especially in developing countries with large populations heavily dependent on biomass for energy (Rahut et al., 2017b). Therefore, this study examines the trends and determinants of household energy choice in India over the last two decades. This study utilizes data from the previous last 15 years to check whether households have changed to consuming cleaner energy. For this study, we used the latest National Family Health Survey (NFHS) data from three periods, 2005–2006, 2015–2016, and 2019–2021, and this study addresses the energy consumption patterns by using large nationally representative household data sets from India covering over 1.2 million data points. A novel feature is that this study uses the latest data for 2019–2021 to identify energy consumption patterns and the determinants at a regional level in India. Next, we used a multinomial logit model with odd ratios to analyze the determinants for household energy choices. The National Family Health Survey (NFHS) has good-quality data and large sets of variables that enabled us to examine the significance and differential roles of education, wealth, and other sociodemographic factors in the choice of clean energy sources for household use.
The rest of this study is organized in the following ways. The data and methodology are described in Section 3, “Data and Methodology”, including the data sources and collection and the specification of econometric models. Section 4 reports the “Results and Discussion” along with trends and the transition of household energy consumption in India from 2005 to 2021. Finally, we provide “Conclusions” with implicit policy implications in Section 5.
2. Literature review
Recent studies have identified factors such as income, household size, education, and gender of the household heads as playing an important role in household energy consumption (Heltberg, 2004; Rao and Reddy, 2007; Hasan and Mozumder, 2017; Mottaleb et al., 2017; Sharma and Dash, 2022). Leach (1992) find that the energy transition process is heavily influenced by access to modern fuels and the cost of transitioning and suggests that the consumption of cleaner energy sources is positively related to household income and wealth, creating an “energy transition ladder”. Pachauri (2004) use Indian household survey data from 1993 to 1994 and concludes that the socioeconomic status of households, geography, family structure, and residence characteristics influence the total household energy consumption. Pachauri and Jiang (2008) find the determinants of modern energy choice and trends in energy use that are similar in both India and China, where households are highly dependent on solid fuels in rural areas. In Brazil, Ghana, Guatemala, India, Nepal, Nicaragua, South Africa, and Vietnam, Heltberg (2004) and Heltberg (2005) find that modern cleaner fuel use is positively (negatively) associated with per capita expenditure, household wealth, and education, while solid fuel use is negatively associated with these factors. Hasan and Mozumder (2017) use Bangladesh Household Income and Expenditure Survey (BHIES) 2010 data and identified that the demand for clean energy sources by poor households is low, but when their income reaches a certain threshold level, the energy demand for clean energy sources starts increasing. Sharma and Dash (2022), using the primary data and multinomial model, claim that households with a regular and fixed income from salaried work or business are less likely to use solid fuel. Studies have shown that wealth and income are the important parameters influencing use and consumption of clean and convenient energy sources.
Household energy preferences are affected by the education level because education is directly related to improving income level and provides knowledge and awareness about energy sources and their positive and negative aspects (Rao and Reddy, 2007; Pandey and Chaubal, 2011; Mottaleb and Rahut, 2021; Dongzagla and Adams, 2022; Mottaleb et al., 2022; Waleed and Mirza, 2022). Rao and Reddy (2007) use the 1999–2000 National Sample Survey (NSS) data covering over 118,000 households in India and concluded that per capita income, household size, educational level of household head, and occupation are the strong determinants of clean fuel choice. Pandey and Chaubal (2011) utilize the 61st round of the National Sample Survey and reveal that the number of educated female individuals between 10 and 50 years of age, average household education index, regular salary, and monthly per capita consumption expenditure have a significant positive impact on the choice of clean cooking fuels in rural India. Mottaleb and Rahut (2021) employ information on urban households from three periods of the NSSO (46th, 1991–1992; 63rd, 2006–2007; and 68th, 2011–1212) and identify that the educational level of the household head and spouse and economic status are the major determinants in the choice of clean fuels. Dongzagla and Adams (2022) adopt data from the 2014 Ghana Demographic and Health Survey and notice statistically significant and positive associations between clean fuel use and age, family size, educational level, and wealth. Waleed and Mirza (2022) use Pakistan Household Integrated Expenditure Survey (HIES) data from 2015 to 2016 to show that beside income, other household-specific factors such as prices, size, education, profession, and the residential area play an imperative role in energy transition. Hence, education is one crucial factor influencing a household's clean energy choice decision and leads toward energy transition.
Farhar (1998) analyzes gender roles for developing energy policy and argued that gender and renewable energy should be considered while formulating, such policy. He argues that gender roles should be an inherent part of sustainable economic development programs. Heltberg et al. (2000) exercise data from 180 households residing in four different villages in the Alwar district in Rajasthan in the northwestern part of India in 1997 and found that female family members proactively get involved in collecting firewood from the forest more than the male ones, while male family members play a conventional role in the family by engaging in agriculture, earning wages, and engaging in other non-farm employment activities. Israel (2002) analyzed the Bolivian Integrated Household Survey 1989 and claimed that compared to men, women have a stronger preference toward clean energy sources. Another interesting finding was that per-capita fuelwood consumption in female-headed households was less than that in male-headed households.
Gould and Urpelainen (2020) used data from 8,563 Indian households and demonstrated that women's empowerment increases the likelihood of using cleaner energy fuel, such as LPG, and further emphasized that involving women in a participatory decision-making process would empower them. Twumasi et al. (2020) reported that, together with other household characteristics, access to credit, opportunities for employment, and non-farm income are positively correlated with the consumption of cleaner energy fuel. Adusah-Poku et al. (2022) used the Exogenous Switching Treatment Effect (ESTER) method and the 7th Ghana Living Standards Survey 2016–2017 and found that female-headed households with access to economic opportunities tend to have a higher probability of choosing clean energy sources compared to a male-headed household with similar conditions. Thus, the role of female household members is vital for the household's decisions regarding the use of energy sources. Female household members, as principal decision-making agents, place a higher priority on the use of clean energy sources, which provides better health for their families and more leisure time for themselves. Their inclusion in policy development and empowerment by making them principal decision-making agents is crucial toward energy transition.
Demographic characteristics, such as the household head's age and the number of adults, influence a household's decision to choose a cleaner energy source. However, some studies have claimed that household size might negatively affect the probability of selecting clean cooking fuel and that such a relationship could be non-linear (Pandey and Chaubal, 2011; Rahut et al., 2017a). The reason household size is positively related to the high consumption of solid fuels, such as wood, is the increase in demand for energy and excess labor supply for collecting wood for fuel in rural areas (Heltberg et al., 2000). Rahut et al. (2017a) conduct a primary survey of 500 farmers from the seven districts of the Himalayan region of northern Pakistan and ascertain that young and educated farmers with large land holdings use more than one energy source for cooking purposes. Koirala and Acharya (2022) make study of two periods data from the National Living Standard Surveys (NLSS) and four Annual Household Surveys (AHS) and found that household size and availability of clean energy sources (supply) affects the use of traditional fuels, such as firewood and self-collected fuels.
Our study has examined household energy choices in India over the last two decades. Dirty energy sources that are used for daily household consumption contribute to environmental degradation and greenhouse gas emissions in developing countries heavily dependent on biomass for energy. Clean energy is crucial for human health, the environment, and socioeconomic development, but switching to cleaner sources such as gas and electricity can be expensive. The study has used the latest National Family Health Survey data from three periods to analyze energy consumption patterns through large household data sets covering over 1.2 million data points. The study has used a multinomial logit model with odd ratios to analyze the determinants of household energy choices, examining the significance and roles of education, wealth, and sociodemographic factors.
3. Data and methodology
3.1. Data and sampling
This study used the data collected by the National Family Health Survey (NFHS) of 2005–2006, 2015–2016, and 2019–2021 to analyze the trends in household energy choice in India and the determinants of household energy use. The NFHS conducts extensive surveys in several rounds by studying representative samples of households in India and works in collaboration with International Institute for Population Sciences (IIPS) and East-West Center, Honolulu, Hawaii, USA. The Ministry of Health and Family Welfare of India has appointed IIPS as the agency responsible for the coordination and guidance of the NFHS, whereas the United States Agency for International Development (USAID) and the United Nations Children's Fund (UNICEF) fund the NFHS. IIPS, in collaboration with several organizations, implements the survey for the NFHS. The sample selection is based on two mutually exclusive sampling frames for rural and urban areas. The sampling process is available on the DHS website (https://dhsprogram.com/).
Table 1 summarizes the data used in this study. A total of 1,276,508 households were sampled in the studies, with 71% representing the rural population and 29% the urban population. The average number of household members is approximately five in rural and urban areas, and household heads are 84% male with an average age of 48 years. Among the polled households in rural and urban areas of India, 35% and 18% had no education, and 39% and 47% had secondary education, respectively. Only 6% and 20% of the people in rural and urban areas had a higher level of education. Urban areas comprised 29% and 43% of the richer and richest households, respectively, while poorest, poorer, and middle-income households comprised only 10%. In rural areas, 29% of the population were in the poorest category, 27% were considered to be in the poorer category, and 22% were in the middle-income category. The total sample share by social status, such as scheduled caste, scheduled tribes, other backward castes, and general caste, was 19%, 20%, 39%, and 22%, respectively. The distribution of the sample by social status (scheduled caste, scheduled tribes, backward caste, and general caste) for rural areas were 20%, 23%, 38%, and 19%, respectively, and for urban areas were 17%, 11%, 40%, and 19%, respectively.
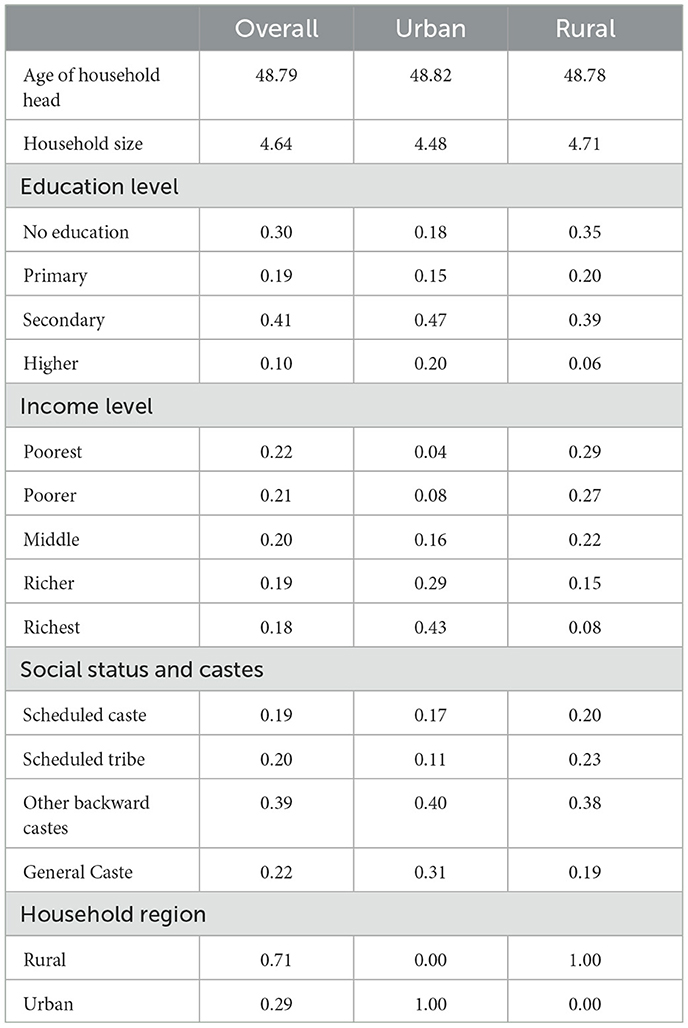
Table 1. Representation and summary of the data used in the study.
3.2. Methodology
This study used multinomial logit models to determine the correlation and analyze the factors influencing a household's energy choice by combining the three periods of data from NFHS, 2005–2006, 2015–2016, and 2019–2021. This study used energy source choices as dependent variables, which included electricity, LPG, biogas, kerosene, coal lignite, charcoal, straw, and dung. We also performed a graphical analysis to establish the linkages between energy choice and wealth, education, and regional differences as found in rural and urban areas. This study used a multinomial logit model with exponentiated coefficients, commonly interpreted as odds ratios, to predict the different energy source choices jointly. Multinomial logistic regression predicts a categorical choice of energy sources based on dependent variables over multiple independent variables.
This multinomial logistic regression is a simple extension of binary logistic regression that allows for more than two categories as the outcome variables. Multinomial logistic regression uses maximum likelihood estimation for categorical choices, such as binary logistic regression. Therefore, our discrete selection model implicitly assumes that the household choice of energy source is mutually exclusive.1 Several existing studies of household energy choices have considered the demographic composition, such as age, female-headed household, household size, education level, wealth status, and a regional dummy of rural and urban areas (Rahut et al., 2014, 2017b). Thus, this study examines the importance of several sociodemographic factors in decision-making for energy consumption.
The multinomial logit model can be expressed by the equation (1) below:
The multinomial logit model presented in equation (1) is indeterminate because it is a system of M equations in only M-1 independent unknowns.
Because of normalization, the probabilities are uniquely determined. Hence, equation (3) represents a system of M-1 equations in the M-1 unknown probabilities, Pr(Yi = 1), as defined by equation (2) through the normalization adopted. Several past studies of household energy choices have considered logistic regression models as suitable because of the use of estimation of conditional probabilities (Yi) (Solaymani et al., 2012; Rahut et al., 2014, 2017b). Therefore, the model that was designed to investigate the household's energy choice is as follows:
In the above model, yi is the dependent variable (primary cooking fuel), which consists of nine categorical and mutually exclusive variables: electricity, LPG, biogas, kerosene, coal lignite, charcoal, straw, dung, and wood. Because the dependent variables are categorical and mutually exclusive, we estimated a multinomial logit model, with wood as the base category. Agei and Agesqi are the age of the household head and its square. FHSs is 1 if the household head is a woman; otherwise, it is zero. HHSs and HHSSqs are household size and household size squared. EduHHSs is the education level of the household head that includes a dummy variable for primary school level education, a dummy variable for secondary school level education, and a dummy variable for higher education, where the base education category is no formal schooling. The variable Wealthh includes five wealth categories (poorest, poorer, middle, richer, and richest) with dummy variables, in which the poorest group is the base category. Social<uscore>groupi is the dummy variable for caste, which has four categories, that is, if the household belongs to a scheduled tribe, scheduled caste, backward caste, and general caste. Rural is a dummy variable that takes the value 1 for rural households; otherwise, it takes the value 0. To control for the time effect, we used a time dummy Timeh for five two-time (NFHS 4 2015–2016, NFHS 5 2019–2021) dummy variables, in which the NFHS3 2005–2006 is the base category. Finally, to control for all other spatial differences, we used state and union territories dummy variables, which are specified as state in the equation. In Equation (5), α0 is a scalar, λi, βi, γi, φs, θh, ψiand γd are the parameters to be assessed, and ζim is the random error term.
4. Results
4.1. Trends and correlation
To capture the temporal variation in the use of cleaner fuels, we developed Figure 1, which displays the pattern of household energy consumption. Figure 1 consists of the year as a period on the horizontal x-axis and energy use as a percentage on the vertical y-axis. Figure 1 shows the patterns of overall energy consumption for the last 1.5 decades at the national, urban, and rural levels. First, the overall graph shows that ~10% of households use kerosene, straw, and dung as primary cooking energy sources, which gradually decreases to <5% in 2019–2021. However, the use of coal, coal lignite, and electricity has remained constant over the last 15 years. Wood as a source of cooking fuel declined from 44% in 2005–2006 to approximately 38% in the period 2019–2021, while the percentage of families consuming gas gradually increased from approximately 35.5% in 2005–2006 to 51.6% in 2019–2021, highlighting the significant progress achieved by India in its transition toward cleaner energy cooking fuel at the household level.
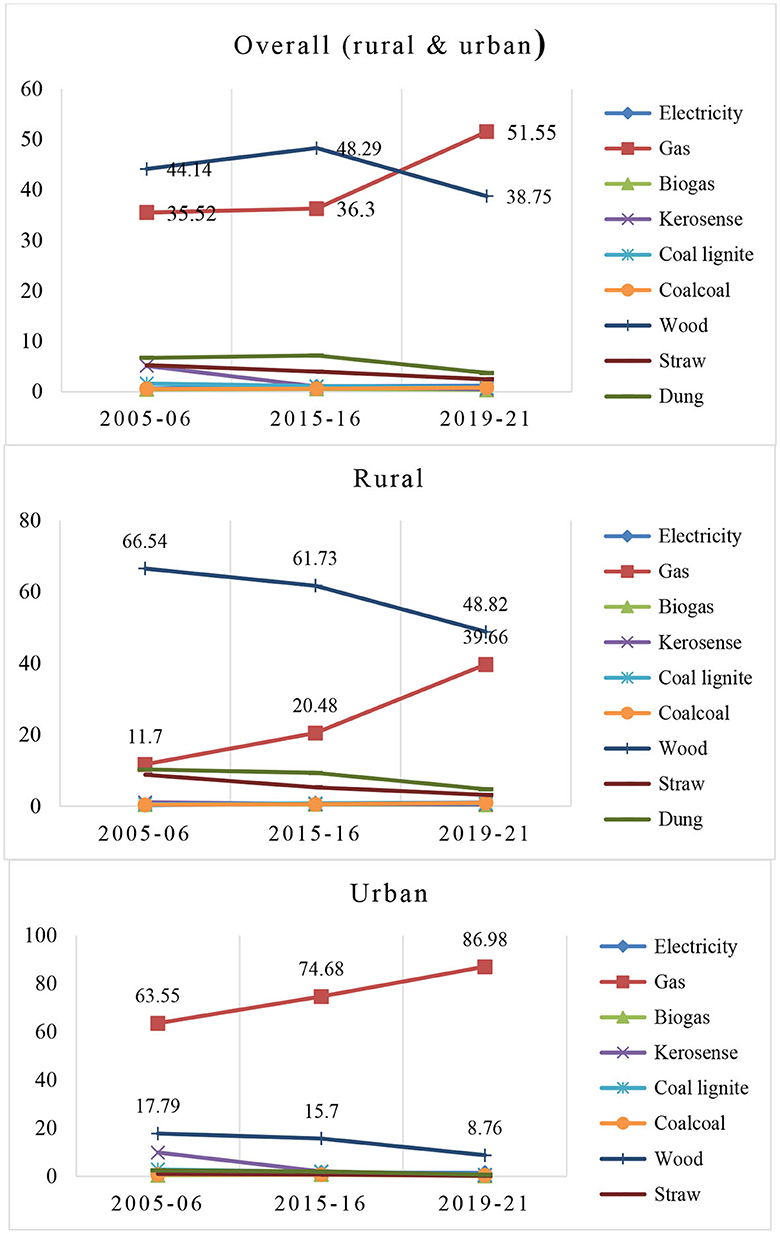
Figure 1. Percentage of households by cooking energy sources and year.
Similar patterns and trends are observed in rural and urban areas, but the proportion of energy shares varies between these regions. For instance, in rural areas, the percentage of households using gas as a primary energy source increased from 11% to 39% and in urban areas from 63% to 86% between 2005–2006 and 2019–2021. These results show that, in both rural and urban areas, the increase in the use of LPG as a source of cooking fuel is more than 20%. During the same period, the percentage of households using wood as the source of cooking energy declined from 17% to 8% in urban areas, while it declined from 68% to 48% in rural areas. Overall, these results confirm that the use of clean cooking energy increased in both rural and urban areas of India over 15 years.
The cooking energy choice and its correlation with education by year are presented in Figure 2. Figure 2 shows that the percentage of households using LPG increases with an increase in the education levels of the household head for all periods under study (i.e., 2005–2006, 2015–2016, and 2019–2021). For instance, the percentage of households using LPG was 11%, 17%, and 36% for households with no education in 2005–2006, 2015–2016, and 2019–2021, respectively, but it was 84%, 78%, and 83% for the households with higher education, respectively. We also examined the correlation between cooking energy sources and education levels for rural and urban areas separately and found a similar trend, i.e., with the increase in education, the percentage of households using clean energy increases for all the years, and its percentage increases both in the rural and urban area (Appendix Figures 1, 2). In the period 2019–2021, in urban areas, the use of LPG gas and wood by households with higher education or university is above 90% and <2%, respectively, while in rural areas, it is approximately 60% and 20%, respectively. Over the decades, from 2005–2006, 2015–2016, and 2019–2021, the percentage of households using LPG increased by more than three times, even among households in the no-education cohort.
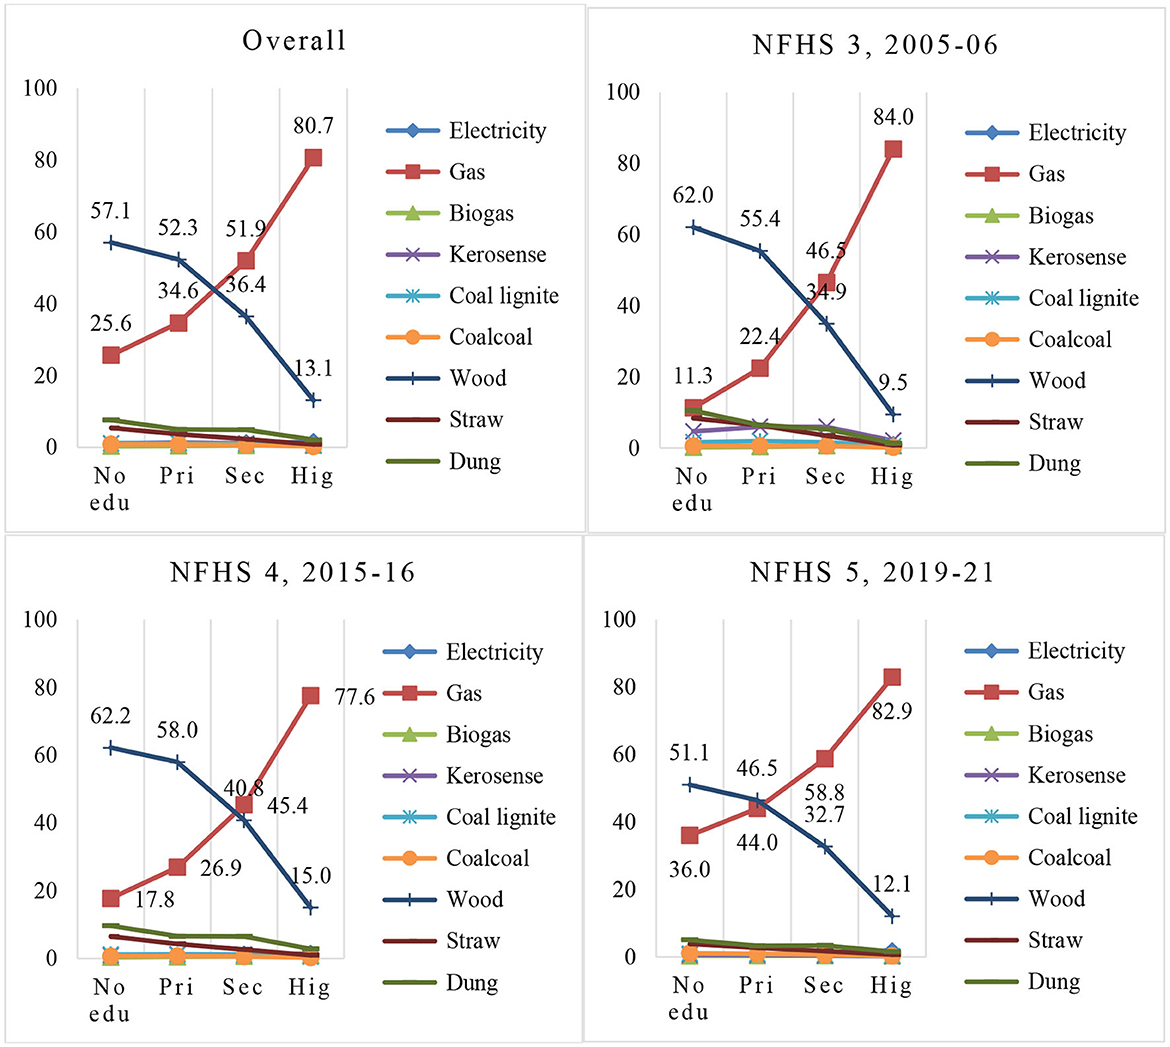
Figure 2. Percentage of households by cooking energy sources and level of education.
Figure 2 confirms that there has been a shift toward cleaner energy over the last 1.5 decades. Analysis shows that education level has a positive relationship with clean energy sources. Another notable factor is the wealth of the households. Figure 3 shows the percentage of households using different energy sources by wealth category. First, it examines the patterns of usage of different sources of energy for the years 2005–2006, 2015–2016, and 2019–2021. More than 80% of the wealthiest households (i.e., the richest category) use LPG, while only about 10% of the poorest households use it. Among the poorest households, more than 70% use firewood; this has been relatively constant over the decades. However, the use of other dirty energy sources, such as straw and dung, has sharply declined over the decades. Supplementary Figures S3, S4 in Appendix represent the percentage of households by cooking energy sources and economic status for urban and rural areas. During the period 2019–2021, in urban areas, the use of LPG gas and wood by the wealthy household cohort, i.e., the richest, was above 95% and <1%, respectively, while in rural areas, it was approximately 85% and 9%, respectively. In summary, Figure 3 visually shows that wealth is necessary to transition toward clean energy consumption. Over the decades, poverty has decreased, and households are shifting toward consuming clean energy sources.
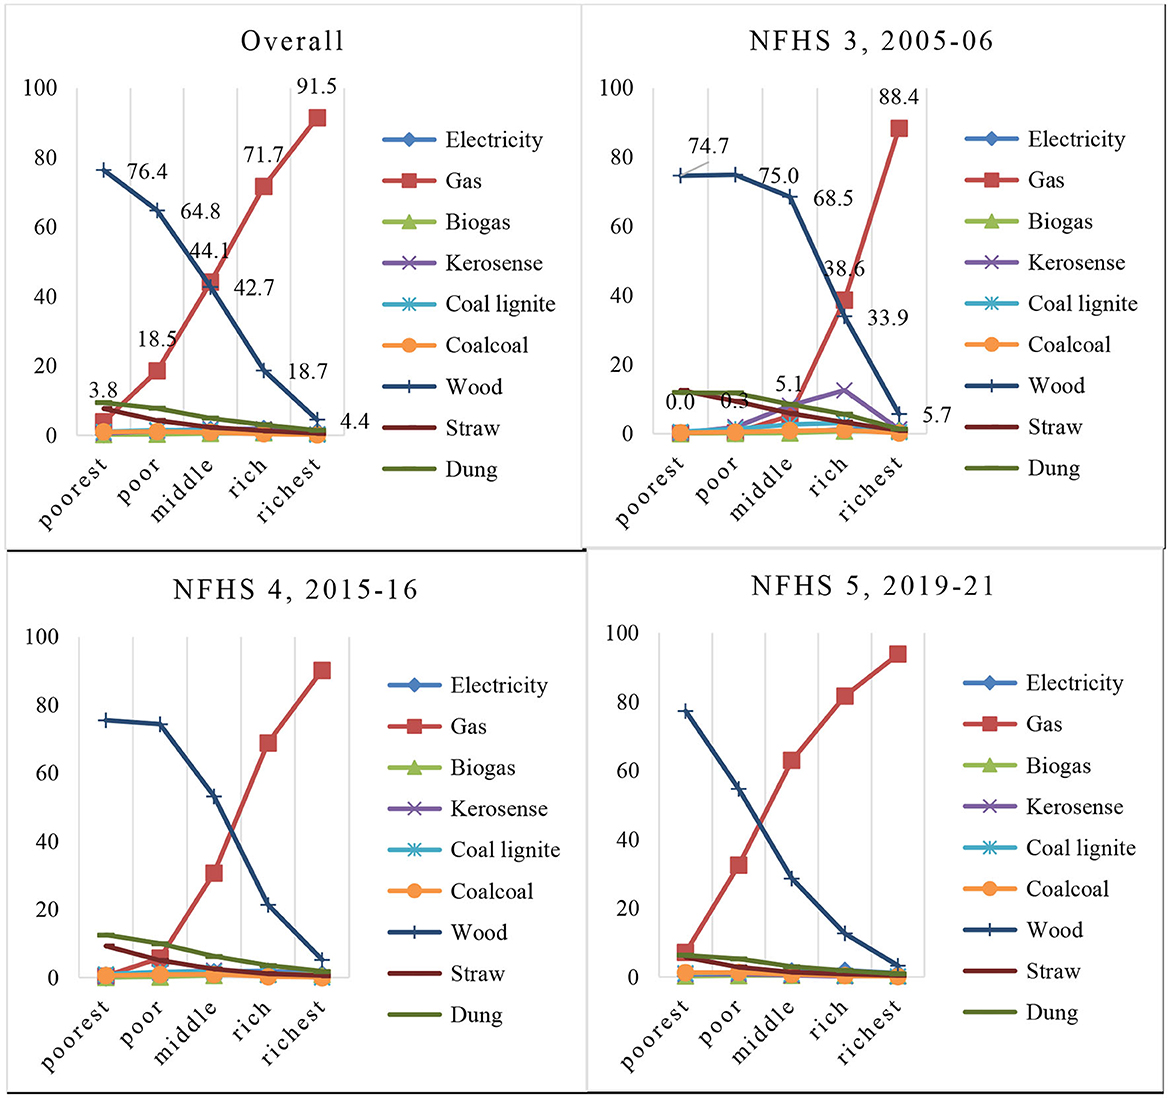
Figure 3. Percentage of households by cooking energy sources and wealth category.
4.2. Regression analysis
The results of the multinomial logit model estimation on the determinants of the household choice of different energy sources for cooking are reported in Table 2. Overall, the model estimation is highly significant with the likelihood-ratio chi-squared test as goodness-of-fit, which is significant (χ2 = 1,264,140.62, p < 0.000). This indicates that the model predicts significantly better or more accurately than the null model. If the odds ratio is greater than one, it indicates the occurrence of the outcome is highly likely for that category, and if it is <1, the outcome is less likely to occur compared to the reference group.
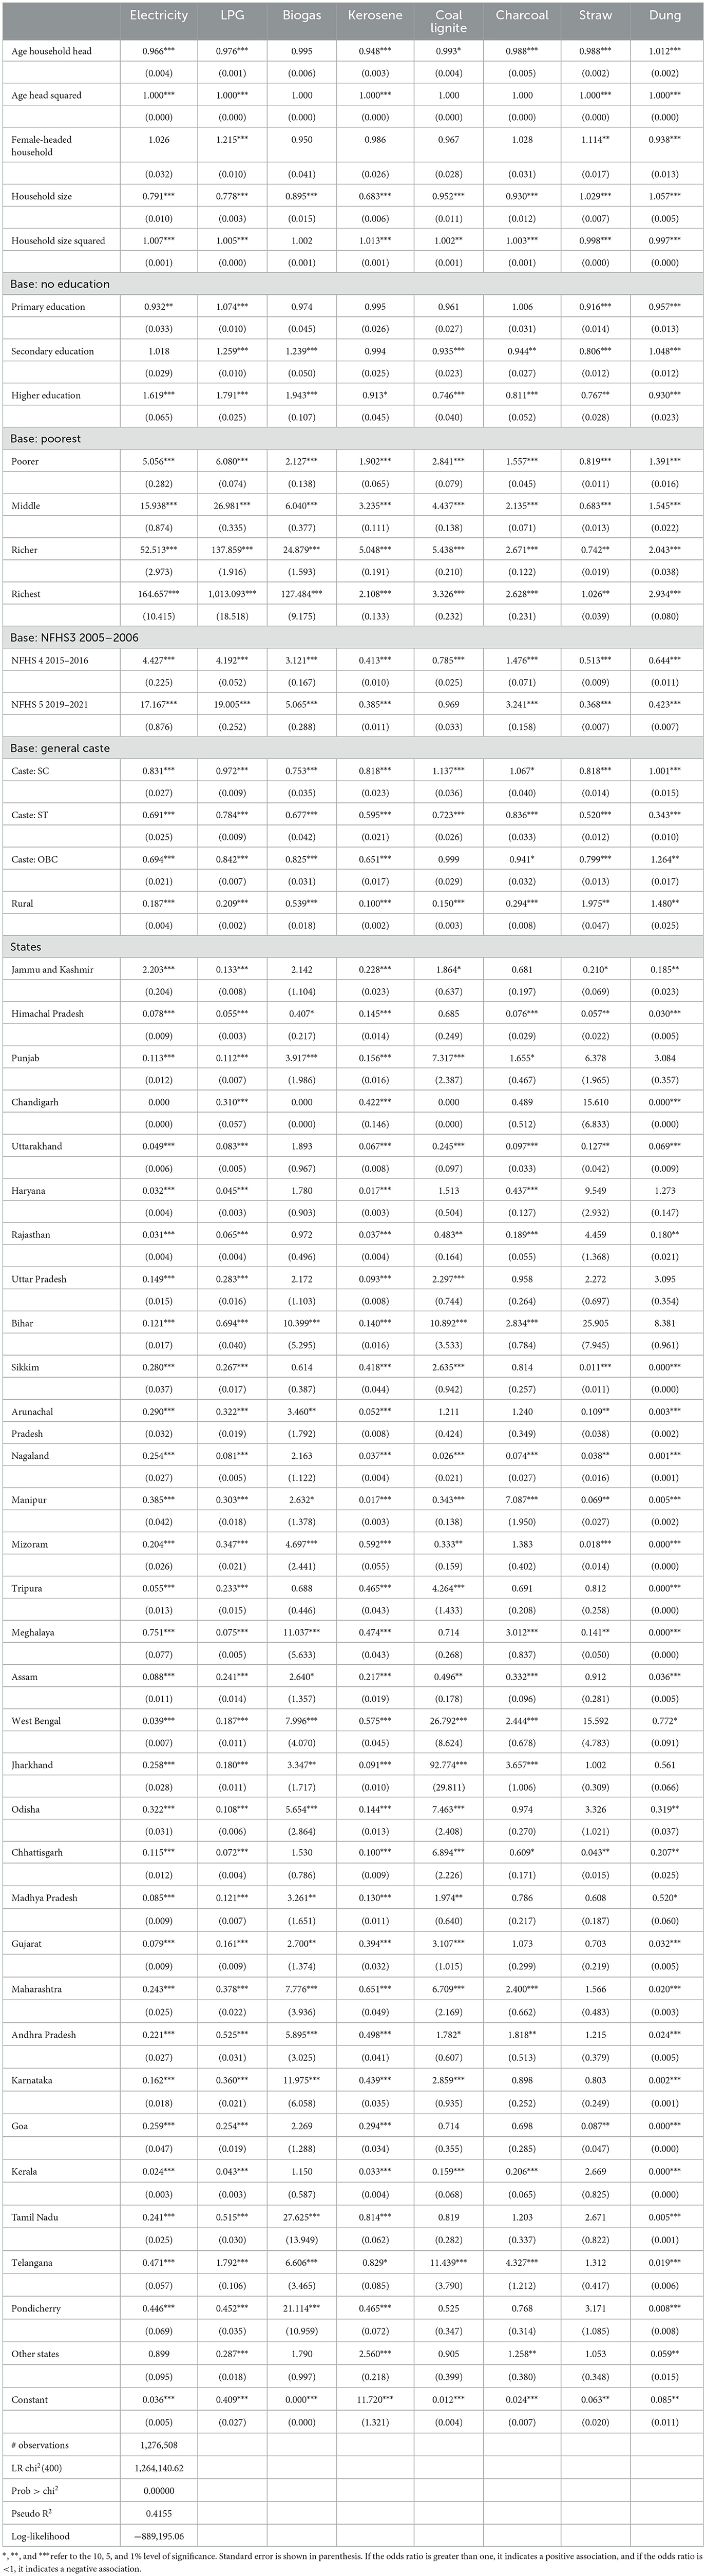
Table 2. Empirical result using multinomial logit to examine the factors influencing the primary fuel choice (odds ratio).
The coefficients of independent variables, such as “age of the household head”, are significant at the 1% level and positively correlated with the use of dung as fuel, holding other factors constant. These results show that the age of the household head is positively correlated with the use of dung as fuel, while the likelihood of consuming traditional energy sources decreases with the age of the household head. Households with a female head are more likely to consume a clean energy source, such as LPG. The positive and significant relationship between female-headed households and the choice of LPG for cooking indicates that female members prefer gas because it is convenient for them, and they are responsible for managing the energy source for cooking. We also noted that female-headed households are less likely to use dung as fuel.
Similarly, household size also plays a role in energy choices, as the likelihood of use of straw and dung increases as the number of household members increases, while the consumption of other modern fuels decreases. The results also show that households with more family members rely on traditional energy sources such as straw and dung more than those with small family sizes. Household size with more family members means more labor available to collect fuelwood. Overall, this finding is consistent with other empirical studies that have observed that age and gender factors are important in access to affordable and clean energy (Joon et al., 2009; Rahut et al., 2016; Mottaleb and Rahut, 2021; Zi et al., 2021; Mottaleb et al., 2022).
This study also found that the education level of the household head plays a significant role in choosing clean energy sources. The result shows that, compared to household heads with no formal education, household heads with a primary education level are more likely to consume LPG. The results show that, with an increase in the level of education of the household head to secondary and higher education groups, the likelihood of households using electricity, LPG, and biogas increases, and these results are significant at the 1% level. The results imply that the household head's education level positively influences clean energy choice. These findings are also consistent with other studies in developing countries (Pandey and Chaubal, 2011; Rahut et al., 2016).
The wealth status of households also plays a significant role in the energy source used for cooking. The wealth status of households is divided into five categories: poorest, poorer, middle, richer, and richest. The odds ratios for the use of electricity, LPG, biogas, kerosene, coal lignite, charcoal, and dung for poorer households compared to the poorest ones are 5.05, 6.08, 2.12, 1.90, 2.84, 1.55, and 1.39, respectively, and significant at the 1% level. Poorer households are less likely to use clean energy sources than wealthier households, and the results indicate the importance of household wealth/income on energy choice. Similar results were obtained for other wealth groups, such as middle-income and the richest. Overall, the results imply that wealth/income level plays a significant role in the transition toward clean energy usage. These findings are also consistent with other studies in developing countries (Rahut et al., 2016; Ravindra et al., 2019; Pallegedara et al., 2021).
Rural households are less likely to use electricity, LPG, and biogas as cooking energy sources than urban households because they are isolated and have limited financial resources and access to modern energy sources. Studies on energy choice in developing countries have found similar results (Pachauri, 2004; Pachauri and Jiang, 2008). These studies have claimed that variables such as distance to market are negatively associated with using electricity, LPG, and kerosene. Similarly, social status, such as caste, plays a crucial role in cooking energy choice. The scheduled caste and tribe are more likely to use charcoal, coal lignite, kerosene, and dung and are less likely to use electricity, LPG, and biogas as sources of energy for cooking. At the state level, 19 states are more likely to consume biogas and coal lignite. It seems clear from the results that electricity usage as the primary energy source for cooking in several states is not significant, unlike straw and dung.
Compared to the base year 2005–2006, in 2015–2016 the odds ratios for electricity, LPG, biogas, and charcoal are 4.42, 1.19, 3.12, and 1.47, respectively. Similarly, compared to the base year 2005–2006, in 2019–2021, the odds ratios for electricity, LPG, biogas, and charcoal consumption are 17.16, 19.00, 5.06, and 3.24, respectively. These results are significant at the 1% level and indicate that households are moving toward cleaner energy sources over time. These results are consistent with the graphical trends presented earlier.
5. Conclusion and discussion
The study explores various factors that influence the choice of energy sources for cooking in households in India. It shows the trends of household energy consumption by using a multinomial logit model that employs the three periods of the National Household Family Survey (NHFS3, NHFS4, and NHFS5) data. The descriptive analyses of trends and household energy consumption patterns show that, from 2005–2006 and 2015-2016 to 2019–2021, a substantial number of households in India switched toward cleaner energy sources, such as LPG and electricity. The results of the multinomial logit model find that the gender of the household head, education level of the household head, location (rural or urban area), wealth, and state characteristics are important determining factors that affect a household's energy choices. The results suggest that households with female heads and higher education levels are more likely to use clean energy sources such as LPG, while larger family households are more likely to rely on traditional energy sources such as straw and dung. The wealth/income of the households helps them choose clean energy sources, indicating that, with an increase in income, affordability of clean energy, and accessibility to clean energy, thereby enabling households to switch to clean energy sources. Additionally, rural households have limited access to modern energy sources compared to urban households, and social status, such as caste, also affects energy choice. Overall, the study shows that, over time, households (urban and rural) in India are transitioning toward cleaner energy sources. The study results have important implications for policymakers in India who seek to promote the use of clean energy sources, particularly among disadvantaged groups.
The study indicates that there has been a significant shift, even in poor and rural households, toward cleaner energy consumption in India over the last two decades. The study highlights that households have moved away from traditional dirty energy sources such as biomass and are using more efficient energy sources such as LPG and electricity. However, these results suggest that low-income families manage their energy requirements by collecting firewood from forests and other common energy resources in their localities. Thus, the study indicates that increasing income levels drive this shift in clean energy use. Beside wealth, this study also found that education is a significant driver of using clean energy sources. Education of the household head emerges as a prominent determinant for using cleaner energy sources. Households with female heads tend to use clean energy because LPG and electricity are more convenient to use, and thereby female heads of households help households switch to clean energy. Overall, the findings highlight the need for policies that address the diverse factors influencing energy choice and promote the use of clean energy sources in households.
5.1. Future recommendations, policy implications, and limitations
By examining the data over 15 years from 2005–2006 to 2019–2021, we concluded that India has made significant progress in the transition to clean energy in both rural and urban areas, and that factors such as wealth, education, and gender play an important role in the transition to clean energy sources. To realize the ambition and commitment toward zero emissions, a country such as India has to emphasize the policy upfront to encourage the adoption of promising low-emission or clean energy sources for rural households and energy-poor states. National commitments can be achievable if interventions consider social and cultural factors that influence energy choices, along with infrastructural, technical, and economic aspects. Thus, we suggest designing policies for government interventions by focusing on the areas highlighted in this article. In low-middle-income countries, users are ready to shift, but more clean energy options are required.
The policy implications from the study are that increasing income levels and education can lead to a shift toward cleaner energy consumption in households. Therefore, policies that promote economic growth and education can lead to a reduction in greenhouse gas emissions from household energy consumption. Additionally, policies that subsidize cleaner energy sources such as LPG and electricity can make them more accessible and affordable for lower-income households. The study highlights the importance of targeting policies toward the poorer sections of society to ensure that they have access to cleaner energy sources.
Finally, we have noted some limitations and future avenues for research. The results of this research have been based mainly on NFHS survey data and lack the observed behavioral data. Therefore, future studies should be able to analyze behavioral and qualitative data to detail how and why individuals make decisions to use particular energy sources. By doing so, we will be able to identify the precise mechanism of interventions and identify effective policy along with economic and psychological factors. These caveats notwithstanding, we believe that this study is an important step in understanding energy transition in the last 15 years, and we hope that further studies will suggest something new to enhance energy sustainability and cleaner use of energy sources in low- and middle-income countries.
Data availability statement
Publicly available datasets were analyzed in this study. This data can be found here: https://dhsprogram.com.
Ethics statement
Ethical approval was not required for the study involving human data in accordance with the local legislation and institutional requirements. The study uses the publicly available data collected by the National Family Health Survey (NFHS), for which the participants provided informed consent.
Author contributions
Material preparation, data cleaning, and analysis were performed by DR, RT, and RM. The first draft of the manuscript was written by RT. DR, MG, RM, and TS contributed by commenting and editing the previous versions of the manuscript. All authors contributed to the study conception and design and have read and approved the final manuscript.
Acknowledgments
The authors express their gratitude to the editor and two referees for their meticulous feedback and valuable suggestions. They also extend their appreciation to Jingchao Zhang, Shibly Shahrier, Mostafa E. Shahen, Yayan Hernuryadin, Pankaj Koirala, and Pradeep Panthi for their tireless support and encouragement. The authors are grateful for the financial support provided by the Asian Development Bank Institute (ADBI), Japan. Finally, the authors would like to thank Korea University and the Institute for Frontier Studies (IFS), Nepal. We also thank ADBI for the support required for editing and publishing.
Conflict of interest
The authors declare that the research was conducted in the absence of any commercial or financial relationships that could be construed as a potential conflict of interest.
Publisher's note
All claims expressed in this article are solely those of the authors and do not necessarily represent those of their affiliated organizations, or those of the publisher, the editors and the reviewers. Any product that may be evaluated in this article, or claim that may be made by its manufacturer, is not guaranteed or endorsed by the publisher.
Author disclaimer
The views expressed in this manuscript are those of the authors and do not necessarily reflect the views or policies of the institution of the author, and the usual disclaimers apply.
Supplementary material
The Supplementary Material for this article can be found online at: https://www.frontiersin.org/articles/10.3389/frevc.2023.1137248/full#supplementary-material
Footnotes
1. ^These methods are suitable when there are several categories of dependent variables. Multinomial logistic regression takes the assumptions of independence among the dependent variable choices, such that the choice of one category is not related to the selection of another category.
References
Adusah-Poku, F., Adams, S., and Adjei-Mantey, K. (2022). Does the gender of the household head affect household energy choice in Ghana? An empirical analysis. Environ. Dev. Sustain. 25, 8. doi: 10.1007/s10668-022-02293-8
Aghaei, M., and Lawell, C. L. (2020). Energy, Economic Growth, Inequality, and Poverty in Iran. Singap. Econ. Rev. 67, 733–754. doi: 10.1142/S0217590820500198
Akpalu, W., Dasmani, I., and Aglobitse, P. B. (2011). Demand for cooking fuels in a developing country: to what extent do taste and preferences matter? Energy Policy 39, 6525–6531. doi: 10.1016/j.enpol.2011.07.054
Crutzen, P. (2016). “Geology of Mankind,” in A Pioneer on Atmospheric Chemistry and Climate Change in the Anthropocene. Cham: Springer International, 211–215. doi: 10.1007/978-3-319-27460-7_10
Daioglou, V., Ruijven, B., and Vuuren, D. (2012). Model projections for household energy use in developing countries. Energy 37, 601–615. doi: 10.1016/j.energy.2011.10.044
Dongzagla, A., and Adams, A.-M. (2022). Determinants of urban household choice of cooking fuel in Ghana: do socio-economic and demographic factors matter? Energy 256:124613. doi: 10.1016/j.energy.2022.124613
Duflo, E., Greenstone, M., and Hanna, R. (2008). Indoor air pollution, health and economic well- being. Surv. Perspect. Integr. Environ. Soc. 1, 1–9. doi: 10.5194/sapiens-1-1-2008
Farhar, B. (1998). Gender and renewable energy: policy, analysis, and market implications. Renewable Energy 15, 230–239. doi: 10.1016/S0960-1481(98)00164-5
Gould, C., and Urpelainen, J. (2020). The gendered nature of liquefied petroleum gas stove adoption and use in rural India. J. Dev. Stud. 56, 1309–1329. doi: 10.1080/00220388.2019.1657571
Hasan, S. A., and Mozumder, P. (2017). Income and energy use in Bangladesh: a household level analysis. Energy Econ. 65, 115–126. doi: 10.1016/j.eneco.2017.05.006
Heltberg, R. (2004). Fuel switching: evidence from eight developing countries. Energy Econ. 26, 869–887. doi: 10.1016/j.eneco.2004.04.018
Heltberg, R. (2005). Factors determining household fuel choice in Guatemala. Environ. Dev. Econ. 10, 337–361. doi: 10.1017/S1355770X04001858
Heltberg, R., Arndt, T. C., and Sekhar, N. U. (2000). Fuelwood consumption and forest degrada- tion: a household model for domestic energy substitution in rural India. Land Econ. 72, 213–232. doi: 10.2307/3147225
Israel, D. (2002). Fuel choice in developing countries: evidence from Bolivia. Econ. Dev. Cultural Change 50, 865–890. doi: 10.1086/342846
Joon, V., Chandra, A., and Bhattacharya, M. (2009). Household energy consumption pattern and socio-cultural dimensions associated with it: a case study of rural Haryana, India. Biomass Bioener. 33, 1509–1512. doi: 10.1016/j.biombioe.2009.07.016
Khandker, S., Barnes, D., and Samad, H. (2012). Are the energy poor also income poor? Evidence from India. Energy Policy 47, 1–12. doi: 10.1016/j.enpol.2012.02.028
Koirala, D., and Acharya, B. (2022). Households' fuel choices in the context of a decade-long load-shedding problem in Nepal. Energy Policy 162, 112795. doi: 10.1016/j.enpol.2022.112795
Leach, G. (1992). The energy transition. Energy Policy 20, 116–123. doi: 10.1016/0301-4215(92)90105-B
Mensah, J. T., and Adu, G. (2015). An empirical analysis of household energy choice in Ghana. Renew. Sust. Energ. Rev. 51, 1402–1411. doi: 10.1016/j.rser.2015.07.050
Mottaleb, K., and Rahut, D. B. (2021). Clean energy choice and use by the urban households in India: Implications for sustainable energy for all. Environm. Chall. 5, 100254. doi: 10.1016/j.envc.2021.100254
Mottaleb, K. A., Rahut, D. B., and Ali, A. (2017). An exploration into the household energy choice and expenditure in Bangladesh. Energy 135, 767–776. doi: 10.1016/j.energy.2017.06.117
Mottaleb, K. A., Rahut, D. B., Aryal, J. P., and Ali, A. (2022). Clean fuel for rural families in India a major challenge: Evidence from four rounds of consumer expenditure survey. Energy Reports 8, 2530–2546. doi: 10.1016/j.egyr.2022.01.136
Pachauri, S. (2004). An analysis of cross-sectional variations in total household energy require- ments in India using micro survey data. Energy Policy 32, 1723–1735. doi: 10.1016/S0301-4215(03)00162-9
Pachauri, S., and Jiang, L. (2008). The household energy transition in India and China. Energy Policy 36, 4022–4035. doi: 10.1016/j.enpol.2008.06.016
Pallegedara, A., Mottaleb, K. A., and Rahut, D. B. (2021). Exploring choice and expenditure on energy for domestic works by the Sri Lankan households: implications for policy. Energy 222, 119899. doi: 10.1016/j.energy.2021.119899
Pandey, V. L., and Chaubal, A. (2011). Comprehending household cooking energy choice in rural India. Biomass Bioener. 35, 4724–4731. doi: 10.1016/j.biombioe.2011.09.020
Rahut, D. B., Ali, A., and Mottaleb, K. A. (2017a). Understanding the determinants of alternate energy options for cooking in the Himalayas: empirical evidence from the Himalayan region of Pakistan. J. Cleaner Product. 149, 528–539. doi: 10.1016/j.jclepro.2017.02.111
Rahut, D. B., Behera, B., and Ali, A. (2016). Household energy choice and consumption intensity: empirical evidence from Bhutan. Renew. Susta. Energy Rev. 53, 993–1009. doi: 10.1016/j.rser.2015.09.019
Rahut, D. B., Behera, B., Ali, A., and Marenya, P. (2017b). A ladder within a ladder: understanding the factors influencing a household's domestic use of electricity in four African countries. Energy Econ. 66, 167–181. doi: 10.1016/j.eneco.2017.05.020
Rahut, D. B., Das, S., Groote, H. D., and Behera, B. (2014). Determinants of household energy use in Bhutan. Energy 69, 661–672. doi: 10.1016/j.energy.2014.03.062
Rao, M. N., and Reddy, B. S. (2007). Variations in energy use by Indian households: an analysis of micro level data. Energy 32, 143–153. doi: 10.1016/j.energy.2006.03.012
Ravindra, K., Kaur-Sidhu, M., Mor, S., and John, S. (2019). Trend in household energy consump- tion pattern in India: a case study on the influence of socio-cultural factors for the choice of clean fuel use. J. Cleaner Product. 213, 1024–1034. doi: 10.1016/j.jclepro.2018.12.092
Sharma, V., and Dash, M. (2022). Household energy use pattern in rural India: a path towards sustainable development. Environm. Chall. 6, 100404. doi: 10.1016/j.envc.2021.100404
Solaymani, S., Sohaili, K., and Yazdinejad, E. A. (2012). Adoption and use of e-commerce in SMEs. Elect. Commerce Res. 12, 249–263. doi: 10.1007/s10660-012-9096-6
Twumasi, M. A., Jiang, Y., Ameyaw, B., Danquah, F. O., and Acheampong, M. O. (2020). The impact of credit accessibility on rural households clean cooking energy consumption: the case of Ghana. Energy Reports 6, 974–983. doi: 10.1016/j.egyr.2020.04.024
Waleed, K., and Mirza, F. M. (2022). Examining fuel choice patterns through household energy transition index: an alternative to traditional energy ladder and stacking models. Environment, Dev. Sustainab. 25, 1–53. doi: 10.1007/s10668-022-02312-8
Wang, M., Liu, Z., Xu, A., and Yang, D. (2022). Fuel choice for rural Tibetan households: Impacts of access to credit. Energy Econ. 115, 106347. doi: 10.1016/j.eneco.2022.106347
Keywords: household, clean fuel choice, wealth, education, gender
Citation: Timilsina RR, Rahut DB, Gautam MS, Mishra R and Sonobe T (2023) Are households shifting toward cleaner cooking fuel? Empirical evidence from India during 2005–2021. Front. Environ. Econ. 2:1137248. doi: 10.3389/frevc.2023.1137248
Received: 04 January 2023; Accepted: 03 July 2023;
Published: 16 August 2023.
Edited by:
Hooi Hooi Lean, University of Science Malaysia (USM), MalaysiaReviewed by:
Saeed Solaymani, Arak University, IranNooshin Karimi Alavijeh, Ferdowsi University of Mashhad, Iran
Copyright © 2023 Timilsina, Rahut, Gautam, Mishra and Sonobe. This is an open-access article distributed under the terms of the Creative Commons Attribution License (CC BY). The use, distribution or reproduction in other forums is permitted, provided the original author(s) and the copyright owner(s) are credited and that the original publication in this journal is cited, in accordance with accepted academic practice. No use, distribution or reproduction is permitted which does not comply with these terms.
*Correspondence: Raja Rajendra Timilsina, cnRpbWlsc2luYUBhZGJpLm9yZw==; dGltaWxzaW5hcmFqYUBnbWFpbC5jb20=
†ORCID: Raja Rajendra Timilsina orcid.org/0000-0001-9916-4934
Dil B. Rahut orcid.org/0000-0002-7505-5271
Tetsushi Sonobe orcid.org/0000-0002-9961-9764