 Abdul-Hanan Abdallah
- Agricultural and Food Economics, University for Development Studies, Tamale, Northern Region, Ghana
Introduction: This study investigates the effect of training hours received from Large-Scale Private Investors (LSPIs) on rice yield, farm income, and food security among smallholder farmers in Ghana. With the expansion of LSPIs in agricultural service delivery, identifying the optimal intensity of extension services is key to maximizing their impact.
Methods: Using data from rice-producing households, the study applies a dose-response function (DRF) and marginal treatment effect (MTE) analysis to estimate the non-linear effects of LSPI-provided training hours on key welfare outcomes. These models allow us to explore threshold effects and heterogeneous treatment responses.
Results and discussion: Findings show that rice yields peak with 1–3 h of training, after which additional interaction yields minimal gains. Farm income increases significantly beyond 4.5 h of training, with the highest returns at 6 h. Food security improves notably after 4 h, as measured by both the Food Consumption Score (FCS) and the Household Food Insecurity Access Scale (HFIAS). Beyond these thresholds, further training produces little to no additional benefit. These results emphasize the importance of well-timed, targeted training. Policymakers and LSPI programs should align training delivery with identified optimal durations and ensure appropriate follow-up mechanisms to sustain improvements in productivity and wellbeing.
1 Introduction
The global population is on a trajectory of significant growth, projected to reach 8.5 billion by 2030, 9 billion by 2050, and a staggering 11 billion by 2100 (UN, 2024). This population boom, coupled with increasing food demand, poses a formidable challenge to global food security (Baptista et al., 2022; FAO et al., 2023)1. Agricultural development is widely recognized as a key driver of economic growth and poverty reduction (World Bank., 2024)—especially in sub-Saharan Africa, where rural livelihoods largely depend on agriculture—and therefore touted as the solution to these challenges. Unfortunately, the global agricultural sector, with its potential to enhance food production and security, is under scrutiny, facing hurdles from agri-food production systems (African Development Bank, 2024; Brooks et al., 2019; Dury et al., 2019). Research has shown that low productivity and limited access to modern agricultural inputs and resources have constrained the sector's potential to meet national food demands and improve rural incomes (Guardabascio and Ventura, 2014; Rosenbaum, 2002). These challenges remain a barrier to the agricultural sector's contribution to economic growth, food security and poverty reduction (Kim et al., 2019), prompting calls for sustainable solutions for the sector to promote food security within planetary boundaries (e.g., Annan and Dryden, 2015; Garnett et al., 2013).
In recent years, large-scale private investments (LSPIs) have emerged as a transformative force in Africa's agricultural landscape, introducing benefits such as advanced technologies, financial capital, and market access opportunities (Amanor, 2012; Behrman et al., 2014; Clapp, 2014; Mulwa et al., 2021; Sitko et al., 2018). Thus, on premise that such benefits can have positive effects on small firms (e.g., Blomström and Sjöholm, 1999; Borensztein et al., 1998; Muyanga et al., 2022), most nations promote LSPIs, particularly those involved in large-scale land acquisition, to improve smallholder livelihood (Deininger and Byerlee, 2012). Subsequently, empirical studies investigated the LSPIs in large-scale land acquisition and their impacts on smallholder livelihood (e.g., Ali et al., 2019; Deininger and Xia, 2016; Guyalo et al., 2021; Khadjavi et al., 2020; Lay et al., 2021). However, the findings from these studies have been mixed or vary from location to location. Whereas, LSPIs involved in large-scale land acquisition improve livelihoods in Mozambique (Deininger and Xia, 2016), Ethiopia (Ali et al., 2019), and Zambia (Khadjavi et al., 2020), they were found have negative or no effect in Ethiopia (Alamirew et al., 2015; Guyalo et al., 2021, 2022; Shete and Rutten, 2015) and Ghana (Abdallah, 2021; Aha and Ayitey, 2017; Hamenoo et al., 2018; Mabe et al., 2019; Nyantakyi-Frimpong and Kerr, 2016). Thus, knowledge of the exact livelihood impact of LSPIs involved in large-scale land acquisition is not clear in empirical literature. Consequently, policymakers may struggle to design clear strategies for engaging with LSPIs since the evidence on their impact is inconsistent. This may lead to cautious or reactionary policies rather than proactive, evidence-based interventions. Aside from the mixed results, these studies did not examine the level or intensity of interactions between LSPIs involved in large-scale land acquisition and smallholders that is sufficient for long-term effects, particularly in the context of yields, farm income, and food security of rice farmers.
By way of contributing to bridging the gaps raised, this study investigates the impact of LSPIs involved in large-scale land acquisition, focusing on the intensity of one potential positive spillover, namely the training provided to smallholders. More specifically, the study investigates how the numbers of hours of training from LSPIs affect rice yields, farm income and food security of Ghanian smallholder rice farmers. Thus, the unique feature of this research is the use of a continuous treatment approach, which allows for a nuanced analysis of how varying levels of interaction with LSPIs influence agricultural outcomes. Unlike traditional binary models that classify farmers merely as participants or non-participants, the continuous treatment approach captures the intensity of interaction, measured by hours engaged with LSPIs, to explore the dose-response relationship. By employing this methodology, the study can provide a detailed understanding of the optimal levels of engagement in training activities that maximize benefits and identify points where further interaction yields diminishing or even negative returns. The study primarily targets rice farmers because LSPI training in Ghana has been particularly concentrated in the rice sector, where private-sector participation is growing. Furthermore, rice is a major cash and food crop for smallholder farmers, contributing significantly to household incomes.
We focus on Ghana for several reasons. First, Ghana's extension staff to farmer ratio remains low at 1:709 compared to the 2026 target of 1:500 (MoFA, 2023) despite the importance of extension engagement for effective technology transfer to farmers (Wossen et al., 2017). Analysis of this nature is therefore crucial in understanding how the private sector compensates for the inadequate government extension support in Ghana. It will also provide policymakers and agricultural stakeholders with critical insights into how partnerships between smallholders and LSPIs can be leveraged to improve productivity and contribute to food security in Ghana and similar settings across sub-Saharan Africa. In a broader context, this study contributes to the literature on agricultural investment impacts in sub-Saharan Africa, providing empirical evidence on how LSPIs can shape the agricultural sector and rural livelihoods in Ghana.
The rest of the paper is organized as follows: the next section provides a brief overview of large-scale private investors. Section 3 presents the methodology including study area, the data information and estimation strategies employed. Section 4 presents the results and discussion, while Section 5 presents conclusions with policy implications.
2 Literature review
LSPIs include a broad spectrum of domestic and foreign banks, financial investors, agribusinesses, commodity trading firms, insurance companies, pension funds, sovereign wealth funds, and hedge funds (Amanor, 2012; Clapp, 2014; Cotula, 2012). They invest hugely in a variety of agricultural inputs and products including acquisition of land on a large scale, advanced technologies, financial capital, input and output on a large scale (Behrman et al., 2014; Clapp, 2014; Sitko et al., 2018). In this study, our focus is on LSPIs involved in large-scale land acquisition.
Although several studies examined the impact of LSPIs involvement in large-scale land acquisition on smallholder farmers in Ghana and in developing countries in general, the question of the impact of such investments remains an area of scholarly debate between two polarized views, namely, pessimists and optimists' views. The pessimists argue that LSPIs' acquisition of land on a large scale and subsequent displacement and clearing of land to make way for large-scale investments can impact negatively on the smallholder farmers, and their environment (Cotula et al., 2009; FIAN, 2017; FOE, 2010; GRAIN, 2008). In contrast, the optimists, however, emphasize the importance of such investments, suggesting that such investments could be managed to minimize potential damages and as well benefit investors, host governments, and their populations alike (De Schutter, 2009; FAO et al., 2010; von Braun and Meinzen-Dick, 2009). Consistent with these views, other studies (e.g., Santangelo, 2018)—with motivations from literature on spatial spillovers from large firms (e.g., Adenaeuer and Heckelei, 2011; Blomström and Persson, 1983; Blomström and Sjöholm, 1999; Borensztein et al., 1998; Globerman, 1979)—argued that large-scale land investments from these investors can increase learning opportunities and enhance the knowledge of neighboring farms and, as well as contribute to the transfer of technologies to small farms. Dessy et al. (2012) also developed an occupational choice model to examine the mechanisms through which large-scale land acquisition by these investors affects peasant welfare. In this model, Dessy et al. (2012) demonstrated that subsidizing input costs with proceeds from LSPIs can enhance local farmers' adoption of agricultural technologies. Based on Dessy et al.'s (2012) model, Kleemann and Thiele (2015) also developed a theoretical model to study the mechanisms through which large-scale land acquisition might affect rural populations in Sub-Saharan Africa. Again, it was revealed that LSPIs involved in large-scale land acquisition enhance households' welfare.
Following these conceptual and theoretical arguments, several empirical studies examined the effect of LSPIs involved in large-scale land acquisition (LSLA) on smallholder farmers. In Ghana, in particular, several studies examine the effect of LSPIs land acquisition on households. Aha and Ayitey (2017), for example, found that LSPIs increasing appropriation of communal lands for biofuel plantations without consultation, fair and adequate compensation to the indigenous land holders has resulted in uncertainty and tenure insecurity among farmers in affected communities. Mabe et al. (2019) also found that land acquisition by these investors has significant negative effects on the livelihood of households in Ghana. Abdallah et al. (2023) also revealed that households exposed to LSLA by LSPIs experience decrease in food security. Ayamga et al. (2023) also found that households exposed to LSLA by LSPIs are less likely to access farmland for production.
Despite these negative impacts of LSPIs, it has been argued that LSPIs involved in LSLA can enhance smallholder livelihoods. One of the many potential mechanisms through which such benefits may occur is the training provided to smallholders (Liverpool-Tasie et al., 2020, 2023). Training and capacity building have long been recognized as essential tools for enhancing smallholder productivity and economic resilience (Anderson and Feder, 2004; Mohammed and Abdulai, 2022; Mugizi, 2025; Pan et al., 2018; Ragasa et al., 2013; Santos Rocha, 2017; Wossen et al., 2017). However, the role of land investing LSPIs in training smallholders remains underexplored, particularly regarding the intensity of engagement required to generate meaningful impacts.
In Ghana, where public agricultural extension services are often insufficient (MoFA, 2023), LSPIs have become a key source of training and technical assistance (Chapoto et al., 2014). Farmers engaging with these investors report higher adoption rates of improved seeds, fertilizers, and irrigation practices (ACDI/VOCA, 2020; IWAD, 2024). A study by Chapoto et al. (2014) found that 15% of smallholder farmers directly sought farming advice from LSPIs. Despite these positive associations, the literature does not specify the intensity of training required to optimize farm outcomes, leaving a critical gap in policy-relevant research.
Although several studies—as mentioned previously—document the impact of LSPIs involved large-scale land acquisition on smallholders, there is no known study assessing the relationship between the intensity of training received from LSPIs and key outcomes such as yield, farm income, and food security. To address this gap, our study employs a continuous treatment approach to examine the effect of LSPI-provided training intensity (measured in contact hours) on smallholder farmers' yield, farm income, and food security. By identifying the optimal level of training required for maximum impact, this research will provide policymakers with actionable insights on how to structure LSPI training programs for maximum effectiveness.
3 Methodology
3.1 Study's context, data and descriptive statistics
The data for this study come from Upper West, Upper East, Northern, North East and Savannah regions of northern Ghana. These areas are noted with land-investing LSPIs including investment funds, private companies, and stock exchange listed companies, local chiefs, prosperous individuals, and foreigners (Land Matrix, 2021; Yaro et al., 2021). These investors have political connections, and thus profit from government programs, and collaborate with big businesses to sell their produce. They possess skills, machinery, and provide services and significant amount of short-term employment to inhabitants (Yaro and Wahab, 2021).
Actors including the State and Agricultural Development and Value Chain Enhancement (ADVANCE I and II) projects have been supporting the growth and linkages of these investors with smallholders to support their access to finance, inputs, equipment, information and output market (Chapoto et al., 2014). One of the crops under which growth of these investors is apparent is rice (Adzawla et al., 2021). Under rice production, LSPIs dominate in fertilizer use as about 35 percent used fertilizer compared to about 18 percent of small-scale investors (SSIs; Chapoto et al., 2014). In addition, these investors utilized more fertilizer per hectare that than SSIs in rice fields, 130.4 kg/ha compared to 99.8 kg/ha for SSIs. They also participate in rice market than SSIs, with 98 and 71 percent of the two groups selling rice (ibid.). Conservative estimates from Chapoto et al. (2014) also show higher production under LSPIs as compared to SSIs. This superiority of LSPIs in terms of fertilizer use, market, and production is expected to benefit smallholders as they emulate LSPIs in these areas.
It is within this context that this study was conducted. Specifically, we gathered data from a variety of sources for the quantitative analysis. First, a two round panel data was collected from surveys of 988 farmers exposed to MSPIs/LSPIs in the 2017/2018 and 2020/2021 cropping seasons with support from the West African Center for Sustainable Rural Transformation (WAC-SRT) and the Global Development Network (GDN). To begin with, we selected 1,000 farmers exposed to MSPIs/LSPIs through a multi-stage sampling technique. This included selection of 2 districts from each region based on medium-scale private investors (MSPIs) or LSPIs intensity of investment in land2, 2–6 communities from each district in proportion to the number of communities in a district, and a random selection of 25 farmers each from a list of farmers exposed to LSPIs and MSPIs' land investments3, resulting in 1,000 exposed farmers4. The households (as distributed in Figure 1) were then interviewed in 2017/2018 cropping seasons with a semi-structured questionnaire loaded in Kobo Toolbox5. The questionnaire, administered by trained enumerators, gathered information on household characteristics, exposure to MSPIs/LSPIs, inputs including fertilizer, seeds, labor, sustainable agricultural practices, crop yields, food consumption, biodiversity, ecosystem services, and their management practices. In the second round (i.e., 2020/2021) of the survey, we observed 1.2 percent attrition rate as only 988 farmers were reinterviewed. This led to a balanced panel of 988 farmers (i.e., 1,976 observations) for the analysis. Although this was attributed to death and migration, attrition bias could be a concern. Following Baulch and Quisumbing (2011), we conducted non-randomness of attrition and conclude that the attrition is random. It is, however, important to mention even though not all surveyed farmers exclusively cultivated rice, rice farming was a significant component of their agricultural production systems, particularly for those who received training from LSPI programs. It is also important to mention that rice farming fits within broader farm income sources in several keyways. First, it serves as a staple food crop and a commercial commodity, contributing directly to household food security while also generating income through market sales. Second, many smallholder farmers practice mixed farming, where rice is cultivated alongside other staple crops such as maize, cassava, and legumes, providing income diversification and risk mitigation against crop failure. Third, access to LSPI training may encourage farmers to specialize in rice production by adopting improved agronomic techniques, enhanced seed varieties, and better post-harvest management, which can lead to higher yields and profitability.
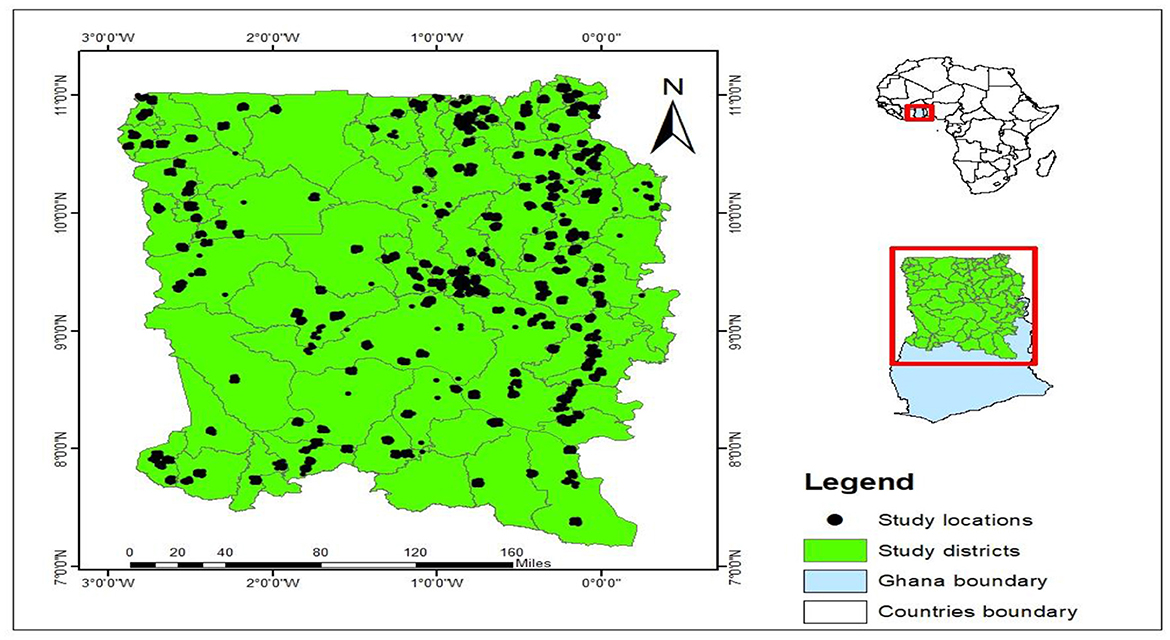
Figure 1. Study area map showing the study household locations. Source: author, 2022.
Given these dynamics, our study focuses on rice yields, farm income, and food security as key outcome variables, recognizing that rice farming, while central to many smallholders, is often complemented by other agricultural income streams. This context is essential for interpreting the impact of LSPI training on farmer livelihoods, as the benefits of rice-related interventions may extend beyond rice cultivation itself.
3.1.1 Variable construction
3.1.1.1 Variables measuring levels or intensity of interaction
For the levels or intensity of smallholder interactions with LSPIs, we observed the number of times smallholders received training from LSPIs. However, in terms of number of times smallholders received training from LSPIs, the variations were not wide between farmers and thus, implies that teasing out heterogeneous effects along this dimension may not be possible. As a result, we rather employed number of hours of interactions with LSPIs per week. Thus, levels or intensity of smallholder interactions with LSPIs is captured as the number of hours of training received from LSPIs by a smallholder rice farmer in a week.
3.1.1.2 Outcome variables
As stated earlier, yields, farm income and food security are the outcomes of interest in this study. Yield of rice is constructed as total kilogram of rice harvested at the household level divided by the household sum of individual-level hectares of land devoted to rice cultivation. For farm income, household level farm earnings were divided by the household sum of individual-level hectares of land devoted to farm activities. Household level farm earnings entail value of total crop and livestock produced 6. We calculated each by aggregating the values of all crops produced and all animals produced into a single measure using the output and prices provided by the households7. Such approach has been used by Abdallah et al. (2020) in sub-Saharan Africa. Farm income depends on output and prices. We therefore assumed that LSPIs influences farm income through the quantity of output produced or their prices.
Given that food security is multidimensional issue, we employed two indicators namely, food consumption score (FCS) and household food insecurity access score (HFIAS). Thus, the effect of LSPIs on food security is estimated through these indicators. The first indicator, HFIAS, is households' perception of quantity and quality components of their diet in the past 30 days. It is a continuous variable that measures food security in terms of access. The HFIAS assumes that households' experiences of food insecurity cause predictable reactions which can be captured and quantified into a score. This score indicates frequency of consumption of less preferred foods to skipping of meals (Coates et al., 2007). It is captured by aggregating the product of responses to nine questions on occurrence and frequency of occurrence of food insecurity situation. The nine questions focused on experience of food insecurity in 2017/2018 cropping season and reflects (Q1a) anxiety about food adequacy; (Q2a) eating less-preferred foods; (Q3a) eating foods of a limited variety; (Q4a) inability to eat less-preferred foods; (Q5a) eating smaller meals than needed; (Q6a) eating fewer meals in a day; (Q7a) failing to obtain food of any kind; (Q8a) going to bed hungry; and (Q9a) going the whole day or night without eating. A ‘yes' response to any of these questions is given a value of one and a ‘no' response is given a value of zero. A question on frequency-of-occurrence (F) then followed each severity question. These questions asked how often a reported condition occurred during the previous 30 days with 1, 2 and 3 representing ‘rarely' ‘sometimes' and often, respectively. Using these responses, the HFIAS is then calculated by summing the scores generated from the responses as follows:
Summarily, the minimum HFIAS is zero and is obtained when a household is food secure and responds ‘no' to occurrence and frequency of occurrence. A HFIAS value above zero means that some level of food insecurity exists for the household. The highest score is 27, which is obtained when a household is food secure and responds in the affirmative to all the questions on occurrence and ‘often' to questions concerning rate of occurrence. Our second indicator of food security, is food consumption score (FCS), which represents the dietary diversity, energy, macro, and micro value of the food consumed (WFP, 2009). The FCS is a continuous variable measured by first recording frequency or the number of food groups consumed by an individual within a household over a reference period, usually a 7-day period. The food groups are nine in number according to WFP (2009) and include: (i) Cereals and tubers; (ii) Pulses; (iii) Vegetables, relish and leaves; (iv) Fruits (v) Meat, fish and eggs; (vi) Milk and other dairy products; (vii) Sugar and sugar products, and honey (viii) Oils, fats and butter; and (ix) Condiments. The frequency of consumption of each food group A by household i, is then multiplied by a predetermined weight B, assigned to each food group to generate a score defined mathematically as:
3.1.1.3 Control variables
Based on literature (e.g., Guyalo et al., 2021, 2022; Liverpool-Tasie et al., 2023), variables representing household and farm/plot characteristics were captured during the household survey to be used as control variables in the analysis. Further, the household survey data captured the geographic information systems coordinates of each household. This made it possible to complement the control variables in the survey data with geospatial data on population density and built-up area data with a spatial resolution of 250 meters grid from the sixth version of Global Rural-Urban Mapping (GRUMPv1)8; precipitation and temperature data of 2.5 min resolution from the WorldClim9; elevation data from Shuttle Radar Topography Mission, and vegetation index with a spatial resolution of 30 meters from Landsat 8 of the NASA/USGS10 Specifically, the raster files existing in Tag Image File Format (TIFF) were downloaded, mosaic, and/or clipped to our area shapefiles using QGIS 3.28.3 or ArcGIS 10.8.2. Except few, all the images were already projected to EPSG: 4,326-WGS 84. Thus, there was no geometric correction required as the study area falls under this coordinate system. The cell values of a raster files were extracted to the point location of the households for analysis. To generate the population density, we used estimates of the population from GRUMP with the estimates of arable land from Global Agro-Ecological Zones v4 (Fischer et al., 2021). Thus, the population density variable is persons per 250 square meters of grid cell. Input and output prices are important so far as estimation of farm income is concerned. We therefore draw from the Africa fertilizer11, the district level prices of NPK fertilizer. For prices of rice, we interpolated district level prices from the Humanitarian Data Exchange (HDX) using the Inverse Distance Weighting (IDW)12 Conflicts can disrupt the normal operations of large-scale private investors, leading to interruptions in production, distribution, and supply chains. This can result in financial losses and undermine investor confidence in conflict-affected areas. We constructed conflict intensity via IDW interpolation of the number of deaths from the Georeferenced Event Dataset (Global version 23.1) of the Uppsala Conflict Data Program (UCDP) which offers several datasets on organized violence13 We present the description/measurement for each variable and their descriptive statistics in Table 1.
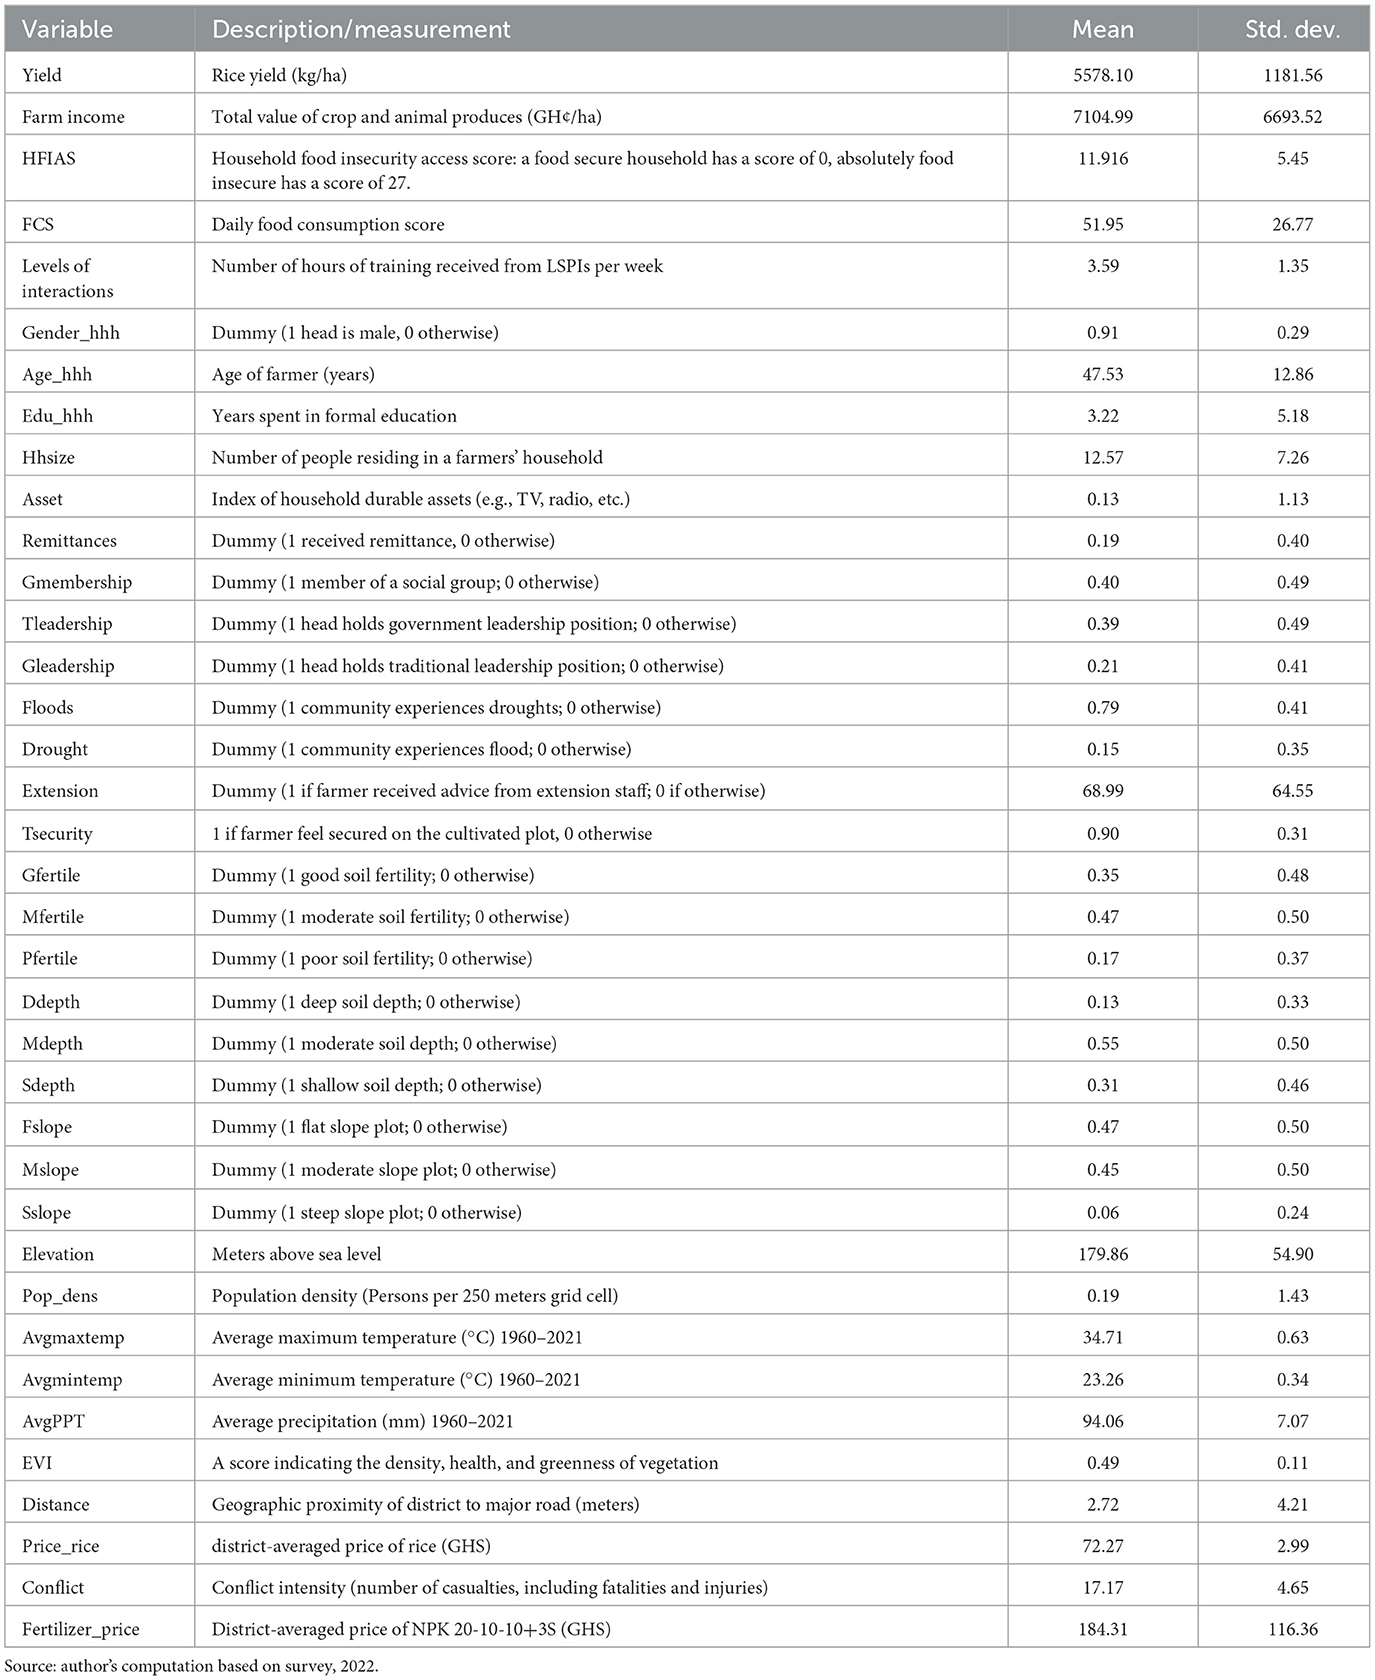
Table 1. Variable definition/measurement and summary statistics.
3.2 Estimating the incremental impacts of LSPIs on yields, farm income and food security
To estimate the incremental impacts of the smallholder interactions with LSPIs, we employed as our treatment, the number of hours of training received from LSPIs per week. This allows estimation of the incremental impacts of LSPIs using the dose-response function. Even though the approach of (Bia and Mattei, 2012) is also efficient in estimating the dose-response function (DRF), we opted for a more flexible approach proposed by Guardabascio and Ventura (2014). Unlike the approach of (Bia and Mattei, 2012) which is limited to only normal distributions, this approach accommodates other distributions (e.g., binomial, gamma, inverse Gaussian, negative binomial, normal, and Poisson functional distributions) from the exponential family to help estimate the DRF. Though this method also relies on the conditional independence assumption (Bia and Mattei, 2012), the inclusion of a rich set of data or pretreatment covariates that directly influences both outcome and treatment can help mitigate possible selection bias. To this end, efforts were made to ensure that all unknowns which are likely to influence both outcome and treatment are captured in the dataset. For instance, before the two round surveys, the team conducted 60 key informant interviews to provide in-depth information on the context studied and as well identify elements for the development of instruments for the quantitative household surveys. The key informants included farmer leaders, chiefs, and elders; government officials including officials from Ghana's Ministry of Food and Agriculture, Land Commission, local government, Ghana Commercial Agriculture Project, Northern Rural Growth Project and Savannah Accelerated Development, Irrigation Company of Upper Region, Ghana Irrigation Development Authority, and large-scale private investors in land. Based on the workshops' outcome, variables such as farmer status in the community, experience of drought, and floods, temperature, rainfall, district's geographic proximity, conflicts, were captured in the household survey data for analysis (see Table 1).
Assuming N constitute farmers that are randomly selected from a large population, such that i = 1, 2, 3, ..., N. Each farmer has: p×1 a vector of pretreatment covariates, Xi exposed to training Ti, and has Yi as the yields, farm income and food security associated with hours of training received, then the set of potential outcomes will be defined as {Yi(t)} for t ϵ T, where T represents the continuous set of potential treatments defined over the interval [t0, t1], and Yi(t) is the household rice yield, farm income and food security associated with hours of training received ti. Further, we define the outcome corresponding to the hours of training received as Yi = Yi(T)i. To estimate the average dose-response function μ(t) = E{Yi(t)} (Hirano and Imbens, 2004) assume that if {Yi(t)}tϵT, Ti and Xi, are defined on a common probability space, then the propensity function is defined as the conditional density of the actual hours of training received given the observed covariates. In other words, if r(t, x) = fT|X(t|x) is the conditional density function of the hours of training received given the covariates, then the generalized propensity score (GPS) is R = r(T|X). It is important to note that the GPS is an extension of the traditional propensity score method used for binary treatments. It is particularly useful when treatment intensity varies continuously rather than being assigned as a simple treated/non-treated condition. In this study, GPS estimates the likelihood that a farmer receives a specific level of training hours from Large-Scale Private Investors (LSPIs), given observed characteristics such as farm size, education, access to credit, and prior exposure to extension services.
Mathematically, GPS is computed as the conditional probability density of receiving a specific treatment level T, given a set of observed covariates X (i.e., R = r(T|X) ); where T represents the hours of training received, and X includes farm, household, and institutional characteristics. This score helps to adjust for selection bias by ensuring that comparisons are made between farmers with similar probabilities of receiving a given treatment level. To make the analysis more interpretable, the continuous treatment levels (training hours) are divided into three intervals based on empirical distribution and practical relevance: low treatment (0–1 h per week)—farmers who received minimal training from LSPIs; medium treatment (2–3 h per week)—farmers who received moderate exposure to LSPI training programs; and high treatment (4+ h per week)—farmers who were extensively trained by LSPIs involved in large-scale acquisition. These treatment groups allow for an examination of the dose-response relationship—whether increased exposure to LSPI training has a linear, diminishing, or threshold effect on rice yields, farm income, and food security. The classification into three intervals ensures that the results are easily interpretable for policymakers and practitioners, highlighting the optimal levels of engagement for maximum benefit (Cattaneo et al., 2013).
Further, the GPS has a balancing property like that of the standard propensity score. This implies that within strata with the same value of r(t, X), the probability that T = t does not depend on the value of X. Therefore, the GPS is X⊥1(T = t)|r(t, x) . This balancing property along with unconfoundedness, implies that hours of training received is unconfounded given the GPS. If the weak confoundedness assumption holds given the pretreatment variables X, we have Y(t)⊥T|X∀tϵT and for every value of hours of training received, t, we have fr{t|r(t, X), Y(t)} = fr{t|r(t, X)}. The GPS then eliminates any bias associated with differences in the covariates and the dose-response function is obtained as:
In summary, the methodology above indicates that we can estimate the impact of the levels or intensity of interaction (i.e., number of hours of training received from LSPIs) on fertilizer use in three steps. In the first step, the covariates are employed to estimate the parameters of the conditional distribution of the treatment (number of hours of training received from LSPIs) under a Negative binomial distribution, assess the normality of the distribution of disturbances in the model, estimate the GPS, r(t, x) and test balancing property with standard two-sided t-test which is the default. In the second step, the average yield, farm income and food security are estimated as functions of the number of hours of training received from LSPIs (treatment level T), the GPS R, as E(Y|T = t, R = r). In this study, we employed quadratic approximation. In the final step, the relationship between yield, farm income, food security and the number of hours of training received from LSPIs (dose-response function) μ(t) = E[{t, r(t, X)}], t∈T is estimated by averaging the estimated conditional expectation {t, r(t, X)} over the GPS at each level of treatment (i.e., number of hours of training received from LSPIs).
4 Results and discussion
This section presents the econometric results of the effects of number of hours of training received from LSPIs on rice yield, farm income and food security. Section 4.1 presents the effects of number of hours of training received from LSPIs on yields; Section 4.2 presents the results of the effect of number of hours of training received from LSPIs on farm income; and Section 4.3 presents the effects of number of hours of training received from LSPIs on food security. As mentioned previously, the DRF procedure involves estimation of propensity scores, testing for balance of covariates, estimation of the generalized propensity scores, the conditional expectations of the rice yield, farm income and food security as functions of the number of hours of training received from LSPIs and the generalized propensity scores, and the effect of number of hours of hours of training received from LSPIs on yields, farm income and food security (dose-response function). In this section, the estimate of the generalized propensity scores is only presented as appendix (Table A1) and not discussed since it is not the main purpose of this study. But most of the variables are good predictors of levels or intensity of interactions and probably met the unconfoundedness assumption. Another issue is the assessing the degree to which covariates are balanced by conditioning on the estimated GPS. The results are presented in Table 2. The absolute t-values are in the range (0.01–1.48) except for the case of the dummy for soil depth in the central interval.
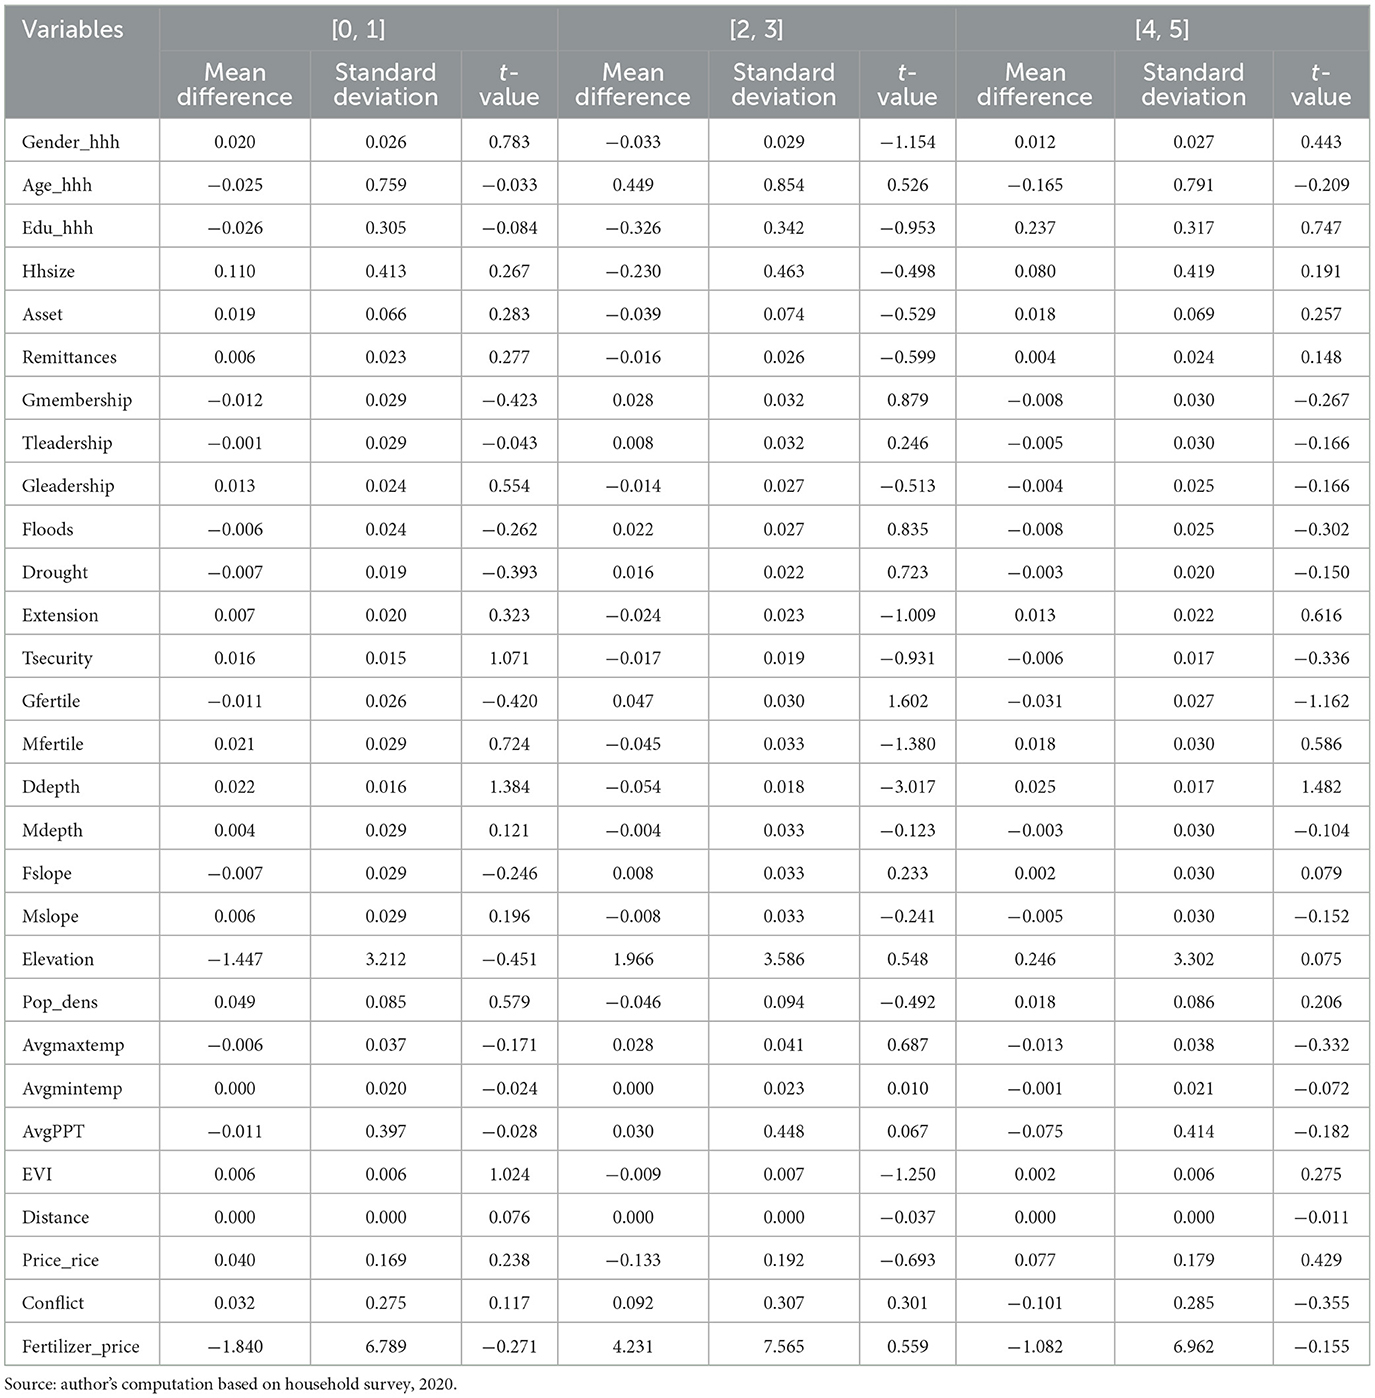
Table 2. Covariate balancing for generalized propensity score matching.
Summarily, the treatment values were divided into 3 intervals [(0, 1), (2, 3), and (4, 5)], each with a representative point where the generalized propensity scores were evaluated and divided into 5 intervals. On average, the generalized propensity score is 0.17–0.22, 0.10–0.11, and 0.04–0.06 with means of 0.20, 0.10 and 0.06, respectively at the representative point of first [0, 1], second [2, 3] and third [4, 5] treatment intervals. These scores were employed to examine if there are any differences in the conditional mean of the pre-treatment variables between units that belong to a specific treatment interval and units that belong to all other treatment intervals, given the generalized propensity score. The results showed absolute t-values in the ranges of 0.01 to 3.02, suggesting decisive evidence against the balancing property and achievement of common support condition. The other issue is the estimation of the conditional expectation of yields, farm income and food security as a function of the GPS, number of hours of training received from LSPIs, their square terms and interactions. As pointed out by Hirano and Imbens (2004), the estimated regression coefficients do not have any direct meaning and are therefore not presented here, but are available upon request. Finally, the DRF and marginal effect of the number of hours of training received from LSPIs on yields, farm income and food security are presented in the next sections.
4.1 Impacts of Incremental interaction with LSPIs on Yield
Figure 2 focuses on the relationship between the number of hours farmers interact with large-scale private investors and their rice yields. The dose-response function visually represents how rice yields respond to different interaction levels, measured in hours of engagement. Both the dose-response curve and marginal dose-response curve help to pinpoint the optimal number of interaction hours that maximizes yields for farmers. The Dose-Response Curve (i.e. Left Panel of Figure 2) represents the average farm income as a function of interaction hours (between 0 and 5 h) with LSPIs. At the lower end of the interaction spectrum (0 to 1 h), rice yields experience a moderate decrease from 399.5 to 399 kg/ha. This suggests that minimal interaction with investors yield negative effects on yields, likely due to low to no access to resources or information provided during initial interactions. Above 1 h of interaction, however, the curve shows a more significant increase in yield, reaching its peak which is 470 kg/ha at 3 h, indicating that during this period, yield increases at a faster rate and finally reaches its maximum at 470 kg/ha and 3 h as the optimal level of interaction. This phase suggests that additional interactions with investors during these hours are particularly beneficial, as farmers gain deeper insights or receive more substantial support. But beyond this hour, the curve declines, indicating that further interaction does not contribute to any meaningful increase in rice yields and even detract from it if the time spent on interactions becomes excessive. We illustrate this finding clearly considering causal effect at one point relative to another. For instance, 1 h of training received from LSPIs leads to an average rice yield of 399 kg/ha, and 2 h of training leads to average rice yield of 450 kg/ha. This implies that the average causal effect of receiving 2 h training from LSPIs relative to receiving 1 h training from LSPIs is 450–399 = 51 kg/ha increase in rice yield. This is depicted by marginal dose-response curve on the right panel of Figure 2 which illustrates the marginal effect of additional interaction hours on rice yields. In the initial phase (0 to 1 h), the marginal gains are more substantial, as indicated by the steeper slope. During this phase, each additional time of interaction leads to a more significant increase in yields, likely because farmers are in the process of applying more of the resources or knowledge they have gained. Above 1 h, however, the marginal effect approaches zero, indicating that additional interaction hours beyond this point offer little to no improvement in yield. This confirms that the optimal number of interaction hours lies at or just before 1 h, where the marginal gains stop. Thus, generally, training hours received from LSPIs increases rice yields in the area. This contradict with the study of Liverpool-Tasie et al. (2023) in Nigeria where which receiving training from relatively large farms was found to be positive and insignificantly related yields.
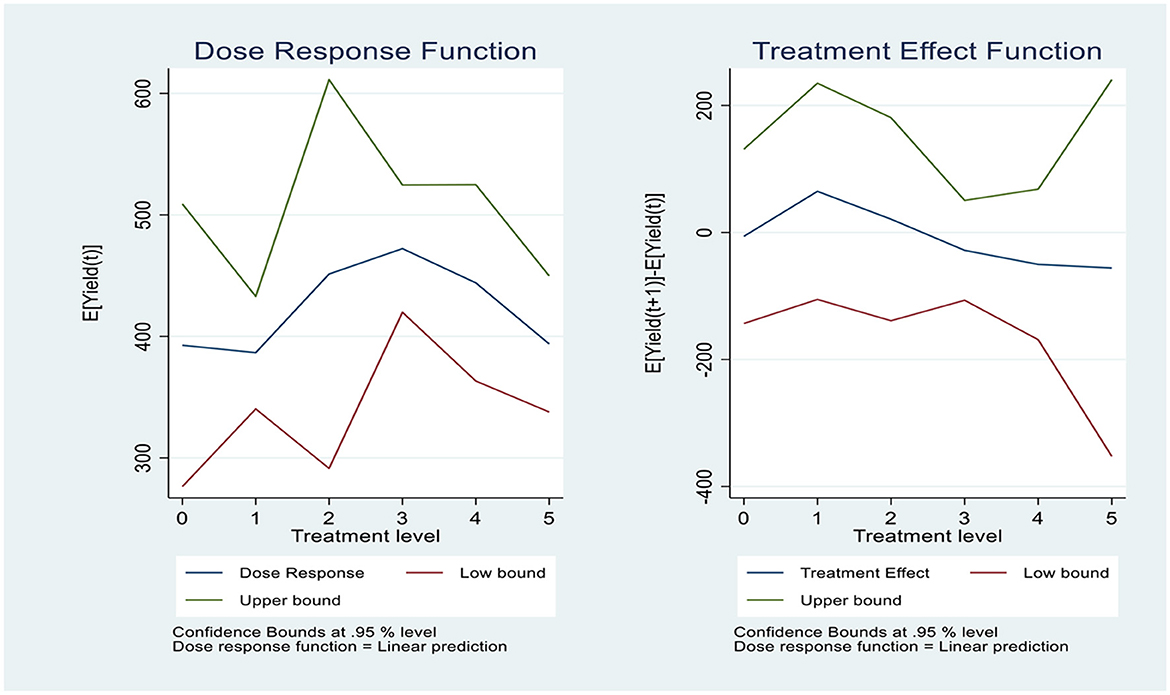
Figure 2. Dose response and marginal treatment effects function for yield. Source: author's computation based on survey, 2022.
Thus, for the dose-response (average treatment) function, the optimal level of interaction with large-scale private investors lies at 1 to 3 h. During this period, farmers maximize their income gains, with the most substantial improvements occurring between 3 h. But for marginal treatment effects function for yield, optimal level of interactions lies at 1 h; beyond 1-h, further interaction provides minimal or no economic benefit, marginal dose-response curve indicates a declining trend. Therefore, the recommended interaction time for farmers to maximize their yield is 1 to 3 h.
4.2 Impacts of Incremental interaction with LSPIs on farm income
Figure 3 shows the overall relationship between the number of hours of interaction with large-scale private investors and the average farm income. The DRF curve (left panel of Figure 3) represents how farm income changes with varying “doses” or levels of training hours received. There appear to be a U-shape relationship between levels of training hours received and average farm income, implying that initial and very high levels of training are associated with higher farm income, whereas moderate levels of training correlate with lower income. For instance, as training hours initially increase from zero, small increase is observed in farm income (about GH¢2,500 to GH¢3,500) up to a certain point (about 4.5 h). This might be because early training hours could distract from productive farm time or involve a learning curve where farmers experience temporary income dips while adjusting to new techniques. However, after to 4.5 h of training, a sharp increase is observed in income, suggesting that the benefits of training only become significant at higher levels of exposure—after 4.5 h of training, which represents minimum point of the DRF (bottom of the U-shape) and marks the level of training at which farm income transitions from low to high. For instance, average farm income is about GH¢3,500 at 4.5 hours of training and GH¢6,000 at 6 h of training received from LSPIs, and thus indicates that average causal effect of 6 h of training relative to 4.5 h of training is 6,000–3,500 = 2,500 Ghana cedis (GH¢). This is plausible since farmers may have acquired enough knowledge and skills to see tangible improvements in farm productivity or profitability. The DRF's upward trend confirms that training positively impacts farm income overall, likely by improving farm management skills, technology use, or efficiency. This relationship is clearly shown by the U-shaped MTE on the right panel of Figure 3 which indicates that the marginal benefits (additional income from each hour of training) initially decline with each additional hour of training, until 2.5 h of training, and then increase again at higher levels of training—after 2.5 h of training. This could indicate inefficiency or adjustment costs early on, where initial training hours may not immediately translate to income gains, and the benefits only become evident at advanced stages of training. After reaching a minimum, each additional hour contributes increasingly to income, as farmers may now fully understand and implement the training content. The optimal number of training hours for maximum income correspond to 2.5 h where farm income starts to increase. This finding is similar to the findings of Liverpool-Tasie et al. (2023) who revealed that receiving training from large firms increases crop income.
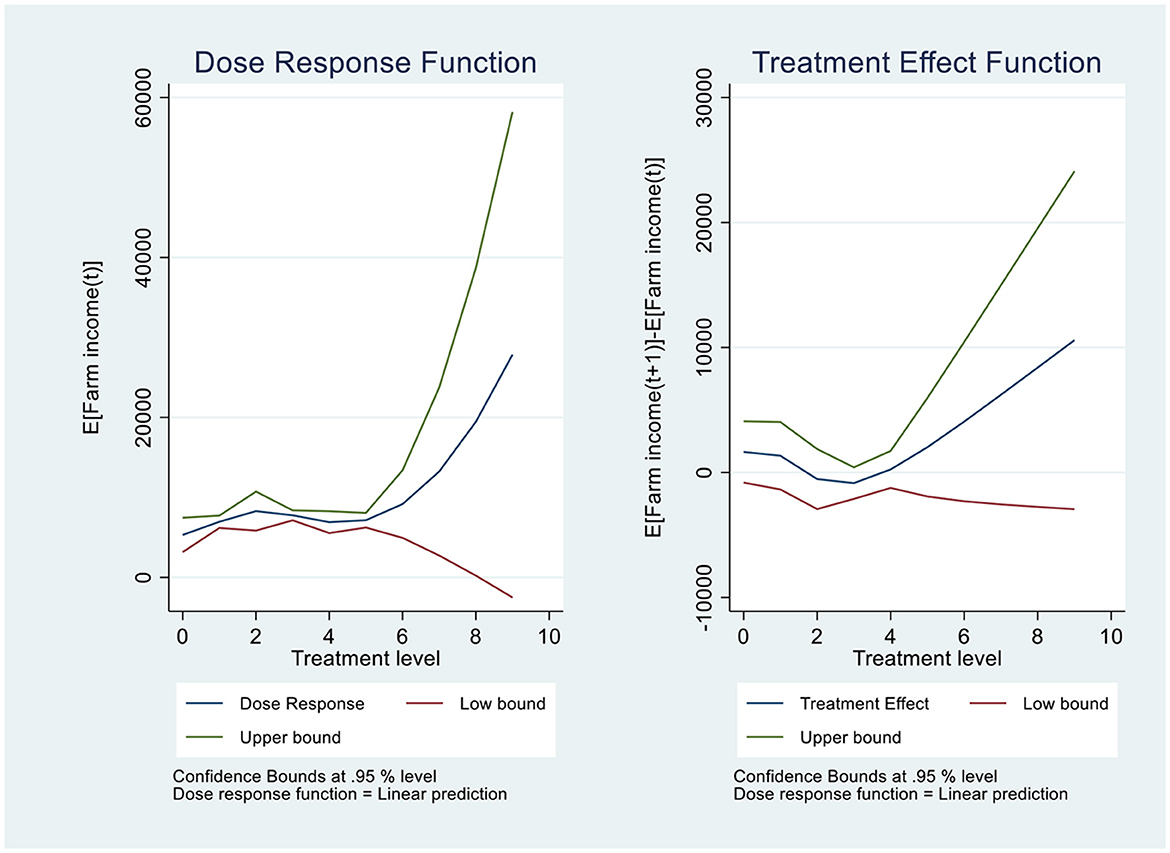
Figure 3. Dose response and marginal treatment effect function farm income. Source: author's computation based on survey, 2022.
4.3 Impacts of Incremental interaction with LSPIs on food security
Figures 4, 5 show the overall relationship between the number of hours of interaction with large-scale private investors and the average FCS and HFIAS. The DRF curve (left panel of Figure 4) represents how food consumption score (FCS) changes with varying “doses” or levels of training hours received. A U-shape relationship between levels of training hours received and average FCS, implying that initial and very high levels of training are associated with higher average FCS, whereas moderate levels of training correlate with lower average FCS. Initially, as training hours increase from zero, small increase is observed in FCS (about 2 to 4 points increase in average FCS) up to about 4.5 h. This might be because early training hours could involve a learning curve where farmers experience temporary FCS dips while adjusting to new techniques. However, after to 4.5 h of training, a sharp increase is observed in FCS, suggesting that the benefits of training only become significant at higher levels of exposure—after 4.5 h of training, which represents minimum point of the DRF (bottom of the U-shape) and marks the level of training at which FCS transitions from low to high. For instance, 4.5 h of training received leads to average FCS of about 4 points, and 9 h of training leads to average FCS of 20 points. This implies that the average causal effect of 9 h of training relative to 4.5 h of training is 20-4 =16 points increase in FCS. Thus, increasing the training hours from 4.5 to 9 h quadruples average gain in FCS. Here, farmers may have acquired enough knowledge and skills to improve food security as reflected in FCS. The DRF's upward trend confirms that training positively impacts FCS, likely by improving yields and farm income. This relationship is clearly shown by the U-shaped marginal treatment effect curve on the right panel of Figure 3 which indicates that the marginal benefits (additional FCS from each hour of training) initially decline with each additional hour of training, until 2.5 h of training, and then increase again at higher levels of training—after 2.5 h of training. This could indicate inefficiency or adjustment costs early on, where initial training hours may not immediately translate to gains in FCS, and only become evident at advanced stages of training. After reaching a minimum, each additional hour contributes increasingly to FCS, as farmers may now fully understand and implement the training content. The optimal number of training hours for maximum FCS correspond to 2.5 h where FCS starts to increase.
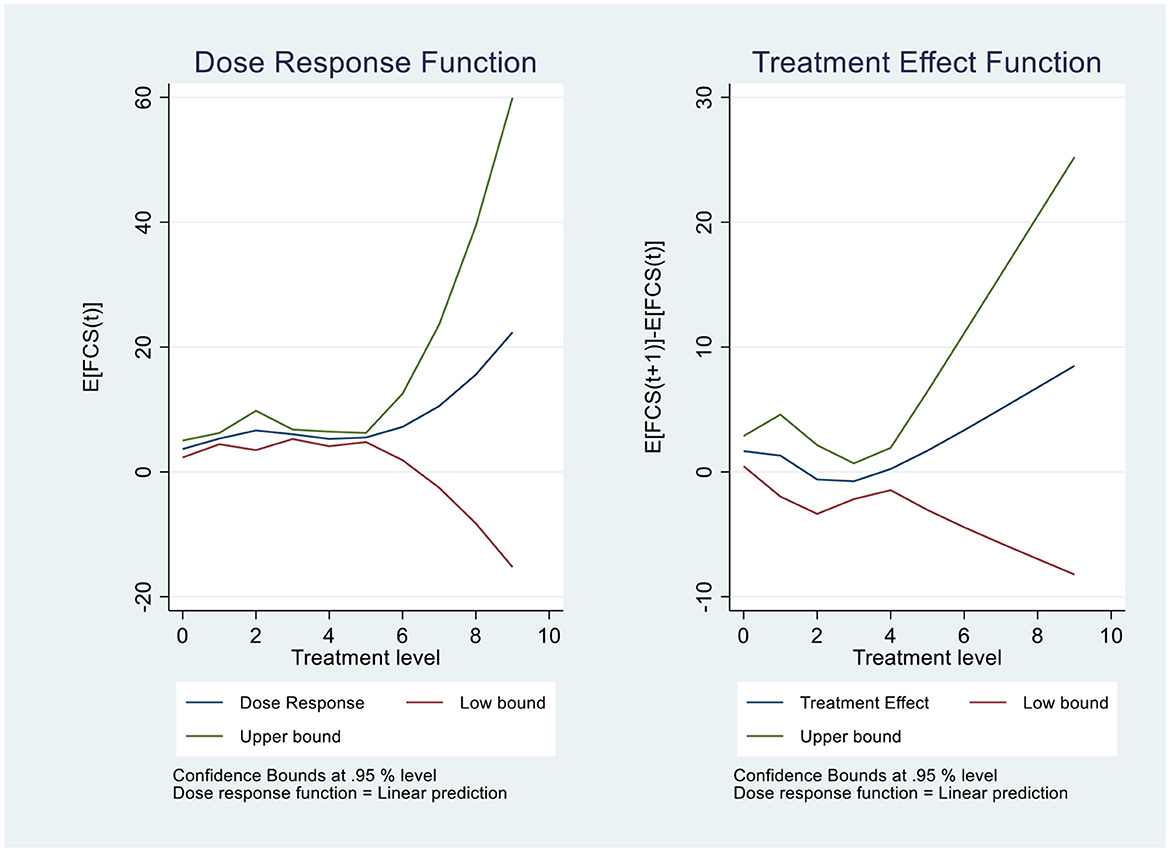
Figure 4. Dose response and marginal treatment effect function for FCS. Source: author's computation based on survey, 2022.
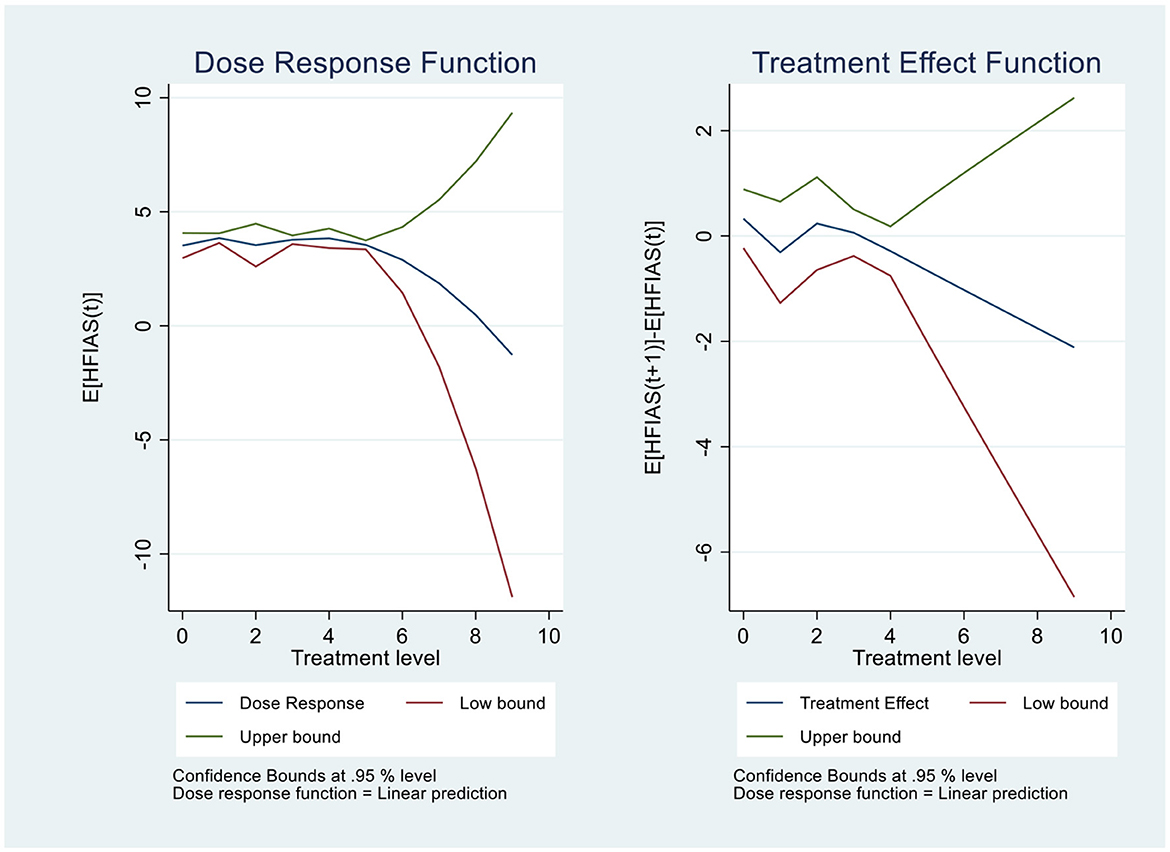
Figure 5. Dose response and marginal treatment effect function for HFIAS. Source: author's computation based on survey, 2022.
For DRF curve of HFIAS (left panel of Figure 5), shows a downward slope. This shows that as training hours increase, HFIAS decreases, indicating an improvement in food security (since lower HFIAS scores mean less food insecurity. At the lower levels of training hours received (0 to 4 h of training from LSPIs), HFIAS appear unstable and start to decrease after 4 h of training, which represents optimal hours of training for increasing FCS. This point represents the most effective training dosage for improving food security, balancing between too few and excessive training hours. This suggests that initial hours of training may be ineffective, but high hours of training may be more effective. For instance, the DRF curve at 10 h of training shows an HFIAS score reduction of 2 points, and at 6 h, it shows a reduction of 3.5 points. The causal effect of increasing training from 6 to 10 h would be an additional 4-point reduction in HFIAS. The marginal treatment effect curve (left panel of Figure 5) clearly depicts the effects of training hours received on HFIAS. At the early hours of the training (0 to 2 h), HFIAS is unstable and then start to decrease after 2 h of training received which represent the optimal hours for which HFIAS begin to fall. For instance, at the 2-hour mark, adding an extra hour of training is associated with a −0.2-point reduction in HFIAS, improving food security slightly for each additional hour. However, at 10 h the MTE is −2.1, suggesting that adding training beyond 10 h may have further benefits and could even increase food security.
4.4 Sensitivity analysis: Rosenbaum Bounds for hidden bias
To assess the robustness of our findings to potential unobserved confounding, we conducted a Rosenbaum Bounds Sensitivity Analysis. This approach evaluates how strongly an unmeasured confounder would need to influence both treatment assignment and outcomes to nullify the estimated effects. The key parameter, Gamma (Γ), represents the level of hidden bias, where Γ = 1.0 assumes no hidden bias, and increasing values of Γ indicate progressively stronger unobserved confounding. Tables 3–6 presents the results of the Rosenbaum Bounds analysis for the impact of training on yields, farm income and food security as measured by FCS and HFIAS. At Γ = 1.0 (no hidden bias), the estimated treatment effect ranges from 225 to 1,500 kg/ha for yields, with a confidence interval of [0.5, 2,000]. As Γ increases, the yields decline slightly but remains substantial; even at Γ = 2.0, the estimate remains between 700 kg/ha and 700 k/ha, with a confidence interval of [500, 900].
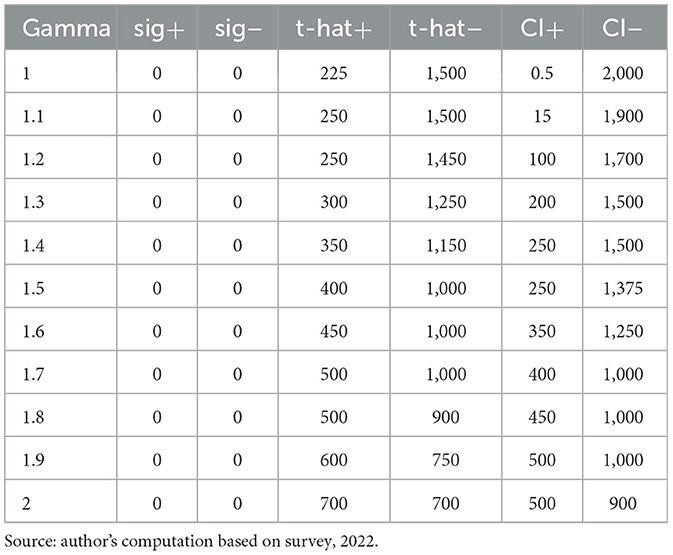
Table 3. Rosenbaum bounds sensitivity analysis (yields).
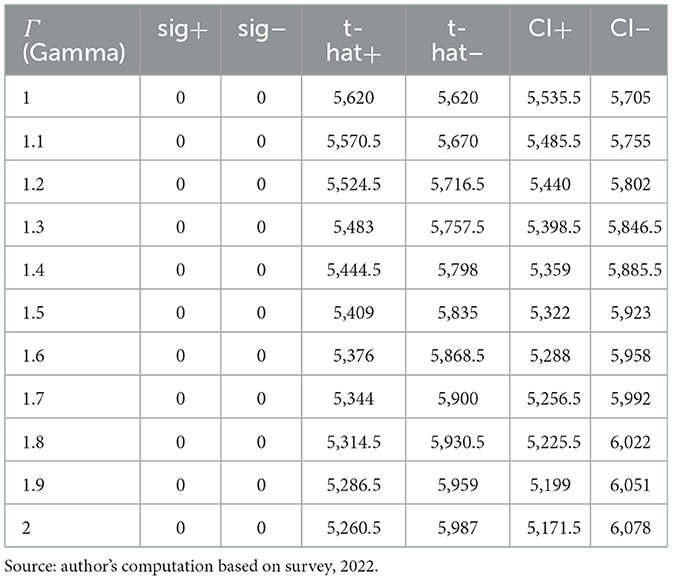
Table 4. Rosenbaum bounds sensitivity analysis (farm income).
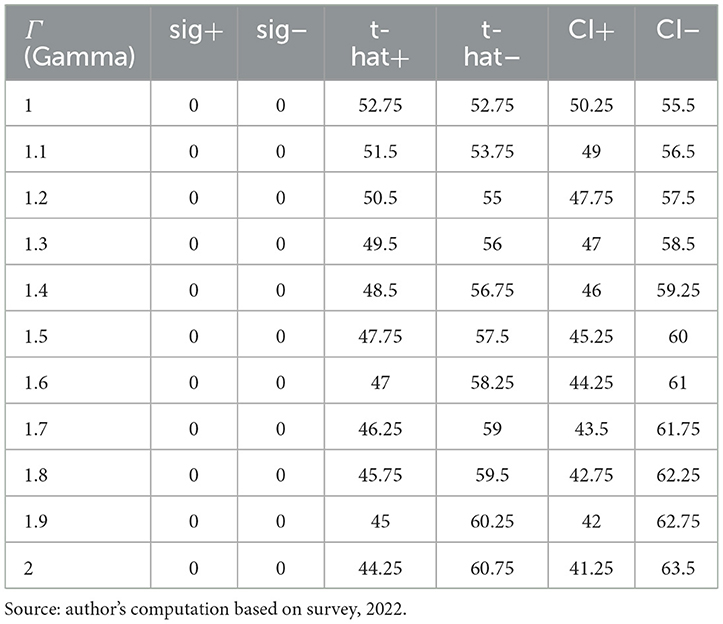
Table 5. Rosenbaum bounds sensitivity analysis (FCS).
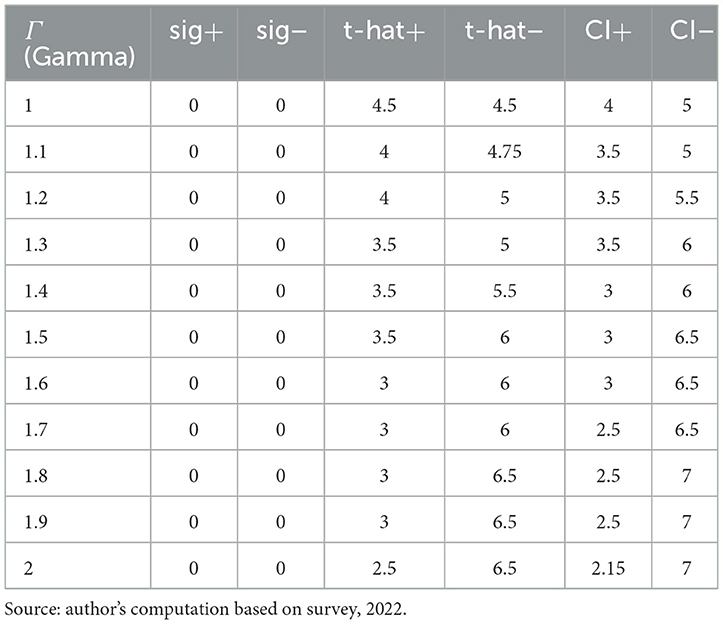
Table 6. Rosenbaum bounds sensitivity analysis (HFIAS).
For farm income, the estimated treatment effect is GH¢ 5,620, with a confidence interval of [5535.5, 5,705] as shown in Table 4. As Γ increases, the treatment effect declines slightly but remains substantial. Even at Γ = 2.0, the estimate is GH¢5,260.5, with a confidence interval of [5171.5, 6,078].
Concerning food security indicators, Tables 5, 6 present the results of the Rosenbaum Bounds analysis. In Table X, at Γ = 1.0 (no hidden bias), the estimated treatment effect is 52.75, with a confidence interval of [50.25, 55.5]. As Γ increases, the estimated effect declines slightly but remains statistically significant. Even at Γ = 2.0, the estimated effect is 44.25, with a confidence interval of [41.25, 63.5].
Similarly, in Table 6, at Γ = 1.0, the estimated treatment effect is 4.5 points for HFIAS, with a confidence interval of [4, 5]. At Γ = 2.0, the estimate decreases slightly to 2.5–6.5 points for HFIAS, but it remains statistically significant. Importantly, Sig+ and Sig- remain 0 across all tested levels of Γ for yields, farm income and food security indicators. These imply that the number of hours of engagement with LSPIs remains statistically significant for yields, farm income and food security despite increasing levels of potential hidden bias. This also indicates that an extremely strong unobserved confounder would be required to nullify the findings. Since the estimated effect remains meaningful and statistically significant up to Γ = 2.0, we conclude that our estimates are highly robust to unobserved confounding. These results reinforce the credibility of our findings, suggesting that Large-Scale Private Investor (LSPI) interventions significantly impact yield, farm income, and food security, even when accounting for potential hidden bias.
5 Conclusions and policy recommendations
This study demonstrates that training hours received from Large-Scale Private Investors (LSPIs) have a significant impact on rice yields, farm income, and food security, with optimal outcomes linked to specific engagement thresholds. For rice yields, maximum benefits occur with 1 to 3 h of interaction, beyond which additional time provides diminishing returns. Farm income displays a U-shaped response, with notable income gains beginning around 4.5 h and peaking at 6 h, likely as farmers become adept at implementing training content. Food security, measured through both the Food Consumption Score (FCS) and the Household Food Insecurity Access Scale (HFIAS), improves markedly after 4 h, with sustained gains at higher levels of training.
Farmers are advised to engage with LSPIs for an optimal period of 1 to 3 h to maximize yield gains. Policy frameworks should encourage this range of interaction, allowing farmers to gain the maximum benefit without over-committing time that could otherwise be dedicated to on-farm activities. To enhance farm income, LSPIs should focus on providing comprehensive training programs that extend beyond the initial phase (up to 4.5 h) to reach the advanced training level of around 6 h. Support for ongoing training beyond introductory sessions could ensure that farmers can translate knowledge into income growth effectively. Training programs should aim for an optimal duration of 4 to 9 h to effectively enhance food security among rice farmers. For future training initiatives, LSPIs should consider structured, extended programs that address critical aspects of food security through phased learning to ensure farmers fully integrate the skills into their food security practices. Policymakers and LSPIs should customize training modules to include basic, intermediate, and advanced stages, allowing farmers to progress based on their specific needs and maximizing returns at each stage. Tailoring these modules can optimize the time farmers dedicate to training, helping them balance learning with productive farming.
While this study assumes unconfoundedness, it is important to acknowledge the potential limitations of this assumption. Despite the inclusion of a rich set of variables—including farm characteristics, farmer demographics, market access, institutional factors, and prior exposure to extension services—there remains the possibility of unobserved confounders that could simultaneously affect both training participation and agricultural outcomes. For instance, intrinsic farmer motivation, risk preferences, or hidden differences in soil quality and farm management practices may influence both the likelihood of receiving LSPI training and the effectiveness of that training. If these factors are not fully captured in the data, they could introduce bias in the estimated treatment effects. To assess the robustness of our findings, future research could explore sensitivity analyses such as Rosenbaum bounds (Rosenbaum, 2002), which test the extent to which hidden bias from unobserved covariates might alter the estimated treatment effects. Additionally, instrumental variable (IV) approaches or difference-in-differences strategies could be explored in subsequent studies to strengthen causal inference.
Data availability statement
The raw data supporting the conclusions of this article will be made available by the authors, without undue reservation.
Ethics statement
The studies involving humans were approved by University for Development Studies IRB. The studies were conducted in accordance with the local legislation and institutional requirements. The participants provided their written informed consent to participate in this study.
Author contributions
A-HA: Conceptualization, Data curation, Formal analysis, Funding acquisition, Investigation, Methodology, Project administration, Resources, Software, Supervision, Validation, Visualization, Writing – original draft, Writing – review & editing.
Funding
The author(s) declare that no financial support was received for the research and/or publication of this article.
Conflict of interest
The author declares that the research was conducted in the absence of any commercial or financial relationships that could be construed as a potential conflict of interest.
Generative AI statement
The author(s) declare that no Gen AI was used in the creation of this manuscript.
Publisher's note
All claims expressed in this article are solely those of the authors and do not necessarily represent those of their affiliated organizations, or those of the publisher, the editors and the reviewers. Any product that may be evaluated in this article, or claim that may be made by its manufacturer, is not guaranteed or endorsed by the publisher.
Footnotes
1. ^Currently, a staggering 900 million people are still suffering from extreme food insecurity, while 2.4 billion people faced moderate or severe food shortages (FAO et al., 2023).
2. ^Information on MSPIs/LSPIs and their investments was obtained from the Land Matrix database (Land Matrix, 2021) and the Ghana's Lands Commission.
3. ^A list of 6,228 exposed farmers (4,124 MSPIs and 2,104 LSPIs) across the 10 districts was obtained from listing exercise with leaders of the selected communities.
4. ^We refer to “exposed” as individuals, communities, or ecosystems whose lives, livelihoods, and environments are subjected to positive or negative impacts of MSPIs or LSPIs' activities. This exposure can come from direct interactions with the MSPIs/LSPIs, such as through land acquisition, employment, or changes in local economies. It may also occur indirectly thorough environmental changes or social disruptions caused by the investments (Abdallah, 2021).
5. ^The Kobo Toolbox is an online open-source suite of tools for field data collection developed by the Harvard Humanitarian Initiative. The Kobo Toolbox was installed in 10 Samsung Galaxy Tablets and questions from the questionnaire were then loaded.
6. ^Our survey revealed Amaranthus, Jute mallow (Corchorus olitorius), Spinach (Spinacia oleracea) sorghum, maize, rice, millet, sorghum cowpeas, groundnuts, cassava and yam as the main crops produced in the area. For animals, poultry, pigs, dogs, sheep, goat and cattle were reared in the area.
7. ^Regarding the prices, we employed the median prices of the prices provided by the farmers to avoid the effect of variations in local prices.
8. ^https://sedac.ciesin.columbia.edu/data/set/ghsl-population-built-up-estimates-degree-urban-smod
9. ^The data is downscaled by the University of East Anglia from CRU-TS-4.06, using WorldClim 2.1 for bias correction (https://www.worldclim.org/data/worldclim21.html).
10. ^https://earthexplorer.usgs.gov/
11. ^https://africafertilizer.org/#/en
12. ^https://data.humdata.org/dataset/wfp-food-prices-for-ghana?force_layout=desktop
References
Abay, A. K., Thomas, W. A., Guush, B., Gashaw, T. A., and Charlotte, H. (2024). Grappling With Compounding Crises in Domestic Fertilizer Markets in Africa: the Case of Ethiopia. International Food Policy Research Institute. Available online at: https://www.ifpri.org/blog/grappling-compounding-crises-domestic-fertilizer-markets-africa-case-ethiopia
Abay, K., Chamberlin, J., Chivenge, P., Hebebrand, C., and J.Spielman, D. (2023). Fertilizer Policies Amid Global Supply and Price Shocks. International Food Policy Research Institute. Available online at: https://www.ifpri.org/blog/fertilizer-policies-amid-global-supply-and-price-shocks
Abdallah, A.-H. (2021). “Food production and food security implications of large-scale land deals: evidence from agricultural households in Northern Ghana [University for Development Studies],” in UDSspace/Theses/Faculty of Agriculture, Food and Consumer Sciences. Available online at: http://hdl.handle.net/123456789/3586 (accessed November 10, 2023).
Abdallah, A.-H., Abdul-Rahaman, A., and Issahaku, G. (2020). Production and hidden hunger impacts of sustainable agricultural practices: evidence from rural households in Africa. Agrekon 59, 440–458. doi: 10.1080/03031853.2020.1855219
Abdallah, A.-H., Michael, A., and Awuni, J. A. (2023). Impact of land grabbing on food security: evidence from Ghana. Environ. Dev. Sustain. 25, 6071–6094. doi: 10.1007/s10668-022-02294-7
ACDI/VOCA (2020). AV Ventures Invests in Warc Group, Linking Smallholder Farmers in Ghana to Regenerative Farming Methodology - ACDI/VOCA. Available online at: https://www.acdivoca.org/2020/12/av-ventures-invests-in-warc-group-linking-smallholder-farmers-in-ghana-to-regenerative-farming-methodology/(accessed October 23, 2024).
Adenaeuer, L., and Heckelei, T. (2011). Foreign direct investment and the performance of european agribusiness firms. J. Agric. Econ. 62, 639–654. doi: 10.1111/j.1477-9552.2011.00300.x
Adzawla, W., Atakora, W. K., Gouzaye, A., and Bindraban, P. S. (2021). Crop Yield and Fertilizer Use Among Farmers in Guinea Savannah and Transitional Zones of Ghana (Issue IFDC FERARI Research Report No. 6).
African Development Bank (2024). Abuja Declaration on Fertilizer for the African Green Revolution. African Development BankGroup. Available online at: https://www.afdb.org/en/topics-and-sectors/initiatives-partnerships/africa-fertilizer-financing-mechanism/about-affm/abuja-declaration (accessed March 19, 2024).
Aha, B., and Ayitey, J. Z. (2017). Biofuels and the hazards of land grabbing: tenure (in)security and indigenous farmers' investment decisions in Ghana. Land Use Policy 60, 48–59. doi: 10.1016/j.landusepol.2016.10.012
Alamirew, B., Grethe, H., Hassan, K., Siddig, A., and Wossen, T. (2015). Do land transfers to international investors contribute to employment generation and local food security? Evidence from Oromia Region, Ethiopia. Int. J. Soc. Econ. 42, 1121–1138. doi: 10.1108/IJSE-02-2014-0037
Ali, D., Deininger, K., and Harris, A. (2019). Does large farm establishment create benefits for neighboring smallholders? Evidence from Ethiopia. Land Econ. 95, 71–90. doi: 10.3368/le.95.1.71
Amanor, K. S. (2012). Global resource grabs, agribusiness concentration and the smallholder: two West African case studies. J. Peasant Stud. 39, 731–749. doi: 10.1080/03066150.2012.676543
Anderson, J. R., and Feder, G. (2004). Agricultural extension: good intentions and hard realities. World Bank Res. Obs. 19, 41–60. doi: 10.1093/wbro/lkh013
Annan, K., and Dryden, S. (2015). Food and the transformation of Africa: getting smallholders connected. Foreign Aff. 94, 124–129.
Ayamga, M., Hanan, A., and Awuni, J. A. (2023). Large-scale land acquisition and farmland access nexus: evidence from agricultural households in northern Ghana. GeoJournal, 88, 3369–3387. doi: 10.1007/s10708-022-10813-2
Baptista, D., Miguel. Salgado, F., Fayad, M., Kemoe, D., Lanci, L., Mitra, L. S., et al. (2022). Climate Change and SSA's Intensified Food Insecurity. Washington, DC: International Monetory Fund. doi: 10.5089/9798400218507.087
Baulch, B., and Quisumbing, A. (2011). Toolkit Note: Testing and Adjusting for Attrition in Household Panel Data, Vol. 1. London: Chronic Poverty Research Center.
Behrman, J. A., Meinzen-Dick, R., and Quisumbing, A. R. (2014). “An interpretation of large-scale land deals using boserup's theories of agricultural intensification, gender and rural development,” in Ester Boserup's Legacy on Sustainability: Orientation for Contemporary Research (4th ed.), eds. M. Fischer-Kowalski, A. Reenberg, A. Schaffartzik, and A. Mayer (SpringerLink.com.: New York), 189–202. doi: 10.1007/978-94-017-8678-2_12
Bia, M., and Mattei, A. (2012). Assessing the effect of the amount of financial aids to piedmont firms using the generalized propensity score. Stat. Methods Appl. 21, 485–516. doi: 10.1007/s10260-012-0193-4
Blomström, M., and Persson, H. (1983). Foreign investment and spillover efficiency in an underdeveloped economy: evidence from the Mexican manufacturing industry. World Dev. 11, 493–501. doi: 10.1016/0305-750X(83)90016-5
Blomström, M., and Sjöholm, F. (1999). Technology transfer and spillovers: does local participation with multinationals matter? Eur. Econ. Rev. 43, 915–923. doi: 10.1016/S0014-2921(98)00104-4
Borensztein, E., De Gregorio, J., and Lee, J. W. (1998). How does foreign direct investment affect economic growth? J. Int. Econ. 45, 115–135. doi: 10.1016/S0022-1996(97)00033-0
Brooks, J., Deconinck, K., and Giner, C. (2019). Three Key Challenges Facing Agriculture and How to Start Solving Them. OECD. Available online at: https://www.oecd.org/agriculture/key-challenges-agriculture-how-solve/ (accessed March 18, 2024).
Cattaneo, M. D., Drukker, D. M., and Holland, A. D. (2013). Estimation of multivalued treatment effects under conditional independence Matias. Stata J. 13, 407–450. doi: 10.1177/1536867X1301300301
Chapoto, A., Houssou, N., Mabiso, A., and Cossar, F. (2014). Medium and large-scale farmers and agricultural mechanization in Ghana: Survey results. Ghana Strategy Support Program. International Food Policy Reserch Institute. Available online at: https://books.google.com/books?hl=en&lr=&id=TfsFBAAAQBAJ&pgis=1 (accessed October 20, 2020).
Clapp, J. (2014). Financialization, distance and global food politics. J. Peasant Stud. 41, 797–814. doi: 10.1080/03066150.2013.875536
Coates, J., Swindale, A., and Bilinsky, P. (2007). Household Food Insecurity Access Scale (HFIAS) for Measurement of Food Access: Indicator Guide (Version 3, Issue August). FHI 360/FANTA. Available online at: https://www.fantaproject.org/monitoring-and-evaluation/household-food-insecurity-access-scale-hfias (accessed August 13, 2017).
Cotula, L. (2012). The international political economy of the global land rush: a critical appraisal of trends, scale, geography and drivers. J. Peasant Stud. 39, 649–680. doi: 10.1080/03066150.2012.674940
Cotula, L., Vermeulen, S., Leonard, R., and Keeley, J. (2009). Land Grab or Development Opportunity? Agricultural Investment and International Land Deals in Africa. London; Rome: IIED/FOA/IFAD.
De Schutter, O. (2009). Large-Scale Land Acquisitions and leases?: a Set of Core Principles and Measures to Address the Human Rights Challenge. Geneva: UN.
Deininger, K., and Byerlee, D. (2012). The rise of large farms in land abundant countries: do they have a future? World Dev. 40, 701–714. doi: 10.1016/j.worlddev.2011.04.030
Deininger, K., and Xia, F. (2016). Quantifying spillover effects from large land-based investment: the case of mozambique. World Dev. 87, 227–241. doi: 10.1016/j.worlddev.2016.06.016
Dessy, S., Gohou, G., and Vencatachellum, D. (2012). Foreign Direct Investments in Africa's Farmlands: Threat or Opportunity for Local Populations? (No. 12; 03). Available online at: https://ssrn.com/abstract=1991290 (accessed June 15, 2018).
Dury, S., Bendjebbar, P., Hainzelin, E., Giordano, T., and Bricas, N. (2019). Food Systems at Risk: New Trends and Challenges. Rome: FAO, CIRAD and European Commission. doi: 10.19182/agritrop/00080
FAO FAD, UNCTAD, and World Bank. (2010). Principles for Responsible Agricultural Investment that Respects Rights, Livelihoods, and Resources. In UNPRI Report, Washington, DC.
FAO IFAD, UNICEF, WFP, and WHO.. (2023). “The state of food security and nutrition in the world 2023: transformation and healthy diets urbanization, agrifood systems across the rural-urban continuum,” in The State of Food Security and Nutrition in the World 2023 (Rome). doi: 10.4060/cc3017en
Fischer, G., Nachtergaele, F., Velthuizen, H., van Chiozza, F., Franceschini, G., Henry, M., et al. (2021). Global Agro-Ecological Zones v4 (GAEZ v4) – Model Documentation (V4 ed.). Rome: FAO. doi: 10.4060/cb4744en
FOE (2010). Africa: up for Grabs, The Scale and Impact of Land Grabbing for Agrofuels, Gombe State. Friends of the Earth Africa/Europe, 3–28.
Garnett, T., Appleby, M. C., Balmford, A., Bateman, I. J., Benton, T. G., Bloomer, P., et al. (2013). Sustainable intensification in agriculture: premises and policies. Science 341, 33–34. doi: 10.1126/science.1234485
Globerman, S. (1979). Foreign direct investment and “spillover” efficiency benefits in canadian manufacturing industries. Can. J. Econ. 12:42. doi: 10.2307/134570
GRAIN (2008). Seized! The 2008 land grab for food and financial security, 1–11. Available online at: http://www.grain.org/go/landgrab; http://www.grain.org/go/landgrab
Guardabascio, B., and Ventura, M. (2014). Estimating the dose-response function through a generalized linear model approach. Stata J. 14, 141–158.
Guyalo, A. K., Alemu, E. A., and Degaga, D. T. (2021). Impact of large-scale agricultural investment on the livelihood assets of local community in Gambella region, Ethiopia. Int. J. Soc. Econ. 48, 363–383. doi: 10.1108/IJSE-09-2020-0610
Guyalo, A. K., Alemu, E. A., and Degaga, D. T. (2022). Employment effect of large-scale agricultural investment on women empowerment in Gambella Region, Ethiopia. Int. J. Soc. Econ. 49, 612–628. doi: 10.1108/IJSE-08-2021-0448
Hamenoo, S. V. Q., Adjei, P. O.-W., and Obodai, J. (2018). Households' coping dynamics in response to large-scale land acquisition for jatropha plantations: evidence from asante akim north district of Ghana. Glob. Soc. Welfare Res. Policy Pract. 5, 225–241. doi: 10.1007/s40609-017-0101-9
Hirano, K., and Imbens, G. W. (2004). “The propensity score with continuous treatments,” in Applied Bayesian Modeling and Causal Inference from Incomplete-Data Perspectives, eds. A. Gelman and X.-L. Meng (West Sussex, England: Wiley InterScience), 73–84. doi: 10.1002/0470090456.ch7
IWAD (2024). Nucleus Farm Overview. IWADGHANA. Available online at: https://iwadghana.com/nucleus-farm-overview/ (accessed August 22, 2024).
Khadjavi, M., Sipangule, K., and Thiele, R. (2020). Social capital and large-scale agricultural investments: an experimental investigation. Econ. J. 131, 420–449. doi: 10.1093/ej/ueaa050
Kim, J., Mason, N. M., Snapp, S., and Wu, F. (2019). Does sustainable intensification of maize production enhance child nutrition? Evidence from rural Tanzania. Agric. Econ. 50, 723–734. doi: 10.1111/agec.12520
Kleemann, L., and Thiele, R. (2015). Rural welfare implications of large-scale land acquisitions in Africa: a theoretical framework. Econ. Model. 51, 269–279. doi: 10.1016/j.econmod.2015.08.016
Land Matrix (2021). Deals | Land Matrix - An Online Public Database of Large-Scale Land Deals. Land Matrix. Available online at: https://landmatrix.org/list/deals (accessed December 12, 2021).
Lay, J., Nolte, K., and Sipangule, K. (2021). Large-scale farms in Zambia: locational patterns and spillovers to smallholder agriculture. World Dev. 140:105277. doi: 10.1016/j.worlddev.2020.105277
Liverpool-Tasie, L. S. O., Nuhu, A. S., Awokuse, T., Jayne, T., and Muyanga, M. (2020). Spillover Effects of Medium-Scale Farms on Smallholder Behaviour and Welfare: Evidence From Nigeria (WP 38). Brighton: Agricultural Policy Research in Africa (APRA).
Liverpool-Tasie, L. S. O., Salim, A. N., Awokuse, T., Jayne, T., Muyanga, M., Aromolaran, A., et al. (2023). Can medium-scale farms support smallholder commercialisation and improve welfare? Evidence from Nigeria. J. Agric. Econ. 74, 48–74. doi: 10.1111/1477-9552.12487
Mabe, F. N., Nashiru, S., Mummuni, E., and Boateng, V. F. (2019). The nexus between land acquisition and household livelihoods in the Northern region of Ghana. Land Use Policy 85, 357–367. doi: 10.1016/j.landusepol.2019.03.043
Mohammed, S., and Abdulai, A. (2022). Impacts of extension dissemination and technology adoption on farmers' efficiency and welfare in Ghana: evidence from legume inoculant technology. Front. Sustain. Food Syst. 6:1025225. doi: 10.3389/fsufs.2022.1025225
Mugizi, F. M. P. (2025). Extension advice, agricultural productivity, and food security in Tanzania. Food Energy Secur. 14:e70047. doi: 10.1002/fes3.70047
Mulwa, C. K., Muyanga, M., and Visser, M. (2021). The role of large traders in driving sustainable agricultural intensification in smallholder farms: evidence from Kenya. Agric. Econ. 52, 329–341. doi: 10.1111/agec.12621
Muyanga, M., Aromolaran, A. B., Jayne, T. S., Liverpool-Tasie, S., Awokuse, T., Adelaja, A., et al. (2022). Changing Farm Structure and Agricultural Commercialisation: Implications for Livelihood Improvements among Small-Scale Farmers in Nigeria (WP 93). Brighton: Agricultural Policy Research in Africa (APRA). doi: 10.19088/APRA.2022.034
Nyantakyi-Frimpong, H., and Kerr, R. B. (2016). Land grabbing, social differentiation, intensified migration and food security in northern Ghana. J. Peasant Stud. 44, 421–444. doi: 10.1080/03066150.2016.1228629
Pan, Y., Smith, S. C., and Sulaiman, M. (2018). Agricultural extension and technology adoption for food security: evidence from Uganda. Am. J. Agric. Econ. 100, 1012–1031. doi: 10.1093/ajae/aay012
Ragasa, C., Berhane, G., Tadesse, F., and Taffesse, A. S. (2013). Gender differences in access to extension services and agricultural productivity. J. Agric. Educ. Ext. 19, 437–468. doi: 10.1080/1389224X.2013.817343
Rosenbaum, P. R. (2002). “Sensitivity to Hidden Bias” in Observational Studies, Springer Series in Statistics (New York, NY: Springer). doi: 10.1007/978-1-4757-3692-2_4
Santangelo, G. D. (2018). The impact of FDI in land in agriculture in developing countries on host country food security. J. World Bus. 53, 75–84. doi: 10.1016/j.jwb.2017.07.006
Santos Rocha, J. (2017). Agricultural extension, technology adoption and household food security: evidence from DRC. Agric. Ext. Technol. Adopt. Househ. Food Secur. Evid. from DRC 202:231.
Shete, M., and Rutten, M. (2015). Impacts of large-scale farming on local communities ' food security and income levels – empirical evidence from Oromia Region, Ethiopia. Land Use Policy 47, 282–292. doi: 10.1016/j.landusepol.2015.01.034
Sitko, N. J., Burke, W. J., and Jayne, T. S. (2018). The quiet rise of large-scale trading firms in East and Southern Africa. J. Dev. Stud. 54, 895–914. doi: 10.1080/00220388.2018.1430773
UN (2024). Population | United Nations. Global Issues. Available online at: https://www.un.org/en/global-issues/population (accessed March 09, 2024).
von Braun, J., and Meinzen-Dick, R. (2009). “Land Grabbing” by foreign investors in developing countries: risks and opportunities. IFPRI Pol. Brief 13, 1–4. Available online at: https://hdl.handle.net/10568/161806 (accessed August 1, 2019).
WFP (2009). Emergency Food Security Assessment Handbook. WFP, Rome, 296. Available online at: https://doi.org/http://www.wfp.org/content/emergency-food-security-assessment-handbook
World Bank. (2024). Agriculture Overview: Development News, Research, Data. World Bank. Available online at: https://www.worldbank.org/en/topic/agriculture/overview (accessed October 27, 2024).
Wossen, T., Abdoulaye, T., Alene, A., Haile, M. G., Feleke, S., Olanrewaju, A., et al. (2017). Impacts of extension access and cooperative membership on technology adoption and household welfare. J. Rural Stud. 54, 223–233. doi: 10.1016/j.jrurstud.2017.06.022
Yaro, J. A., and Wahab, I. (2021). Rising Farm Sizes in the Fumbisi Valley of Northern Ghana. Future Agricultures. Available online at: https://www.future-agricultures.org/blog/rising-farm-sizes-in-the-fumbisi-valley-of-northern-ghana/ (accessed February 22, 2021).
Yaro, J. A., Wahab, I., Afful-Mensah, G., Awenam, M., and Ben. (2021). The Rise of Medium-Scale Farms in the Northern Savannah of Ghana: Farmland Invasion or an Inclusive Commercialised Agricultural Revolution? (APRA Working Paper 70; Issue September). doi: 10.19088/APRA.2021.029
Appendix
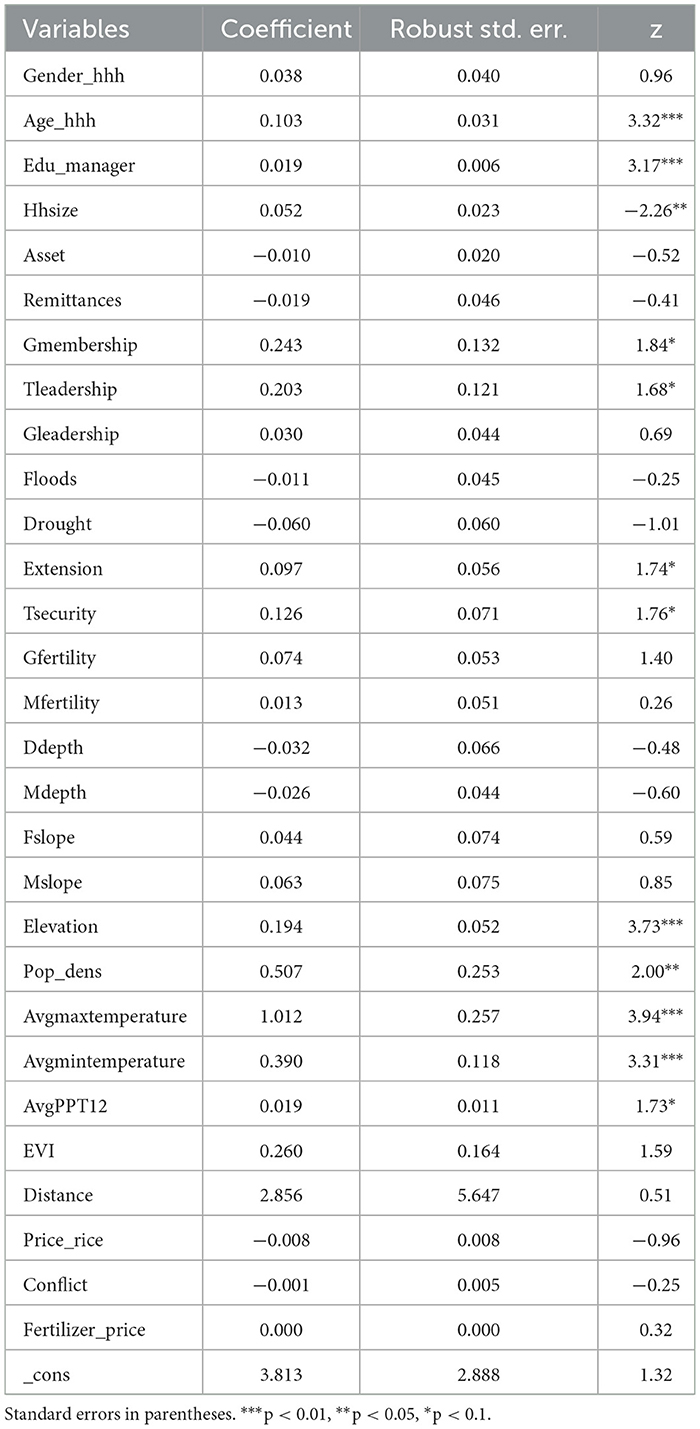
Table A1. Estimate of the generalized propensity score (GPS).
Keywords: agricultural investments, fertilizer use, rice farmers, training, Northern Ghana
Citation: Abdallah A-H (2025) Large-scale private investors, yield, farm income and food security in Ghana: evidence from continuous treatment approach. Front. Environ. Econ. 4:1552040. doi: 10.3389/frevc.2025.1552040
Received: 06 January 2025; Accepted: 03 April 2025;
Published: 01 May 2025.
Edited by:
Ji Lu, Dalhousie University, CanadaReviewed by:
Elisa Ticci, University of Siena, ItalyPrabodh Illukpitiya, Tennessee State University, United States
Copyright © 2025 Abdallah. This is an open-access article distributed under the terms of the Creative Commons Attribution License (CC BY). The use, distribution or reproduction in other forums is permitted, provided the original author(s) and the copyright owner(s) are credited and that the original publication in this journal is cited, in accordance with accepted academic practice. No use, distribution or reproduction is permitted which does not comply with these terms.
*Correspondence: Abdul-Hanan Abdallah, YWJkYWxsYWhhYmR1bGhhbmFuQGdtYWlsLmNvbQ==